Article

Synthesis, Property Characterization and Photocatalytic Activity of the Ag3PO4/Gd2BiTaO7 Heterojunction Catalyst under Visible Light Irradiation

1
School of Physics, Changchun Normal University, Changchun 130032, China
2
State Key Laboratory of Pollution Control and Resource Reuse, School of the Environment, Nanjing University, Nanjing 210093, China
*
Author to whom correspondence should be addressed.
Catalysts 2022, 12(1), 22; https://doi.org/10.3390/catal12010022
Submission received: 5 November 2021 / Revised: 16 December 2021 / Accepted: 22 December 2021 / Published: 25 December 2021

Abstract

:
A new type of Gd2BiTaO7 nanocatalyst (GBT) was synthesized by a high-temperature solid-phase method, and a heterojunction photocatalyst, which was composed of GBT and silver phosphate (AP), was prepared by the facile in-situ precipitation method for the first time. The photocatalytic property of GBT or the Ag3PO4/Gd2BiTaO7 heterojunction photocatalyst (AGHP) was reported. The structural properties of GBT and AGHP were characterized by an X-ray diffractometer, scanning electron microscope–X-ray energy dispersive spectra, an X-ray photoelectron spectrograph, a synchrotron-based ultraviolet photoelectron spectroscope, a Fourier transform infrared spectrometer, an UV-Vis diffuse reflectance spectrophotometer and an electron paramagnetic resonance spectrometer. The results displayed that GBT was well crystallized with a stable cubic crystal system and space group Fd3m. The lattice parameter or band gap energy of GBT was found to be a = 10.740051 Å or 2.35 eV, respectively. After visible light irradiation of 30 min, the removal rate of bisphenol A (BPA) reached 99.52%, 95.53% or 37.00% with AGHP as the photocatalyst, with Ag3PO4 and potassium persulfate (AP-PS) as photocatalysts or with N-doped TiO2 (NT) as a photocatalyst, respectively. According to the experimental data, it could be found that the removal rate of BPA with AGHP as a photocatalyst was 2.69 times higher than that with NT as a photocatalyst. AGHP showed higher photocatalytic activity for photocatalytic degradation of BPA under visible light irradiation compared with GBT or AP-PS or NT. The removal rate of total organic carbon (TOC) was 96.21%, 88.10% or 30.55% with AGHP as a photocatalyst, with AP-PS as photocatalysts or with NT as a photocatalyst after visible light irradiation of 30 min. The above results indicated that AGHP possessed the maximal mineralization percentage ratio during the process of degrading BPA compared with GBT or AP-PS or NT. The results indicated that the main oxidation radical was OH during the process of degrading BPA. The photocatalytic degradation of BPA with AGHP as a photocatalyst conformed to the first-order reaction kinetics. This study provided inspiration for obtaining visible light-responsive heterojunction photocatalysts with high catalytic activity and efficient removal technologies for organic pollutants and toxic pollutants, and as a result, the potential practical applications of visible light-responsive heterojunction photocatalysts were widened. The subsequent research of thin-film plating of the heterojunction catalysts and the construction of complete photoluminescent thin-film catalytic reaction systems, which utilized visible light irradiation, could provide new technologies and perspectives for the pharmaceutical wastewater treatment industry.

1. Introduction

The treatment of toxic and refractory organic pollutants in water has always been a difficult hot spot in the field of water treatment. The residues of the treatment for toxic and refractory organic pollutants in the environment has had a certain degree of persistence, and even if they contained very low concentrations, they might be extremely toxic. Bisphenol A (BPA) was 4-dihydroxydiphenylpropane (C15H16O2) [1], which was mainly utilized in the organic synthesis of manifold polymer materials such as polycarbonate, epoxy resin, polyphenylene ether resin and unsaturated polyester resin. BPA was also widely utilized in the production of polyvinyl chloride heat stabilizers, rubber antioxidants, agricultural pesticides, plasticizers, antioxidants, coatings and other fine chemical products, as well as building materials floors, food packaging materials, tooth sealants and fungicides. BPA was a phenol representative environmental pollutant in the class of compounds. In the process of production or usage or related waste disposal, BPA was released into the environment; moreover, the human body ingested BPA by means of diet, breathing or direct contact. In 1993, Krishnan discovered that BPA had estrogenic activity and could interfere with the body’s endocrine system [2]. Existing studies had confirmed that it could have an adverse effect on the reproductive system of gastropod males when the concentration of BPA in the water body reached 1 μg/L. Thus, a method to efficiently degrade BPA needed to be resolved urgently [1,2,3].
Photocatalysis technology had the advantages of environmental protection, high treatment efficiency and low cost [4,5]. Photocatalysis technology used sunlight as an energy source for activating photocatalysts, which could produce oxidation groups under light irradiation and effectively remove organic pollutants and be utilized circularly. The research work of photocatalysis technology was of great importance in the future because it was scientifically attractive due to its high efficiency, energy saving and pollution-free characteristics. The crux of photocatalytic technology was the development of highly efficient photocatalysts [3,4,5,6,7,8]. In accordance with previous reports, many metal oxides such as TiO2 and ZnO2 [9,10] had been developed as photocatalysts. Because single photocatalysts had some inherent characteristics, such as photo-etching and wide band gaps, their applications were limited [11,12]. It was important for improving the photocatalytic property of photocatalysts [13,14,15,16]. Many methods have been proven to be effective, such as ion doping methods, the construction of heterojunctions [17,18,19,20,21,22] and photosensitization [23,24]. Among these methods, the construction of composite materials was an active research area in the field of photocatalysts [21,22,23,24,25,26,27]. A composite photocatalyst concentrated the effects of a single photocatalyst, which endowed the composite system with higher light utilization efficiency [28,29,30,31,32], longer carrier life, higher photocatalytic property and higher chemical stability [33,34,35,36,37,38,39].
Several scientists [40,41,42,43] have shown that the use of nitrogen-doped titanium dioxide for degrading other pollutants under visible light irradiation (VLI) was also effective. For instance, some photocatalytic experiments [40,41,42,43] had confirmed that nitrogen-doped titanium dioxide was effective for removing spiramycin in pharmaceutical wastewater (PW), removing methylene blue or removing oxalic acid [44,45,46,47]. The above research provided us with inspiration for designing visible light response photocatalysts with high catalytic activity.
Fortunately, A2B2O7 compounds were often considered to possess photocatalytic properties under VLI. In our previous work [48], we had found that Bi2InTaO7 was crystallized with the pyrochlore-type structure and acted as a photocatalyst under VLI and seemed to have potential in the improvement of photocatalytic activity upon modification of its structure. In accordance with the above analysis, we could assume that substitution of Bi3+ by Gd3+, and substitution of In3+ by Bi3+ in Bi2InTaO7 might increase the carriers’ concentration. As a result, a change and improvement of the electrical transportation and photophysical properties could be found in the novel Gd2BiTaO7 (GBT) compound, which might possess advanced photocatalytic properties.
In photocatalysis, the Z-scheme heterojunction catalysts had excellent properties which were not found in ordinary photocatalysts and common type II catalysts [49,50,51]. The Z-scheme heterojunction greatly improved the redox property and electron transport rate of the catalyst by generating effective electron–hole recombination within the two semiconductors [52]. Li et al. [53,54,55,56] discovered and prepared a series of doped perovskite catalysts with excellent low-temperature redox properties, such as direct Z-scheme LaFe1−xMnxO3/ATP and indirect Z-scheme LaCoO3/RGO/ATP. Subsequently, these catalysts were applied to photo-SCR, light nitrogen and other fields, and as a result, these catalysts showed excellent activity. Luo et al. [57] also rationally constructed a direct Z-scheme LaMnO3/g-C3N4 hybrid for improving the photocatalytic degradation efficiency of tetracycline under VLI. The above findings confirmed that the construction of the photocatalyst with the Z-scheme could significantly improve the redox property of the photocatalyst [58] and enhance the overall selectivity and activity of the reaction. In summary, the construction of the catalyst with the Z-scheme was a promising application direction.
In this paper, an X-ray diffractometer, scanning electron microscope–X-ray energy dispersive spectra (SEM-EDS), X-ray photoelectron spectrograph (XPS), synchrotron-based ultraviolet photoelectron spectroscope (UPS), Fourier transform infrared spectrometer (FT-IR), UV-Vis diffuse reflectance spectrophotometer (DRS) and electron paramagnetic resonance spectrometer (EPR) were used for analyzing the structural properties of pure-phase Ag3PO4 (AP) and single-phase GBT prepared by the kinetic control method and the high-temperature solid-phase sintering method. Moreover, the removal rate of BPA under VLI with pure-phase Ag3PO4 and potassium persulfate (AP-PS) as photocatalysts or with a Ag3PO4/Gd2BiTaO7 heterojunction photocatalyst (AGHP) as a photocatalyst was detected. In this study, our purpose was to prepare novel heterojunction photocatalysts that could remove BPA within pharmaceutic wastewater under VLI. The innovative research content of our work was that a new type of Gd2BiTaO7 nanocatalyst (GBT) was synthesized by the high-temperature solid-phase method and AGHP was prepared by the facile in-situ precipitation method for the first time. Furthermore, our aim was to obtain a visible light-responsive photocatalyst that could remove BPA effectively. The removal of organic pollutants within pharmaceutic wastewater with AGHP as a photocatalyst was more efficient and safe.

2. Result and Discussion
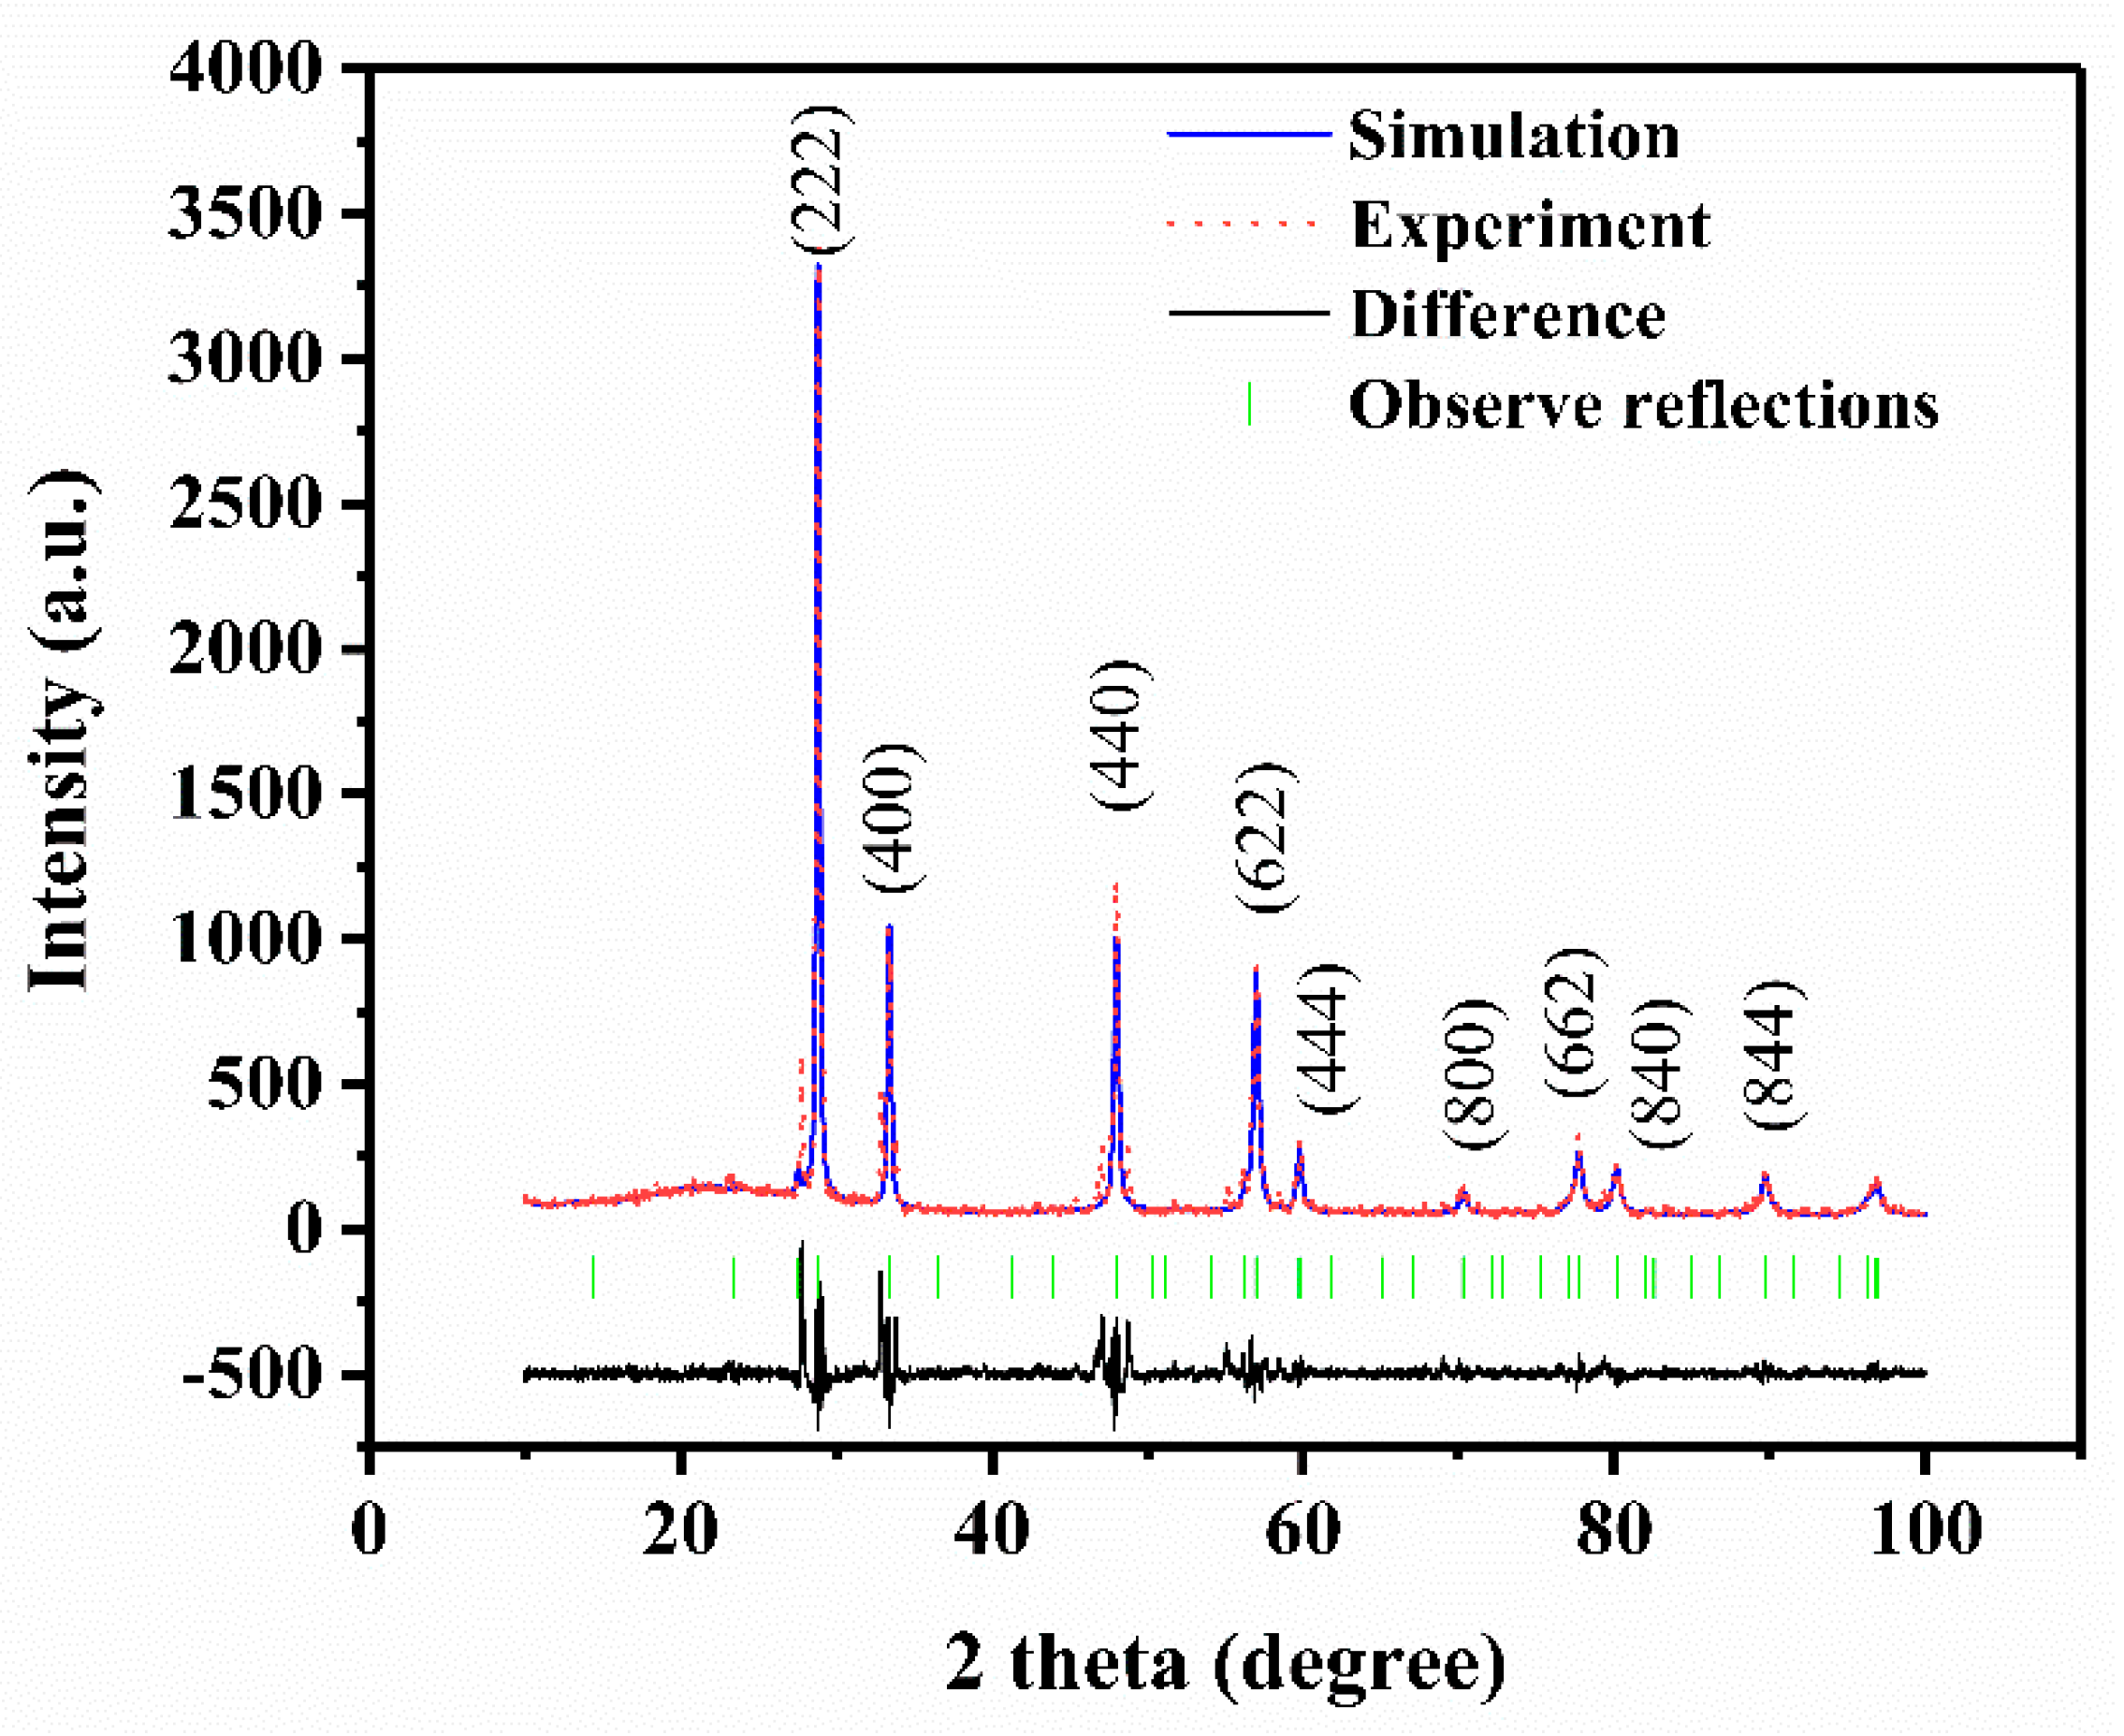
2.1. XRD Analysis

The structure with full-profile refinements of the as-prepared product GBT was examined by the X-ray diffraction technique and the results were shown in Figure 1. The collected data were obtained by the Materials Studio program, which was based on Rietveld analysis. According to Figure 1, it could be concluded that GBT was single phase and the lattice parameter of the new photocatalyst GBT was 10.740051 Å. Simultaneously, the final refinement for GBT showed good agreement between the observed and calculated intensities for the pyrochlore-type structure, a cubic crystal system and a space group Fd3m (O atoms were included in the model). In addition (Moreover), all of the diffraction peaks for GBT could be indexed successfully according to the lattice constant and above space group. Table 1 shows the atomic coordinates and structural parameters of GBT. Figure S1 shows the atomic structure of GBT. As could be seen from Figure 1, it could be concluded that GBT crystallized into a pyrochlore-type structure. The results of full-profile structure refinements for GBT generated the unweighted R factors, RP = 13.01% with the space group Fd3m.
All of the reflection peaks of GBT could be successfully indexed according to the lattice parameter and the space group. It was known that the x coordinate of the O(1) atom could be considered to be an index of the change of the crystal structure on the pyrochlore-type A2B2O7 compounds (Cubic, space group Fd3m) and was equal to 0.375 when the six A-O(1) bond lengths were the same as that of the two A-O(2) bond lengths [59]. Therefore, information on the distortion of the MO6 (M = Bi3+ and Ta5+) octahedra could be gained from the x value [59]. The x value was shifted off x = 0.375 [59], thus the distortion of the MO6 (M = Bi3+ and Ta5+) octahedra existed clearly in the crystal structure of GBT. Charge separation was required for photocatalytic degradation of BPA (PDB) under VLI for the sake of preventing recombination of the photoinduced electrons and photoinduced holes. Inoue [60] and Kudo [61] had pointed out that the local distortion of the MO6 octahedra, which derived from certain photocatalysts such as BaTi4O9 and Sr2M207(M = Nb5+ and Ta5+), was important for preventing the charge recombination and contributed to the improvement of the photocatalytic activity. Thus, the distortion of the MO6 (M = Bi3+ and Ta5+) octahedra in the crystal structure of GBT could also be considered to be useful for enhancing the photocatalytic activity. GBT consisted of a three-dimensional network structure of corner-sharing MO6 (M = Bi3+ and Ta5+) octahedra. The MO6 (M = Bi3+ and Ta5+) octahedra were connected to form chains by Gd3+ ion. Two kinds of Gd-O bond lengths existed: The six Gd-O(1) bond lengths (2.748 Å) were clearly longer than that of the two Gd-O(2) bond lengths (2.325 Å). The six M-O(1) (M= Bi3+ and Ta5+) bond lengths were 2.023 Å and the M-Gd (M= Bi3+ and Ta5+) bond lengths were 3.797 Å. The M-O-M (M = Bi3+ and Ta5+) bond angles were 139.624° in the crystal structure of GBT. The Gd-M-Gd (M = Bi3+ and Ta5+) bond angles were 135° in the crystal structure of GBT. The Gd-M-O (M = Bi3+ and Ta5+) bond angles were 131.580° in the crystal structure of GBT. The study on the luminescent properties had concluded that the closer the M-O-M bond angle was to 180°, the more the excited state was delocalized [59]. It showed that the angles between the corner-sharing MO6 (M = Bi3+ and Ta5+) octahedra, for example, the M-O-M bond angles for GBT, were important for affecting the photocatalytic activity of GBT. The closer the M-O-M bond angles were to 180°, the larger the mobilities of the photoinduced electrons and photoinduced holes were [59]. The mobilities of the photoinduced electrons and photoinduced holes affected the photocatalytic activity because they affected the probability of electrons and holes of reaching reaction sites on the catalyst surface [59].
In addition, the Ta–O–Ta bond angle of GBT was larger, which resulted in an increase in the photocatalytic activity of GBT. As for GBT, Gd was a 5d-block rare earth metal element, Bi was a 6p-block metal element and Ta was a 5d-block metal element. According to the above analysis, the effect of degrading bisphenol A (BPA) under VLI with GBT as photocatalyst could be attributed mainly to the crystalline structure and electronic structure.

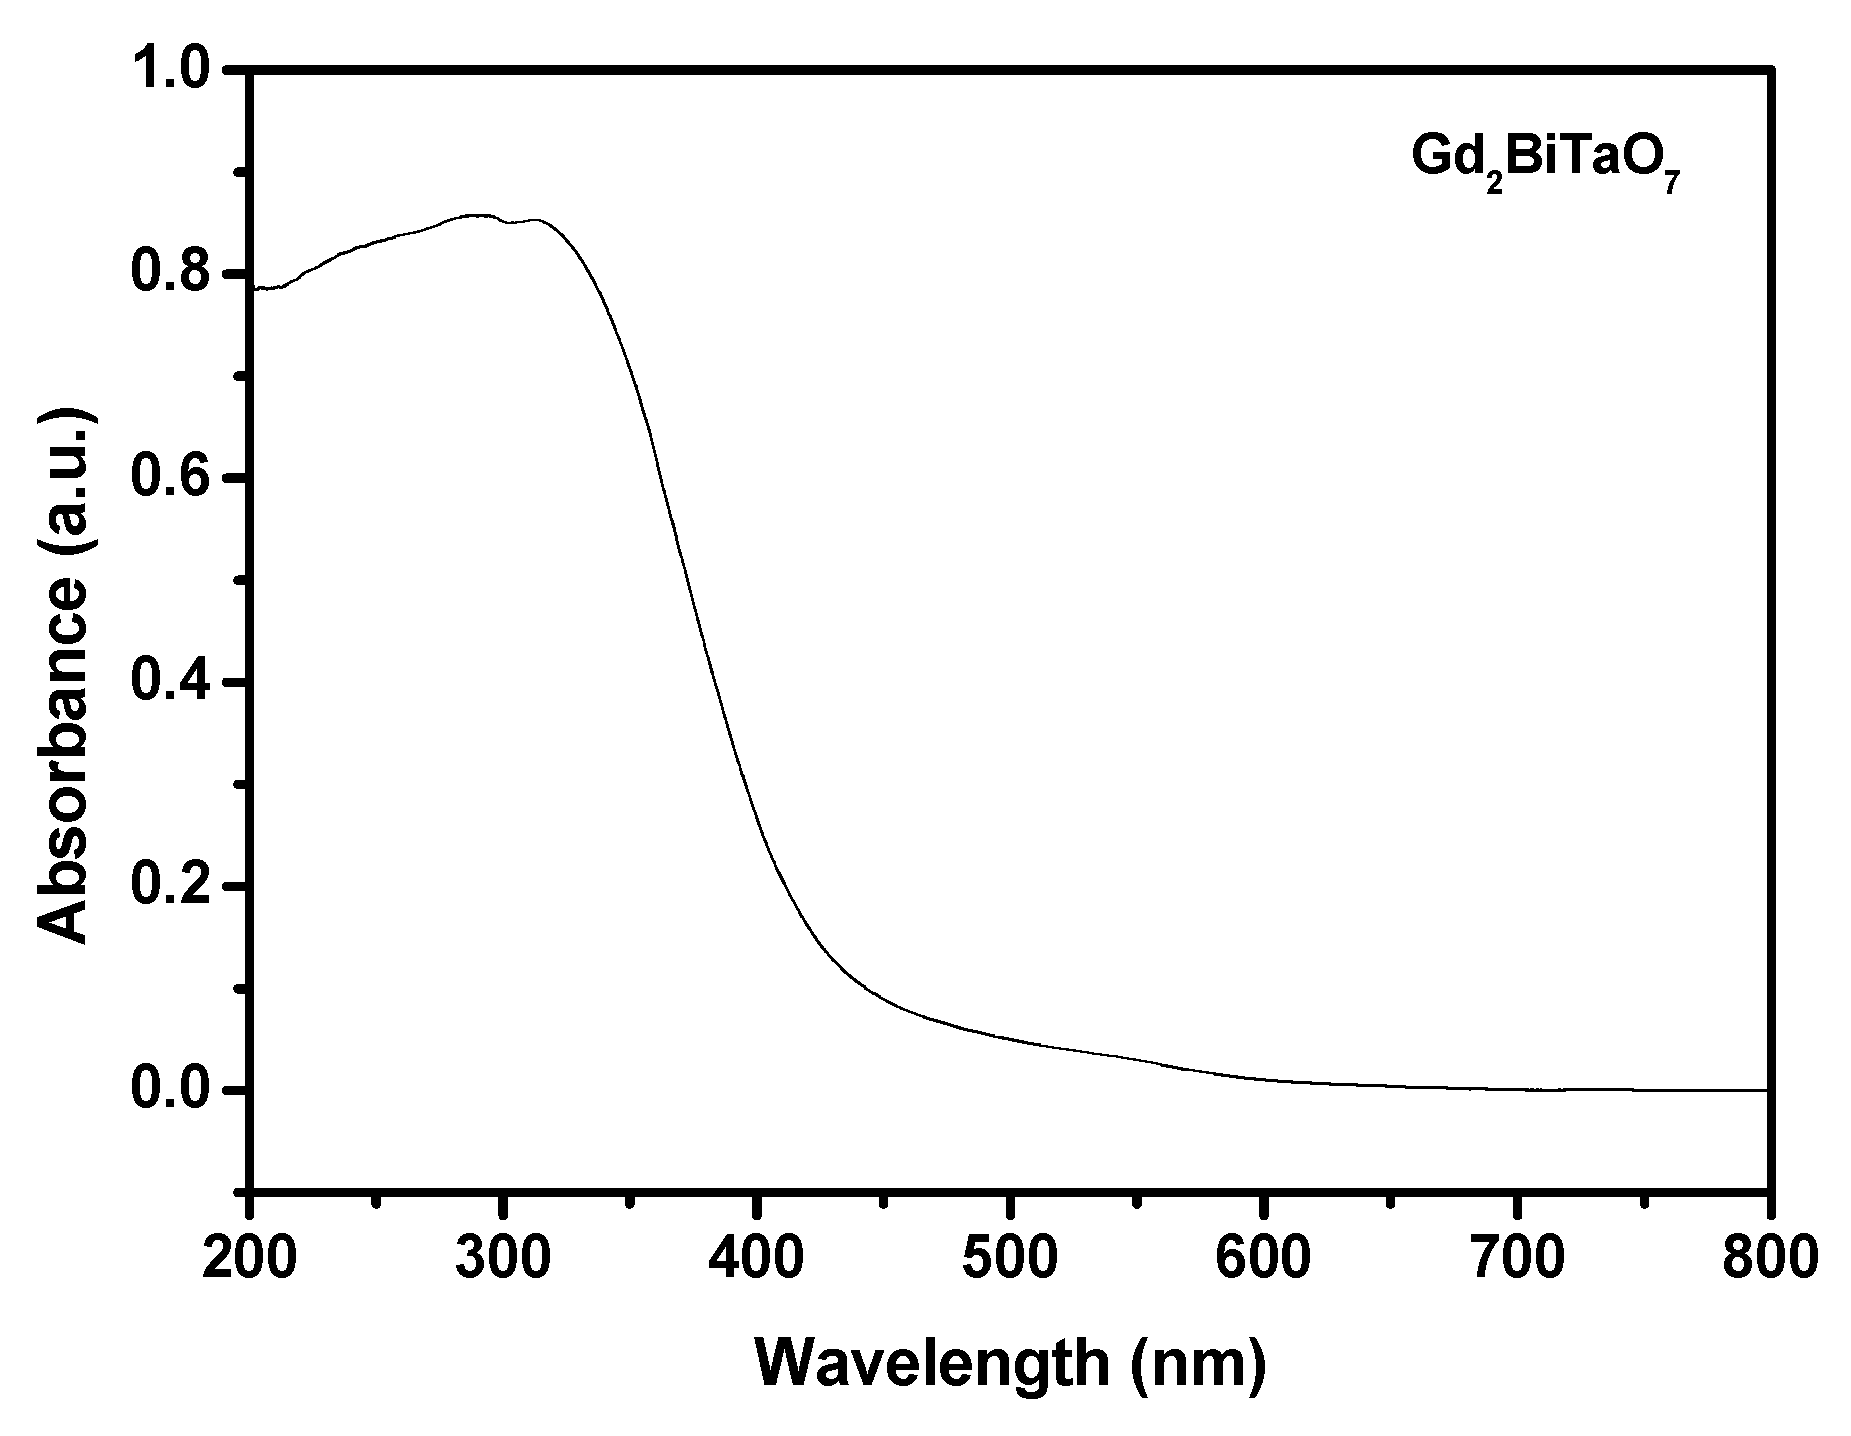
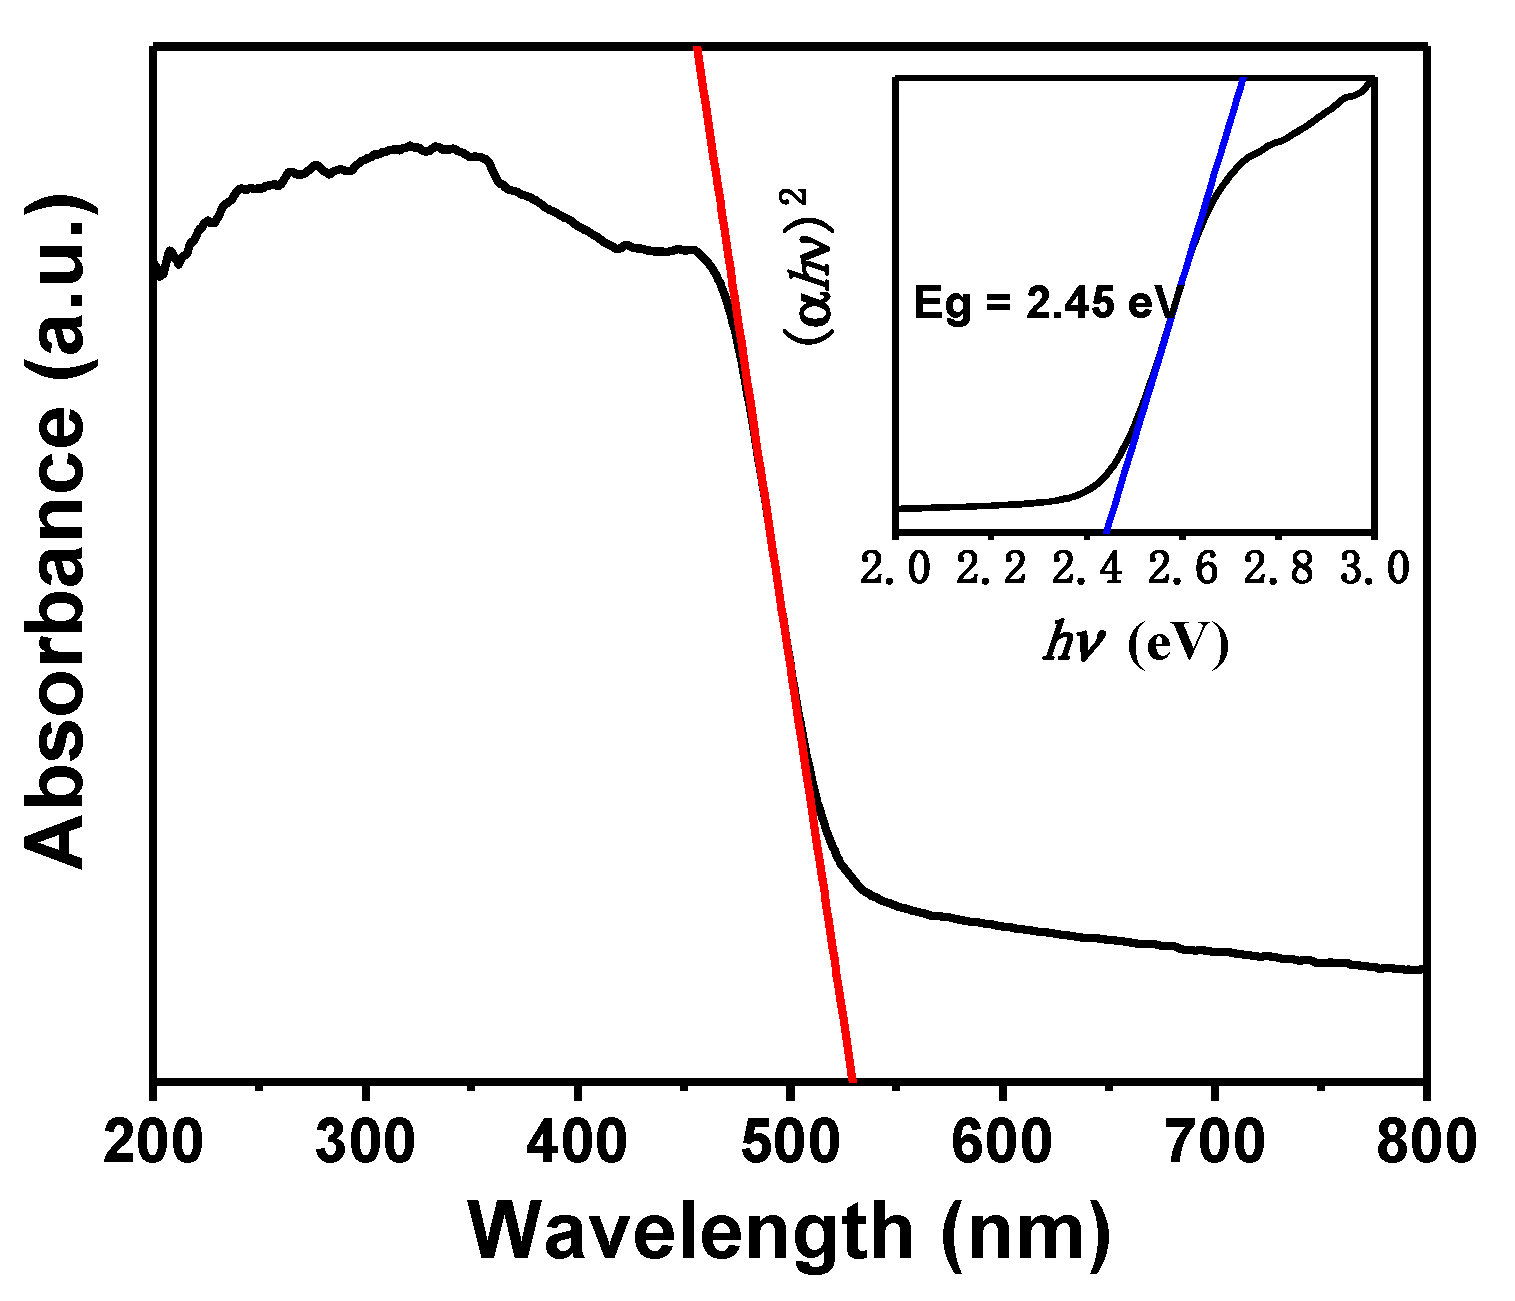
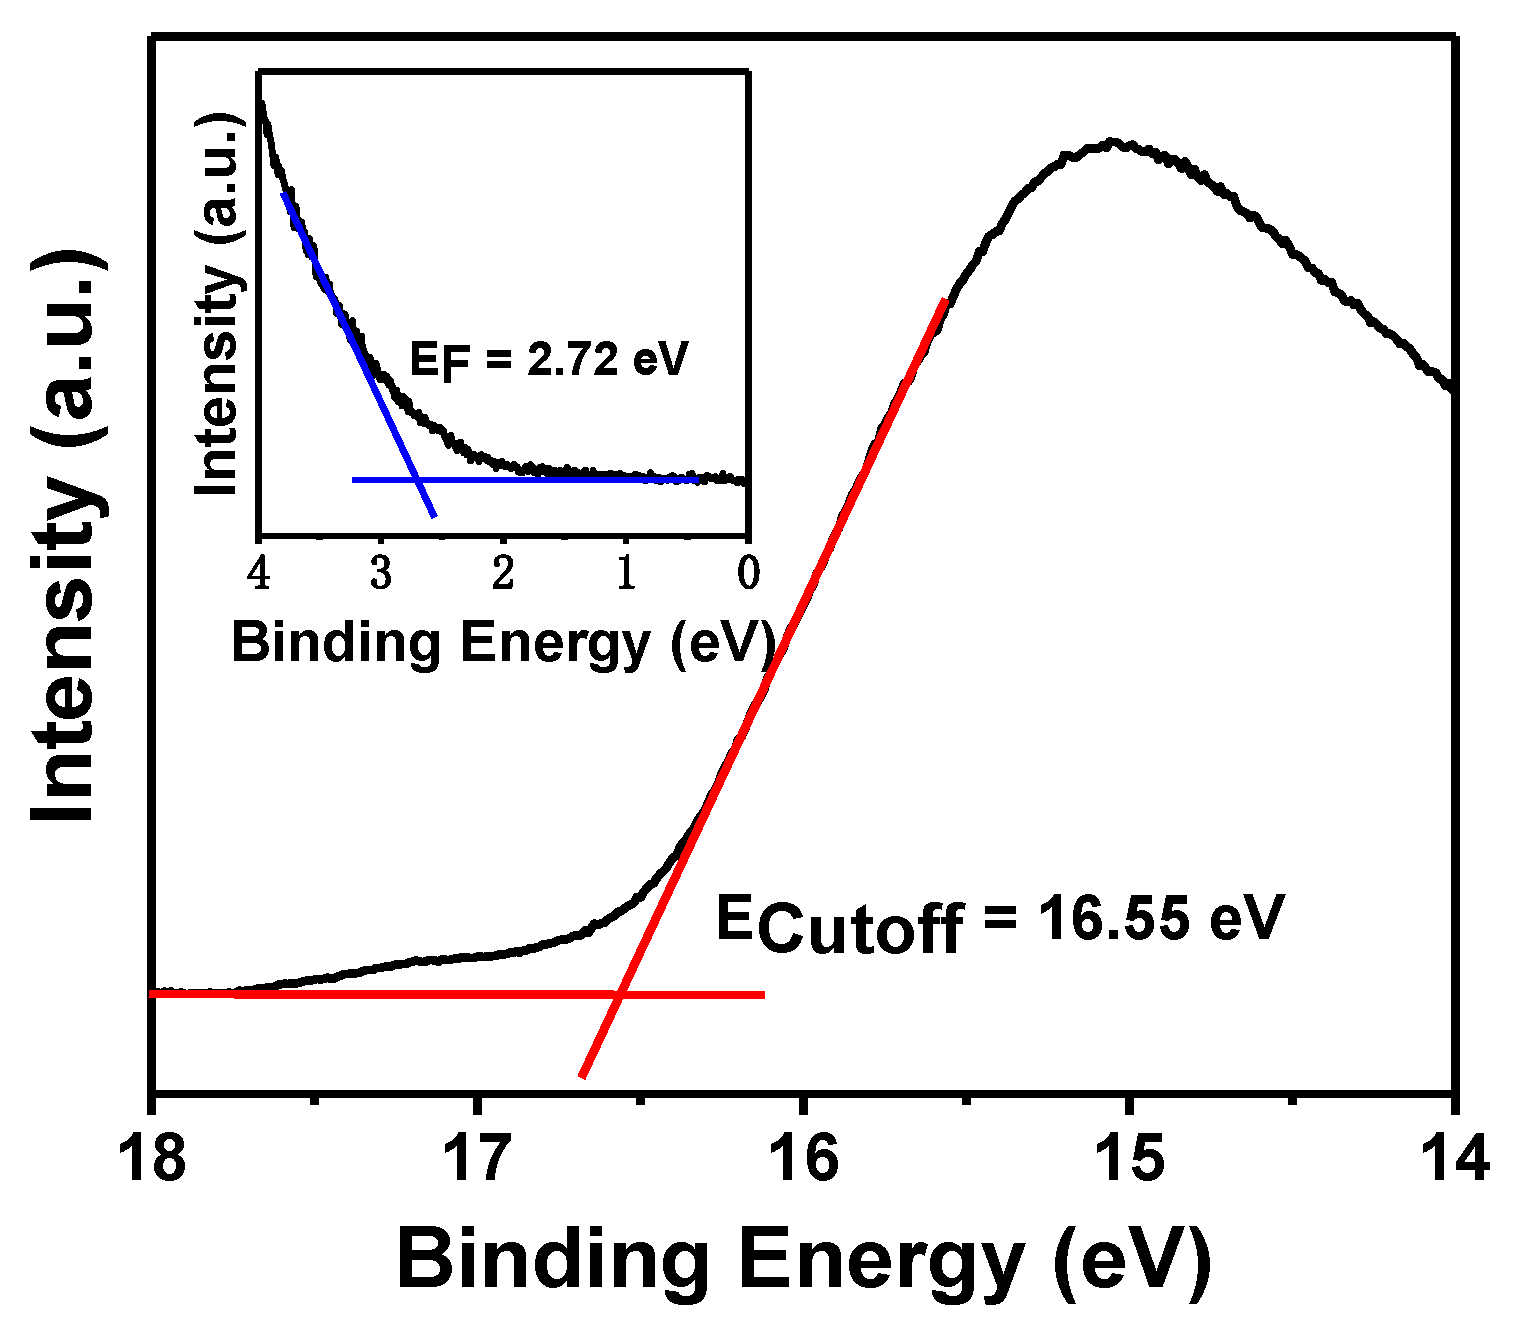
2.2. UV-Vis Diffuse Reflectance Spectra

The absorption spectra of GBT sample are listed in Figure 2 and Figure S2. The absorption edge of this new photocatalyst GBT was found to be at 528 nm, which was in the visible region of the spectrum.
The band gap energies of the crystalline semiconductors could be determined by the intersection point between the photon energy axis and the line extrapolated from the linear portion of the absorption edge of so-called Kubelka–Munk function (known as the re-emission function) [62,63].
[ 1 R d ( h ν ) ] 2 2 R d ( h ν ) = α ( h ν ) S
where S is the scattering factor, Rd is the diffuse reflectance and α represents the absorption coefficient of radiation.
The optical absorption near the band edge of the crystalline semiconductors obeyed the equation [64,65]:
α = A (Eg)n
here, A, α, Eg and ν represent the proportional constant, absorption coefficient, band gap and light frequency, respectively. Within this equation, n determined the character of the transition in a semiconductor. Eg and n could be calculated by the following steps: (1) Plotting ln(α) versus ln(Eg) assuming an approximate value of Eg, (2) deducing the value of n in accordance with the slope in this graph, (iii) refining the value of Eg by plotting (α) 1/n versus and extrapolating the plot to (α) 1/n = 0. In accordance with the above method, the values of Eg for GBT were calculated to be 2.35 eV, respectively. The estimated value of n was approximately 2 and the optical transition for these photocatalysts was allowed indirectly.
The band gap energy of GBT was 2.35 eV, the band gap energy of Bi3O5I2 was 2.02 eV [66] and the band gap energy of Co-doped ZnO was 2.39 eV [67]. The band gap energies of GBT or Bi3O5I2 or Co-doped ZnO were all less than 2.40 eV, which meant the above three catalysts possessed visible light response characteristics and tremendous potential for displaying high catalytic activity under VLI.

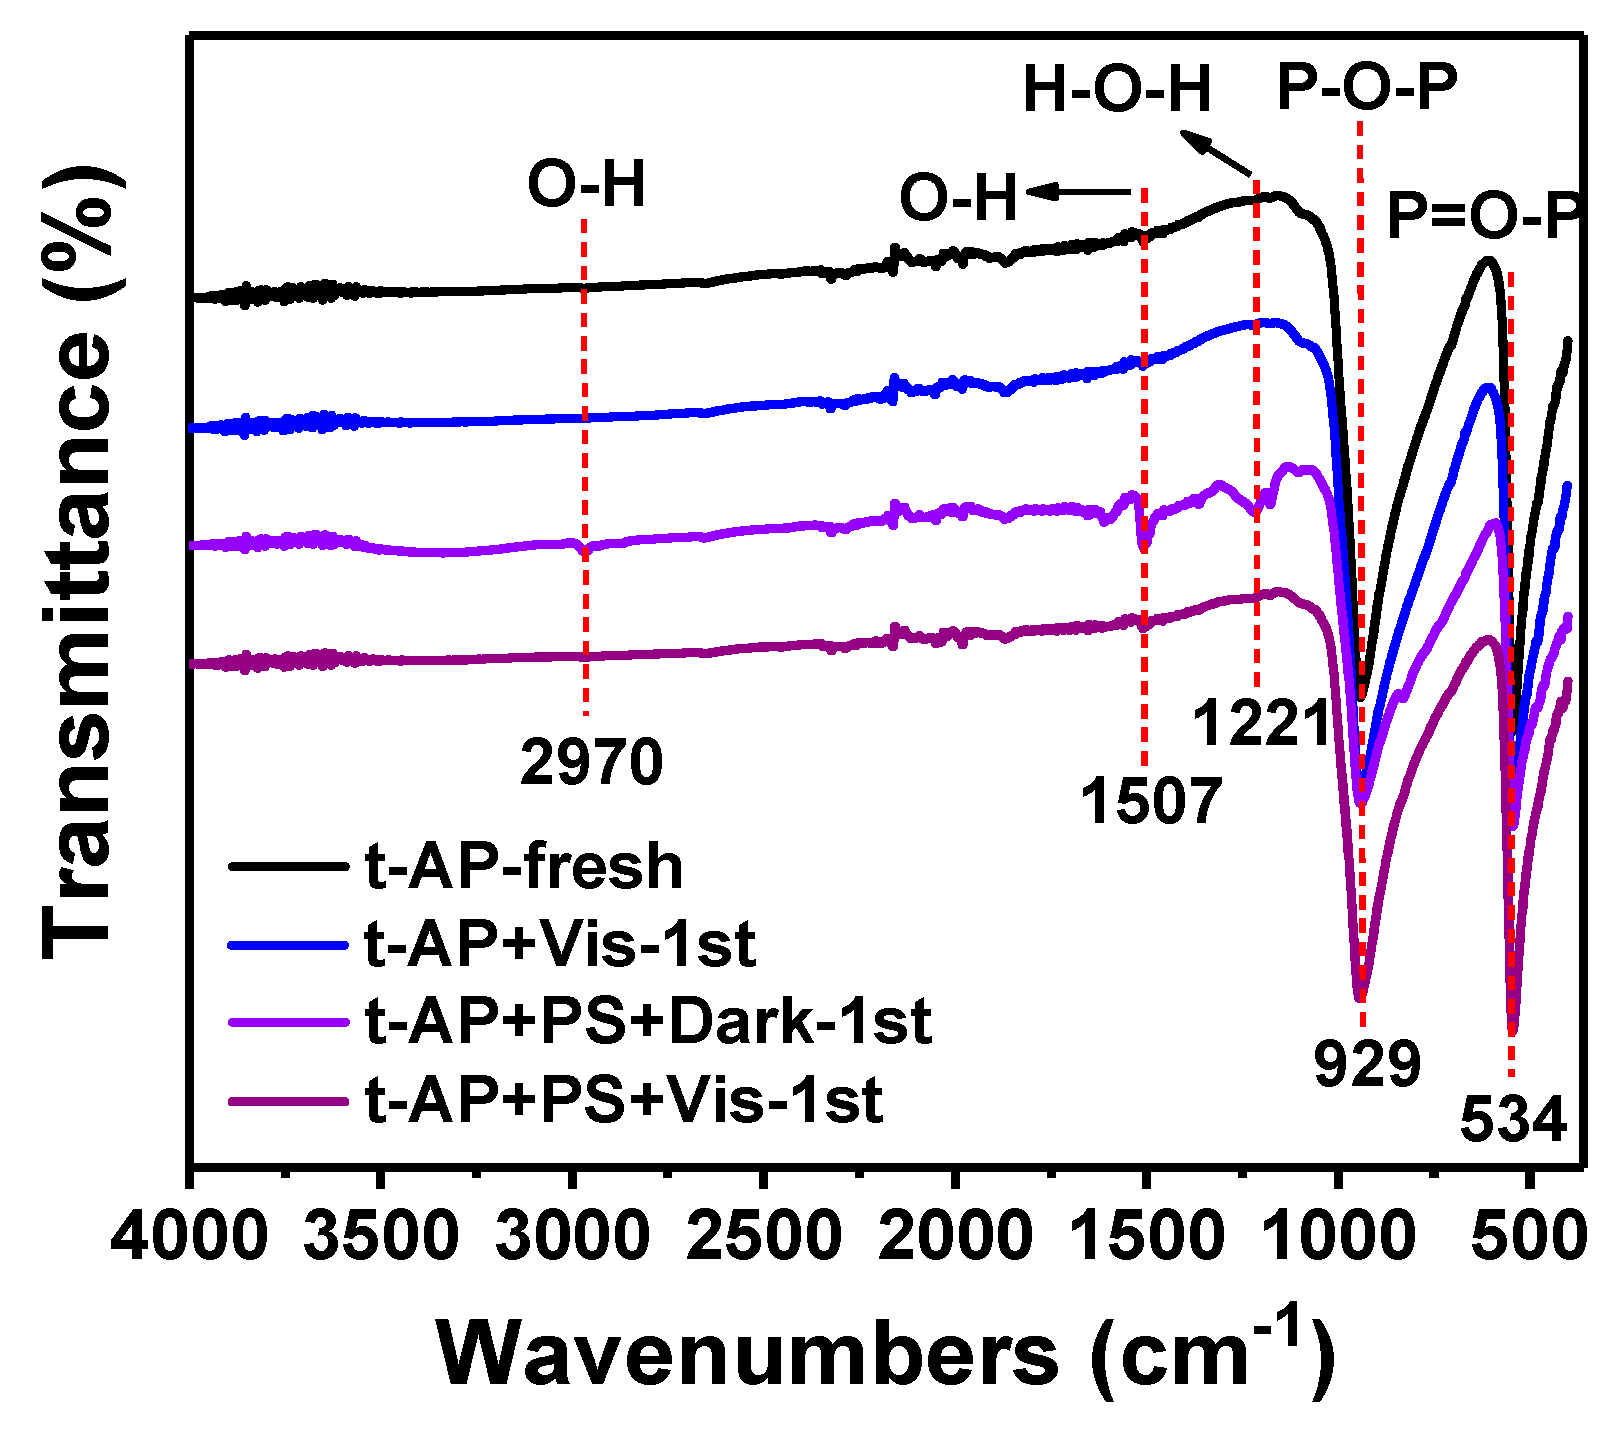
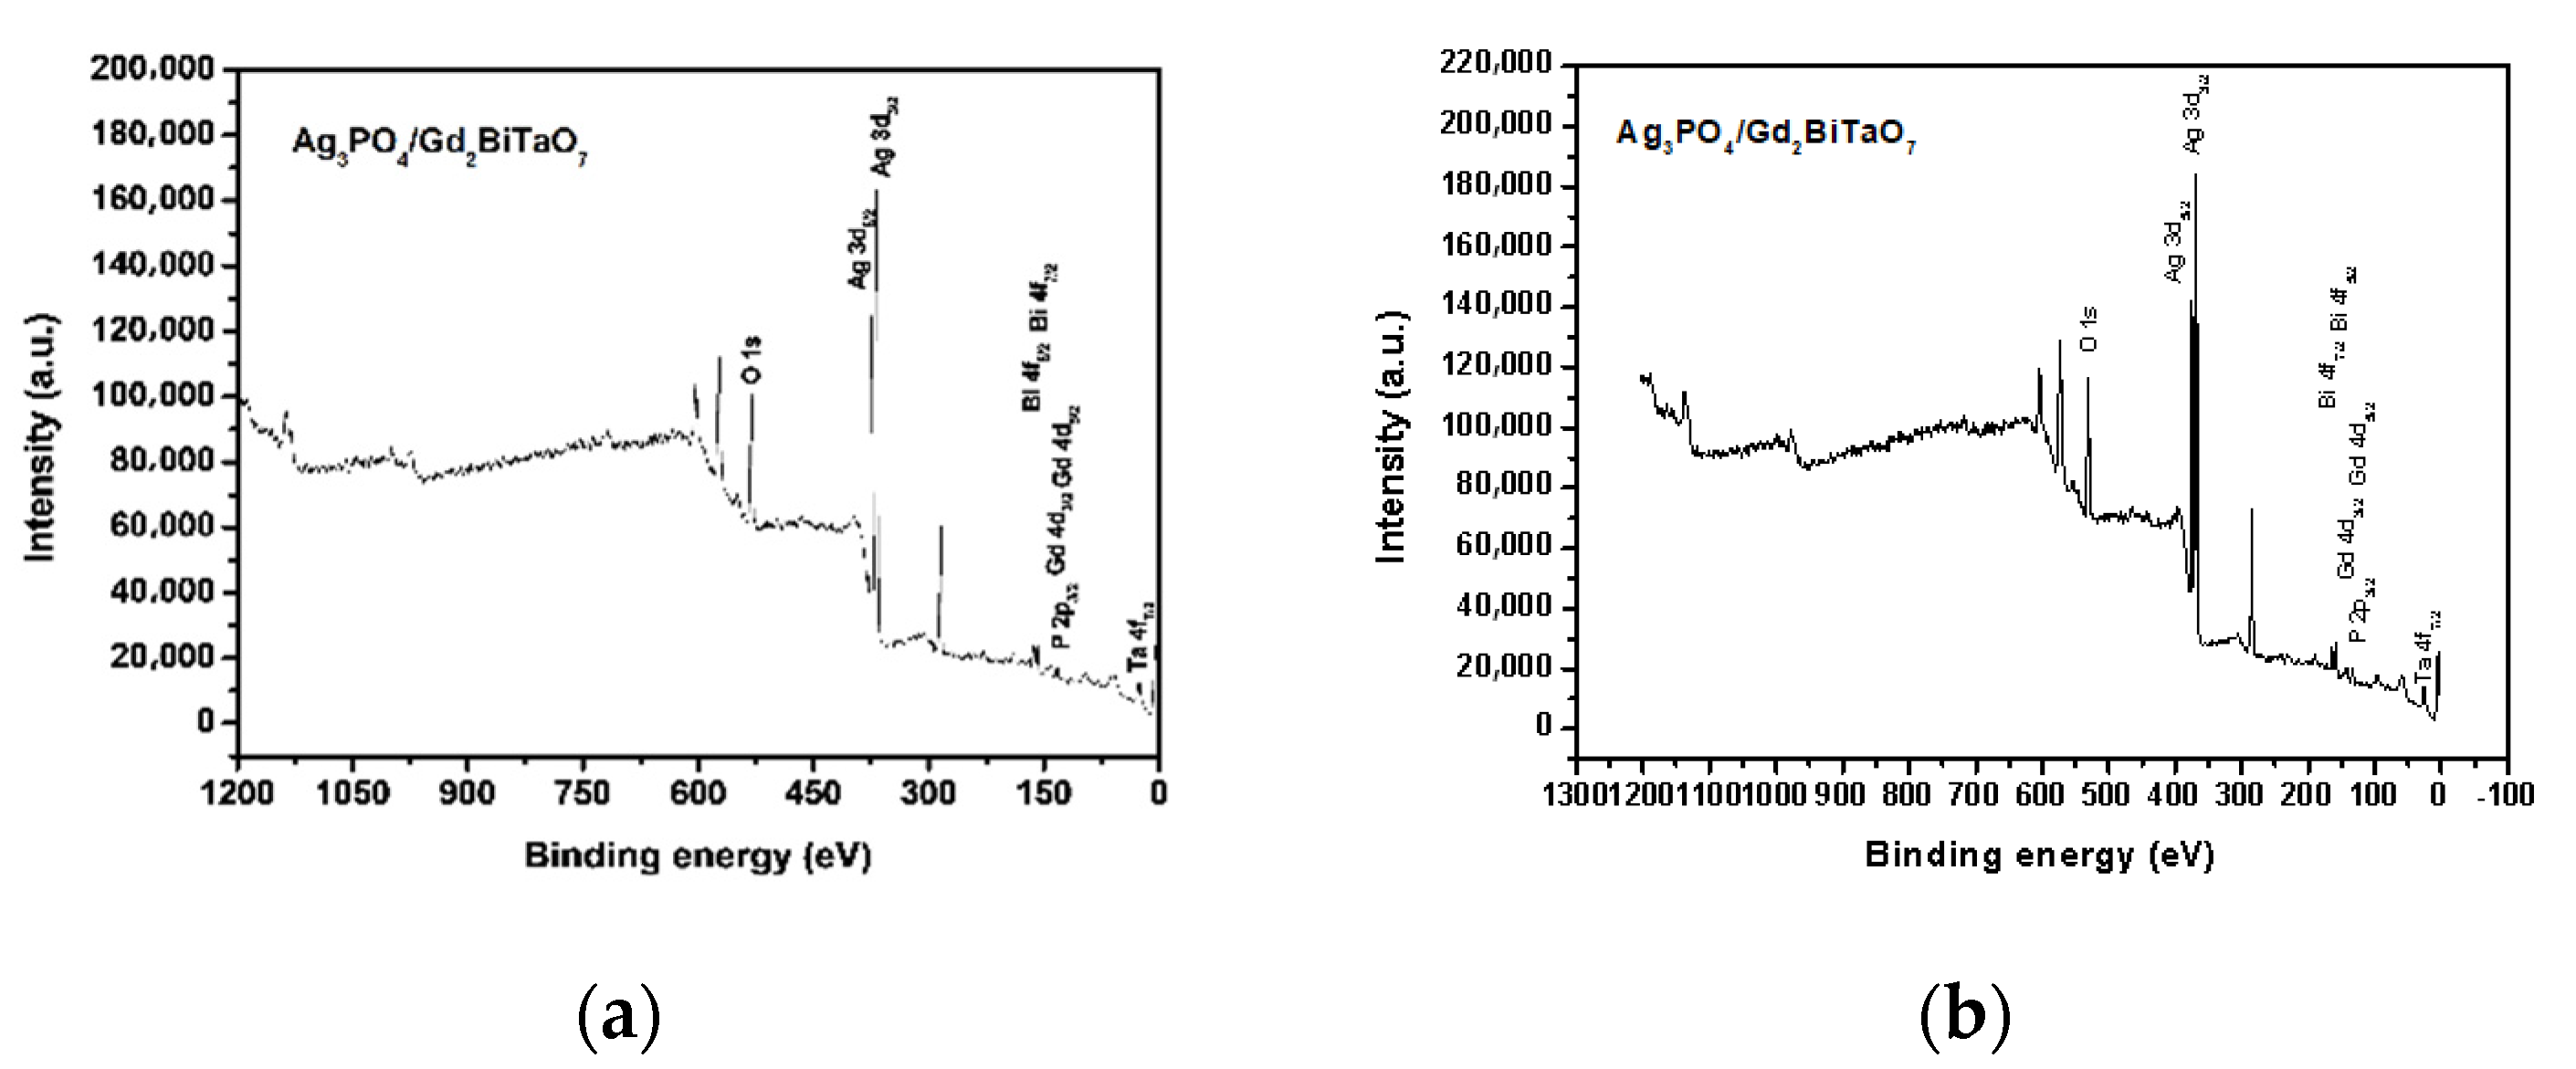
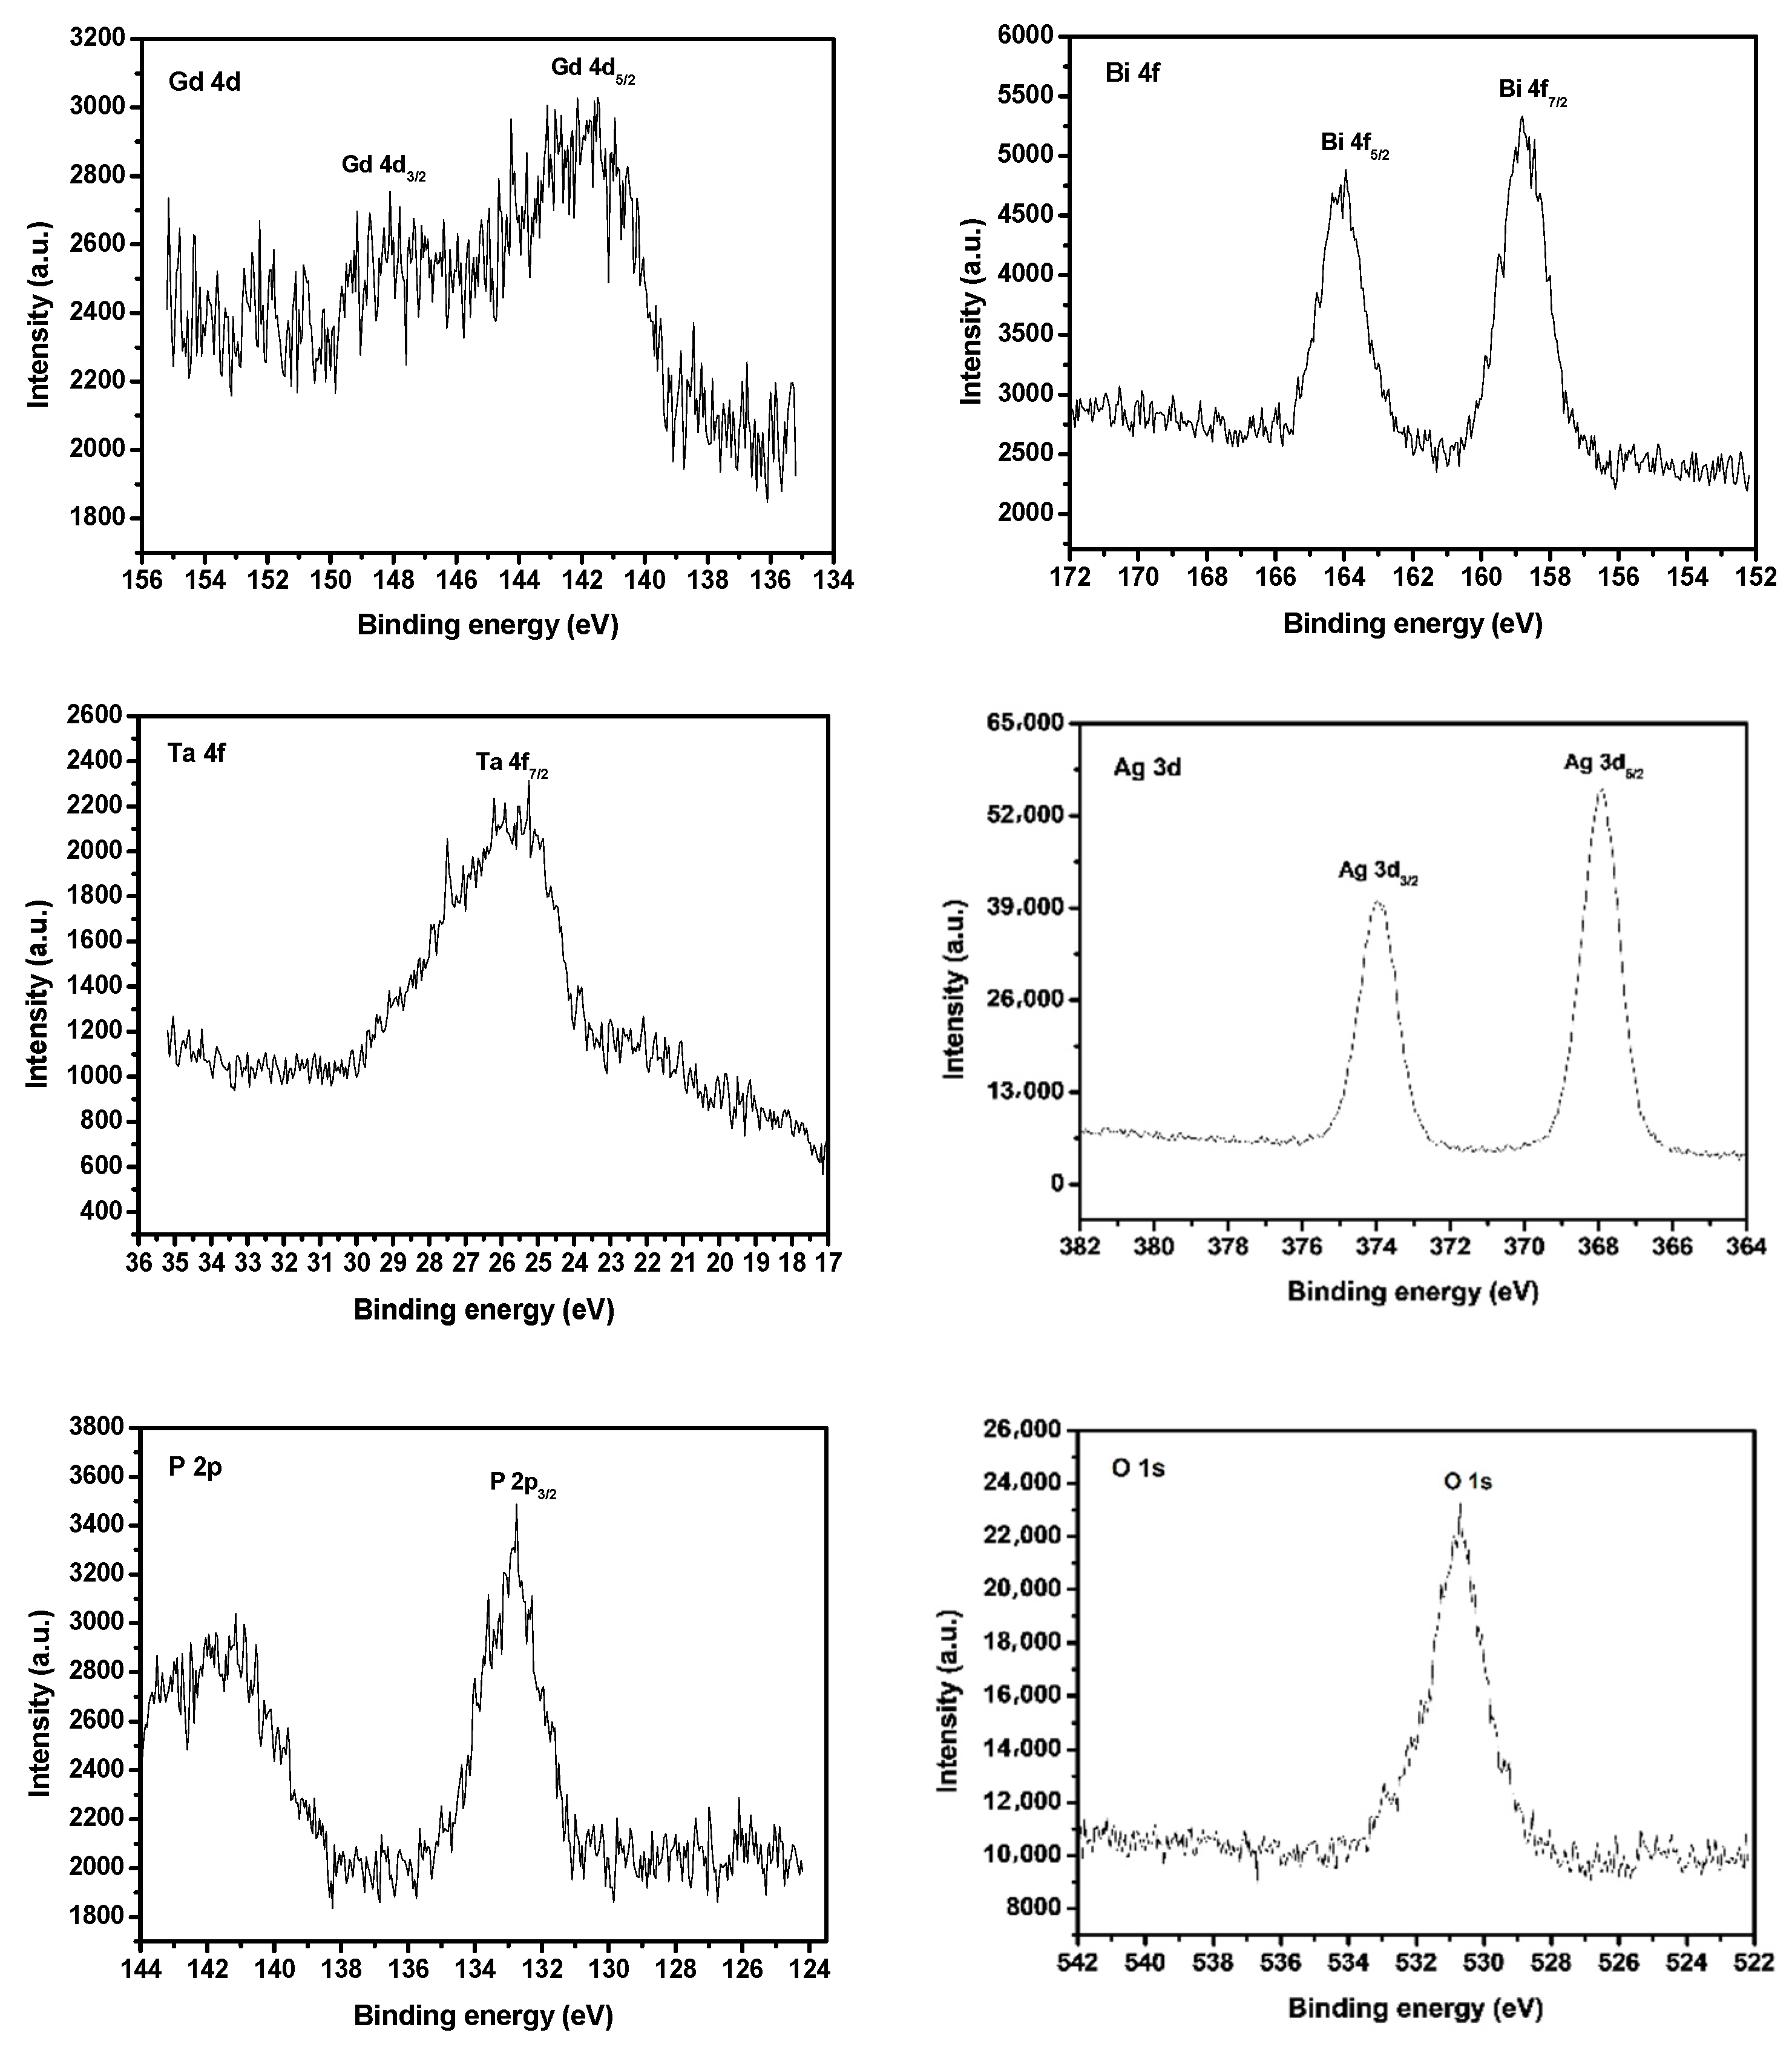
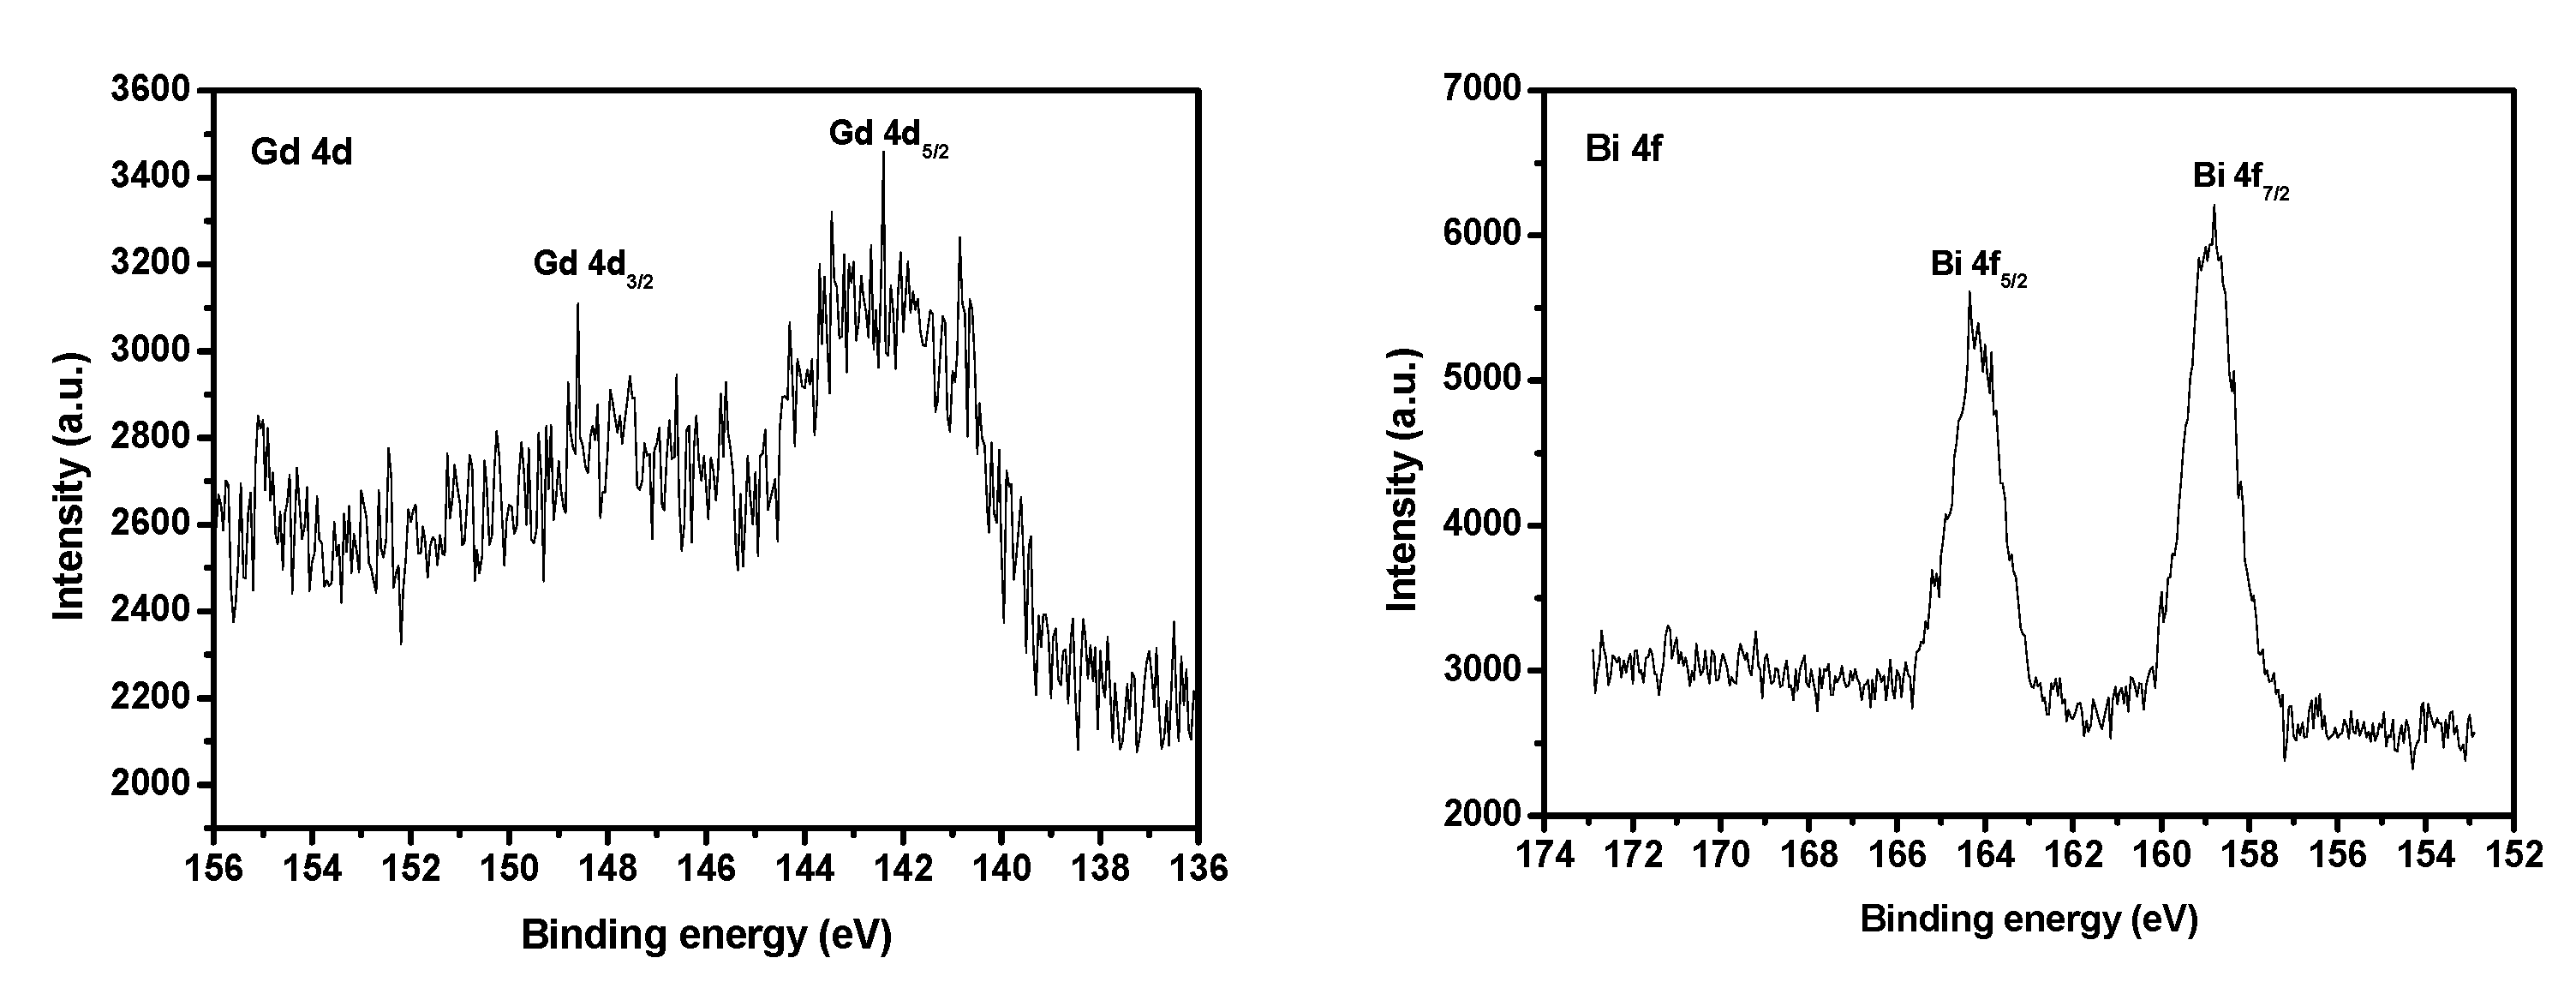
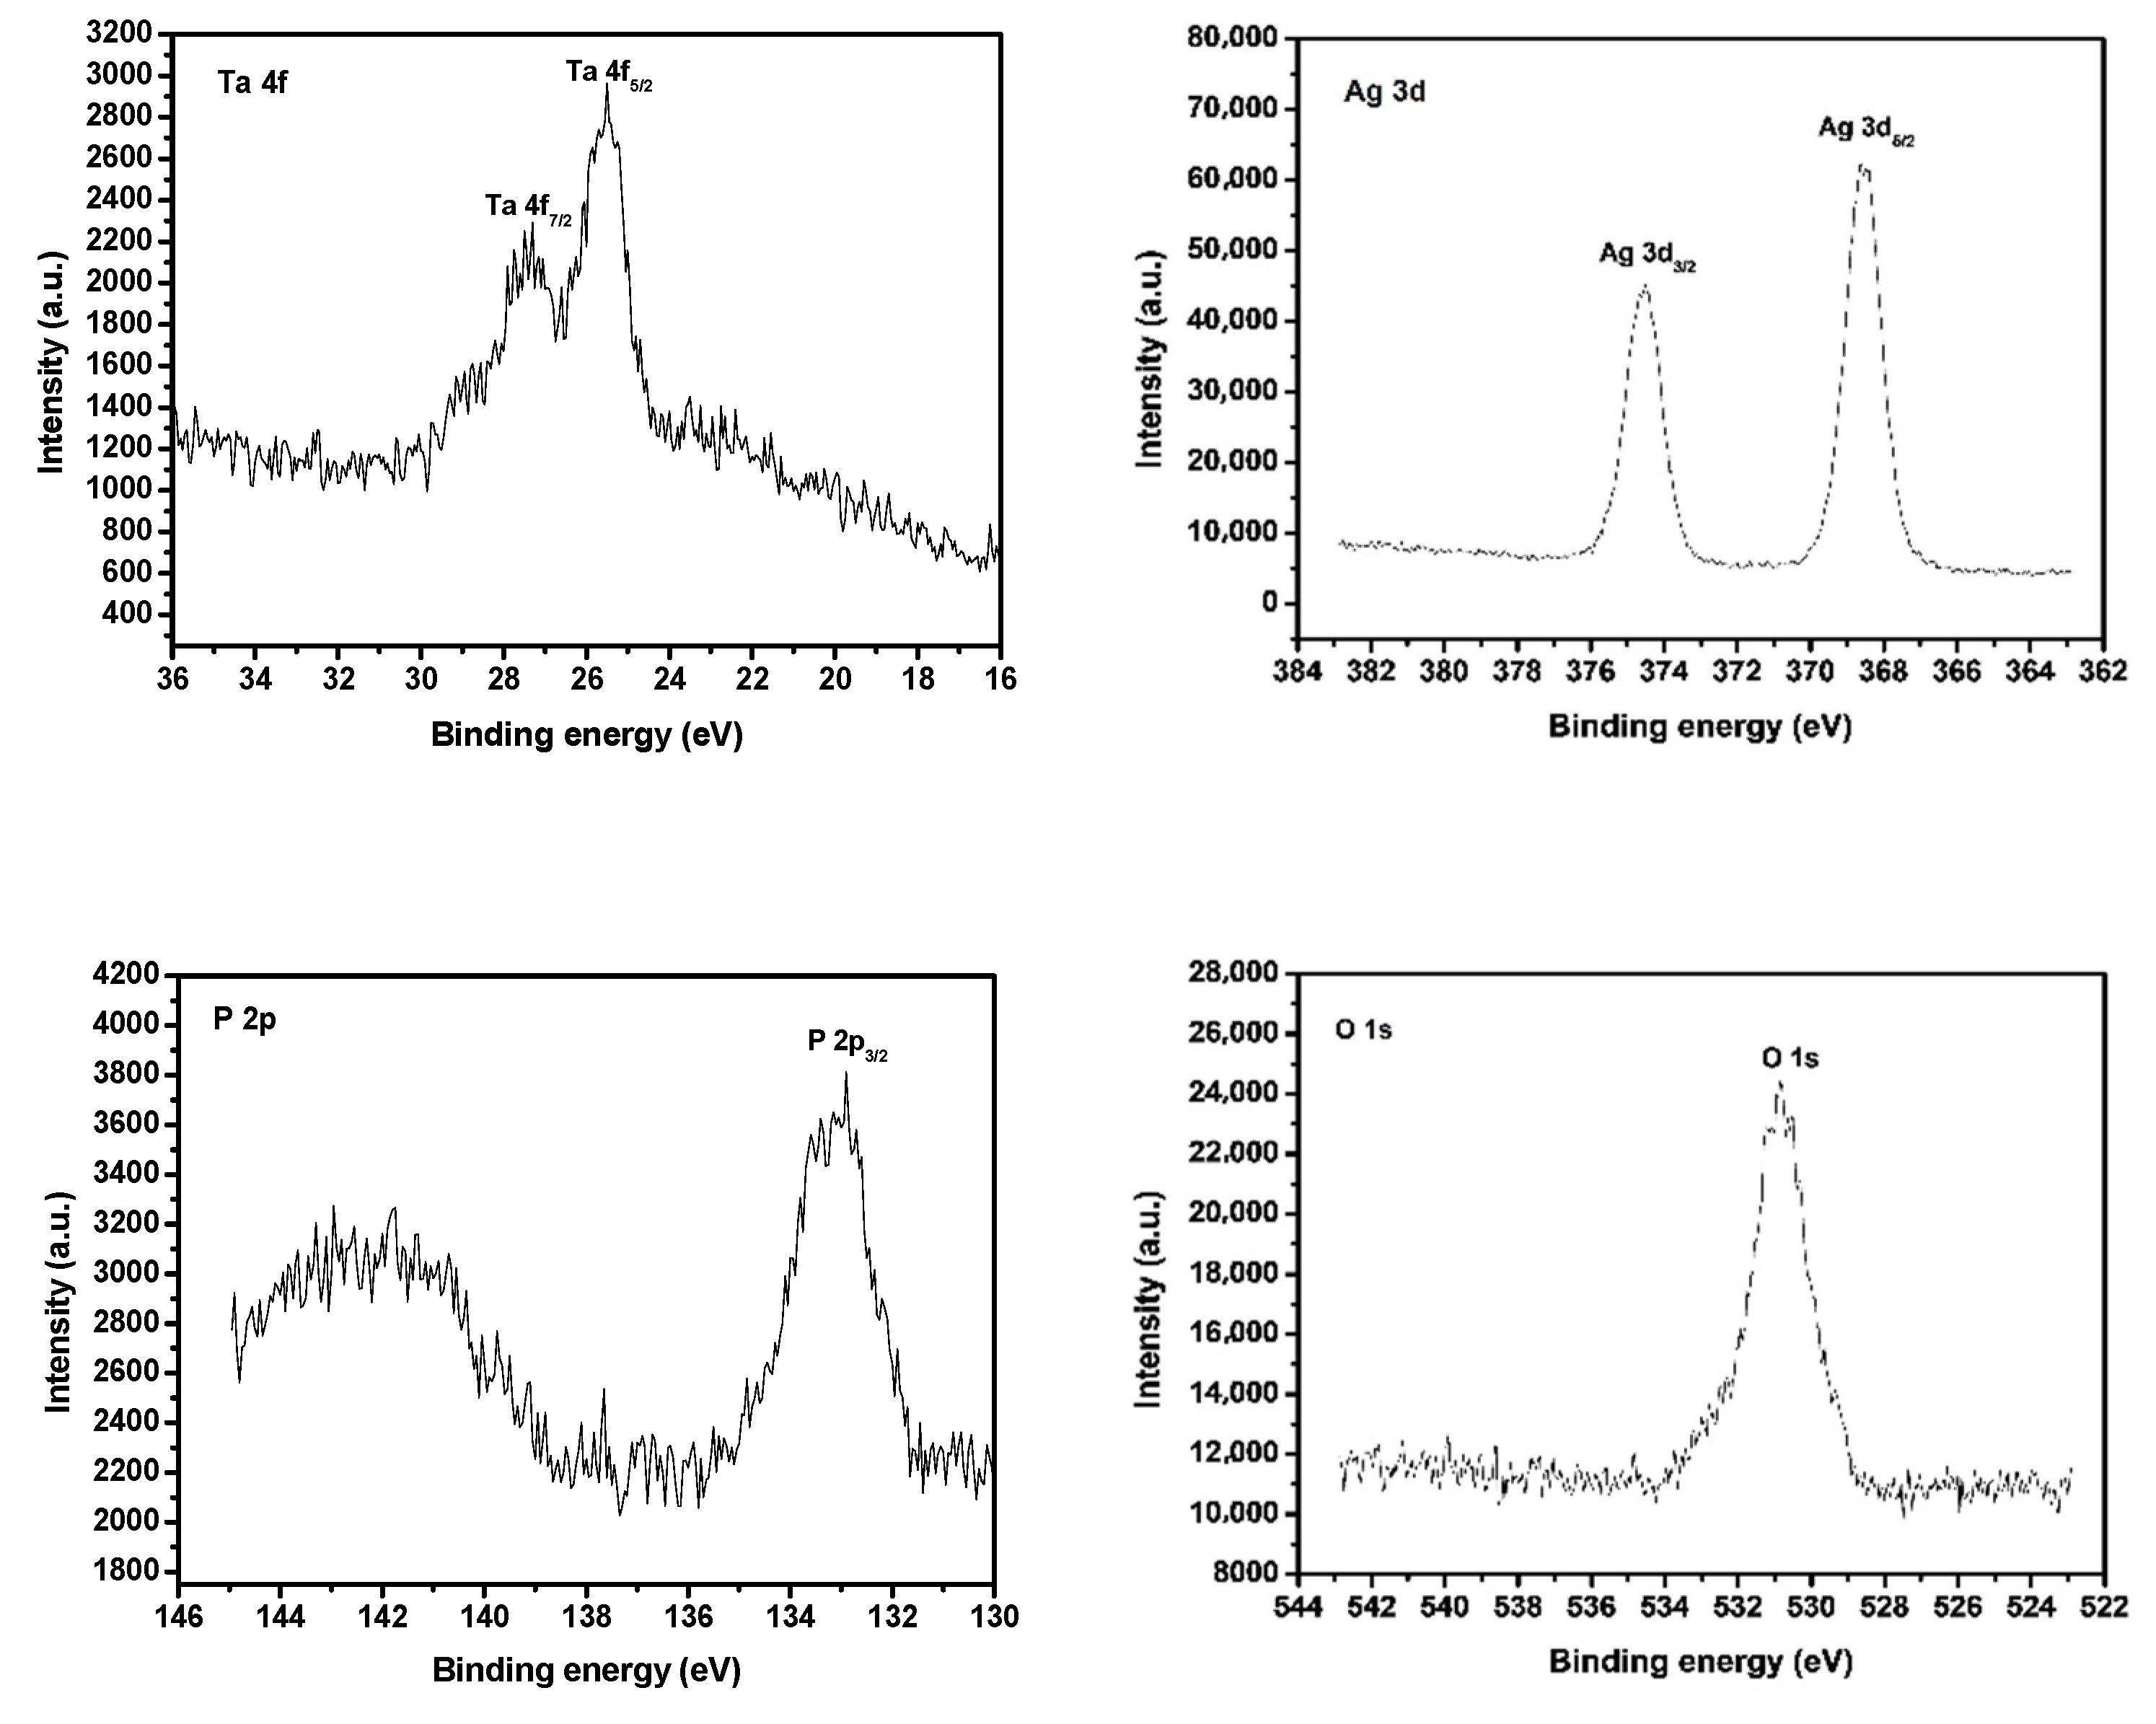
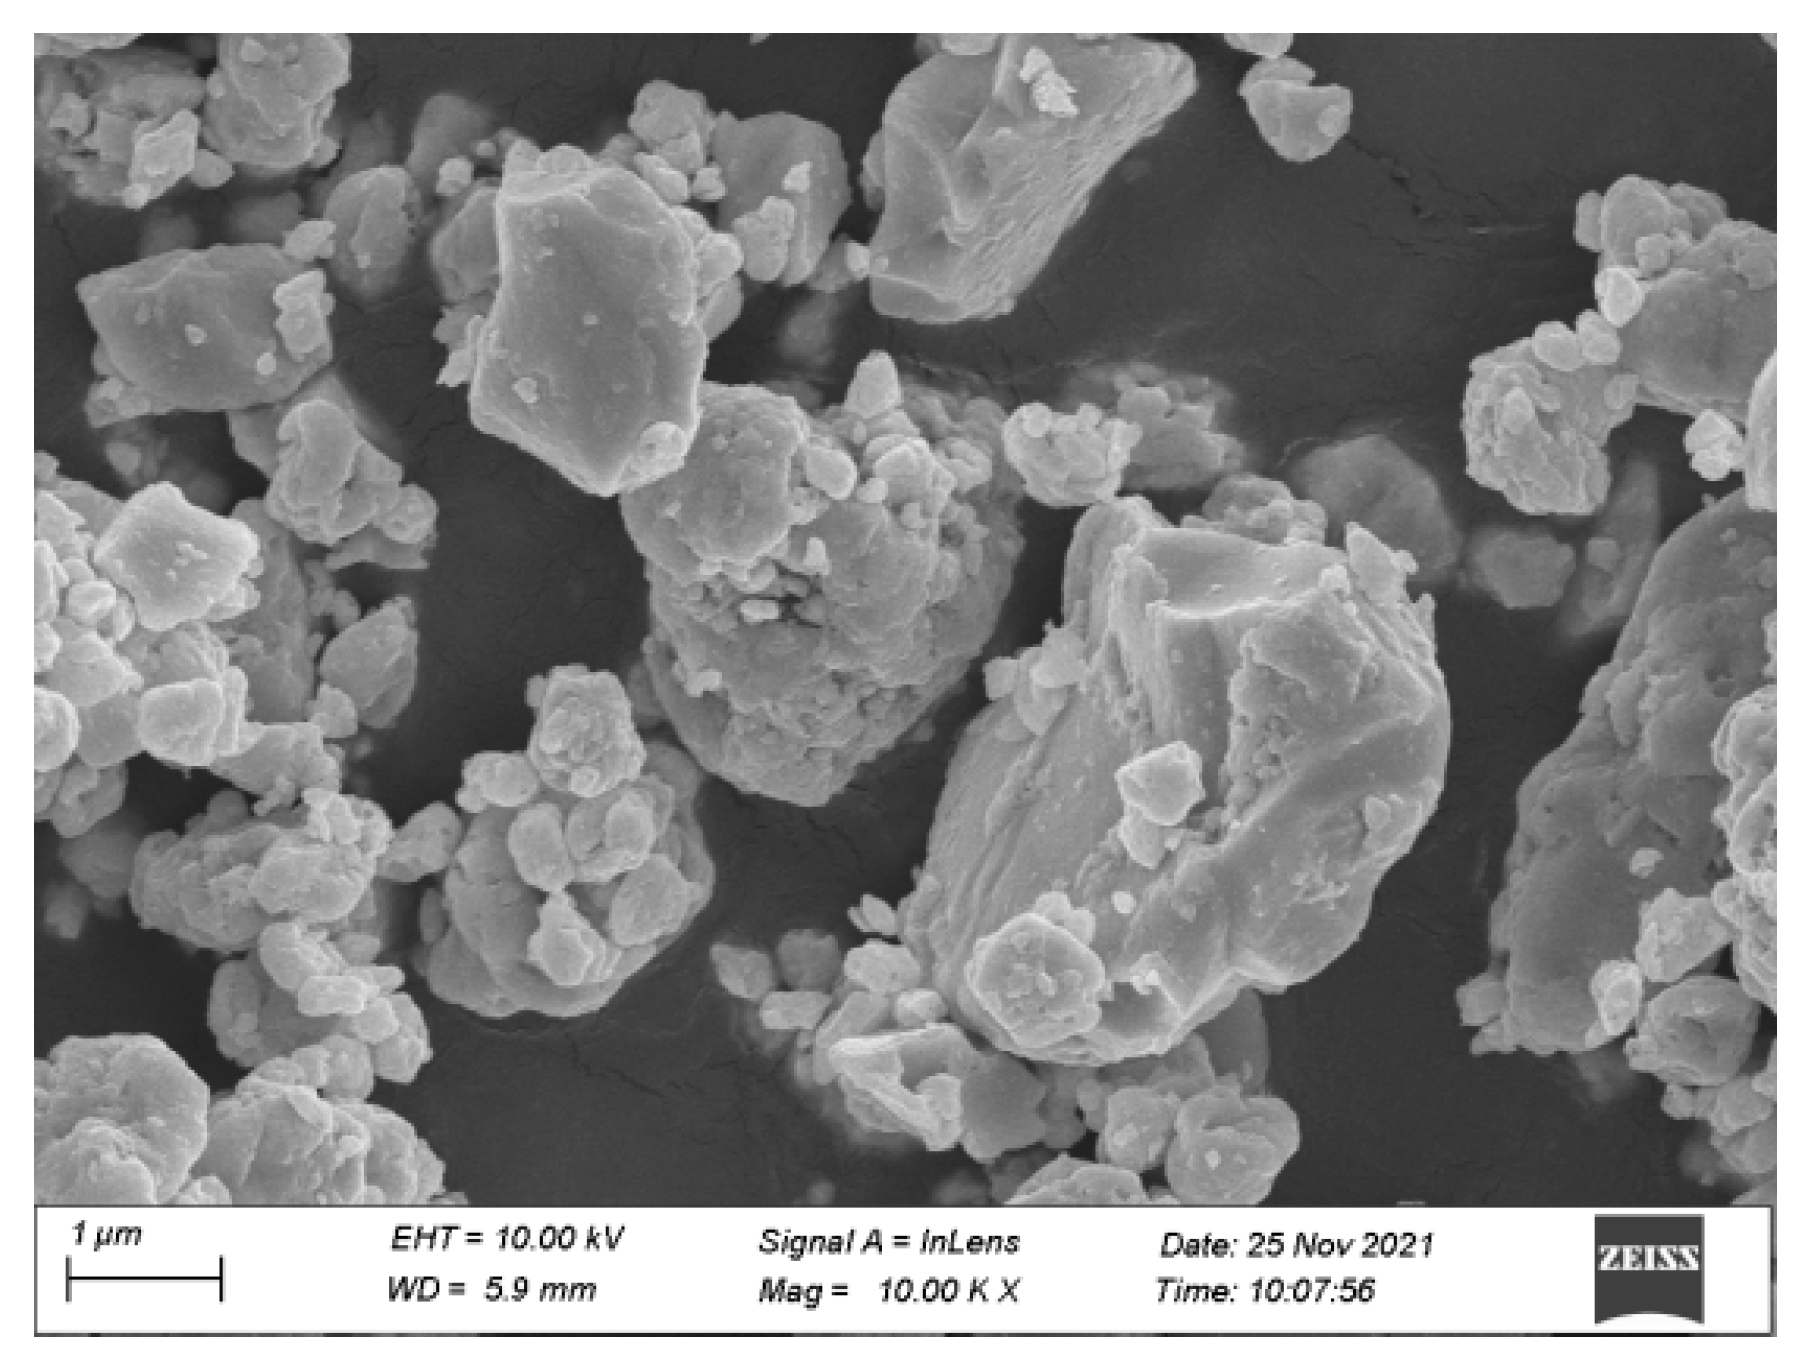
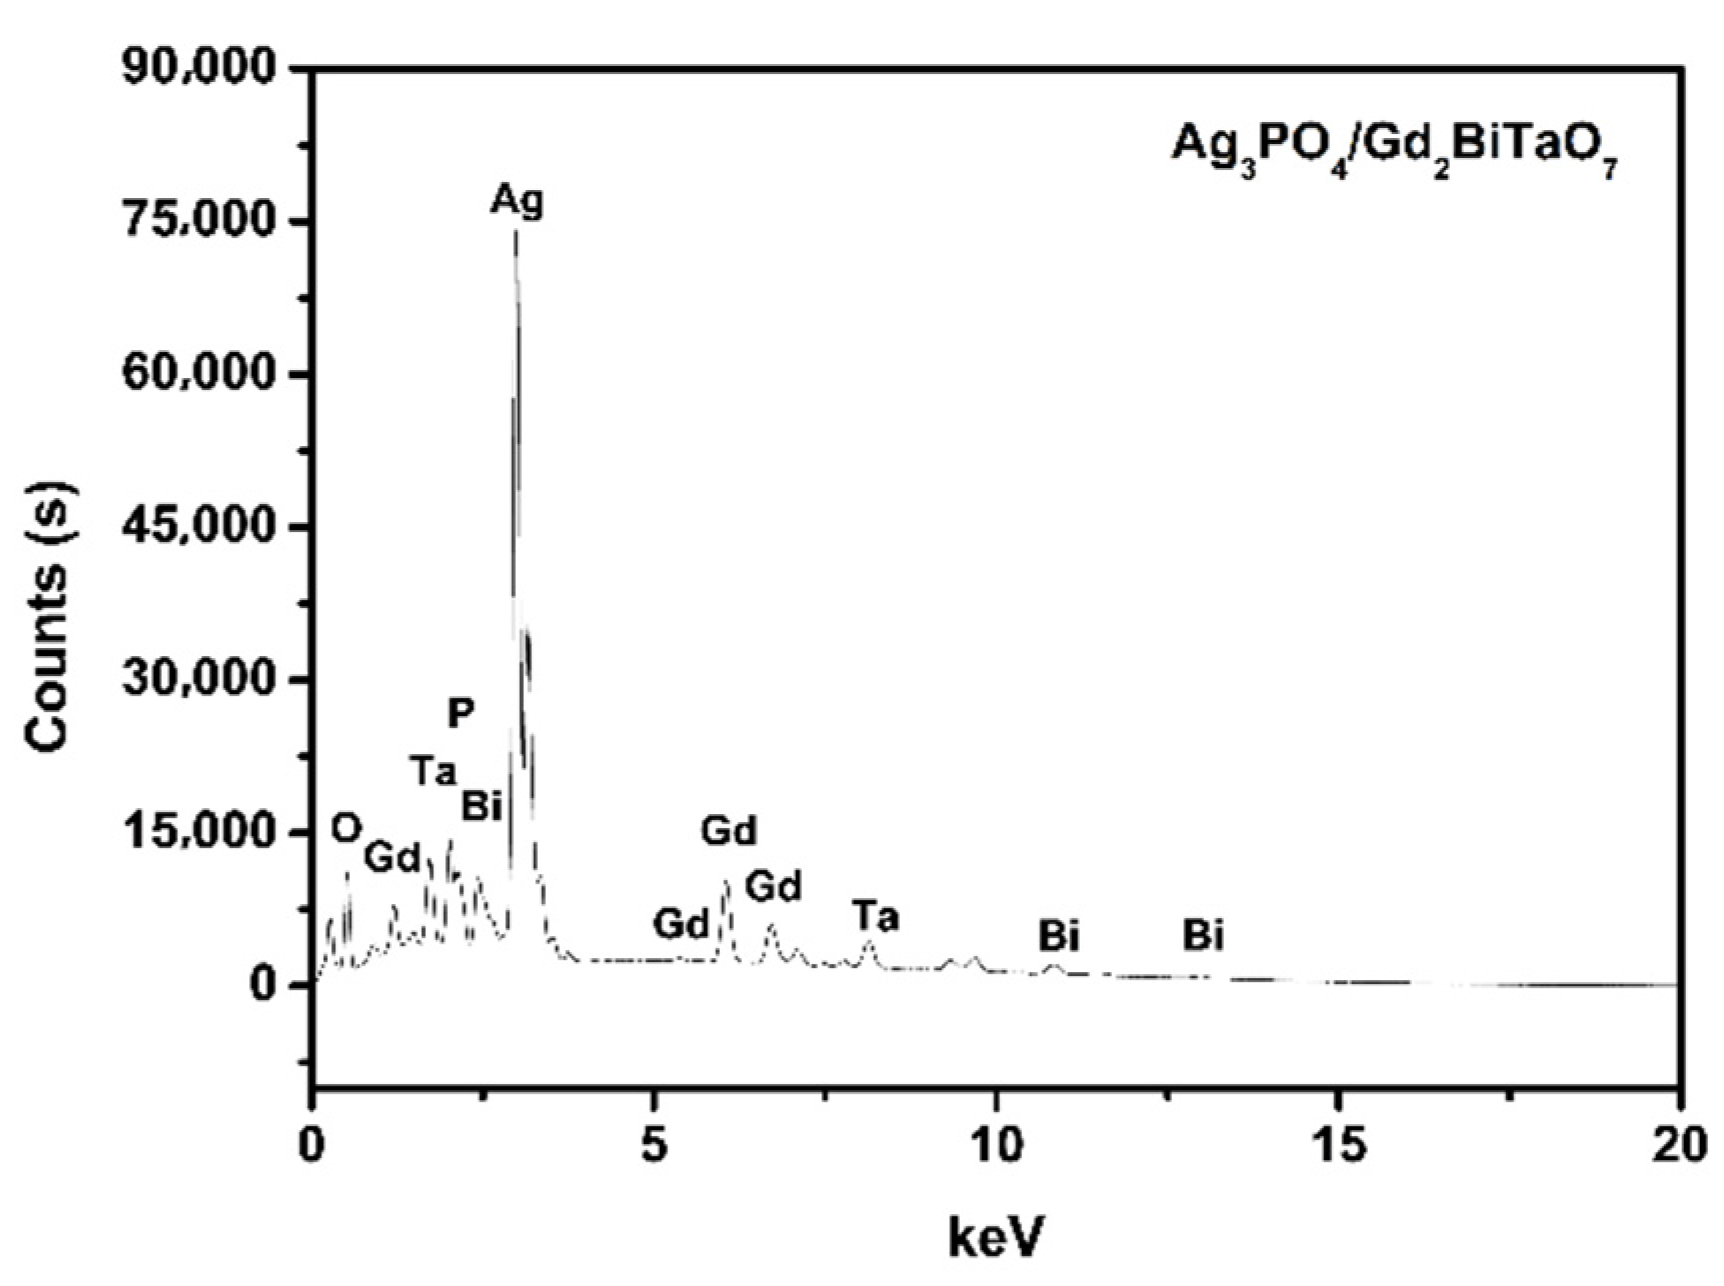
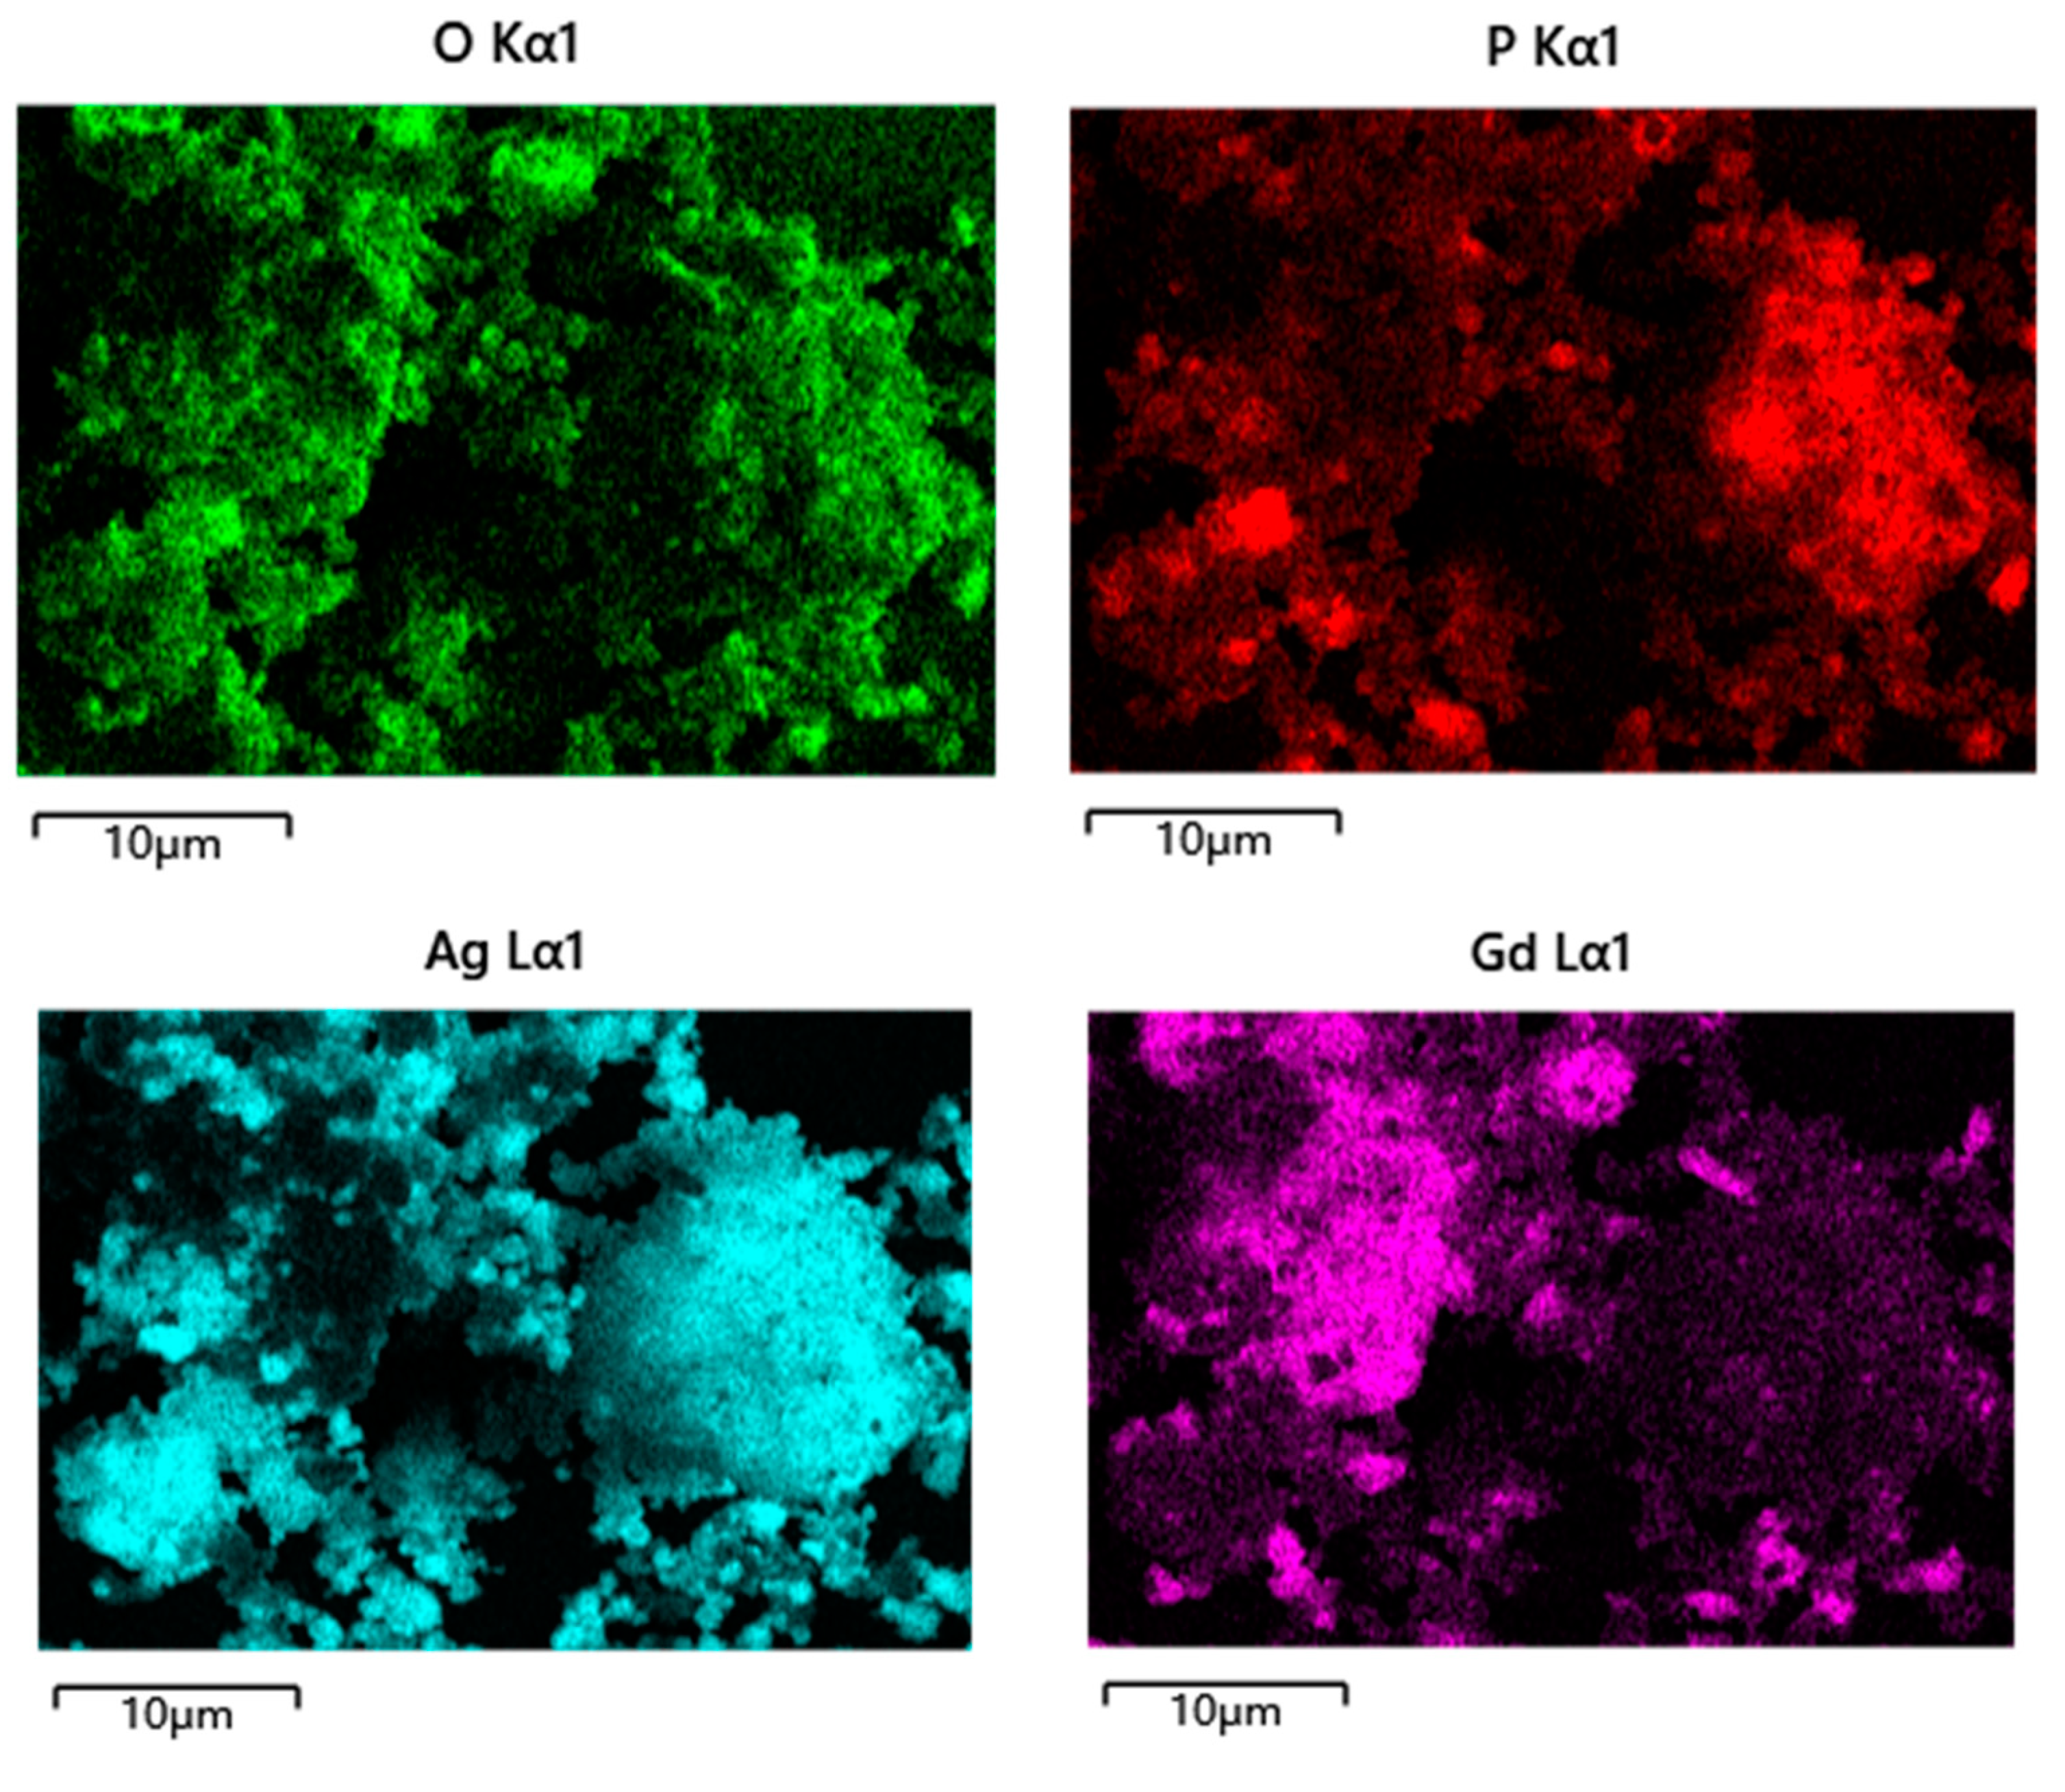
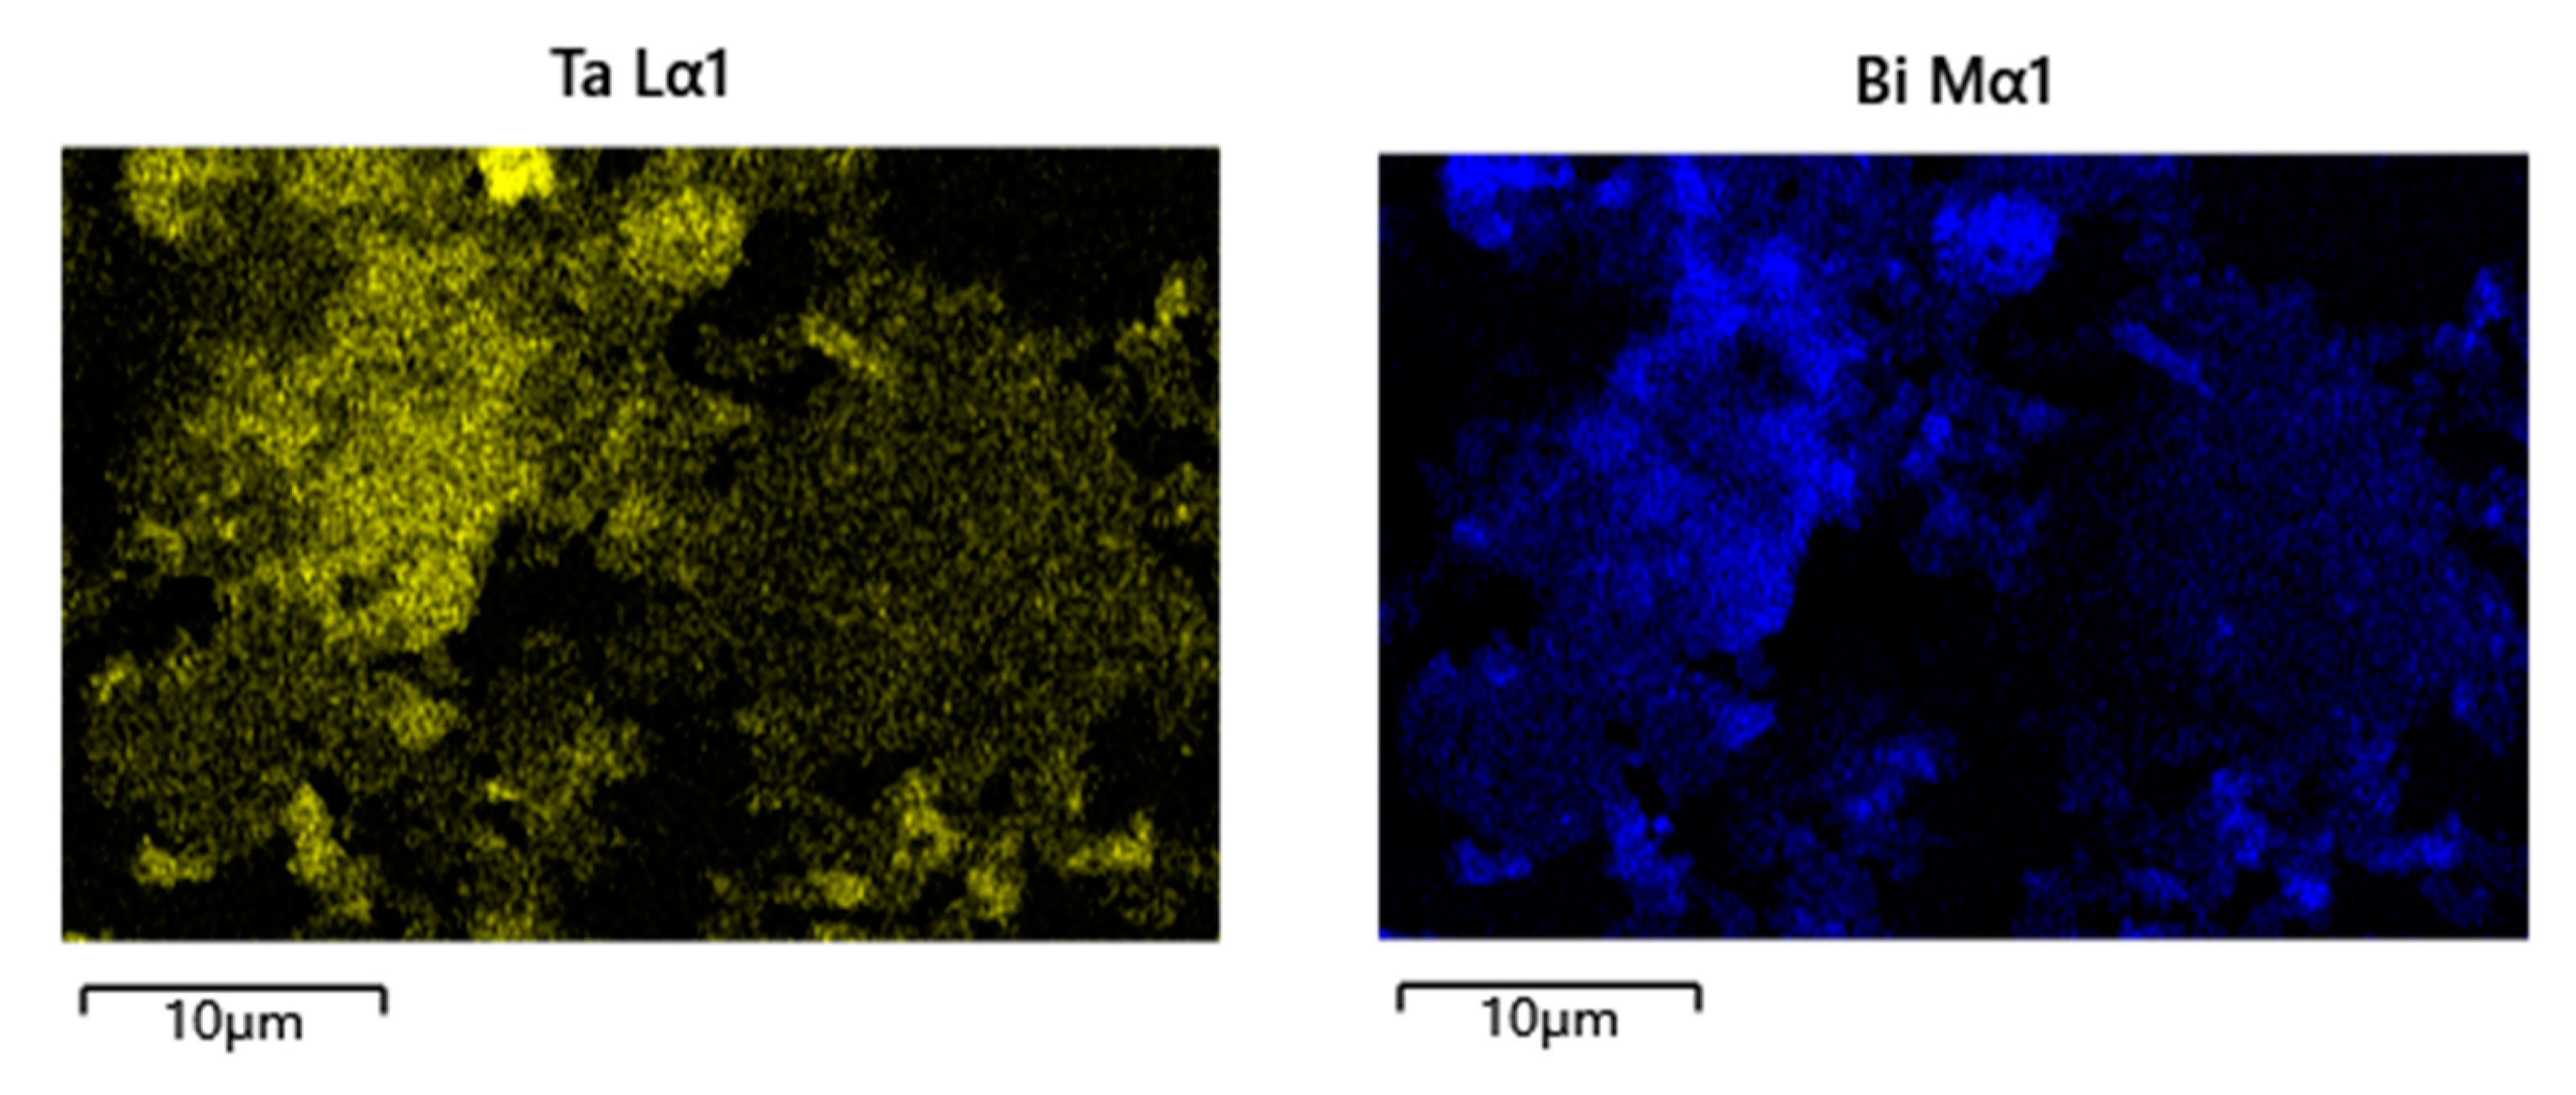
2.3. Characterization of Ag3PO4, Ag3PO4/Gd2BiTaO7 Heterojunction

The phase structure and crystal structure of the samples were analyzed by XRD. Figure S3 displays the XRD spectrum and PDF standard card of Ag3PO4 (AP). It could be seen from Figure S3 that sample AP was consistent with the corresponding PDF card of AP, indicating sample AP was successfully synthesized, and AP was pure single phase. The sample AP was a cubic crystal system, and the cell parameters were a = b = c =6.013 Å.
Figure S4 shows the scanning electron microscope morphology pattern of the synthesized AP. Figure S5 displays the composition of the product AP, which was analyzed by the SEM-EDS method. The result shown in Figure S5 was consistent with the XRD pattern of AP, and AP was proven to be pure phase without any impurity. It could be concluded from Figure S4 AP contained silver, phosphorus and oxygen elements and the average atomic ratio of Ag: P: O was 3:1:4. The detected carbon and aluminum elements came from the detection process, which indicated the AP catalyst that was prepared was a pure phase. It could be found from Figure S4 that AP particles had regular morphology and uniform particle size. The particle size of AP was measured to be 970 nm.
Figure 3 shows the ultraviolet-visible diffuse reflectance spectrum of the prepared AP. It could be observed from Figure 3 that the absorbance edge of AP was 530 nm, which meant that AP had the ability to become a visible light-responsive photocatalyst. We utilized the Kubelka–Munk transformation method to analyze the band gap of AP. The optical absorption near the band edge of AP conformed to the above formula (1). According to the above formula (1), the forbidden band width of AP was 2.45 eV, as shown in the inset of Figure 3. The low band gap width for AP was beneficial to improve the photocatalytic activity under VLI.
Figure 4 displays the ultraviolet photoelectron spectrogram (UPS) of AP. According to the UPS results, which derived from Figure 4, the absolute electrochemical potential of the valence band value of AP was calculated to be 2.72 eV, which was related to the Fermi energy. Combined with the band gap value 2.45 eV of AP, the absolute electrochemical potential of the conduction band value of AP was 0.27 eV.
Figure 5 shows the Fourier transform infrared spectrum analysis of AP particles. It could be seen from Figure 5 that the absorption bands of the prepared AP were at 534 cm−1 and 929 cm−1, respectively. The absorption band of AP at 534 cm−1 was attributed to the P=O-P bond. The absorption band of AP at 929 cm−1 was attributed to the P-O-P bond.
Figure S6a shows the absorbance standard curve of BPA at different concentrations when the AP dosage was 1.25 mg/L, 2.5 mg/L, 5 mg/L, 10 mg/L or 20 mg/L under ultraviolet light irradiation in the range of 220–320 nm using an ultraviolet-visible spectrophotometer at pH = 7. It could be seen from the inset of Figure S6a that the maximal absorption wavelength of BPA was 273 nm. The relationship between the concentration of BPA and the absorbance value at 273 nm was shown in Figure S6a. A linear regression method was used to obtain the equation: Y = 0.01238X-0.00377, where Y was the absorbance value of BPA at 273 nm, and X was the concentration of BPA. The correlation coefficient R2 was 0.9993, indicating that the linear regression results were good.
Figure S6b shows the absorption standard curve of BPA at pH = 11. It could be found from Figure S6b that the absorbance value of BPA was achieved when the AP dosage were 1.25 mg/L, 2.5 mg/L, 5 mg/L, 10 mg/L and 20 mg/L under ultraviolet light irradiation in the range of 180–330 nm. It could be seen from the inset of Figure S6b that one absorption wavelength of BPA was 293 nm.
Zhuang [68] obtained UV–visible absorption spectra of BPA and found that BPA had absorption peaks at 224 nm and 278 nm. Zhuang [68] summarized that 224 nm was the maximum absorbing peak, which was susceptible to the influence of the solvent absorption, and the 278 nm absorption peak was chosen as the detection wavelength for HPLC with UV detection. Similarly, we found from Figure S6b that BPA possessed absorption peaks at 208 nm, 242 nm and 293 nm when the pH value was 11. According to the results from Zhuang [68], we used the absorbance peak at 242 nm to detect the concentration of BPA.
The relationship between the concentration of BPA and the absorbance value at 242 nm was shown in Figure S6b. A linear regression method was utilized to obtain the equation Y = 0.01786X + 0.0024, where Y was the absorbance value of BPA at 242 nm and X was the concentration of BPA. The correlation coefficient R2 was 0.9996, indicating that the linear regression results were perfect.
Figure S7 shows the XRD patterns of AP under different reaction conditions. The black line derived from Figure S7 represents the XRD pattern of AP without a photocatalytic reaction. The red line derived from Figure S7 represents the XRD pattern of AP after photocatalytic degradation of BPA (PDB) for 30 min with AP as a photocatalyst under VLI. The blue line displayed the XRD pattern of AP after the adsorption of BPA for 30 min with AP-PS as the adsorbent under dark conditions. The pink line displayed the XRD pattern of AP after PDB for 30 min with Ag3PO4 and AP-PS as photocatalysts under VLI. Under different reaction conditions, all diffraction peak data of our prepared AP were in complete accordance with the diffraction peaks data of AP, which derived from the corresponding standard card of AP, indicating that the structure of the synthesized catalyst AP was stable. The intensity of the XRD peaks of AP indicated that the catalyst AP had good crystallinity, which exerted an important influence on the photocatalytic performance of the catalyst AP. In addition, the exposed crystal planes of the main peaks of AP were (210), (211) and (200), respectively. Optimizing these exposed crystal faces of AP was one of the ways to improve the photocatalytic performance of the photocatalyst AP.

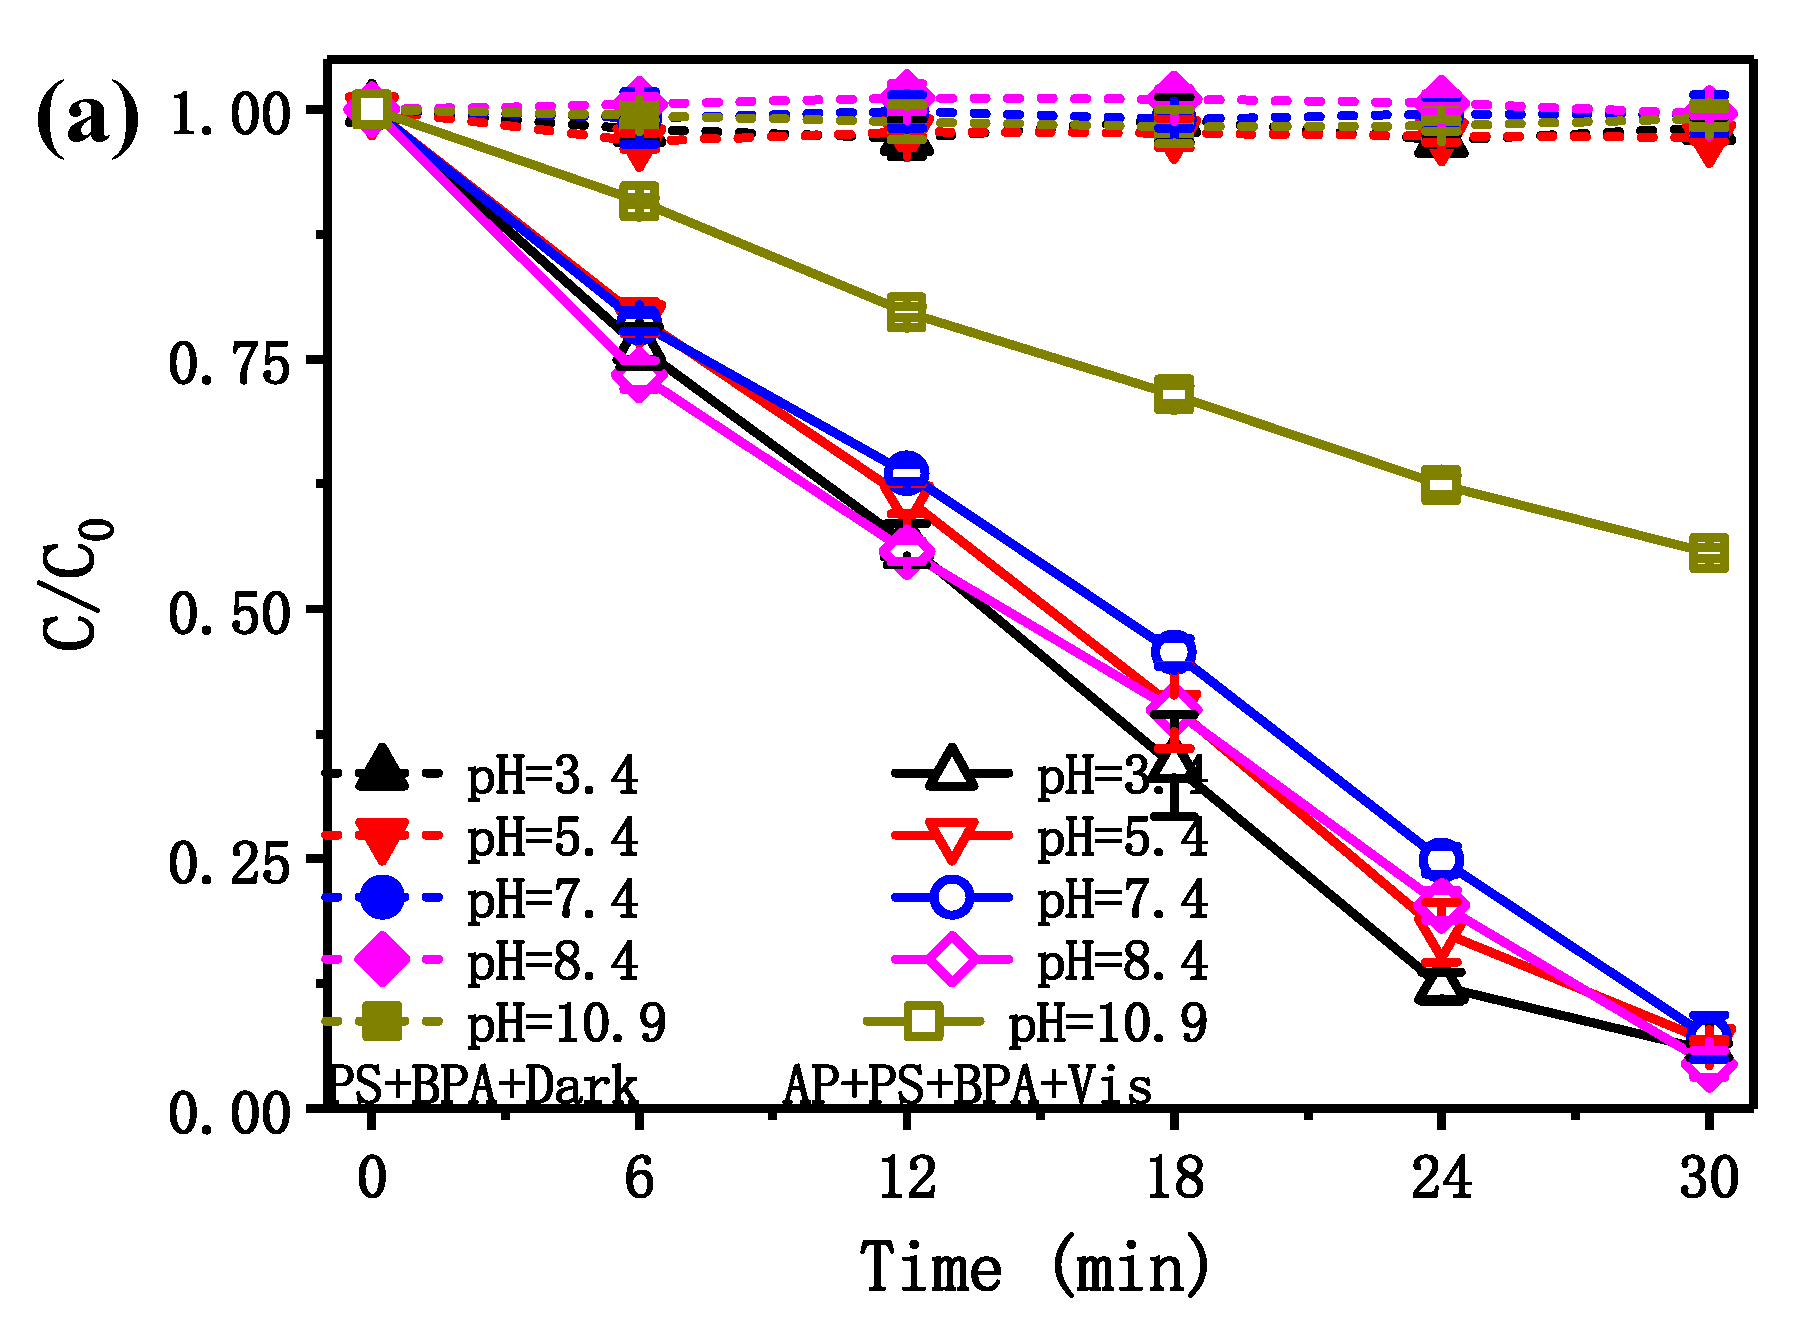
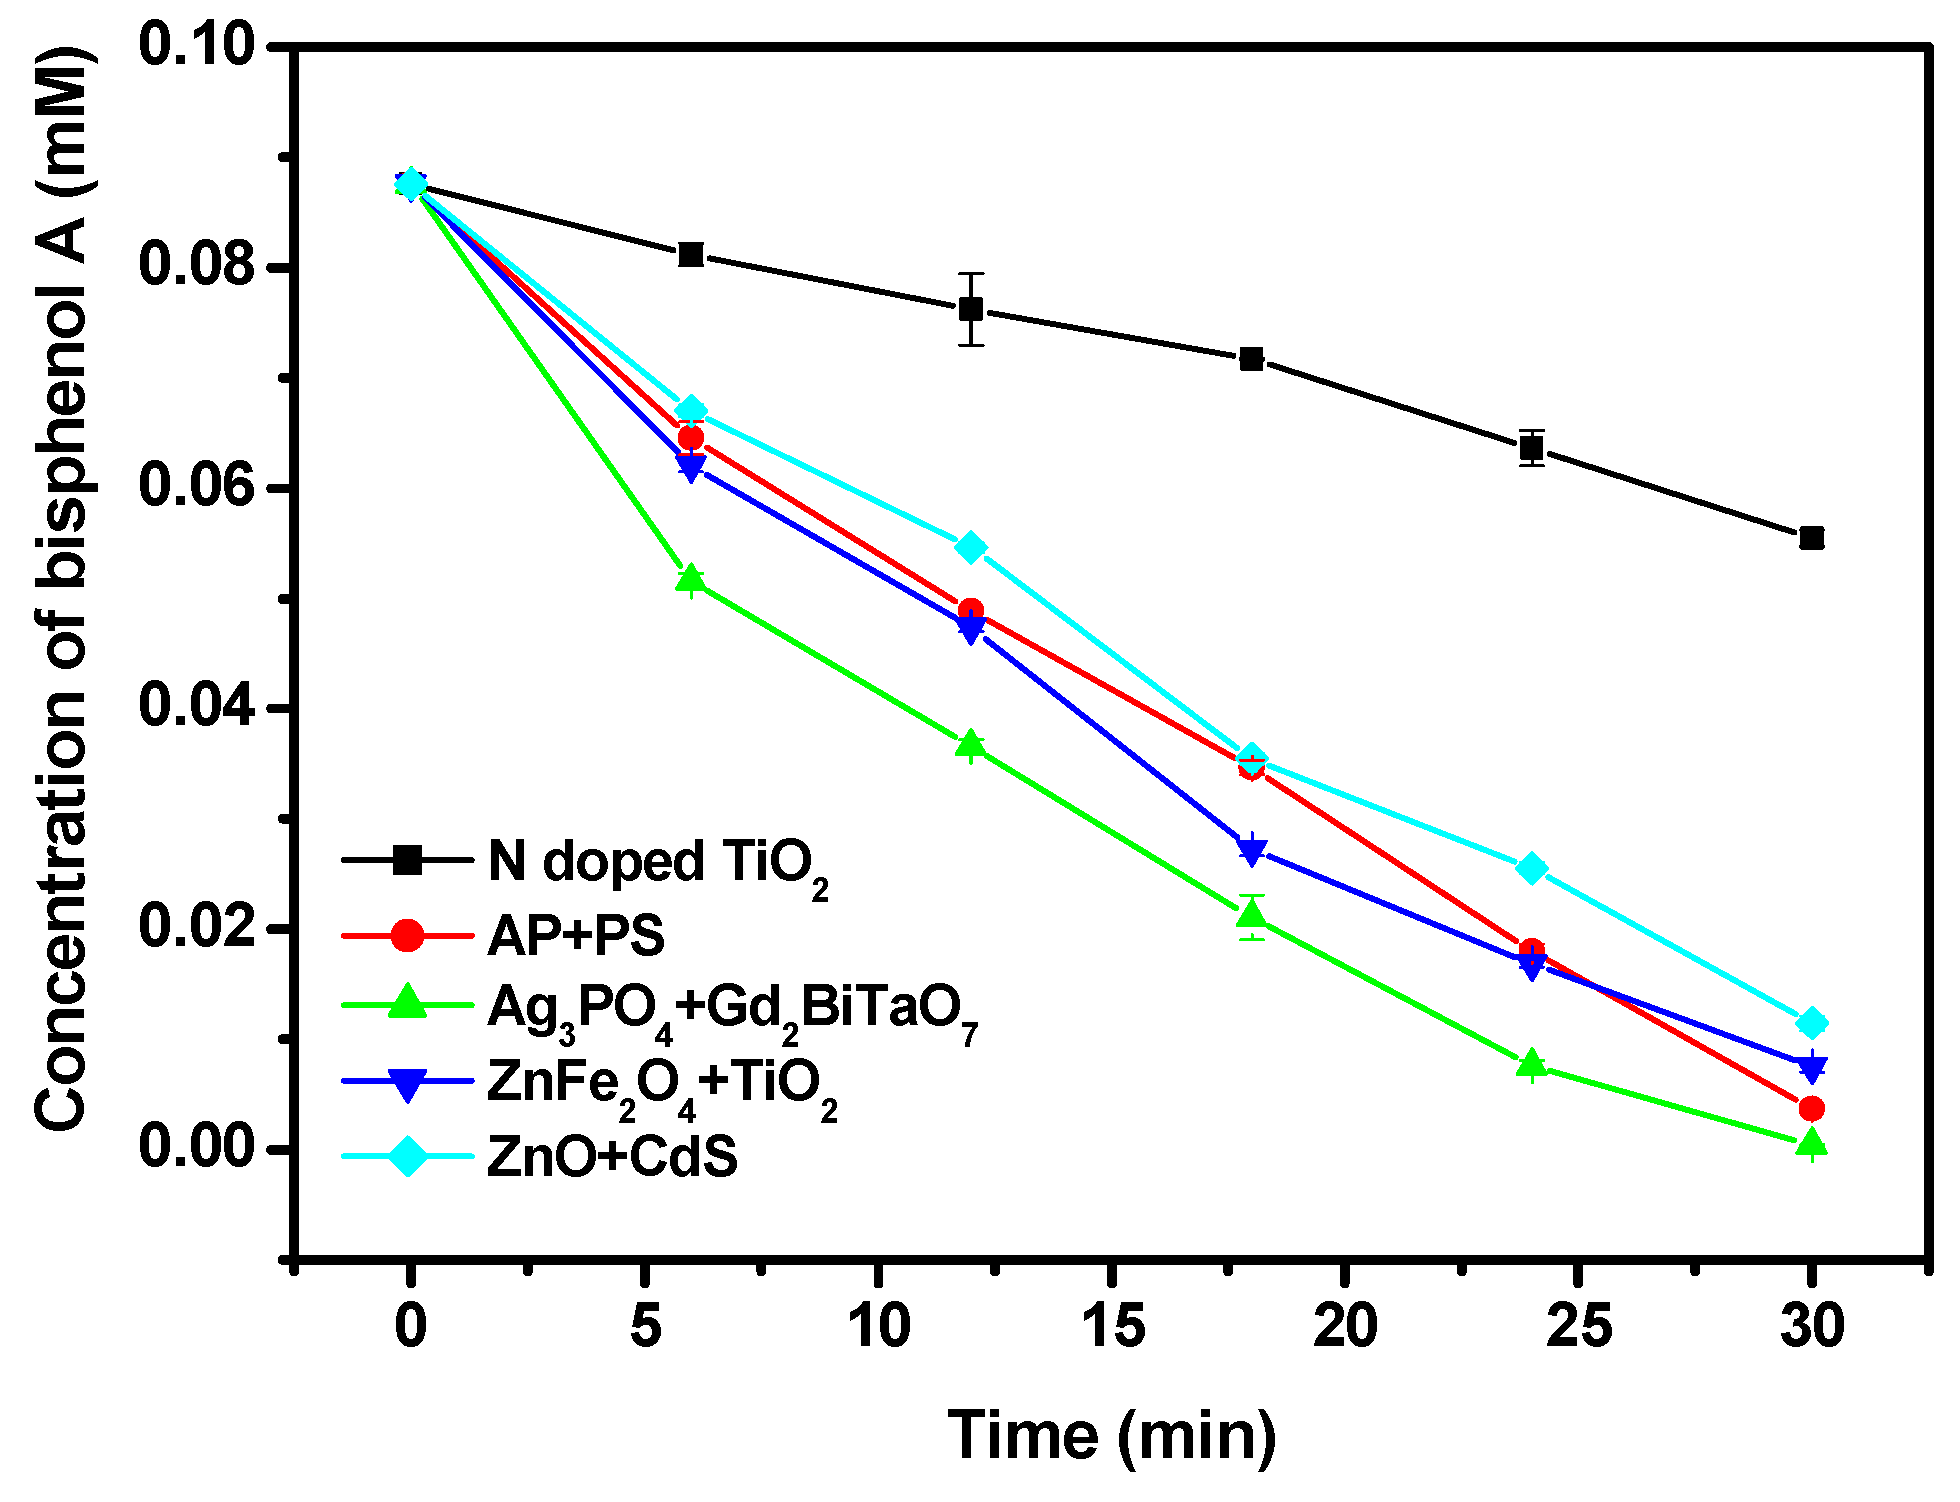
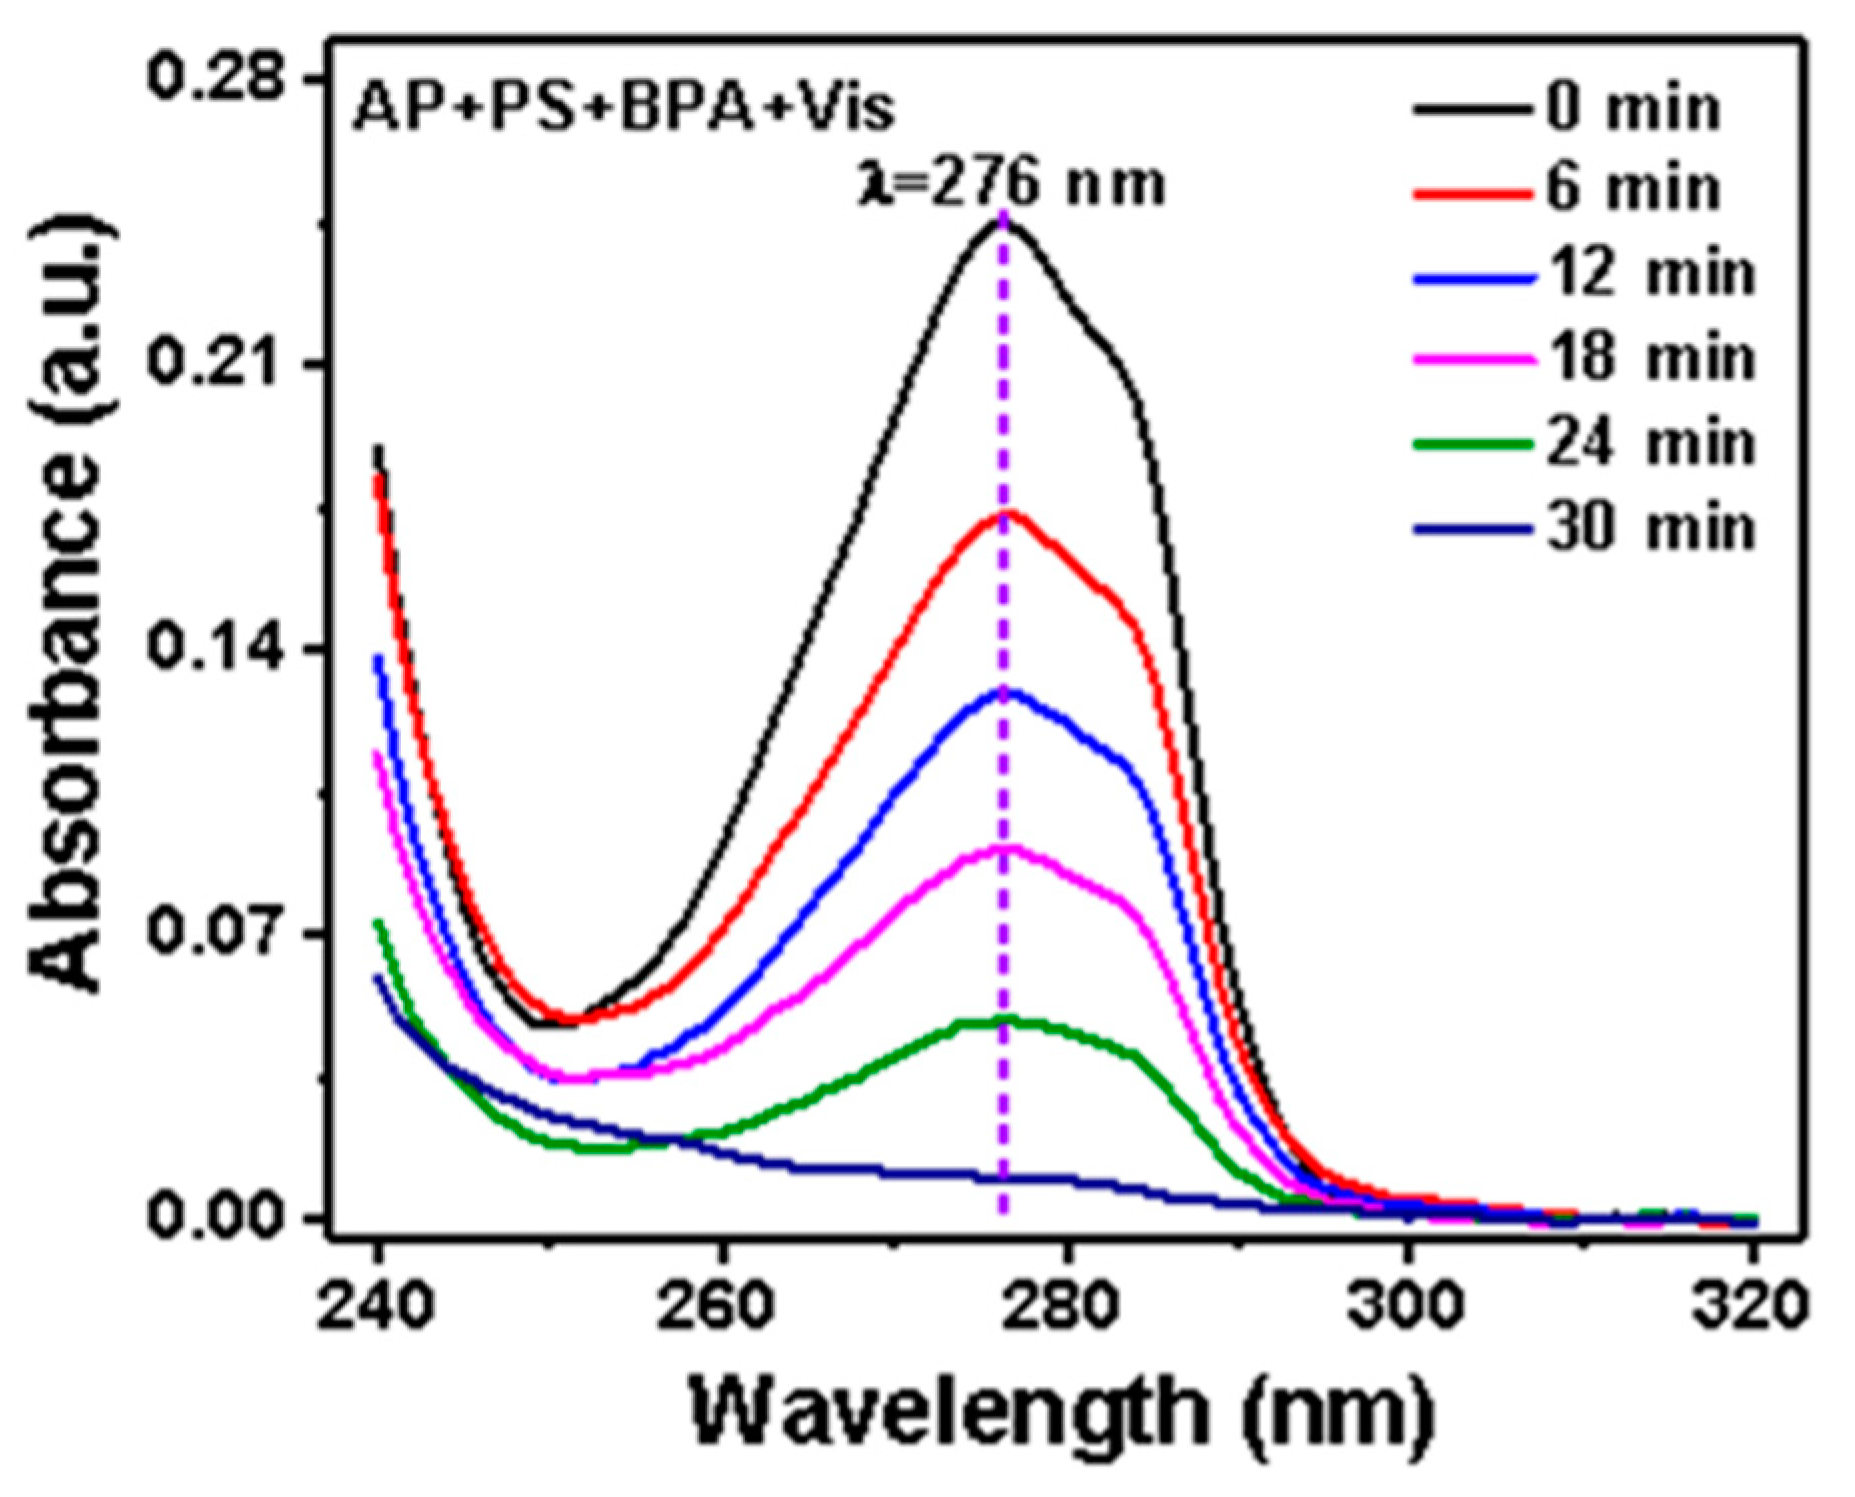
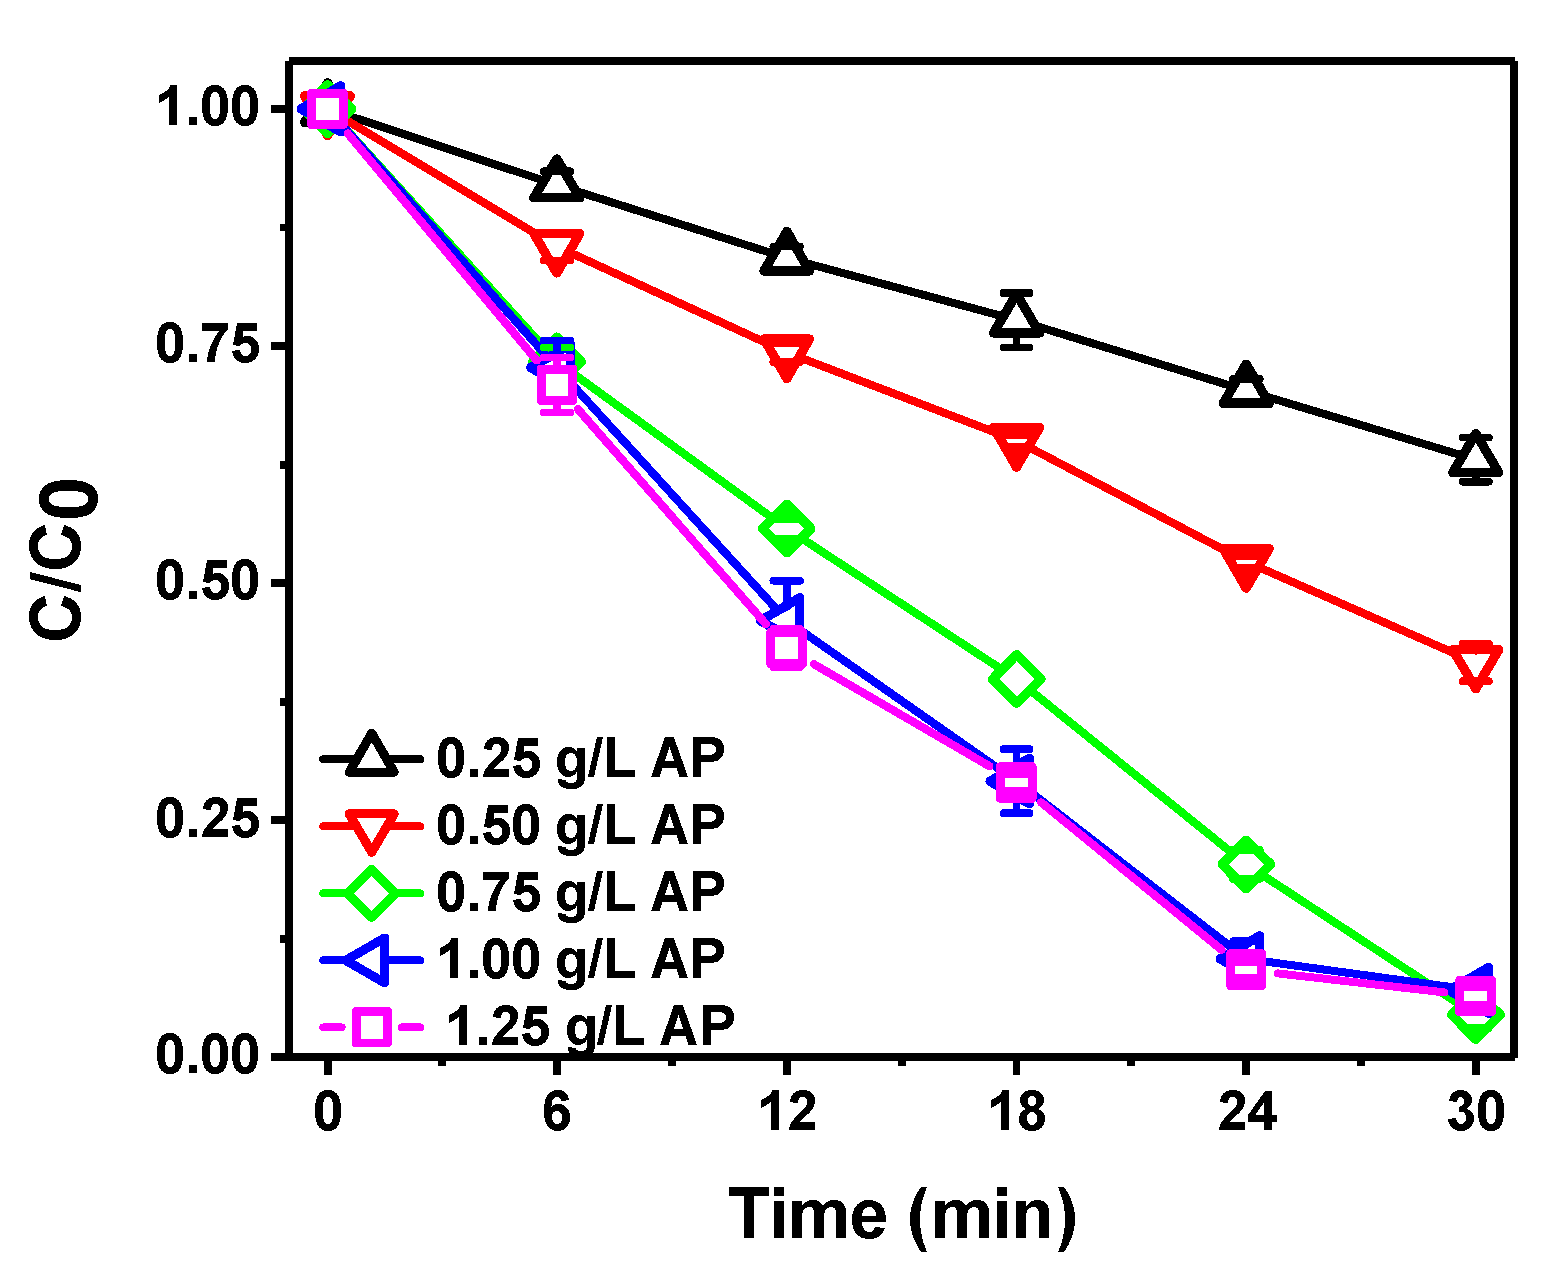
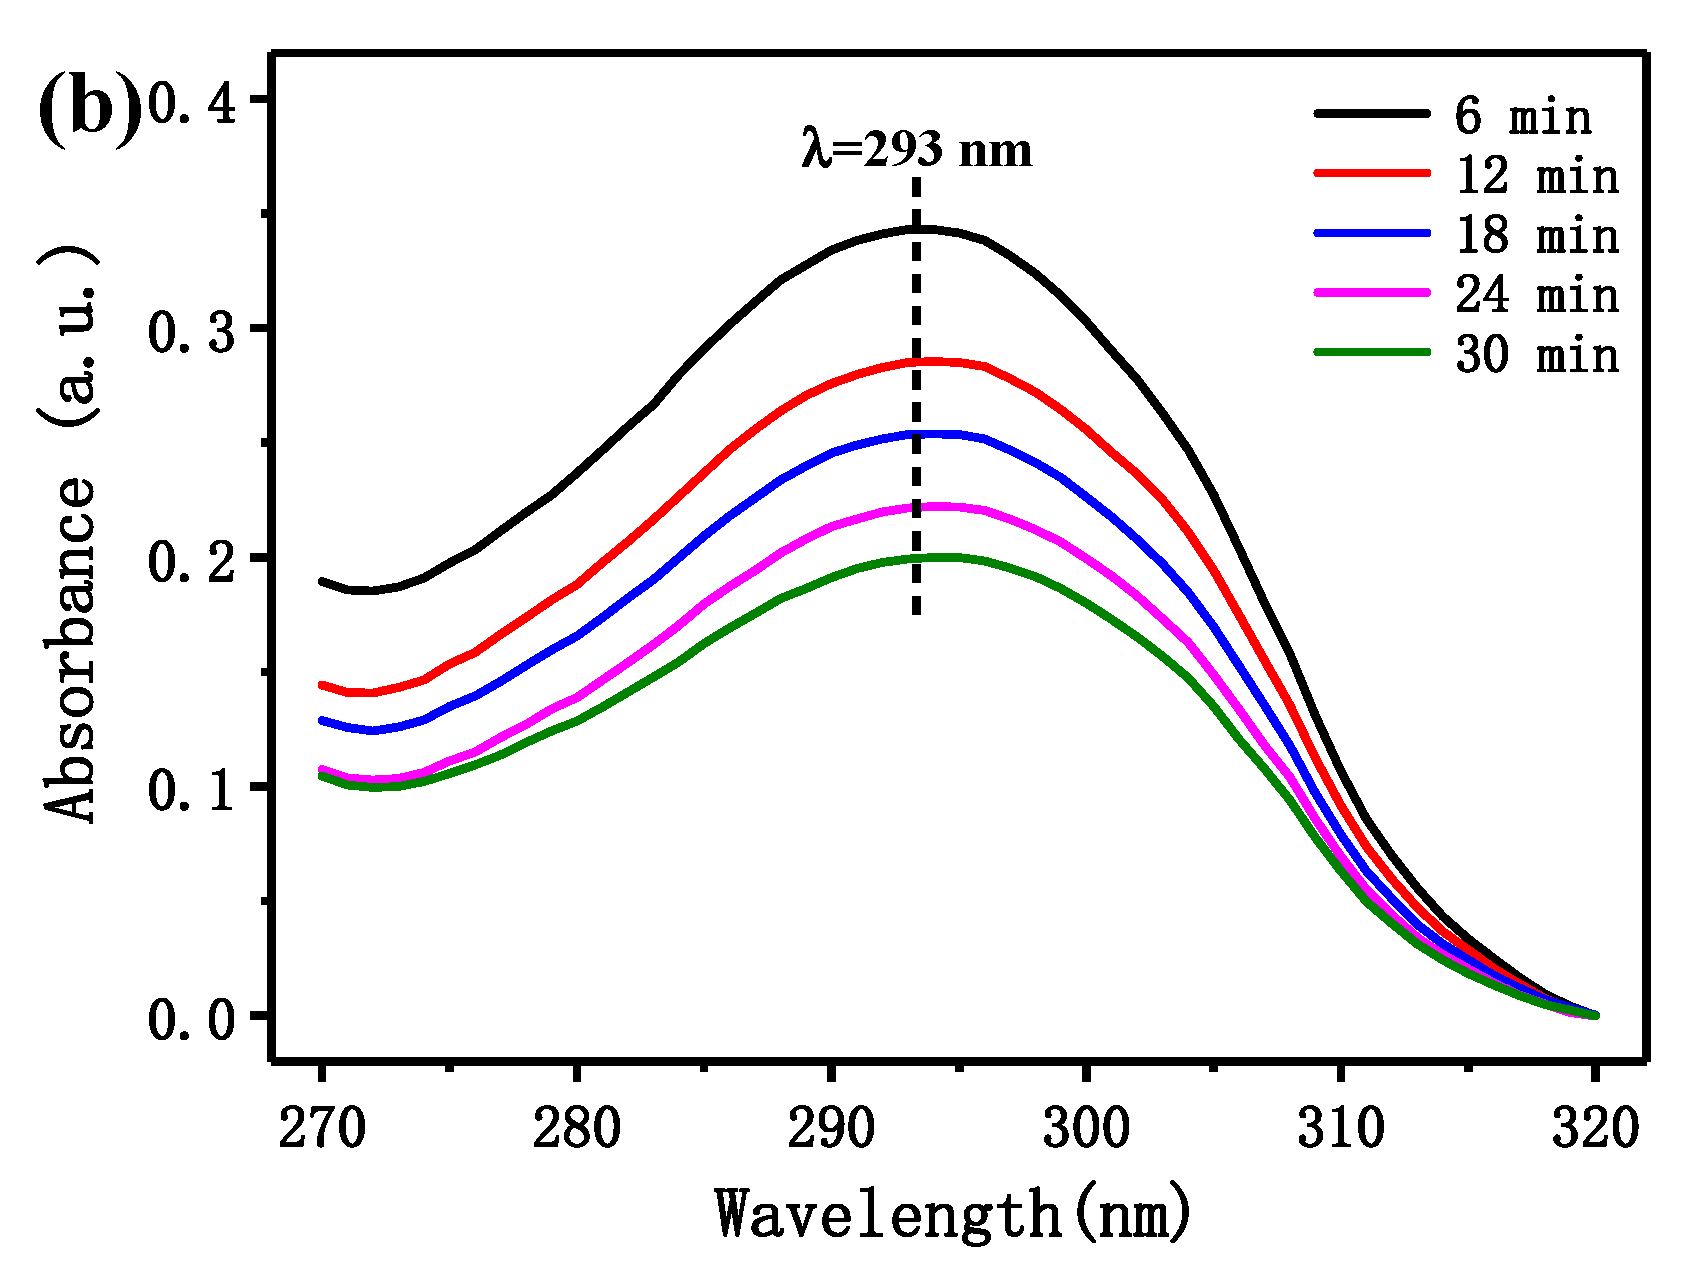
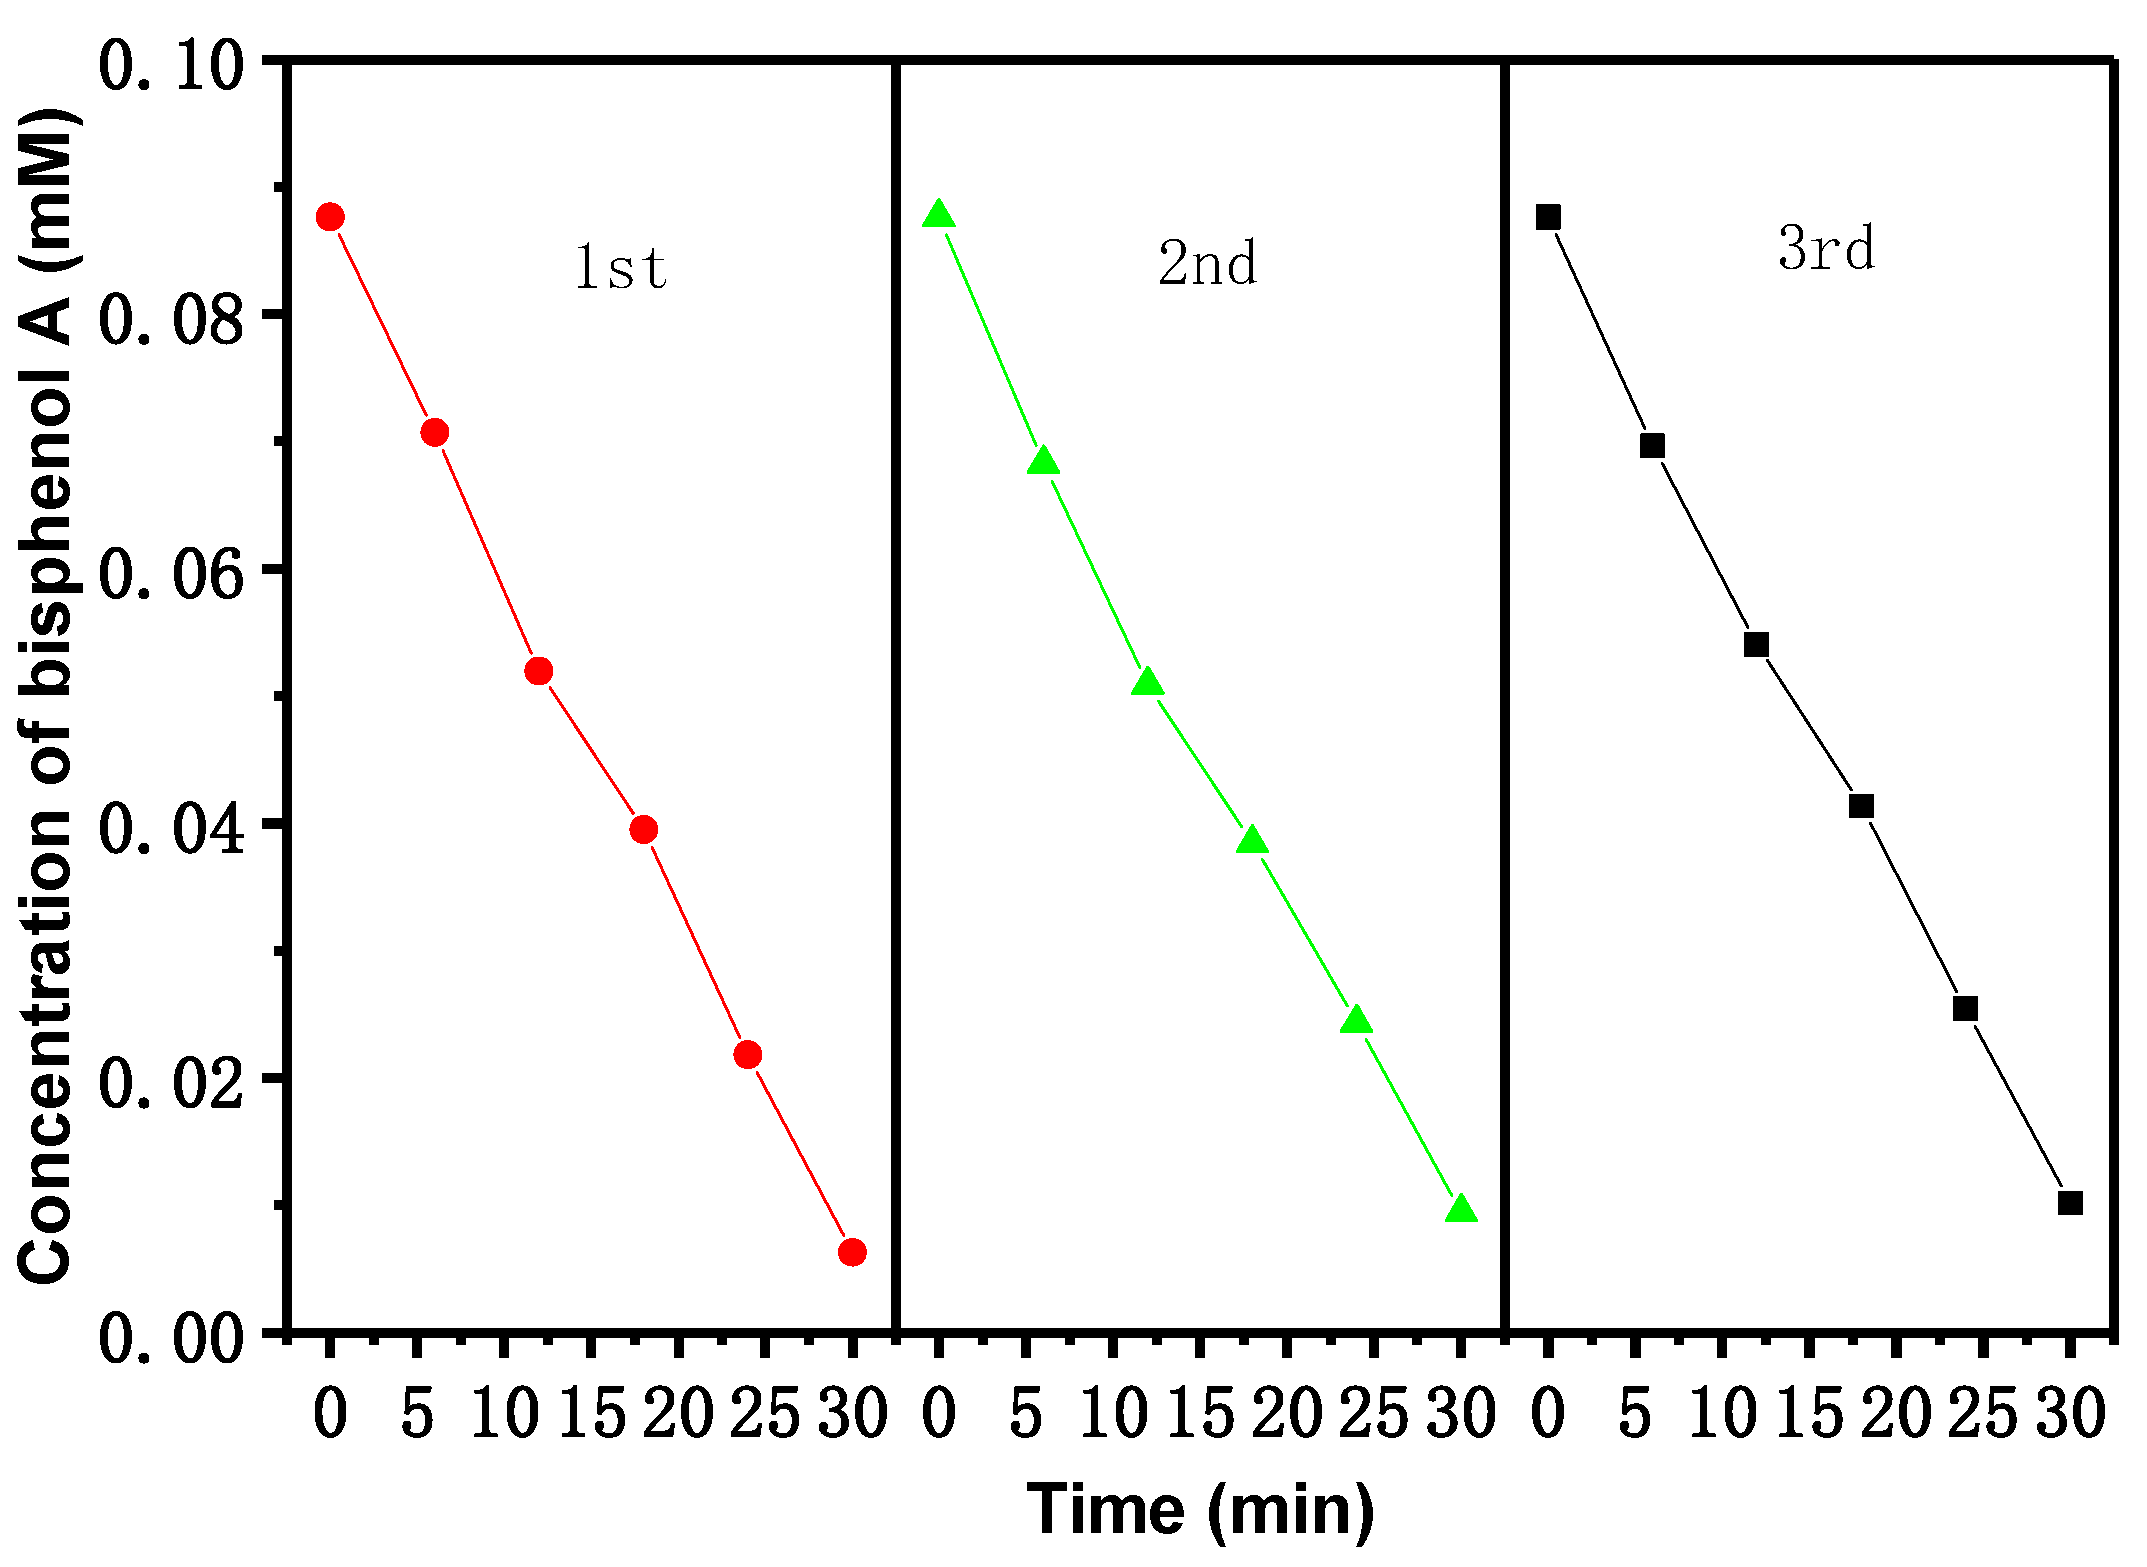
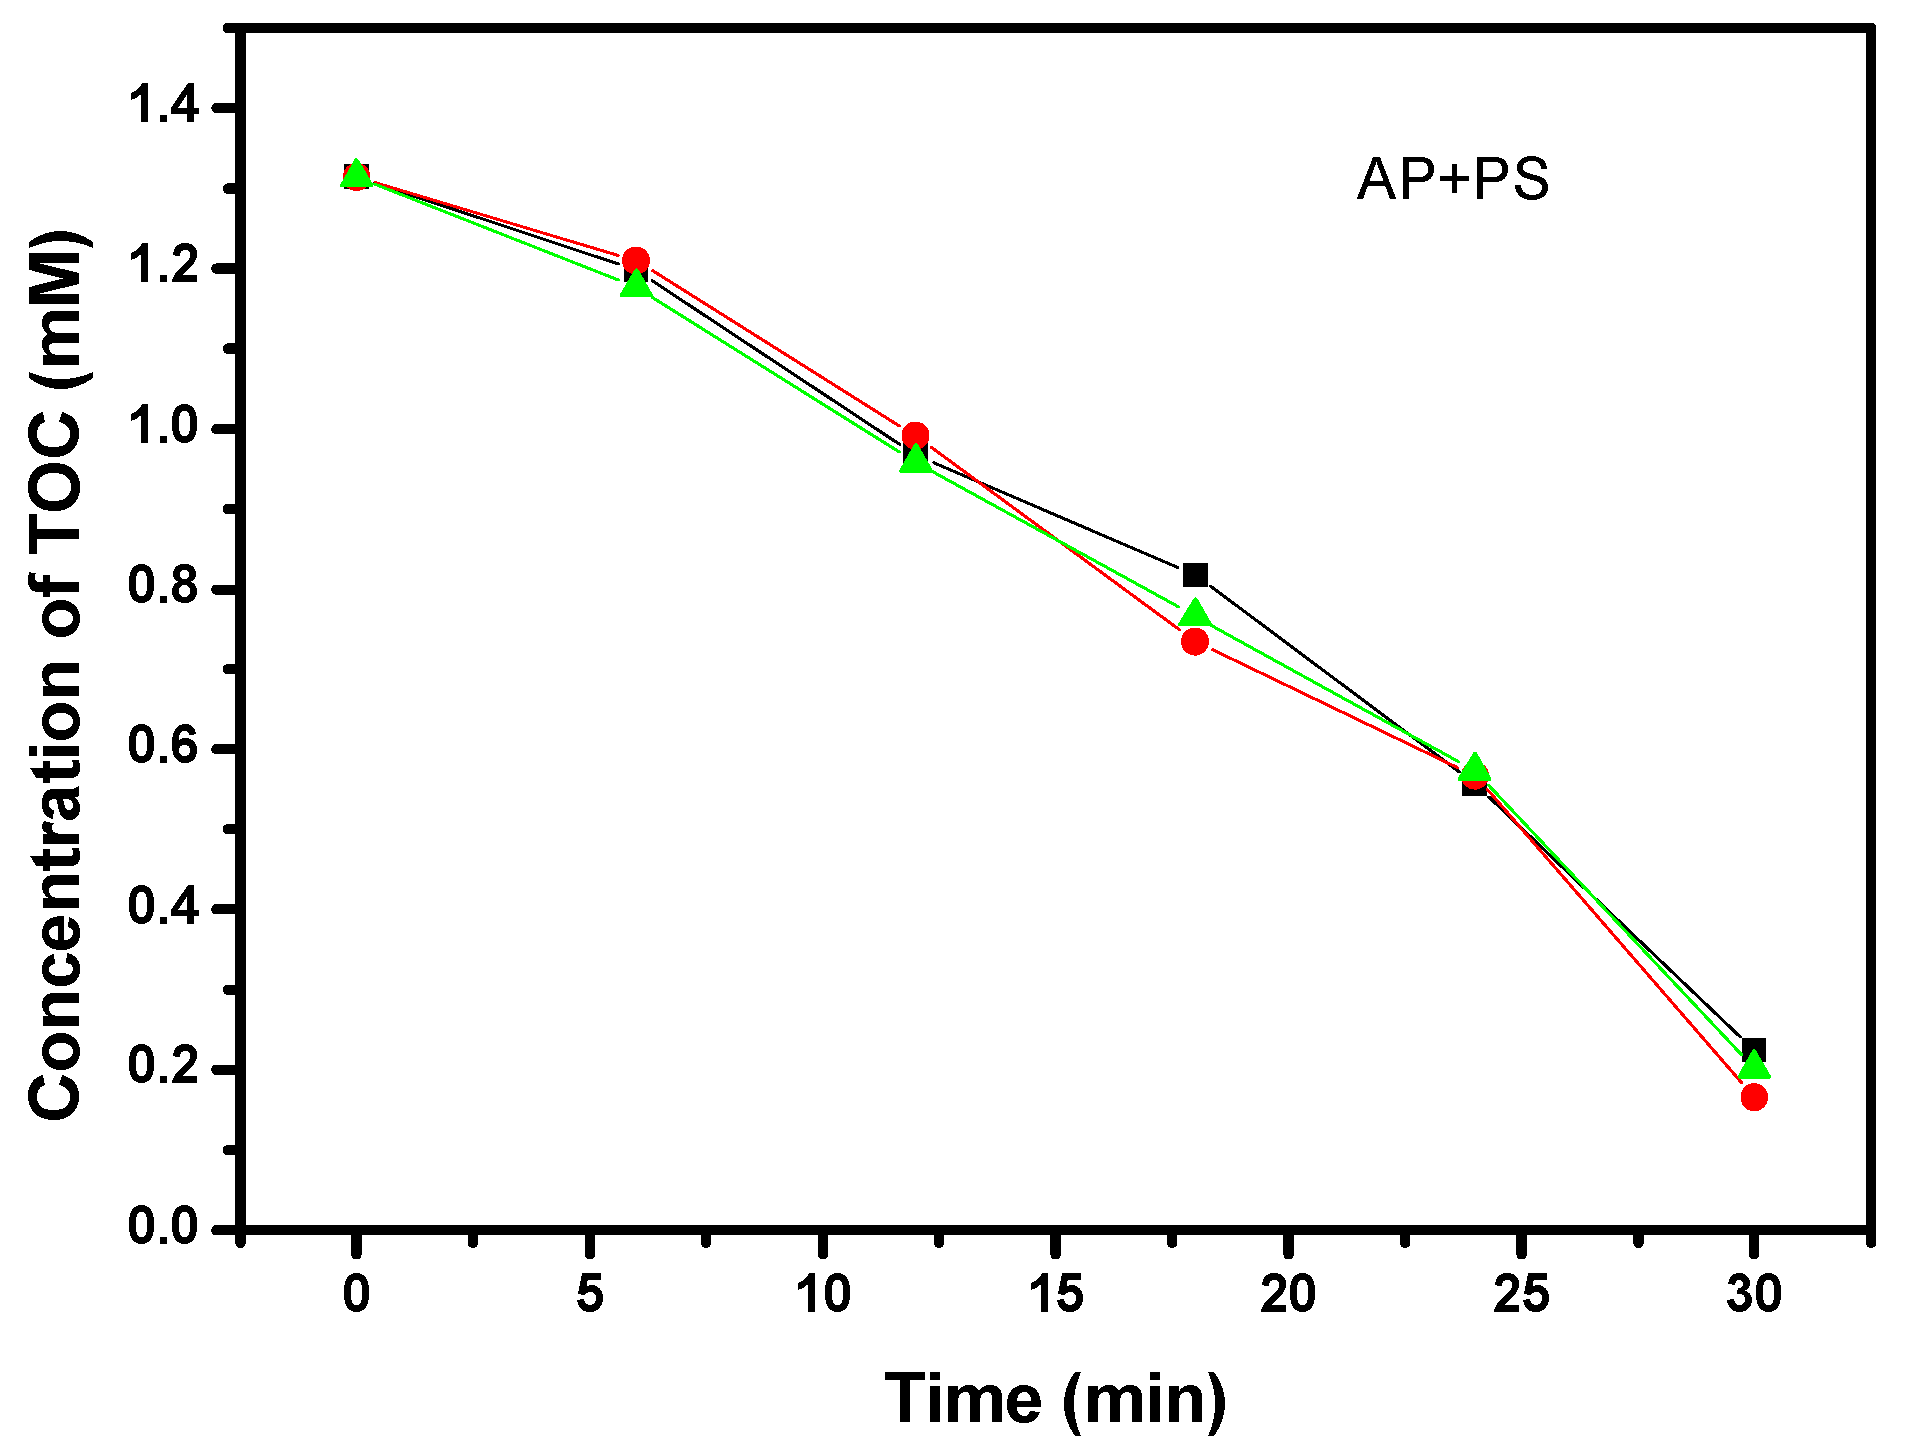
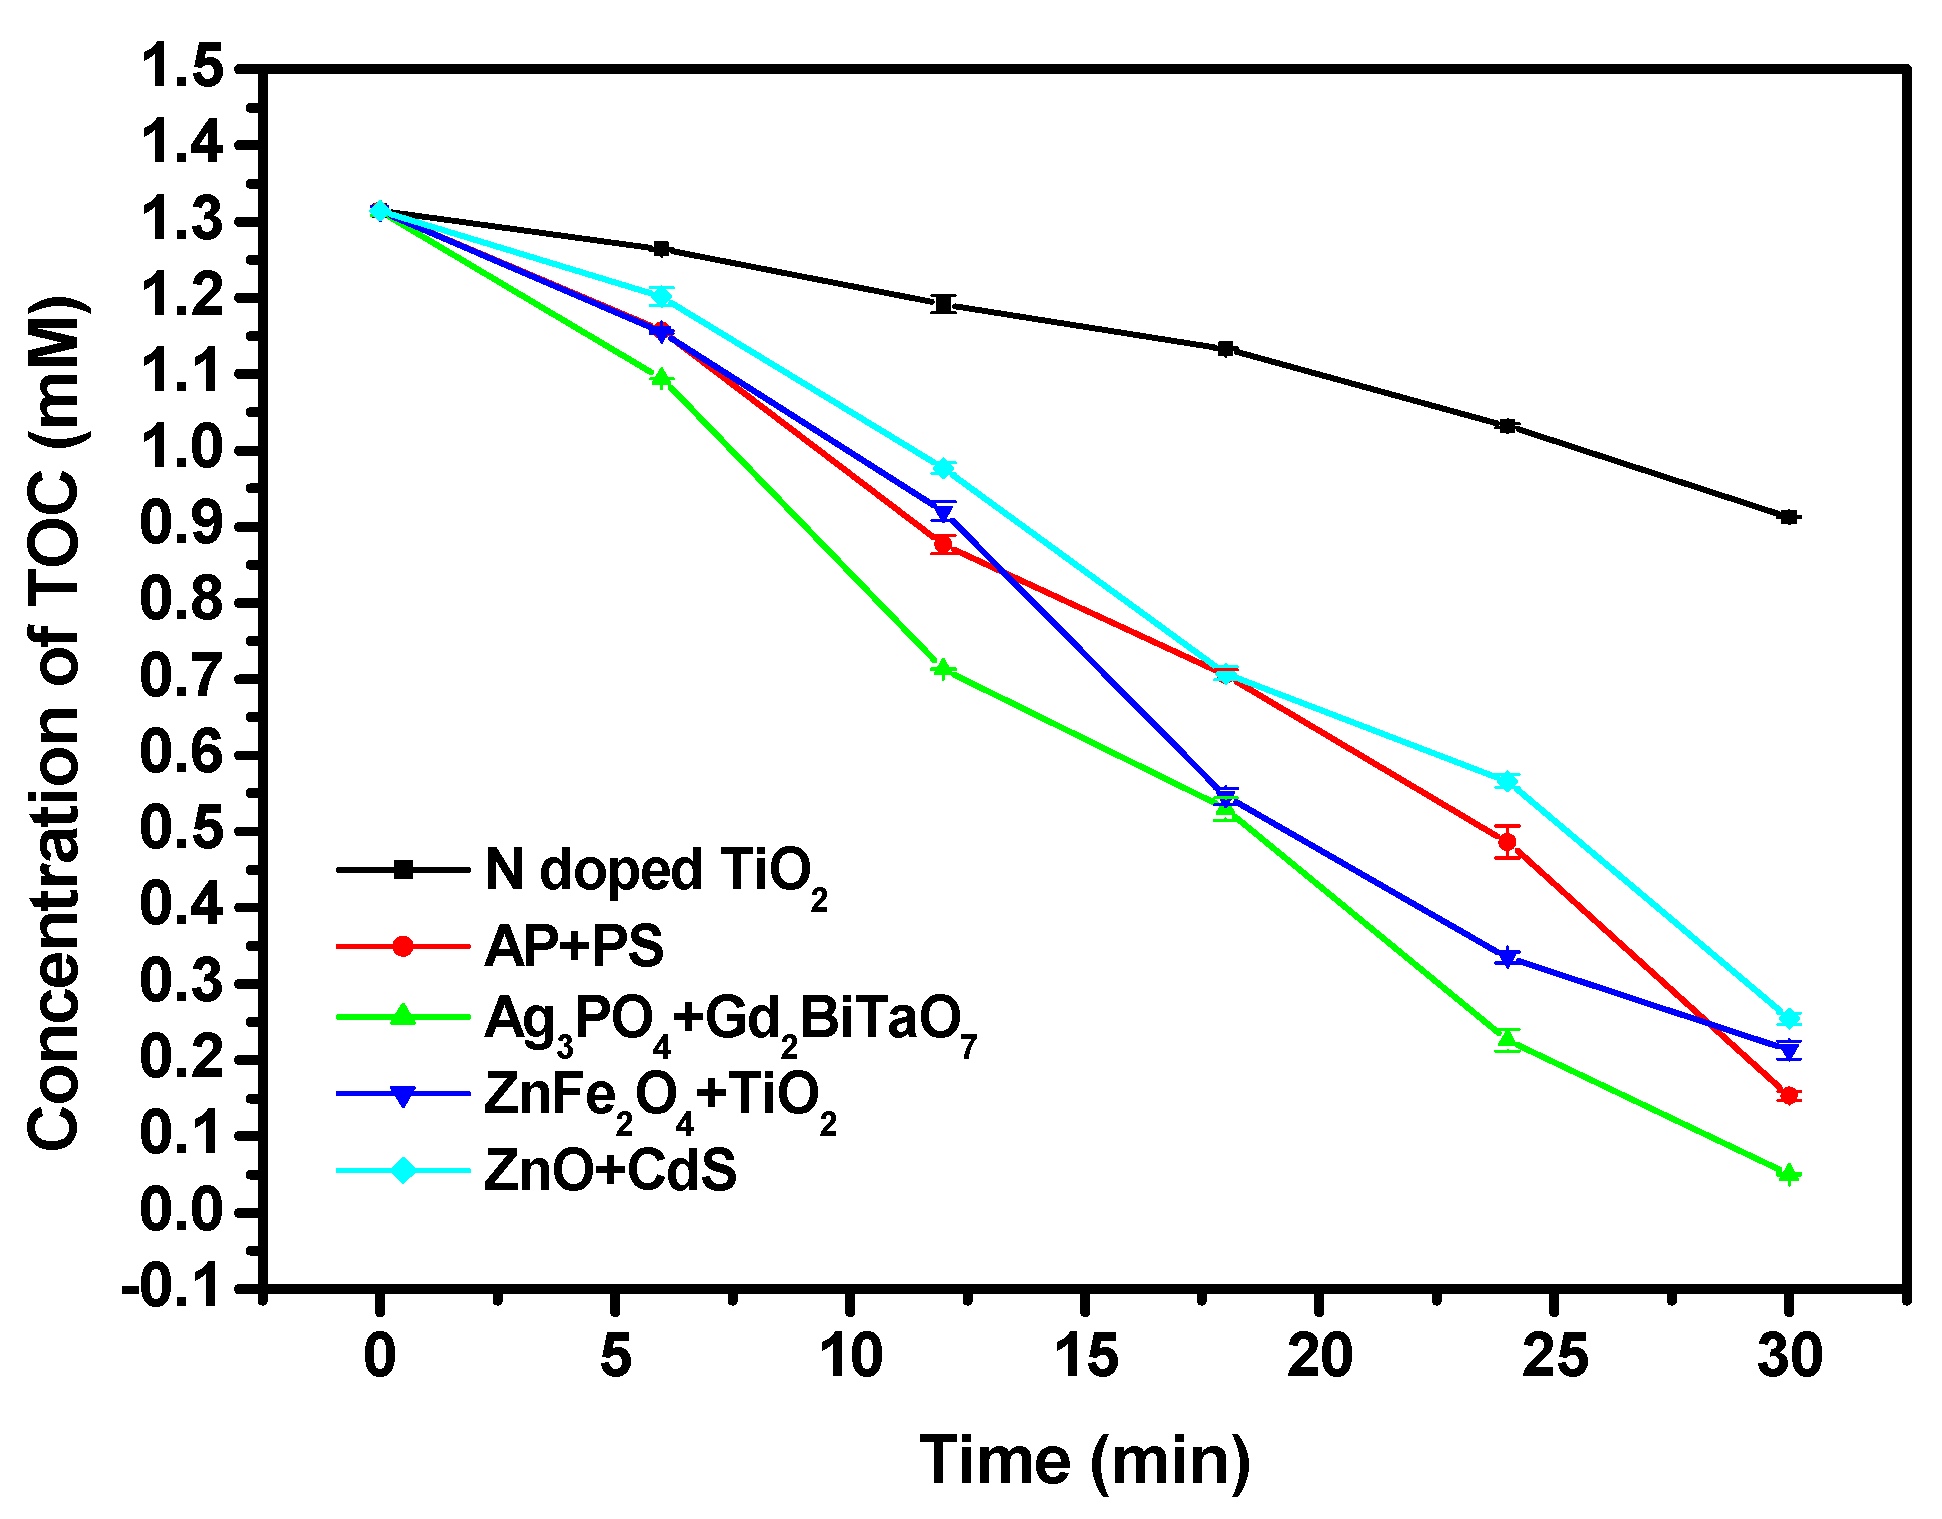
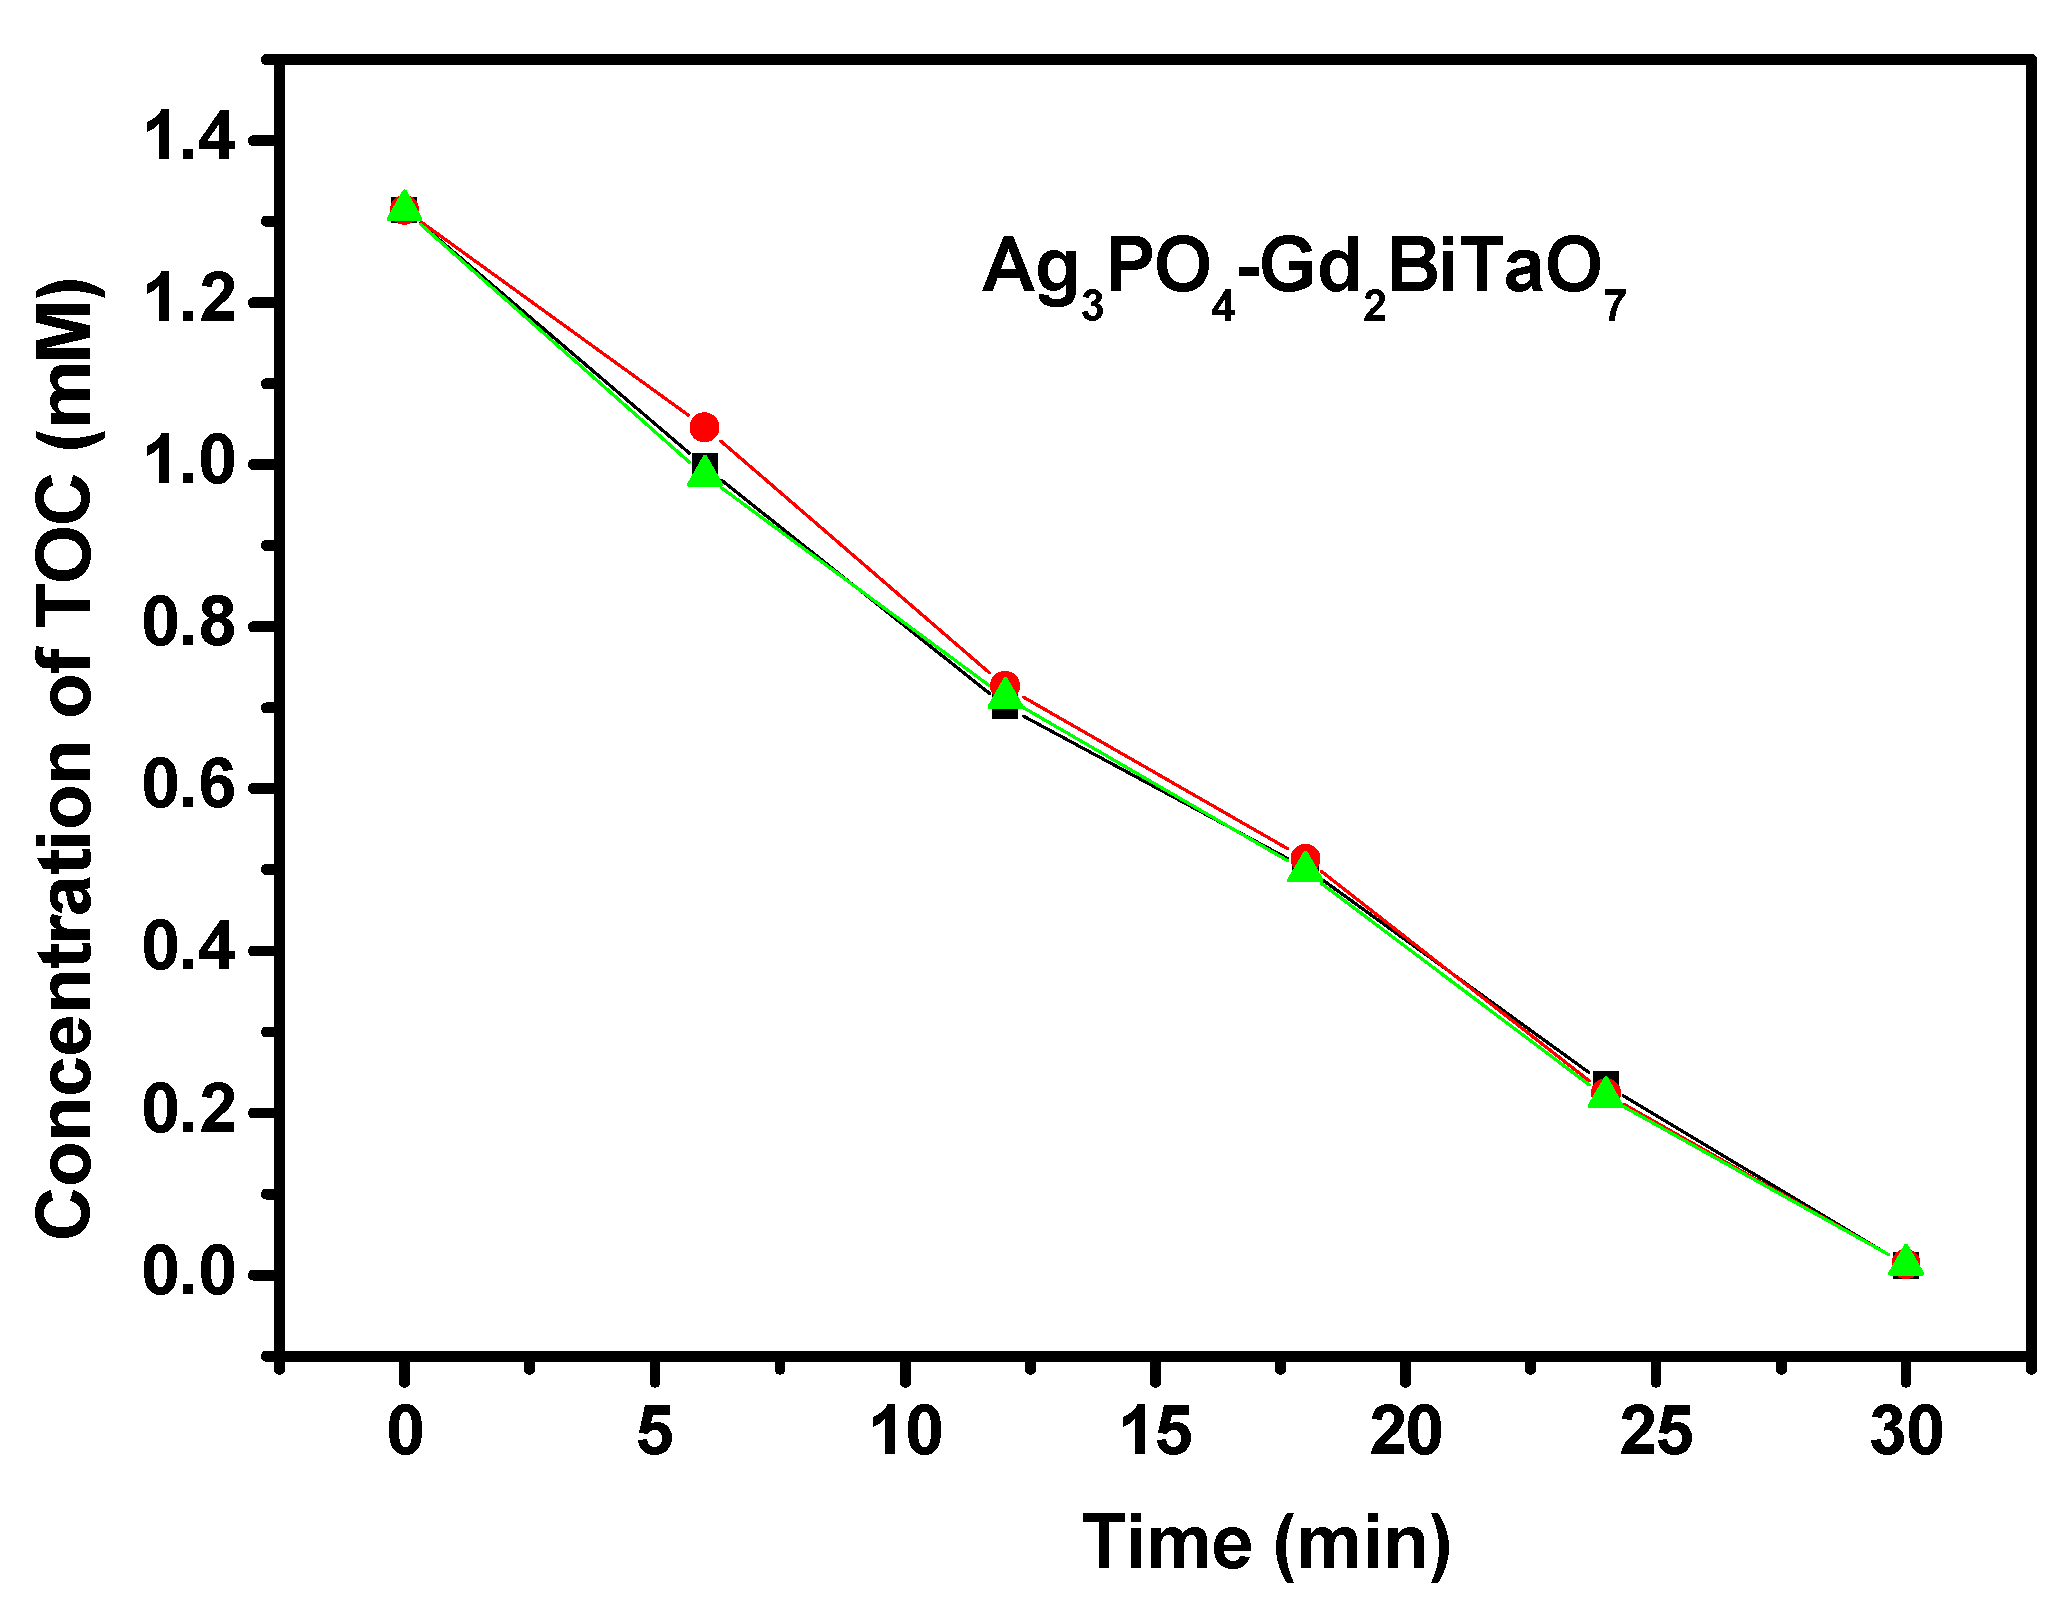
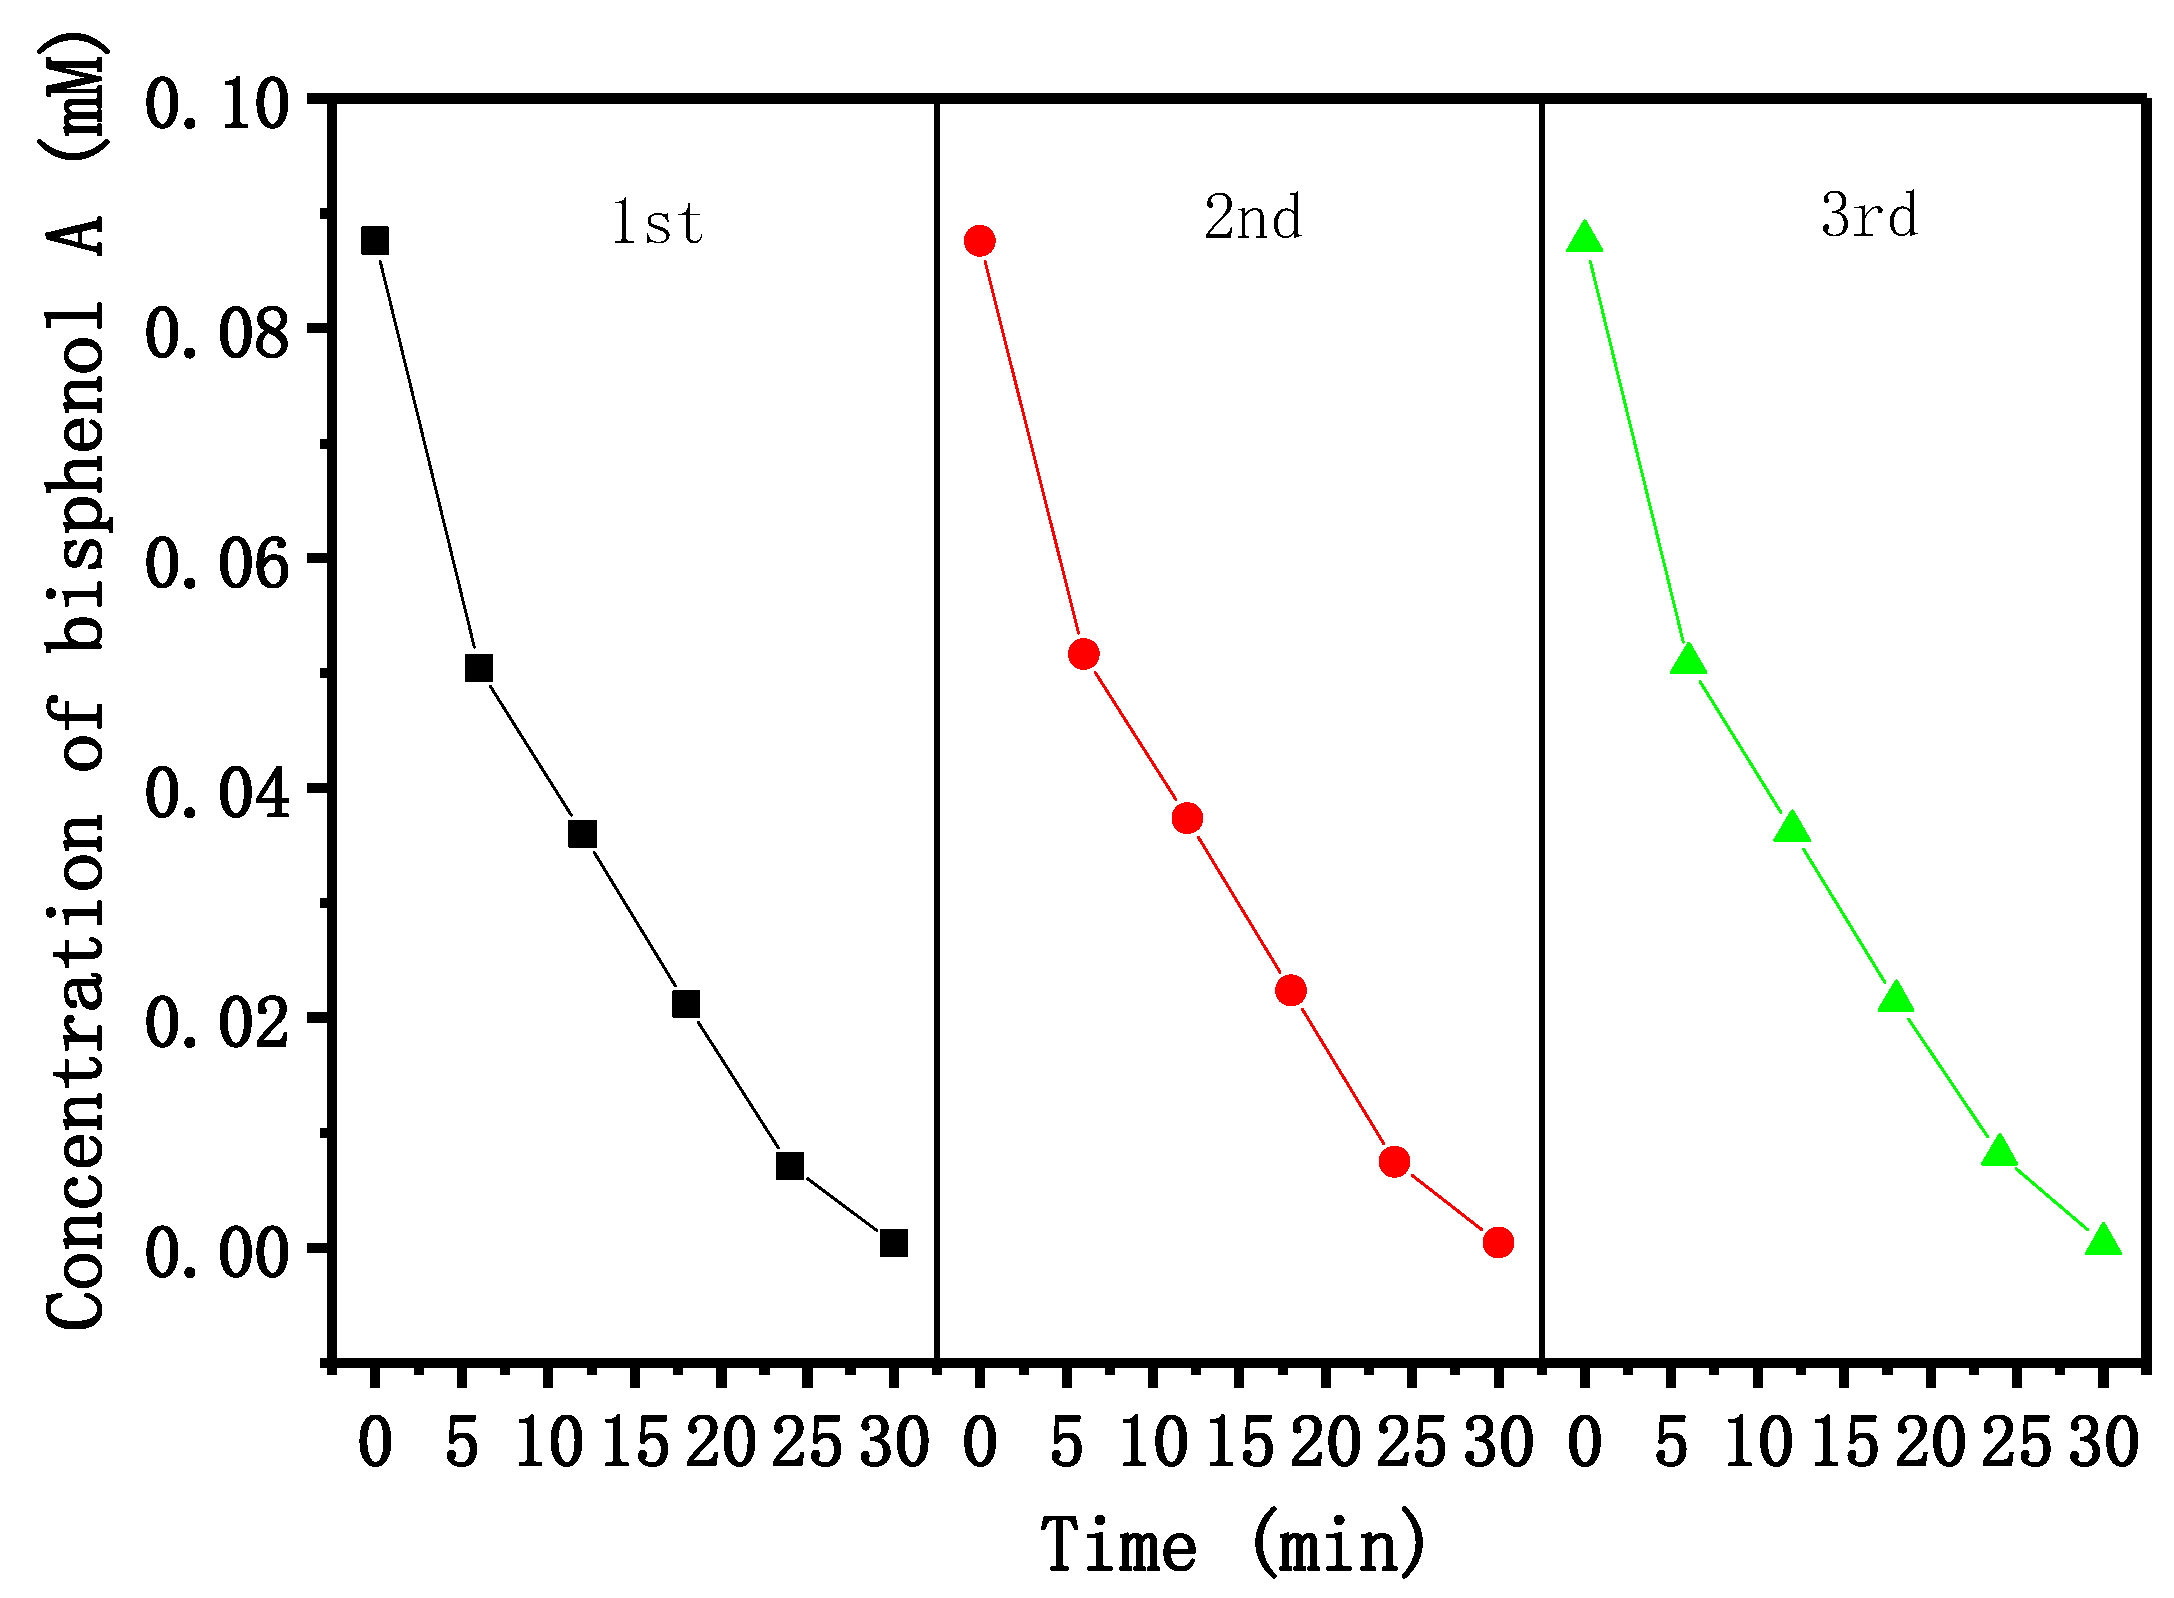
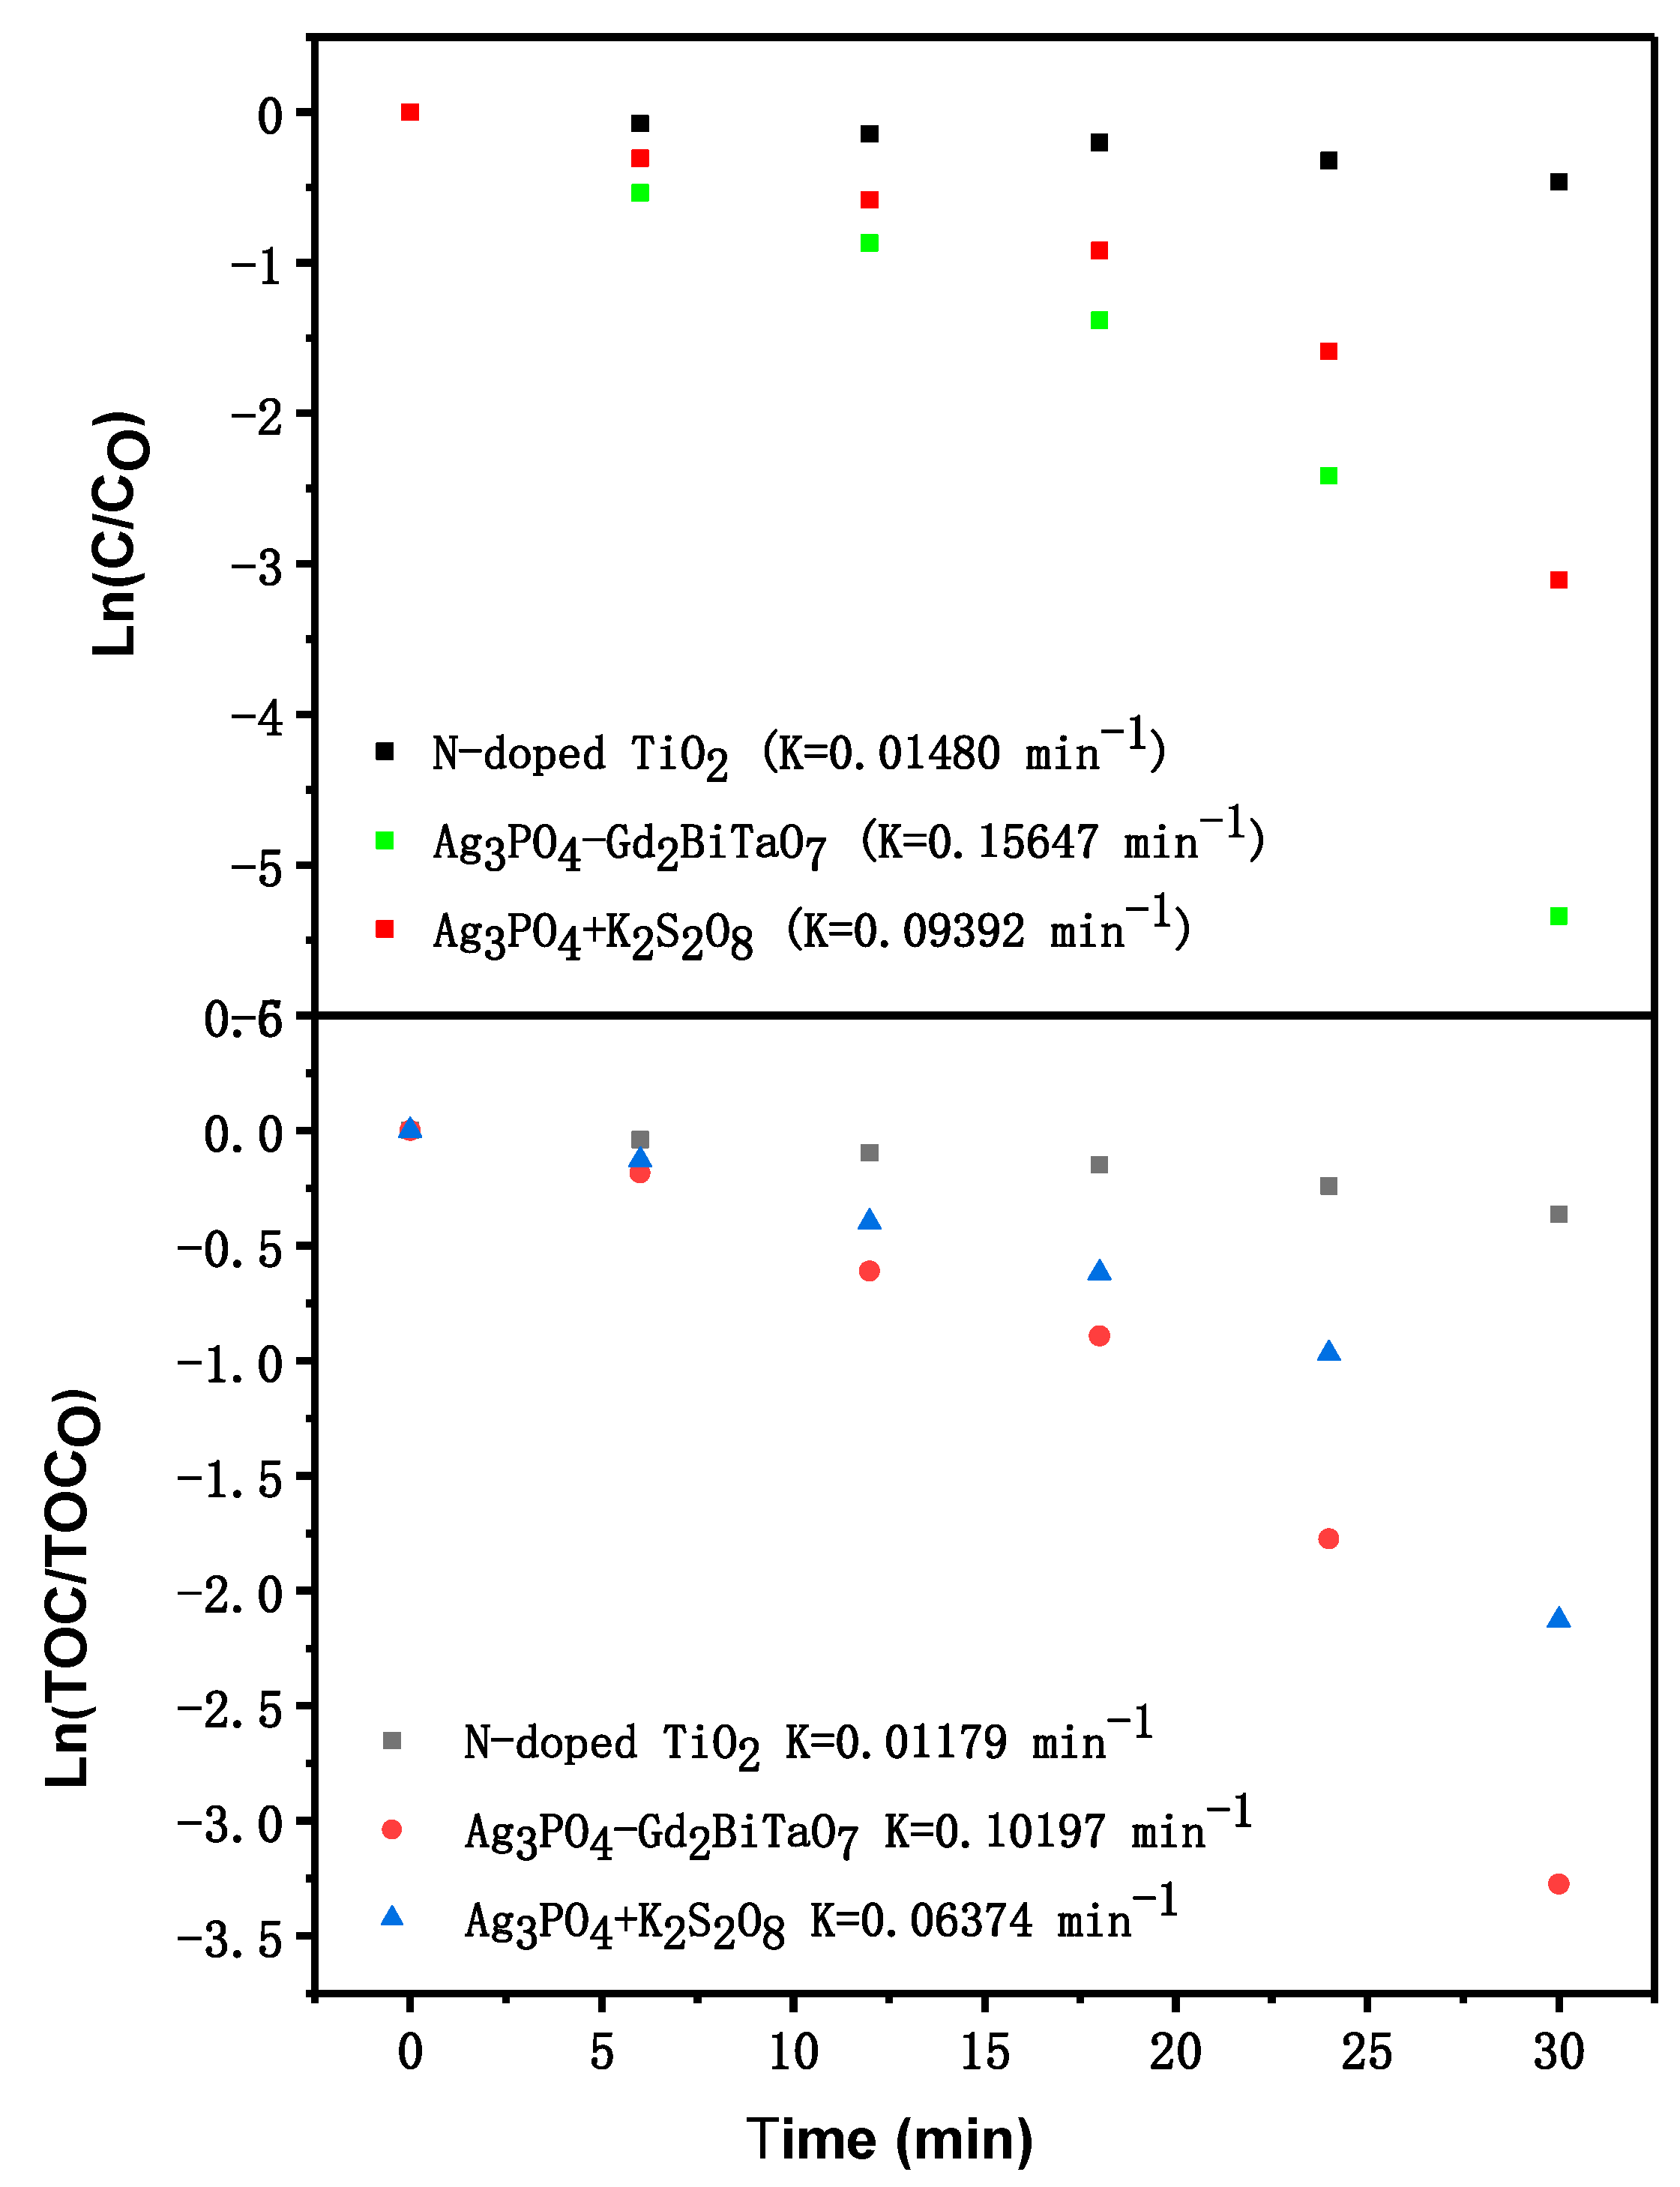
2.4. Photocatalytic Activity

For further comparison, Figure S8a depicts the BPA concentration changes with AP and PS as catalysts under different reaction conditions. It could be seen from Figure S8a that after 30 min of VLI, the degradation efficiency of BPA with AP and PS as catalysts reached 95.53%. Figure S8a indicated that the removal rate of BPA without any catalyst after VLI of 30 min was estimated to be 0%. After 30 min of VLI without any catalyst, the concentration of BPA did not change. Using potassium persulfate as a catalyst, the concentration of BPA changed slightly after 30 min in darkness, and the removal rate of BPA was 0.44%. With potassium persulfate as a catalyst, the degradation removal rate of BPA changed slightly after VLI for 30 min, and the removal rate of BPA was 0.70%. AP was used as a catalyst to degrade BPA under VLI, and as a result, the concentration of BPA decreased gradually with an increasing VLI duration, and the removal rate of BPA was 28.10% when the VLI duration reached 30 min. Using silver phosphate and potassium persulfate as catalysts, BPA was degraded under dark conditions and the removal rate of BPA was 56.10% after VLI for 30 min. Silver phosphate and potassium persulfate were used as catalysts for removing BPA under VLI, and as a result, the concentration of BPA decreased gradually with the increase in light time, and the removal rate of BPA was 95.53% when the VLI duration reached 30 min. The above results showed that the degradation efficiency of BPA with silver phosphate and potassium persulfate as catalysts was higher than that with AP as catalyst after VLI for 30 min. The removal rate of BPA with silver phosphate and potassium persulfate as catalysts was 3.40 times that with AP as a catalyst after VLI for 30 min. In addition, according to the change of the absorption spectrum of BPA with the irradiation time, the degradation kinetics of BPA with AP as a catalyst or with AP and PS as catalysts under VLI was calculated. Figure S8b shows the degradation kinetics of BPA with AP as a photocatalyst or with AP-PS as photocatalysts under VLI. The above results showed that the photocatalytic kinetics curve of BPA with AP as a photocatalyst to degrade BPA conformed to first-order kinetics. The first-order rate constant for the degradation of BPA under VLI with AP as a catalyst was 0.01117 min−1, the first-order rate constant for the degradation of BPA under dark conditions with AP and PS as catalysts was 0.02644 min−1 and the first-order rate constant for the degradation of BPA with AP and PS as photocatalysts under VLI was examined to be 0.09461 min−1. Figure 6 shows the UV-Vis absorption spectrum changes of BPA under VLI when AP-PS are present. It could be clearly seen from Figure 6 that the characteristic peak of BPA was located at 276 nm. A significant decrease in the absorbency value intensity could be observed within 30 min.
Figure 7 shows the effect of different concentrations of AP on the photocatalytic removal efficiency of BPA with AP as a photocatalyst under VLI. It could be seen from Figure 7 that the degradation efficiency of BPA with 1.0 g/L AP as a catalyst was higher and the degradation rate was 92.39% within 30 min of VLI, while the degradation efficiency of BPA with 0.25 g/L AP as a catalyst was 36.97%, which was the lowest. The results derived from Figure 7 indicate that the removal rate of BPA gradually increased in the same illumination time when increasing the AP concentration. It could be seen from Figure 7 that the degradation rate of BPA with 1.25 g/L AP as a photocatalyst was 93.20%, which was basically the same as the degradation rate of BPA with 1.0 g/L AP as a photocatalyst within 30 min of VLI. Figure S9 shows the observed kinetic plots for the PDB with AP as a photocatalyst under VLI. It could be found from Figure S9 that the first-order rate constant for PDB under VLI with 0.25 g/L AP as a catalyst was 0.01522 min−1; moreover, the first-order rate constant for PDB under VLI with 0.50 g/L AP as a catalyst was 0.02055 min−1. Figure S9 also depicted that the first-order rate constant for PDB under VLI with 0.75 g/L AP as a catalyst was 0.09461 min−1. Furthermore, the first-order rate constant for PDB under VLI with 1.00 g/L AP as a catalyst was 0.09338 min−1. The above results proved that the removal rate of organic pollutants increased gradually with the increase in the catalyst concentration under the same VLI duration. When the concentration of AP increased from 0.25 g/L to 0.75 g/L, the removal rate of BPA increased rapidly. When the concentration of AP increased from 0.75 g/L to 1.0 g/L, the removal rate of BPA increased slowly. When the AP concentration was higher than 1.0 g/L, the removal rate of BPA could not be improved, thus 1.0 g/L of the AP concentration was saturated. When the concentration of the AP dosage reached 1.0 g/L, the removal rate of BPA was close to saturation, thus the best dosage of AP was 1.0 g/L.
Figure 8 shows the effect of different anions on the degradation efficiency of BPA with AP-PS as photocatalysts under VLI. AP-PS were used as catalysts for degrading BPA in PW under VLI. In order to investigate the effect of anions on the photocatalytic reaction, ultrapure water that contained anions was added to the photocatalytic reaction system to simulate the wastewater environment. As can be seen from Figure 8, the concentration of BPA in PW gradually decreased with the gradual increase in illumination time. The results derived from Figure 8 indicate that the removal rate of BPA in PW was 95.54% with AP-PS as photocatalysts after 30 min of illumination under VLI. Moreover, the removal rate of BPA in PW was 43.40% when adding 1 mM Cl within the PW with AP-PS as photocatalysts after 30 min of illumination under VLI, while the removal rate of BPA in PW was 90.94% when adding 1 mM NO3 within the PW with AP-PS as photocatalysts after 30 min of illumination under VLI. The removal rate of BPA in PW was 58.10% when adding 1 mM CO32− and the removal rate of BPA in PW was 91.33% when adding 1 mM SO42− with AP-PS as photocatalysts after 30 min of illumination under VLI. It could be found from Figure 8 that the NO3 anion showed a weak promoting effect on the PDB during the VLI duration from 15 min to 20 min. The above results indicated that the most potent inhibitor for BPA degradation was found to be a Cl anion, and the removal rate of BPA without adding any anions was 2.2 times the removal rate of BPA when adding 1 mM Cl with AP-PS as photocatalysts after 30 min of illumination under VLI. The reason was that Cl consumed the OH and the photogenerated holes in the reaction system, and as a result, the amount of OH and the photogenerated holes within the system was reduced, and the above results caused the greatest negative effect on the degradation of BPA [69,70,71]. The reason for the higher inhibitory effect of NO3 or SO42− on the degradation of BPA was that NO3 or SO42− consumed the photogenerated holes within the reaction system [70,71,72].
Figure 9 shows the effect of different cations on the degradation efficiency of BPA with AP-PS as photocatalysts under VLI. In order to investigate the effect of cations on the photocatalytic reaction, ultrapure water that contained cations was added to the photocatalytic reaction system to simulate the wastewater environment. The results in Figure 9 indicate that AP-PS were used as catalysts to degrade BPA in PW under VLI. As can be found in Figure 9, the concentration of BPA in PW gradually decreased with the gradual increase in VLI duration. Figure 9 indicated that the removal rate of BPA in PW was 95.54% after VLI of 30 min with AP-PS as photocatalysts under VLI. Moreover, the removal rate of BPA in PW was 93.20% by adding 1 mM Mg2+, the removal rate of BPA in PW was 95.10% by adding 1 mM Zn2+ and the removal rate of BPA in PW was 93.60% by adding 1 mM Ba2+ with AP-PS as photocatalysts under VLI. Cations did not significantly inhibit the PDB compared with the removal rate of BPA, without adding any additional cations and with AP-PS as photocatalysts under VLI.
Figure 10a shows the DMPO spin trapping EPR spectra with AP as a catalyst in an aqueous dispersion for DMPO/OH and D DMPO/O2 under VLI or under conditions of darkness. In order to further confirm the presence of O2 and OH in the procedure of PDB, EPR characterization was performed, and DMPO spin-trapping EPR spectra with AP as a photocatalyst under VLI were shown in Figure 10a. During the EPR characterization process, 5,5-dimethyl-1-pyrroline N-oxide (DMPO) was utilized to spin trap the active radicals in the system for detection. As can be found in Figure 10a, when in darkness, EPR signals that were relevant to DMPO adducts were not detected for AP. However, after VLI for 30 min, there were apparent signals in Figure 10a, which correspond with DMPO/OH adducts [62]. Figure 10b shows the DMPO spin trapping EPR spectra with AP-PS as catalysts or with AP as a catalyst in an aqueous dispersion for DMPO–SO4•−, DMPO–OH and DMPO–O2 under VLI. In order to further confirm the presence of O2 and OH in the procedure of PDB, EPR characterization was performed, and DMPO spin-trapping EPR spectra with AP-PS as catalysts under VLI were shown in Figure 10b. During the EPR characterization process, DMPO was utilized to spin trap the active radicals in the system for detection. As can be seen from Figure 10b, when AP was utilized as a catalyst to degrade BPA, only the signal of OH was detected after 1.0 mM EDTA was used to capture h+ under VLI. After VLI for 30 min with AP-PS as photocatalysts, there were apparent signals as shown in Figure 10b, which corresponded with DMPO/OH adducts and DMPO/SO4•− adducts, respectively [73]. The above results indicated that the main oxidation radical was OH during the process of degrading BPA with AP-PS as photocatalysts under VLI.
Figure 11a shows the effect of different pH values on the removal efficiency of BPA with AP-PS as catalysts under VLI or with potassium persulfate as a catalyst under conditions of darkness. As can be seen from Figure 11a, AP-PS possessed the best degradation effect on BPA under VLI when PH = 3.5, 5.4, 7.4 and 8.4. The results derived from Figure 11a indicate that the degradation rate of BPA was 98.16%, 97.20%, 99.53%, 99.57% or 99.10% after 30 min of VLI when PH = 3.5, 5.4, 7.4, 8.4 or 10.9, respectively. Figure 11b shows the temporal spectral changes of aqueous solutions of BPA with AP-PS as catalysts under VLI at pH = 10.9. The results derived from Figure 11b indicate that the typical absorbance peak of BPA at 293 nm decreased with an increasing VLI duration.
Figure 12 shows the effects of different radical scavengers on the removal rate of BPA with AP-PS as catalysts under VLI. The different radical scavengers were separately added to the BPA solution at the beginning of the photocatalytic experiment to determine the active species during the process of degrading BPA. Isopropanol (IPA) was utilized to capture hydroxyl radicals (OH), benzoquinone (BQ) was used to capture superoxide anions (O2) and ethylenediaminetetraacetic acid (EDTA) was utilized to capture holes (h+). The scheming IPA concentration, BQ concentration or EDTA concentration was 0.15 mmol L_1, and the added amount of IPA, BQ or EDTA was 1 mL. Based on Figure 12, while IPA, BQ or EDTA were added to the BPA solution, the removal rate of BPA decreased by 71.90%, 32.86% or 85.26%, respectively, compared with the removal rate of BPA, which was derived from the control group. Thus, it could be concluded that OH, h+ and O2 were all active radicals during the degrading BPA process. It could be seen from Figure 12 that h+ in the BPA solution played a leading role when BPA was degraded with AP-PS as catalysts under VLI.
Figure 13 shows the concentration variation curves of BPA with AP-PS as catalysts under VLI for three cycles of degradation tests. According to Figure 13, AP-PS were utilized as catalysts to degrade BPA in PW under VLI. As can be seen from Figure 13, the concentration of BPA in PW gradually decreased with the gradual increase in VLI duration. The results derived from Figure 13 indicate that the removal rate of BPA for three cycles in PW was 92.80%, 89.20% and 88.40%, respectively, after 30 min of VLI. It could be found in Figure 13 that the removal rate of BPA decreased by 4.40% after three cycles of degradation tests. There was no significant difference for the degradation efficiency of BPA among the above three cycles of experiments, and the catalyst structure of AP or potassium persulfate was stable.
Figure 14 shows the concentration variation curves of total organic carbon during PDB with AP-PS as catalysts under VLI for three cycles of degradation tests. As can be seen from Figure 14, AP-PS were utilized as catalysts to degrade BPA in PW under VLI, and the concentration of the total organic carbon in PW decreased gradually with the gradual increase in VLI duration. The results in Figure 14 indicate that the removal rate of the total organic carbon in PW was 87.39%, 84.63% or 82.91%, respectively, after 30 min of VLI for three cycles of experiments. It could be found in Figure 14 that the removal rate of total organic carbon decreased by 4.48% with AP-PS as catalysts under VLI after three cycles of degradation tests.
Figure 15 shows the concentration variation curves of BPA during PDB with AGHP as a photocatalyst, with NT as a photocatalyst or with AP-PS as catalysts under VLI. As can be found in Figure 15, AP-PS were used as catalysts to degrade BPA in PW under VLI, and the concentration of BPA in PW gradually decreased with an increasing VLI duration. The results derived from Figure 15 indicate that the removal rate of BPA in PW reached 95.53%, the rate of reaction was 4.650 × 10⁻⁸ mol·L−1·s−1 and the photonic efficiency was 0.977% with AP-PS as catalysts after VLI of 30 min. As can be seen in Figure 15, when AGHP was utilized to degrade BPA in PW under VLI, the concentration of BPA in PW gradually decreased with the gradual increase in VLI duration. The results in Figure 15 indicate that the removal rate of BPA in PW reached 99.52%, the rate of reaction was 4.844 × 10⁻⁸ mol·L−1·s−1 and the photonic efficiency was 1.018% after VLI of 30 min with AGHP as a photocatalyst. It could be found from Figure 15 that the concentration of BPA in PW gradually decreased with an increasing VLI duration after NT was used as a photocatalyst. The results derived from Figure 15 showed that the removal rate of BPA in PW with N-TiO2 as a photocatalyst was 37.00%, the rate of reaction was 1.801 × 10⁻⁸ mol·L−1·s−1 and the photonic efficiency was 0.378% after VLI of 30 min. Moreover, we could observe from above results that the photodegradation efficiency of BPA in the presence of AGHP was higher than that in the presence of silver phosphate and potassium persulfate. The results shown in Figure 15 indicate that the removal rate of BPA in PW reached 91.13% after VLI of 30 min with a ZnFe2O4-TiO2 nanocomposite as a photocatalyst, and the removal rate of BPA in PW reached 87.20% after VLI of 30 min with a ZnO/CdS hierarchical heterojunction as a photocatalyst. The above results also indicate that the photodegradation efficiency of BPA in the presence of AP-PS was much higher than that in the presence of NT, meaning that the visible-light photocatalytic activity of AGHP was maximal compared with that of silver phosphate and potassium persulfate or that of NT.
Figure 16 shows the concentration variation curves of the total organic carbon during PDB in PW with AGHP as a photocatalyst, with NT as a photocatalyst or with AP-PS as catalysts under VLI. As can be seen from Figure 16, when silver phosphate and potassium persulfate were used as catalysts to degrade BPA in PW, the concentration of the total organic carbon in PW decreased gradually with the gradual increase in VLI duration. The results in Figure 15 indicate that the removal rate of total organic carbon in PW reached 88.10% with AP-PS as catalysts after VLI of 30 min. As can be found in Figure 16, when AGHP was utilized to degrade BPA in PW, the concentration of the total organic carbon in PW gradually decreased with the gradual increase in VLI duration. It could be concluded from Figure 16 that the removal rate of total organic carbon in PW reached 96.21% with AGHP as a photocatalyst after VLI of 30 min. Figure 16 indicated that the concentration of total organic carbon in PW gradually decreased with an increasing VLI duration when NT was used as a photocatalyst, and the removal rate of total organic carbon with NT as a photocatalyst in PW reached 30.55% after VLI of 30 min. It could be concluded from Figure 16 that the removal rate of total organic carbon in PW reached 83.68% with a ZnFe2O4-TiO2 nanocomposite as the photocatalyst after VLI of 30 min, and the removal rate of total organic carbon in PW reached 80.63% with a ZnO/CdS hierarchical heterojunction as the photocatalyst after VLI of 30 min. Moreover, we could observe from the above results that the removal rate of total organic carbon during the degradation of BPA in the presence of AGHP was higher than that in the presence of silver phosphate and potassium persulfate. The above results also indicate that the removal rate of total organic carbon during the degradation of BPA in the presence of silver phosphate and potassium persulfate was much higher than that in the presence of NT, which meant that AGHP possessed the maximal mineralization percentage ratio during the process of degrading BPA compared with silver phosphate and potassium persulfate or NT.
Figure 17 shows the concentration variation curves of total organic carbon during PDB in PW with AGHP as a photocatalyst under VLI for three cycles of degradation tests. As can be seen in Figure 17, when AGHP was used to degrade BPA in PW, the concentration of total organic carbon in PW gradually decreased with the gradual increase in VLI duration. We could observe from Figure 17 that the removal rate of total organic carbon during PDB in PW was 99.10%, 99.01% or 98.99% in three cycles with AGHP as the photocatalyst after VLI of 30 min. It could be found in Figure 17 that the removal rate of total organic carbon decreased by 0.11% with AGHP as a photocatalyst under VLI after three cycles of degradation tests.
Figure 18 shows the concentration variation curves of BPA during PDB in PW with AGHP as a photocatalyst under VLI for three cycles of degradation tests. As can be found in Figure 18, when AGHP was utilized to degrade BPA in PW under VLI, the concentration of BPA in PW gradually decreased with the gradual increase in VLI duration. We could draw the conclusion that the removal rate of BPA in PW was 99.60%, 99.59% or 99.50%, respectively, with AGHP as a photocatalyst after VLI of 30 min. We could also draw the conclusion from Figure 18 that the removal rate of BPA decreased by 0.10% with AGHP as a photocatalyst under VLI after three cycles of degradation tests. There was no significant difference for the degradation efficiency among the above three cycles of experiments, and the catalyst structure of AGHP was stable.
Figure 19 shows the observed first-order kinetic plots for the PDB with AGHP as a photocatalyst, with NT as a photocatalyst or with AP-PS as catalysts under VLI. A linear correlation between ln (C/Co) (or ln (TOC/TOCo)) and the irradiation time for the PDB under VLI with AP-PS as catalysts, with AGHP as a photocatalyst or with NT as a photocatalyst could be clearly seen in Figure 19. According to Figure 19, the first-order rate constant kC for the BPA concentration was estimated to be 0.09392 min−1 with AP-PS as catalysts, the first-order rate constant kC for the BPA concentration was estimated to be 0.15647 min−1 with AGHP as a catalyst and the first-order rate constant kC for the BPA concentration was estimated to be 0.01480 min−1 with NT as a catalyst, which demonstrated that AGHP was more suitable for PDB under VLI compared with NT or with AP-PS. The above results indicated that AGHP possessed the maximal photocatalytic activity compared with AP-PS or with NT. Meanwhile, the first-order rate constant KTOC of total organic carbon was estimated to be 0.06374 min−1 with AP-PS as catalysts under VLI, and the first-order rate constant KTOC of total organic carbon was estimated to be 0.10197 min−1 with AGHP as a catalyst under VLI. Moreover, the first-order rate constant KTOC of total organic carbon was estimated to be 0.01179 min−1 with NT as a catalyst under VLI. The fact that the value of KTOC for degrading BPA was lower than the value of KC for degrading BPA using the same catalyst illustrated that the photodegradation intermediate products of BPA probably appeared during PDB under VLI. At the same time, AGHP showed a higher mineralization efficiency for BPA degradation compared with NT or with AP-PS. With the same VLI duration, the KC value for BPA degradation and the removal rate of BPA with AGHP as a photocatalyst was higher than that with AP-PS as catalysts and was higher than that with NT as catalyst. With the same VLI duration, the KTOC value for BPA degradation and the removal rate of total organic carbon with AGHP as a photocatalyst was higher than that with potassium persulfate and AP as catalysts and was higher than that with NT as a catalyst.

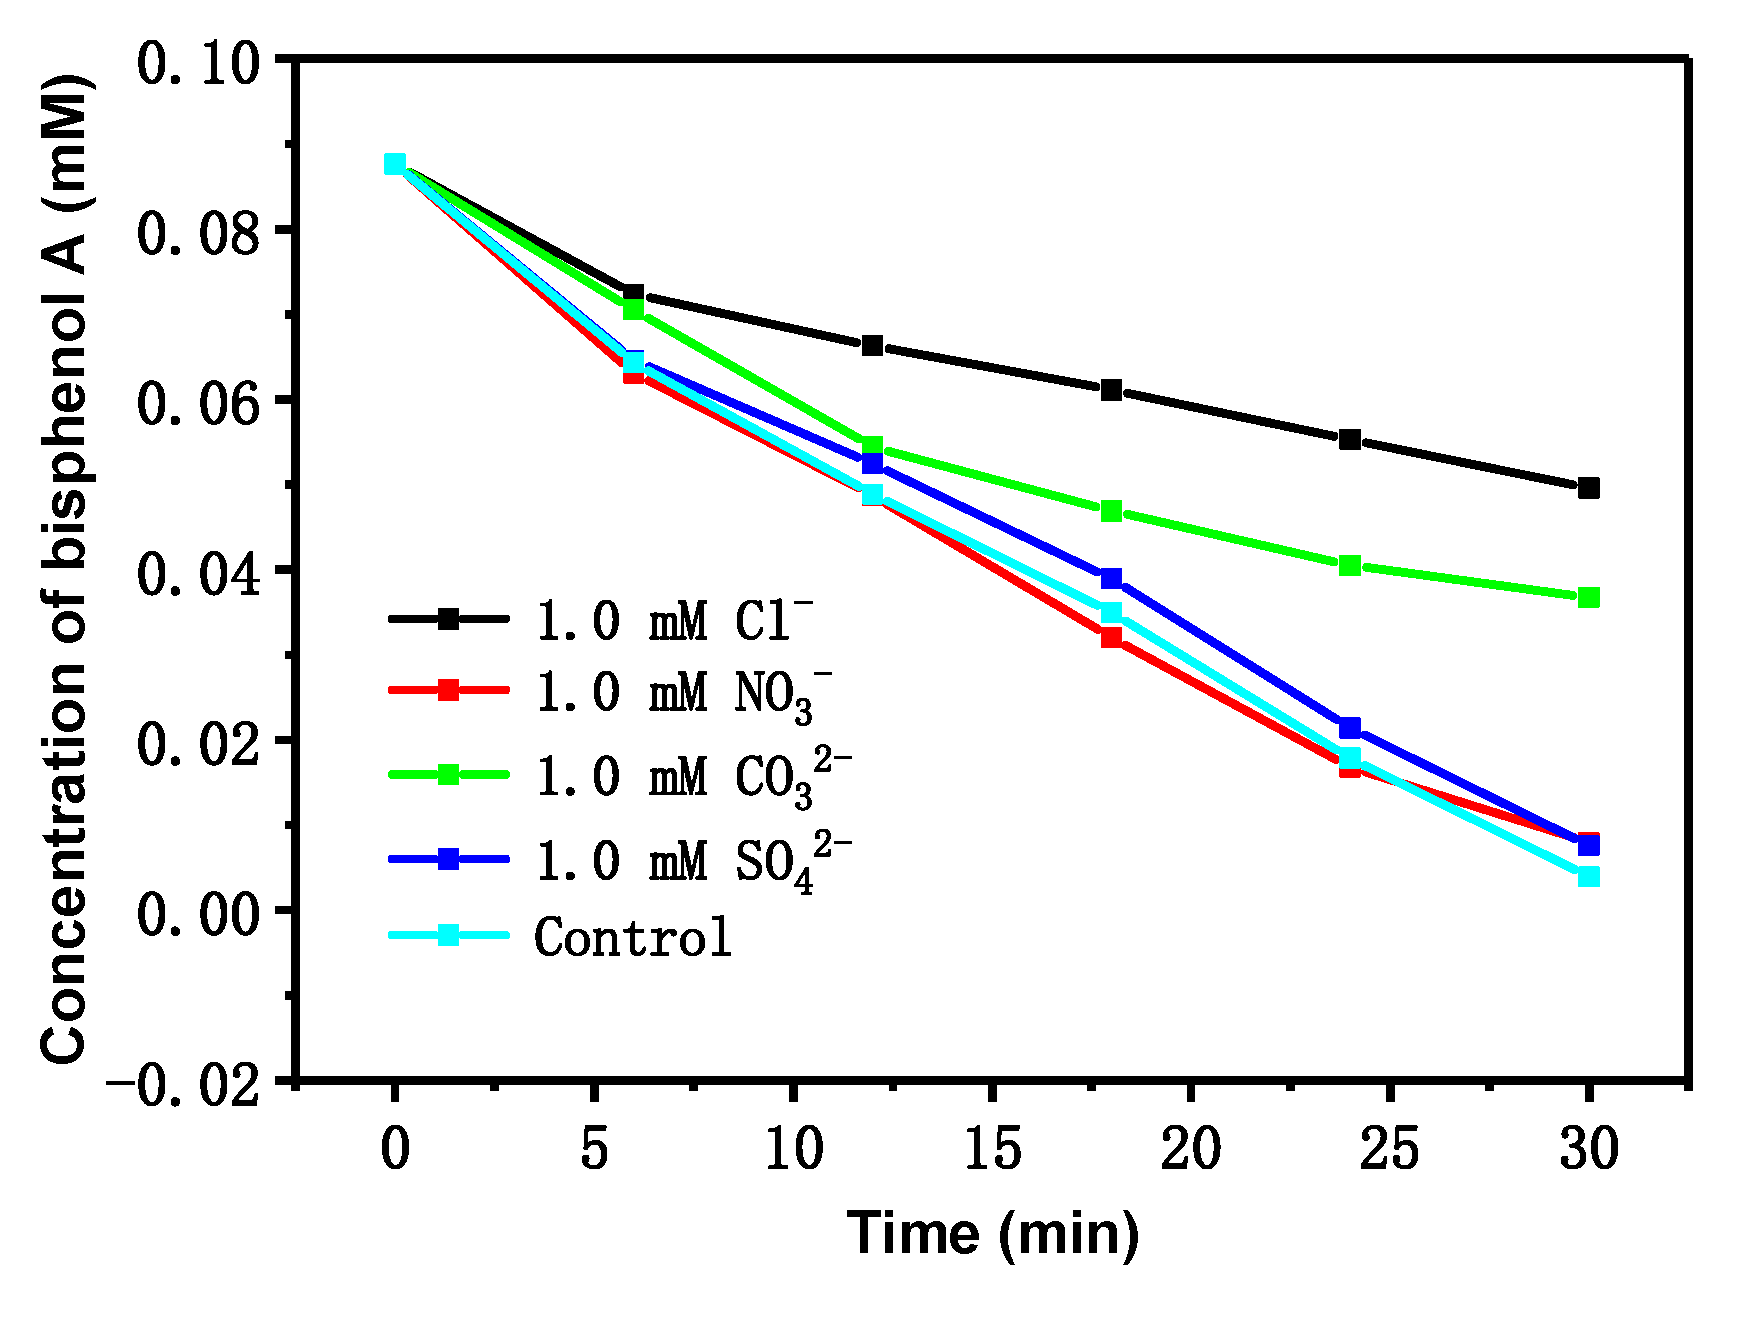
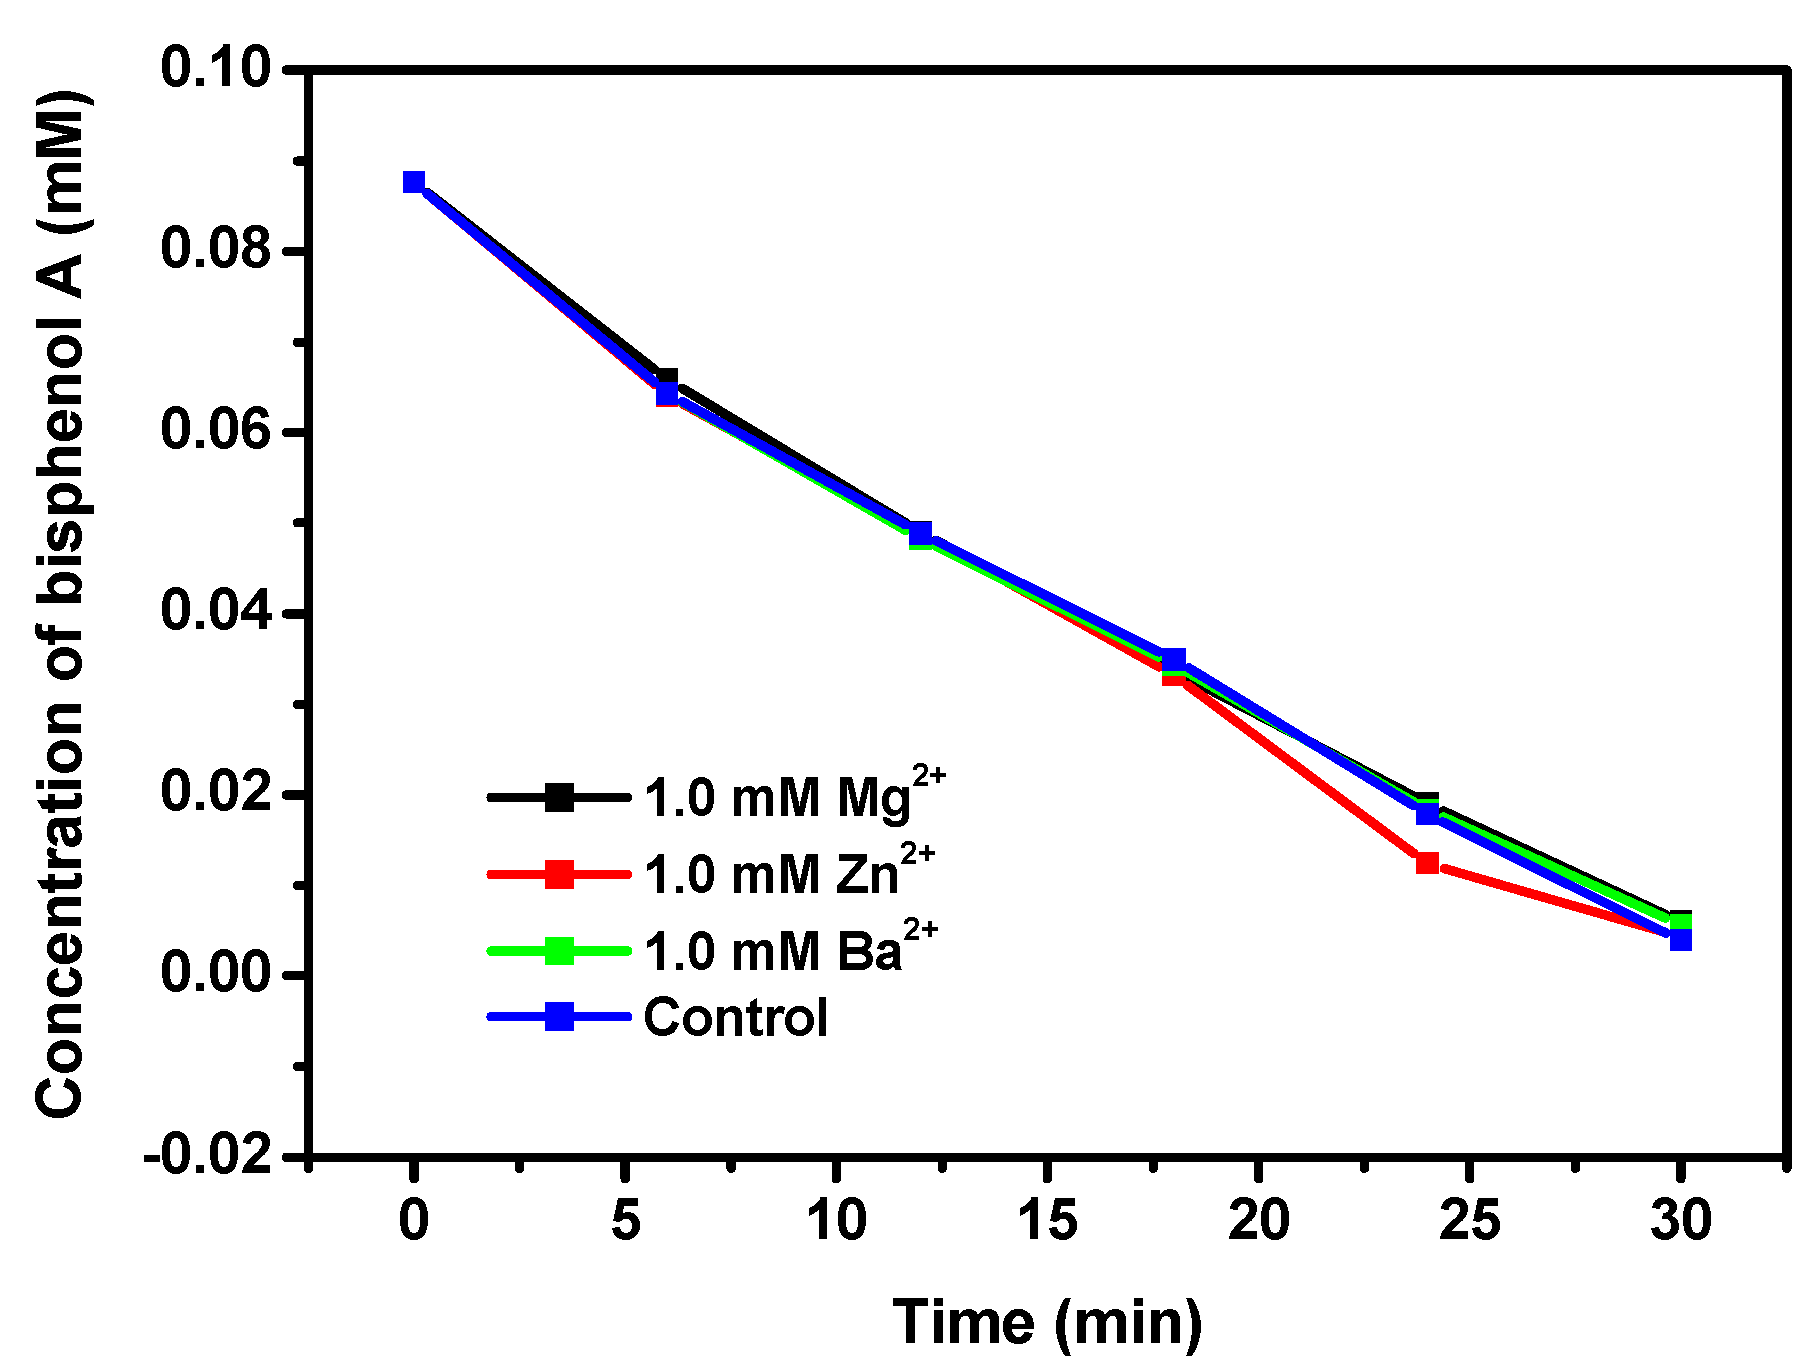
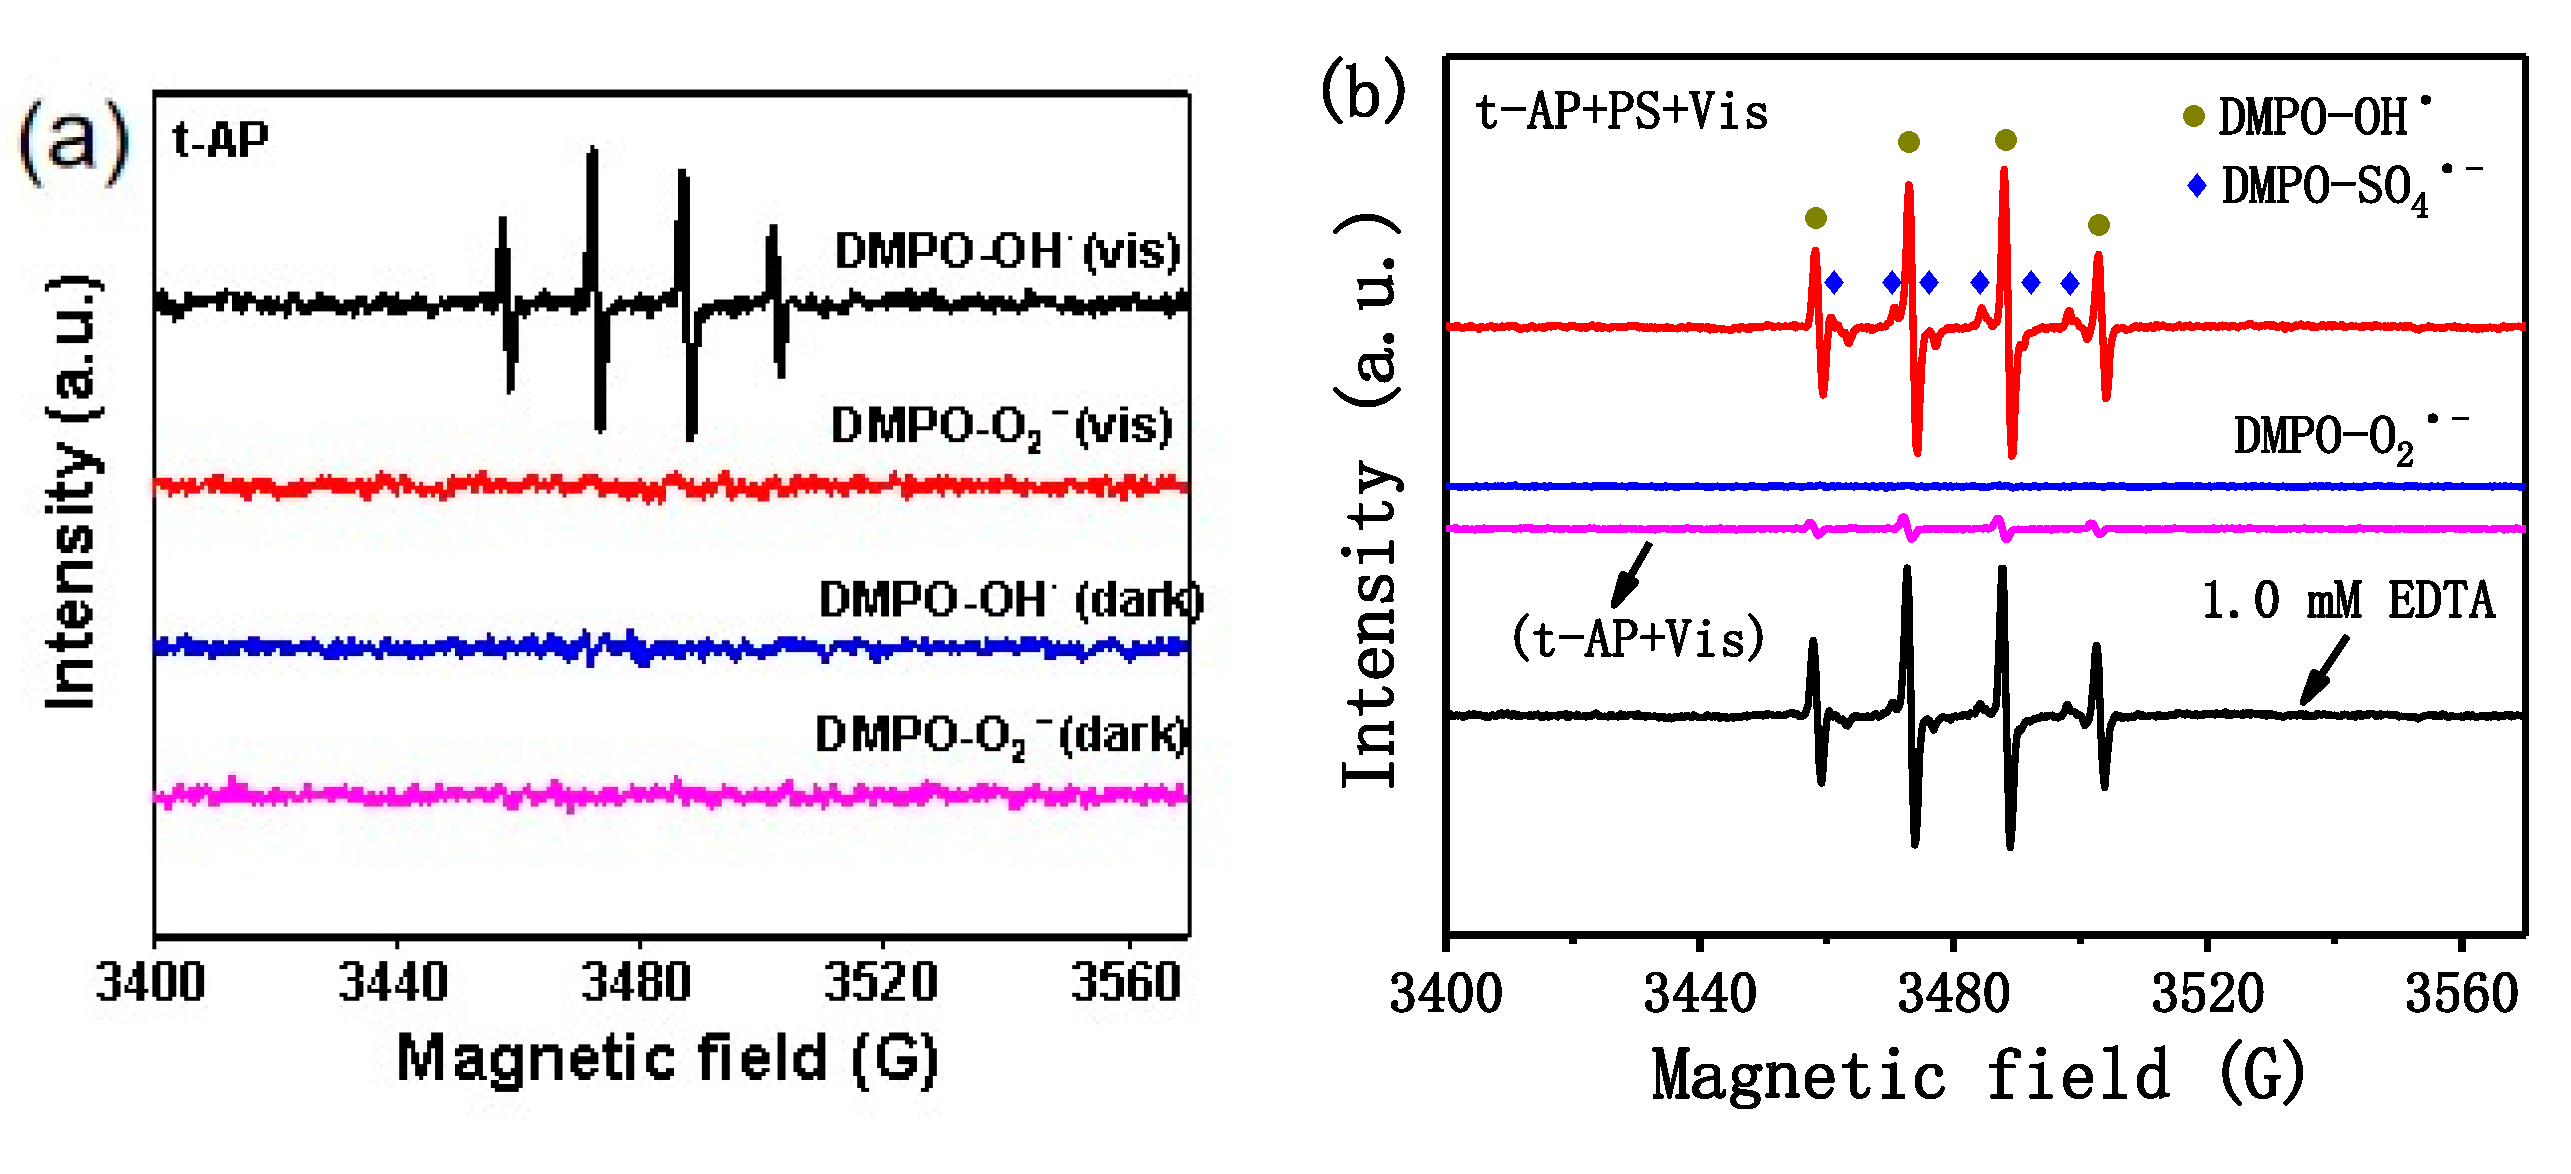
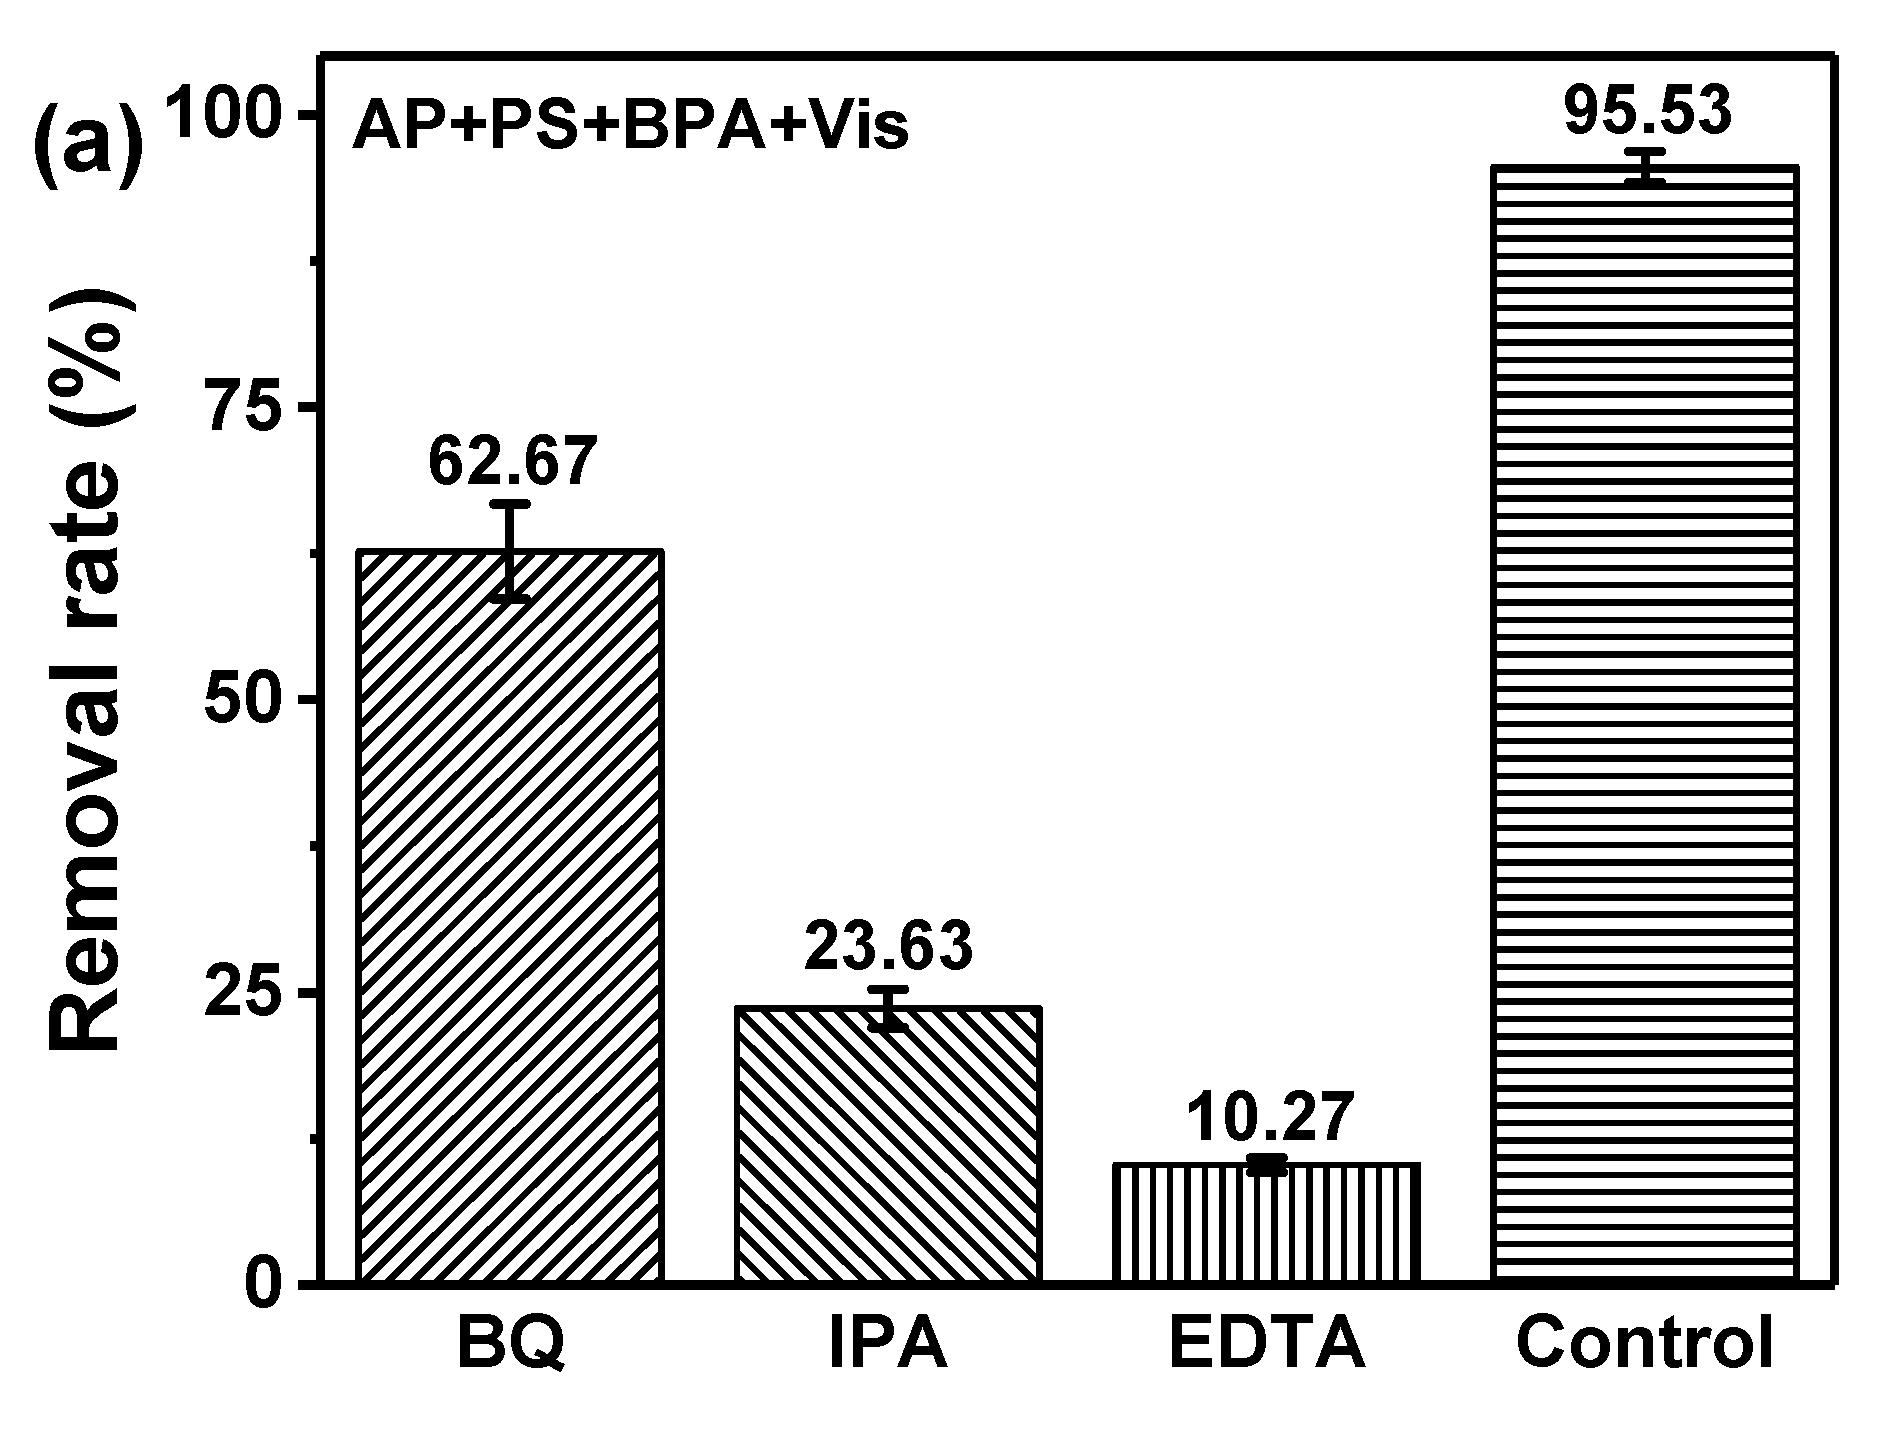
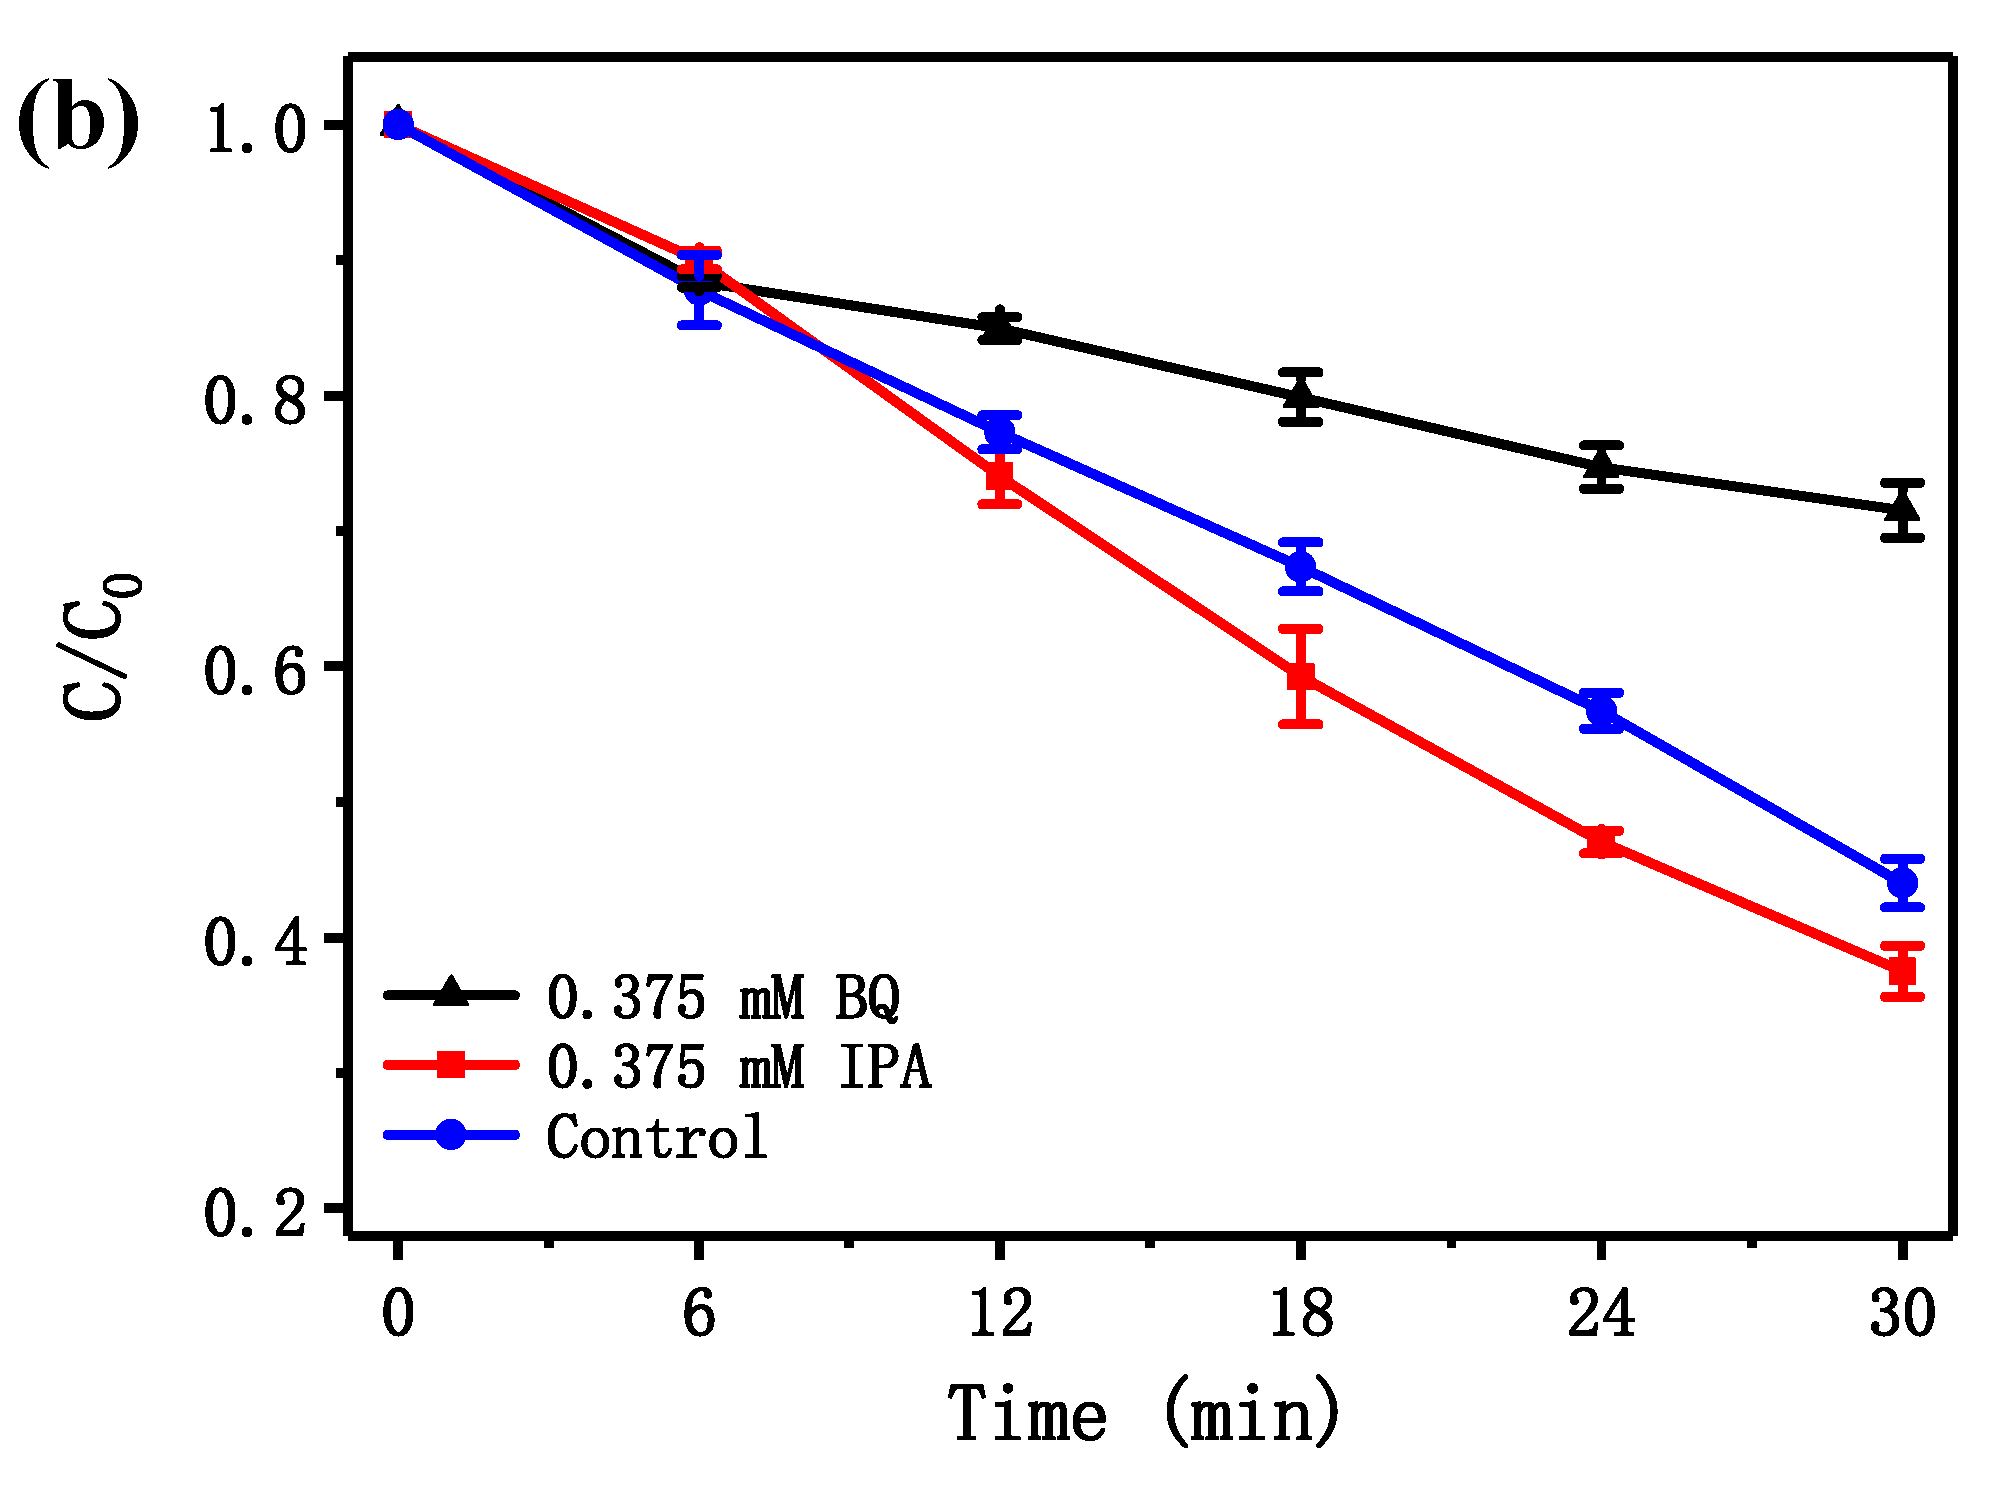
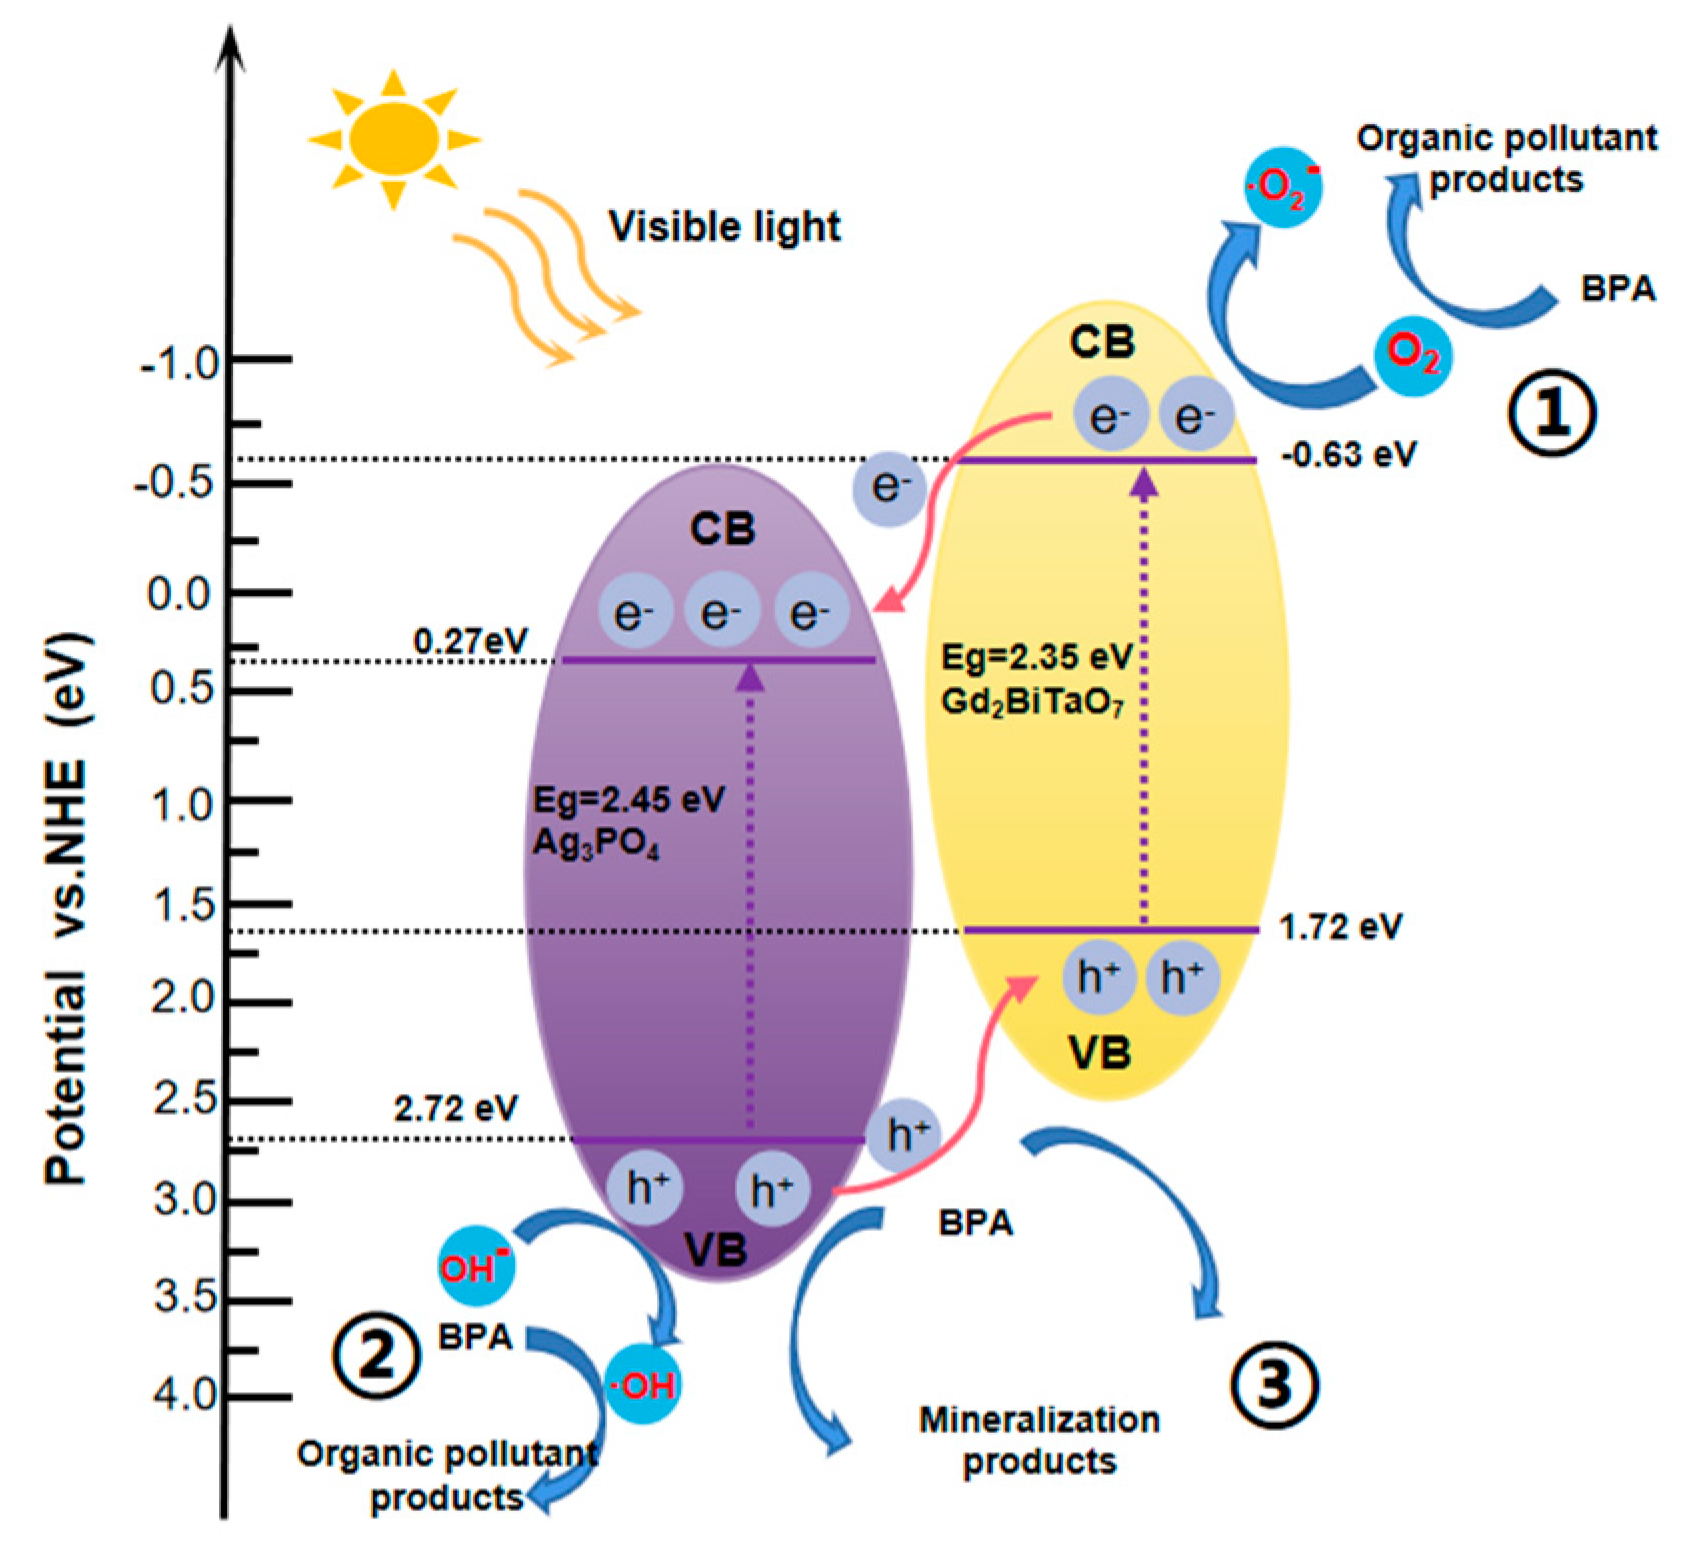
2.5. Possible Degradation Mechanism Analysis

Figure 20 shows the possible photocatalytic degradation mechanism of BPA with AGHP as a photocatalyst under VLI. The potential of the valence band (VB) and conductor band (CB) for a semiconductor catalyst could be calculated in accordance with the following Equations (3) and (4) [74]:
ECB = XEe − 0.5Eg
EVB = ECB + Eg
where Eg is the band gap of semiconductor, X is the electronegativity of the semiconductor and Ee is the energy of free electrons on the hydrogen scale (about 4.5 eV). According to the above equations, the VB potential or CB potential for GBT was estimated to be 1.72 eV or −0.63 eV, respectively. The VB potential or the CB potential for AP was estimated to be 2.72 eV or 0.27 eV, respectively. It could be found in Figure 20 that both GBT and AP could absorb visible light and internally generated electron–holes pairs when the AGHP was irradiated by visible light. Since the redox potential position of CB of GBT at −0.63 eV was more negative than that of AP at 0.27 eV, the photo-induced electrons on the CB of GBT could transfer to the CB of AP. Since the redox potential position of VB of AP at 2.72 eV was more positive than that of GBT at 1.72 eV, the photo-induced holes on the VB of AP could transfer to the VB of GBT.
Therefore, the coupling of GBT and AP to produce AGHP effectively reduced the recombination rate of photo-induced electrons and photo-induced holes, subsequently decreased the internal resistance, prolonged the lifetime of photo-induced electrons and photo-induced holes and also enhanced the interfacial charge transfer efficiency [75]. As a result, more oxidative radicals such as OH or O2 could be produced to improve the degradation efficiency of BPA. Moreover, the CB potential of GBT was −0.63 eV, which was more negative than that of O2/O2 (−0.33 V), suggesting that the electrons in the CB of GBT could absorb oxygen to produce O2 to degrade BPA, which was shown as path 1 in Figure 20. Meanwhile, the VB potential of AP was 2.72 eV, which was more positive than that of OH/OH (2.38 V), suggesting that the holes in the VB of AP could oxidize H2O or OH into OH to degrade BPA, which was shown as path 2 in Figure 20. Ultimately, the photo-induced holes in the VB of AP and GBT could directly oxidize and degrade BPA owing to the strong oxidizing ability, and this was shown as path 3 in Figure 20. In brief, the excellent photocatalytic activity of AGHP toward BPA degradation was mainly contributed by the high efficiency of electron–hole separation, which was induced by AGHP.
For the sake of investigating the degradation mechanism of BPA, LC–MS was utilized to assess the degradation intermediate products of BPA.
The intermediate products obtained during PDB were identified as 4-hydroxyacetophenone (A) (m/z = 135), 4-hydroxyacetophenone (B) (m/z = 135), maleic acid (m/z = 112), 2,2-dimethy (-3-hexanone) (m/z = 128), 2,4-di-tert-butylphenol (m/z = 206), 4-ethyl-2,2,6, 6-tetramethyl heptane (m/z = 184), 4,4′-((4-hydroxy-1,3-phenylene) bis (propane-2,2-diyl)) diphenol (m/z = 355), quinone of MH BPA (m/z = 242), quinone of dihydroxylated BPA (m/z = 257), formic acid (m/z = 116), biphenyldiol (m/z = 186), benzaldehyde (m/z = 106), p-hydroxyacetophenone (m/z = 136), benzophenone (m/z = 182), 4-isopropyl-1-phenoxy-2-isopropyl-4-phenol (m/z = 270), hydroxylated (4-isopropyl-1-phenoxy-2-isopropyl)-4-phenol (m/z = 286), hydroperoxide derivative (m/z = 227), phenol, oxalic acid, succinic acid, fumaric acid, glutaric acid, acetic acid and propanoic acid.
BPA molecules were diffused across the surface of AGHP, and subsequently, oxidative reactive radicals such as OH, O2 or h+ would attack BPA and the C-C bond between the two aromatic rings, and as a result, two aromatic rings could separate from each other and form isopropyl phenol [76]. Simultaneously, the position of oxidative reactive radicals that attacked the aromatic ring was the bond between ortho- and para-orientation positions [76], due to the ortho- and para-orientation tendency of the phenolic hydroxyl group [76,77]. Thus, multihydroxylated BPA could be produced, and as a result, hydroxylated BPA would dehydrate and turn into quinone compounds [76]. Moreover, because of the H-abstraction, some intermediate products could combine with each other to form coupling compounds that had higher molecular weight than BPA [76,77], and these coupling compounds could be attacked by oxidative reactive radicals and were decomposed into smaller molecules again. Ultimately, the above intermediate products would be transformed to ring-opened compounds and were subsequently mineralized by oxidative reactive radicals. In a word, the possible degradation mechanism of BPA could be credited to hydroxylation, oxidative skeletal rearrangement, demethylation, dehydration and ring opening [78].
Figure 21 shows the XPS survey spectrum of AGHP before the reaction of photocatalytic degradation of bisphenol A and that of AGHP after the reaction of photocatalytic degradation of bisphenol A. Figure 22 shows the XPS spectra of O2−, Ag+, P5+, Gd3+, Bi3+ and Ta5+ derived from AGHP before the reaction of the photocatalytic degradation of bisphenol A. Figure 23 shows the XPS spectra of O2−, Ag+, P5+, Gd3+, Bi3+ and Ta5+ derived from AGHP after the reaction of the photocatalytic degradation of bisphenol A. According to the XPS analysis displayed in Figure 21, Figure 22 and Figure 23, the oxidation state of Ag, P, Gd, Bi, Ta or O ion was +1, +5, +3, +3, +5 or −2, respectively. Based on the above analysis, it could be concluded that the chemical formula of the novel compound was Ag3PO4/Gd2BiTaO7.
Figure 24 shows a SEM image of AGHP. Figure 25 shows EDS spectra of AGHP. Figure 26 shows the EDS elemental mapping of AGHP (Ag, P, O from Ag3PO4 and Gd, Bi, Ta, O from Gd2BiTaO7).
It could be seen from Figure 24 that AP possessed rhombic dodecahedron-like morphology. It was well-known that the different surface energies of crystallite facets control the structural growth of AP. Previously, researchers suggested the order of increasing surface energy for different facets of AP g (111) < g (100) < g (110). Among them, the AP (110) facet showed higher surface energy than the (111) facet, which was why irregularly shaped AP structures became accumulated along the (110) crystallographic direction, which led to the formation of rhombic dodecahedron-like morphology for AP [79,80].
The SEM-EDS analysis displayed in Figure 24, Figure 25 and Figure 26 reveals that AGHP did not possess other impure elements. At the same time, the powder X-ray diffraction analysis showed that AGHP was a pure phase, which was consistent with the results in Figure 24, Figure 25 and Figure 26. It could be concluded from Figure 25 and Figure 26 that AGHP contained silver, phosphorus, oxygen, gadolinium, tantalum and bismuth elements.
In the experimental results shown in Figure 24, the larger particles were AP, which possessed a regular sphere-like morphology and a homogeneous structure. The particle size of AP was measured to be 970 nm, while other smaller particles were GBT, of which the particle size was measured to be 480 nm.
In accordance with the XPS spectra of AGHP (Figure 22) and the EDS spectrum of AGHP (Figure 25), the atomic ratio of O:P:Ag:Gd:Ta:Bi was 87:13:39:10:5:4.8. The atomic ratio of AP:GBT was close to 13:5. According to the above results, we could conclude that the resulting materials for AGHP were of high purity under our preparation conditions.

3. Experimental Section

3.1. Materials and Reagents

Silver nitrate (AN, AgNO3, purity = 99.8%), phosphoric acid (H3PO4, mass concentration ≥ 85 wt% in H2O), potassium persulfate (PS, K2S2O8, purity ≥ 99.5%), ethylenediaminetetraacetic acid (EDTA, C10H16N2O8, purity = 99.5%), isopropyl alcohol (IPA, C3H8O, purity ≥ 99.7%) and manganese acetate (MA, MnC4H6O4, purity = 99.0%) were analytical grade. P-benzoquinone (BQ, C6H4O2, purity ≥ 98.0%) was chemical grade. Moreover, the above chemical reagents were all purchased (Sinopharm Group Chemical Reagent Co., Ltd., Shanghai, China). Absolute ethanol (C2H5OH, purity ≥ 99.5%) conformed to American Chemical Society Specifications (Aladdin Group Chemical Reagent Co., Ltd., Shanghai, China). BPA (C15H16O2, purity ≥ 98%) was gas chromatography grade (Tianjin kwangfu Fine Chemical Industry Research Institute, Tianjin, China). Ultra-pure water (18.25 MU cm) was utilized throughout this work.

3.2. Synthesis of Tetrahedral Ag3PO4

Tetrahedral Ag3PO4 (AP) was prepared by a kinetic control method [32]. In a typical procedure, 6 mmol of AgNO3 was dissolved in 40 mL of absolute ethanol under magnetic stirring conditions and transparent solution A was formed. Simultaneously, 10 mL of H3PO4, of which the mass concentration was 85 wt%, was mixed thoroughly with 40 mL of absolute ethanol under magnetic stirring conditions and transparent solution B was formed. Solution A was subsequently added dropwise to solution B under magnetic stirring conditions. After 1 h of vigorous stirring in darkness, a sample with a bright green color was obtained when the centrifuge was utilized and the sample with a bright green color was subsequently washed with absolute ethanol, which was ultimately dried at 70 °C for 12 h. The achieved sample AP was denoted as AP.

3.3. Preparation Method of Gd2BiTaO7

The novel photocatalyst Gd2BiTaO7 (GBT) had been synthesized by the solid-state reaction method. Gd2O3, Bi2O3 and Ta2O5 with a purity of 99.99% (Sinopharm Group Chemical Reagent Co., Ltd., Shanghai, China) were utilized as starting materials without further purification. Due to the volatility of Bi2O3, we finally decided to add 120% quantities of Bi2O3 after 5 experiments. All powders (n(Gd2O3):n(Bi2O3):n(Ta2O5) = 2:1.2:1) were dried at 200 °C for 4 h before synthesis. In order to synthesize GBT, the precursors were stoichiometrically mixed, then pressed into small columns and put into an alumina crucible (Shenyang Crucible Co., LTD, Shenyang, China). After calcining at 400 °C for 2 h, then at 750 °C for 10 h, the raw materials and the small columns were taken out of the electric furnace. The mixed materials should be ground and subsequently be put into the electric furnace (KSL 1700X, Hefei Kejing Materials Technology CO., LTD, Hefei, China). Ultimately, the calcination process was separately carried out at 1120 °C for 30 h in an electric furnace with the color of light yellow.

3.4. Synthesis of N-Doped TiO2

The nitrogen-doped titania (N-doped TiO2) catalyst was prepared by the sol-gel method with tetrabutyl titanate as a precursor and ethanol as solvent. The procedure was as follows: Firstly, 17 mL tetrabutyl titanate and 40 mL absolute ethyl alcohol were combined to serve as solution A; 40 mL absolute ethyl alcohol, 10 mL glacial acetic acid and 5 mL double distilled water were blended to be solution B; subsequently, solution A was added dropwise into the solution under vigorous magnetic stirring conditions, and then a transparent colloidal suspension was formed. Subsequently, aqua ammonia, within which N/Ti proportion was 8 mol%, was placed into the resulting transparent colloidal suspension under magnetic stirring conditions for 1 h. Next the xerogel was generated after being aged for 2 days. The xerogel was ground into powder, which was calcined at 500 °C for 2 h. Subsequently, the above powder was ground in an agate mortar and screened by a shaker to gain N-doped TiO2 (NT) powders.

3.5. Synthesis of Ag3PO4/Gd2BiTaO7 Heterojunction Photocatalyst, ZnFe2O4-TiO2 Nanocomposite and ZnO/CdS Hierarchical Heterojunction

First, 0.30 mol/L Gd(NO3)3·6H2O, 0.15 mol/L Bi(NO3)3·5H2O and 0.15 mol/L TaCl5 were mixed and kept stirred for 20 h. The above solution was transferred into a Teflon-lined autoclave and was heated at 200 °C for 15 h. Subsequently, the achieved powder was calcined at 800 °C for 10 h in a tube furnace at a rate of 8 °C/min under an atmosphere of N2. A Gd2BiTaO7 powder was finally gained and denoted as GBT. The facile in-situ precipitation method was utilized for preparing the Gd2BiTaO7/Ag3PO4 heterojunction photocatalyst. In a typical process, a certain amount (0.05 mol) of Gd2BiTaO7 powder was added to 200 mL of C2H6O2 and sonicated for 30 min. Subsequently, 100 mL of AgNO3 (0.39 mol) was added and kept stirred for 15 h to ensure Ag+ combined with Gd2BiTaO7 sufficiently. In succession, another 100 mL of Na2HPO4·12H2O (0.13 mol) was added dropwise to the above mixed solution and then stirred for one hour. The above mixture was washed several times with ultrapure water, and subsequently, this mixture was collected for use. Finally, the Ag3PO4/Gd2BiTaO7, heterojunction photocatalyst was prepared successfully.
The ZnFe2O4-TiO2 nanocomposite was prepared by mixing 80 mg of ST01 TiO2 with 1 wt% (0.808 mg) of ZnFe2O4 in 20 mL of octanol (C8H18O) and then dispersed in an ultrasonic bath for 1 h [81]. The mixture was then heated and refluxed at 140 °C for 2 h under vigorous stirring conditions to improve the attachment of ZnFe2O4 on the surface of TiO2 nanoparticles to form a ZnFe2O4-TiO2 heterojunction [81]. After cooling to room temperature, the products were harvested by centrifugation and washed with the mixture of n-hexane/ethanol several times [81]. The purified powders were dried in a vacuum oven at 60 °C for 6 h and stored in a desiccator for further use [81].
ZnO/CdS hierarchical heterojunction was prepared by chemical bath deposition [82]. The method was as follows: Firstly, 20 mL of deionized water was measured and 0.1 mmol Cd(NO3)2∙4H2O was added, then 1 mmol of ZnO nanofibers was added after dissolving, and the solution was stirred for 30 min, which was recorded as solution A [82]. Meanwhile, 20 mL of deionized water was measured and 0.1 mmol of C2H5NS was dissolved into it, which was recorded as solution B [82]. Subsequently, solutions A and B were blended and stirred consistently for 30 min [82]. Then, the mixed solution was centrifuged to separate, absolute ethanol and deionized water were utilized to wash the powder for several times, and it was ultimately dried at 60 °C in a vacuum oven for 12 h [82]. The dried product was the ZnO/CdS hierarchical heterojunction [82].

3.6. Characterizations

The pure crystals of the prepared samples were examined by the powder X-ray diffractometer (XRD, Shimadzu Corporation, Kyoto, Japan, XRD-6000, Cu Kɑ radiation, λ = 1.54184 Å, sampling pitch of 0.02°, preset time of 0.3 s step−1). The morphology and microstructure of the prepared samples were characterized using a scanning electron microscope (SEM, Sigma 300, ZEISS, Germany), and the elementary composition, which was derived from the above prepared samples, was captured by energy dispersive spectroscopy (EDS). The diffuse reflectance spectrum of the above prepared sample was obtained using an UV-Vis spectrophotometer (UV-Vis DRS, UV-3600, Shimadzu Corporation, Kyoto, Japan). The surface chemical composition and states of the prepared sample were analyzed by an X-ray photoelectron spectrograph (XPS, UlVAC-PHI, PHI 5000 VersaProbe, Japan) with an Al-kα X-ray source. The band structures of the prepared sample were performed by a synchrotron-based ultraviolet photoelectron spectroscope (UPS), which was mainly utilized for the measurement of the valence band spectrum of the prepared sample.

3.7. Experimental Setup and Procedure

The experiments were performed in a photocatalytic reactor (XPA-7, Xujiang Electromechanical Plant, Nanjing, China) and the temperature of the reaction system was 20 °C, which was controlled by circulating cooling water. Simulated sunlight irradiation was provided by a 500 W xenon with a 420 nm cut-off filter. There were 12 quartz tubes among which the volume of a single reaction solution was 40 mL, and the total reaction volume for pharmaceutic wastewater was 480 mL. The dosage of AP was 0.75 g/L; moreover, the concentrations of potassium persulfate and BPA were 1.0 mM and 20 mg/L, respectively. The concentration of bisphenol A (BPA) was the residual concentration after biodegradation for practical pharmaceutic wastewater, which contained BPA of 160 mg/L. During the reaction, a 3 mL suspension was withdrawn periodically, and subsequently, the filtration (0.22 μm PES polyethersulfone filter membrane) was realized for removing the catalyst; finally, the residual concentration of BPA in the solution was determined by the UV-Vis spectrophotometer (Shimadzu Corporation, UV-2450, Kyoto, Japan). The absorption wavelength of BPA was 273 nm. The absorbance standard curve of BPA at different concentrations was accomplished and the Ag3PO4 (AP) dosage ranged from 1.25 mg/L to 20 mg/L under ultraviolet light irradiation in the range of 220–320 nm with an ultraviolet-visible spectrophotometer. The relationship between the concentration of BPA and the absorbance value at 273 nm should be calculated. The absorbance of BPA in the solution was measured at the maximum absorption wavelength, and the calibration curve of BPA was drawn according to the absorbance at the maximum absorption wavelength of different concentrations of BPA. A linear regression method was used for the quantification of BPA.
The mineralization experimental data of BPA within the reaction solution were measured using a total organic carbon analyzer (TOC-5000 A, Shimadzu Corporation, Kyoto, Japan). In order to examine the concentration of total organic carbon during photocatalytic degradation of BPA (PDB), potassium acid phthalate (KHC8H4O4) or anhydrous sodium carbonate were utilized as the standard reagent. Standard solutions of potassium acid phthalate with a known carbon concentration (in the range of 0–100 mg/L) were prepared for calibration purposes. Six samples that contained a 45 mL reaction solution were used to measure the TOC concentration every time.
The signals of the radicals were measured by an electron paramagnetic resonance spectrometer (EPR, Bruker, EMX-10/12, Germany) with the spin trap of 5,5-dimeyhyl-1-pyrroline-N-oxide (DMPO).
The identification and measurement of BPA and its intermediate degradation products were carried out by liquid chromatography–mass spectrometry (Thermo Fisher Scientific Corporation, MA, USA. Beta Basic-C18 HPLC column: 150 mm × 2.1 mm, ID of 5 μm, (Thermo Fisher Scientific Corporation, MA, USA). Here, 20 μL of the solution obtained after the photocatalytic reaction was injected automatically into the LC–MS system. The mobile phase contained 60% methanol and 40% ultrapure water, and the flow rate was 0.2 mL/min. MS conditions included an electrospray ionization interface, a capillary temperature of 27 °C with a voltage of 19.00 V, a spray voltage of 5000 V and a constant sheath gas flow rate. The spectrum was acquired in the negative ion scan mode and the m/z range swept from 50 to 600.
The incident photon flux Io measured by a radiometer (Photoelectric Instrument Factory Beijing Normal University, Beijing, China) was determined to be 4.76 × 10⁶ Einstein L1 s1 under VLI (wavelength range of 400–700 nm). The incident photon flux on the photoreactor was changed by adjusting the distance between the photoreactor and the Xe arc lamp.
The photonic efficiency was calculated in accordance with the following equation:
ϕ = R/Io
where ϕ was the photonic efficiency (%), R was the degradation rate of BPA (mol L−1 s−1) and Io was the incident photon flux (Einstein L−1 s−1).

4. Conclusions

In this study, a new type of GBT was synthesized by a high-temperature solid-phase method and AGHP was prepared by the facile in-situ precipitation method for the first time. The photocatalytic property of GBT or AGHP was reported. The structural properties of AP-PS, GBT or AGHP were characterized by different material characterization methods. The results showed that GBT was a well-crystallized, stable, cubic crystal system by the space group Fd3m. The lattice parameter and band gap energy of GBT was found to be a = 10.740051 Å and 2.35 eV, respectively. The band gap of AP was about 2.45 eV. After VLI of 30 min, the removal rate of BPA reached 99.52%, 95.53% and 37.00% with AGHP as a photocatalyst, with AP-PS as photocatalysts or with NT as a photocatalyst. The removal rate of BPA with AGHP as a photocatalyst was 2.69 times higher than that with NT as a photocatalyst. The removal rate of BPA with AP-PS as photocatalysts was 2.58 times that with N-TiO2 as a photocatalyst. Compared with AP-PS or NT, AGHP displayed higher photocatalytic activity for PDB under VLI. The removal rate of total organic carbon reached 96.21%, 88.10% and 30.55% with AGHP as a photocatalyst, with AP-PS as photocatalysts and with NT as a photocatalyst after VLI of 30 min. The above results indicated that AGHP possessed the maximal mineralization percentage ratio during the process of degrading BPA compared with AP-PS or NT. The results indicated that the main oxidation radical was OH during the process of degrading BPA. The PDB with AGHP conformed to first-order reaction kinetics.
The first-order rate constant kC for the BPA concentration was estimated to be 0.15647 min−1, 0.09392 min−1 and 0.01480 min−1 with AGHP as a photocatalyst, with AP-PS as photocatalysts or with NT as a photocatalyst under VLI. Meanwhile, the first-order rate constant KTOC of the total organic carbon was estimated to be 0.10197 min−1, 0.06374 min−1 and 0.01179 min−1 with AGHP as a photocatalyst, with AP-PS as photocatalysts and with NT as a catalyst under VLI. AGHP displayed a higher mineralization efficiency for BPA degradation compared with NT or AP-PS.

Supplementary Materials

The following are available online at https://www.mdpi.com/article/10.3390/catal12010022/s1, Figure S1: Atomic structure of Gd2BiTaO7. (Red atom: O, cyan atom: Gd, purple atom: Bi or Ta.), Figure S2: (a) Plot of ln(αhν) versus ln(hν-Eg) for Gd2BiTaO7; (b) Plot of (αhν) 1/2 versus hν for Gd2BiTaO7, Figure S3: X ray diffraction pattern of Ag3PO4, Figure S4: Scanning electronic microscope photograph of Ag3PO4, Figure S5: EDS spectrum of Ag3PO4 and EDS elemental mapping of Ag3PO4 (Ag, P, O from Ag3PO4 ), Figure S6: (a) The absorbance standard curve of bisphenol A; (b) The absorption standard curve of bisphenol A at pH=11, Figure S7: X ray diffraction patterns of Ag3PO4 under different reaction conditions, Figure S8: (a) Removal rates of bisphenol A under different reaction conditions; (b) Degradation kinetics of bisphenol A with Ag3PO4 as a photocatalyst or with Ag3PO4 and potassium persulfate as photocatalysts under visible light irradiation, Figure S9: Observed kinetic plots for the photocatalytic degradation of bisphenol A with Ag3PO4 as photocatalyst under visible light irradiation.

Author Contributions

Data curation, J.L.; Formal analysis, J.L.; Funding acquisition, J.L.; Investigation, J.L.; Software, G.Y.; Supervision, J.L.; Validation, B.N., C.H., B.M. and W.L.; Writing—original draft, Z.W. All authors have read and agreed to the published version of the manuscript.

Funding

Funding from the Innovational and Enterprising Talents of Department of human resource and Social Security of Jilin Province of China (Grant No. 2020033), from the Scientific Research Planning Project of the Education Department of Jilin Province of China(Grant No. JJKH20200832KJ), from the Scientific and Technical Innovation Leading Personnel and Team Foundation for Middle-aged and Young Scientist of Science and Technology Bureau of Jilin Province of China (Grant No. 20200301033RQ), from the Free Exploring Key Item of Natural Science Fundation of Science and Technology Bureau of Jilin Province of China (Grant No. YDZJ202101ZYTS161), from the Industrial Technology Research and Development Fund of Jilin Province Capital Development Fund on Budget in 2021 of Jilin Province Development and Reform Commission of China (Grant No. 2021C037-1), from the Natural Science Foundation of Changchun Normal University (Grant No. [2019]13) and from the Scientific Research Initating Foundation for Advanced Doctor of Changchun Normal University.

Acknowledgments

This study was supported by the Projects Funded for Innovational and Enterprising Talents of Department of human resource and Social Security of Jilin Province of China (GrantNo. 2020033), by the Scientific Research Planning Project of the Education Department of Jilin Province of China(Grant No. JJKH20200832KJ), by the Scientific and Technical Innovation Leading Personnel and Team Foundation for Middle-aged and Young Scientist of Science and Technology Bureau of Jilin Province of China (Grant No. 20200301033RQ), by the Free Exploring Key Item of Natural Science Fundation of Science and Technology Bureau of Jilin Province of China (Grant No. YDZJ202101ZYTS161), by the Industrial Technology Research and Development Fund of Jilin Province Capital Development Fund on Budget in 2021 of Jilin Province Development and Reform Commission of China (Grant No. 2021C037-1), by the Natural Science Foundation of Changchun Normal University (Grant No. [2019]13) and by the Scientific Research Initating Foundation for Advanced Doctor of Changchun Normal University.

Conflicts of Interest

The authors declare no conflict of interest.

References

  1. You, J.; Zhang, C.; Wu, Z.; Ao, Z.; Sun, W.; Xiong, Z.; Lai, B. N-doped graphite encapsulated metal nanoparticles catalyst for removal of Bisphenol A via activation of peroxymonosulfate: A singlet oxygen-dominated oxidation process. Chem. Eng. J. 2021, 415, 128890. [Google Scholar] [CrossRef]
  2. Jia, C.; Wang, Y.; Zhang, C.; Qin, Q.; Kong, S.; Yao, S. Photocatalytic degradation of bisphenol A in aqueous suspensions of titanium dioxide. Environ. Eng. Sci. 2012, 29, 630–637. [Google Scholar] [CrossRef]
  3. Robertson, P.K.J.; Robertson, J.M.C.; Bahnemann, D.W. Removal of microorganisms and their chemical metabolites from water using semiconductor photocatalysis. J. Hazard. Mater. 2012, 211, 161–171. [Google Scholar] [CrossRef] [PubMed] [Green Version]
  4. Tahmasebi, N.; Esmaeilpour, H.; Movahedifard, F.; Hakimyfard, A.; Moayeri, H. Fabrication of a novel MoO3/Cs3PMo12O40 composite for photocatalytic decolorization of rhodamine B. Mat. Sci. Semicon. Proc. 2021, 131, 105876. [Google Scholar] [CrossRef]
  5. Mokhtari, F.; Tahmasebi, N. Hydrothermal synthesis of W-doped BiOCl nanoplates for photocatalytic degradation of rhodamine B under visible light. J. Phys. Chem. Solids 2021, 149, 109804. [Google Scholar] [CrossRef]
  6. Subhan, M.A.; Rifat, T.P.; Saha, P.C.; Alam, M.M.; Asiri, A.M.; Rahman, M.M.; Akter, S.; Raihan, T.; Azad, A.K.; Uddin, J. Enhanced visible light-mediated photocatalysis, antibacterial functions and fabrication of a 3-chlorophenol sensor based on ternary Ag2O·SrO·CaO. RSC Adv. 2020, 10, 11274–11291. [Google Scholar] [CrossRef] [Green Version]
  7. Chen, D.; Ray, A.K. Removal of toxic metal ions from wastewater by semiconductor photocatalysis. Chem. Eng. Sci. 2001, 56, 1561–1570. [Google Scholar] [CrossRef]
  8. Ramos-Delgado, N.A.; Gracia-Pinilla, M.A.; Maya-Trevino, L.; Hinojosa-Reyes, L.; Guzman-Mar, J.L.; Hernandez-Ramirez, A. Solar photocatalytic activity of TiO2 modified with WO3 on the degradation of an organophosphorus pesticide. J. Hazard. Mater. 2013, 263(Pt. 1), 36–44. [Google Scholar] [CrossRef]
  9. Rizzo, L.; Della Sala, A.; Fiorentino, A.; Li Puma, G. Disinfection of urban wastewater by solar driven and UV lamp—TiO2 photocatalysis: Effect on a multi drug resistant Escherichia coli strain. Water Res. 2014, 53, 145–152. [Google Scholar] [CrossRef] [PubMed]
  10. Sakai, T.; Da Loves, A.; Okada, T.; Mishima, S. Titania/CnTAB nanoskeleton as adsorbent and photocatalyst for removal of alkylphenols dissolved in water. J. Hazard. Mater. 2013, 248, 487–495. [Google Scholar] [CrossRef] [Green Version]
  11. Volnistem, E.A.; Bini, R.D.; Silva, D.M.; Rosso, J.M.; Dias, G.S.; Cotica, L.F.; Santos, I.A. Intensifying the photocatalytic degradation of methylene blue by the formation of BiFeO3/Fe3O4 nanointerfaces. Ceram. Int. 2020, 46, 18768–18777. [Google Scholar] [CrossRef]
  12. Volnistem, E.A.; Bini, R.D.; Dias, G.S.; Cotica, L.F.; Santos, I.A. Photodegradation of methylene blue by mechanosynthesized BiFeO3 submicron particles. Ferroelectrics 2018, 534, 190–198. [Google Scholar] [CrossRef]
  13. Yu, J.; Wang, S.; Low, J.; Xiao, W. Enhanced photocatalytic performance of direct Z-scheme g-C3N4-TiO2 photocatalysts for the decomposition of formaldehyde in air. Phys. Chem. Chem. Phys. 2013, 15, 16883–16890. [Google Scholar] [CrossRef]
  14. Hu, S.Z.; Li, F.Y.; Fan, Z.P.; Gui, J.Z. The effect of H2-CCl4 mixture plasma treatment on TiO2 photocatalytic oxidation of aromatic air contaminants under both UV and visible light. Chem. Eng. J. 2014, 236, 285–292. [Google Scholar] [CrossRef]
  15. Zou, X.; Li, X.; Zhao, Q.; Liu, S. Synthesis of LaVO4/TiO2 heterojunction nanotubes by sol-gel coupled with hydrothermal method for photocatalytic air purification. J. Colloid. Interf. Sci. 2012, 383, 13–18. [Google Scholar] [CrossRef] [PubMed]
  16. Medina-Valtierra, J.; Frausto-Reyes, C.; Ramirez-Ortiz, J.; Camarillo-Martinez, G. Self-cleaning test of doped TiO2-coated glass plates under solar exposure. Ind. Eng. Chem. Res. 2009, 48, 598–606. [Google Scholar] [CrossRef]
  17. Hebeish, A.A.; Abdelhady, M.M.; Youssef, A.M. TiO2 nanowire and TiO2 nanowire doped Ag-PVP nanocomposite for antimicrobial and self-cleaning cotton textile. Carbohyd. Polym. 2013, 91, 549–559. [Google Scholar] [CrossRef]
  18. Chen, J.; Wu, X.J.; Yin, L.; Li, B.; Hong, X.; Fan, Z.; Chen, B.; Xue, C.; Zhang, H. One-pot synthesis of CdS nanocrystals hybridized with single-layer transition-metal dichalcogenide nanosheets for efficient photocatalytic hydrogen evolution. Angew. ChemInt. Ed. Engl. 2015, 54, 1210–1214. [Google Scholar] [CrossRef]
  19. Zhang, Z.; Li, A.; Cao, S.W.; Bosman, M.; Li, S.; Xue, C. Direct evidence of plasmon enhancement on photocatalytic hydrogen generation over Au/Pt-decorated TiO2 nanofibers. Nanoscale 2014, 6, 5217–5222. [Google Scholar] [CrossRef]
  20. Zhang, N.; Shi, J.; Mao, S.S.; Guo, L. Co3O4 quantum dots: Reverse micelle synthesis and visible-light-driven photocatalytic overall water splitting. Chem. Commun. 2014, 50, 2002–2004. [Google Scholar] [CrossRef]
  21. Wang, X.; Xu, Q.; Li, M.; Shen, S.; Wang, Y.; Feng, Z.; Shi, J.; Han, H.; Li, C. Photocatalytic overall water splitting promoted by an alpha-beta phase junction on Ga2O3. Angew. Chem. Int. 2012, 51, 13089–13092. [Google Scholar] [CrossRef] [PubMed]
  22. Huang, J.G.; Zhao, X.G.; Zheng, M.Y.; Li, S.; Wang, Y.; Liu, X.J. Preparation of N-doped TiO2 by oxidizing TiN and its application on phenol degradation. Water Sci. Technol. 2013, 68, 934–939. [Google Scholar] [CrossRef]
  23. Mohammadi, K.; Sadeghi, M.; Azimirad, R. Facile synthesis of SrFe12O19 nanoparticles and its photocatalyst application. J. Mater. Sci. Mater. Electron. 2017, 28, 10042–10047. [Google Scholar] [CrossRef]
  24. Mohammadi, K.; Sadeghi, M.; Azimirad, R.; Ebrahimi, M. Barium hexaferrite nanoparticles: Morphology-controlled preparation, characterization and investigation of magnetic and photocatalytic properties. J. Mater. Sci. Mater. Electron. 2017, 28, 9983–9988. [Google Scholar] [CrossRef]
  25. Shieh, D.L.; Lin, Y.S.; Yeh, J.H.; Chen, S.C.; Lin, B.C.; Lin, J.L. N-doped, porous TiO2 with rutile phase and visible light sensitive photocatalytic activity. Chem. Commun. 2012, 48, 2528–2530. [Google Scholar] [CrossRef]
  26. Zhou, X.; Lu, J.; Jiang, J.; Li, X.; Lu, M.; Yuan, G.; Wang, Z.; Zheng, M.; Seo, H.J. Simple fabrication of N-doped mesoporous TiO2 nanorods with the enhanced visible light photocatalytic activity. Nanoscale Res. Lett. 2014, 9, 34. [Google Scholar] [CrossRef] [PubMed] [Green Version]
  27. Chen, X.; Burda, C. The electronic origin of the visible-light absorption properties of C-, N- and S-doped TiO2 nanomaterials. J. Am. Chem. Soc. 2008, 130, 5018–5019. [Google Scholar] [CrossRef]
  28. Li, H.; Zhang, X.; Huo, Y.; Zhu, J. Supercritical preparation of a highly active S-doped TiO2 photocatalyst for methylene blue mineralization. Environ. Sci. Technol. 2007, 41, 4410–4414. [Google Scholar] [CrossRef]
  29. Li, Z.; Ding, D.; Ning, C. P-Type hydrogen sensing with Al-and V-doped TiO2 nanostructures. Nanoscale Res. Lett. 2013, 8, 25. [Google Scholar] [CrossRef] [Green Version]
  30. Pan, L.; Wang, S.; Zou, J.J.; Huang, Z.F.; Wang, L.; Zhang, X. Ti3+-defected and V-doped TiO2 quantum dots loaded on MCM-41. Chem. Commun. 2014, 50, 988–990. [Google Scholar] [CrossRef] [PubMed]
  31. Zhang, Z.; Shao, C.; Zhang, L.; Li, X.; Liu, Y. Electrospun nanofibers of V-doped TiO2 with high photocatalytic activity. J. Colloid. Interf. Sci. 2010, 351, 57–62. [Google Scholar] [CrossRef]
  32. Liu, G.; Han, C.; Pelaez, M.; Zhu, D.; Liao, S.; Likodimos, V.; Ioannidis, N.; Kontos, A.G.; Falaras, P.; Dunlop, P.S.; et al. Synthesis, characterization and photocatalytic evaluation of visible light activated C-doped TiO2 nanoparticles. Nanotechnology 2012, 23, 294003. [Google Scholar] [CrossRef]
  33. Yu, J.; Zhou, P.; Li, Q. New insight into the enhanced visible-light photocatalytic activities of B-, C- and B/C-doped anatase TiO2 by first-principles. Phys. Chem. Chem. Phys. 2013, 15, 12040–12047. [Google Scholar] [CrossRef]
  34. Zhang, W.J.; Ma, Z.; Du, L.; Li, H. Role of PEG4000 in sol-gel synthesis of Sm2Ti2O7 photocatalyst for enhanced activity. J. Alloy. Compd. 2017, 704, 26–31. [Google Scholar] [CrossRef]
  35. Wang, S.X.; Li, W.; Wang, S.; Jiang, J.M.; Chen, Z.H. Synthesis of well-defined hierarchical porous La2Zr2O7 monoliths via non-alkoxidesolegel process accompanied by phase separation. Micropor. Mesopor. Mat. 2016, 221, 32–39. [Google Scholar] [CrossRef]
  36. Zou, Z.; Ye, J.; Arakawa, H. Preparation, structural and photophysical properties of Bi2InNbO7 compound. J. Mater. Sci. 2000, 19, 1909–1911. [Google Scholar]
  37. Shin, H.; Byun, T.H. Effect of Pt loading onto ball-milled TiO2 on the visible-light photocatalytic activity to decompose rhodamine B. Res. J. Chem. Environ. 2013, 17, 41–46. [Google Scholar]
  38. Kanhere, P.; Shenai, P.; Chakraborty, S.; Ahuja, R.; Zheng, J.; Chen, Z. Mono- and co-doped NaTaO3 for visible light photocatalysis. Phys. Chem. Chem. Phys. 2014, 16, 16085–16094. [Google Scholar] [CrossRef] [PubMed] [Green Version]
  39. Daskalaki, V.M.; Antoniadou, M.; Li Puma, G.; Kondarides, D.I.; Lianos, P. Solar light-responsive Pt/CdS/TiO2 photocatalysts for hydrogen production and simultaneous degradation of inorganic or organic sacrificial agents in wastewater. Environ. Sci. Technol. 2010, 44, 7200–7205. [Google Scholar] [CrossRef]
  40. Vaiano, V.; Sacco, O.; Sannino, D.; Ciambelli, P. Photocatalytic removal of spiramycin from wastewater under visible light with N-doped TiO2 photocatalysts. Chem. Eng. J. 2015, 261, 3–8. [Google Scholar] [CrossRef]
  41. Iliev, V.; Tomova, D.; Rakovsky, S. Nanosized N-doped TiO2 and gold modified semiconductors—photocatalysts for combined UV–visible light destruction of oxalic acid in aqueous solution. Desalination 2010, 260, 101–106. [Google Scholar] [CrossRef]
  42. Zhao, X.D.; Chen, D.H.; Zhang, Y.R.; Huang, M.H.; Deng, Z.B.; Zhou, Z. Optimization of hydrothermal synthesis conditions of N-doped TiO2 using response surface methodology for photocatalytic degradation of methylene blue. Fresen. Environ. Bull. 2016, 25, 4287–4293. [Google Scholar]
  43. Collazzo, G.C.; Foletto, E.L.; Jahn, S.L.; Villetti, M.A. Degradation of Direct Black 38 dye under visible light and sunlight irradiation by N-doped anatase TIO2 as photocatalyst. J. Environ. Manag. 2012, 98, 107–111. [Google Scholar] [CrossRef] [PubMed]
  44. Subhan, M.A.; Jhuma, S.S.; Saha, P.C.; Ahmed, J.; Asiri, A.M.; Rifat, T.P.; Raihan, T.; Azad, A.K.; Rahman, M.M. Photocatalysis, enhanced anti-bacterial performance and discerning thiourea sensing of Ag2O·SnO2·TiO2 hetero-structure. J. Environ. Chem. Eng. 2020, 8, 104051. [Google Scholar] [CrossRef]
  45. Hasnat, M.A.; Safwan, J.A.; Islam, M.S.; Rahman, Z.; Karim, M.R.; Pirzada, T.J.; Samed, A.J.; Rahman, M.M. Electrochemical decolorization of Methylene blue at Pt electrode in KCl solution for environmental remediation. J. Ind. Eng. Chem. 2015, 21, 787–791. [Google Scholar] [CrossRef]
  46. Hossain, A.; Elias, M.; Sarker, D.R.; Diba, Z.R.; Mithun, J.M.; Azad, M.A.K.; Siddiquey, I.A.; Rahman, M.M.; Uddin, J.; Uddin, N. Synthesis of Fe- or Ag-doped TiO2–MWCNT nanocomposite thin films and their visible-light-induced catalysis of dye degradation and antibacterial activity. Res. Chem. Intermed. 2018, 44, 2667–2683. [Google Scholar] [CrossRef]
  47. Liu, Y.; Deng, Y.H.; Sun, Z.K.; Wei, J.; Zheng, G.F.; Asiri, A.M.; Khan, S.B.; Rahman, M.M.; Zhao, D.Y. Hierarchical Cu2S Microsponges Constructed from Nanosheets for Efficient Photocatalysis. Small 2013, 9, 2702–2708. [Google Scholar] [CrossRef] [PubMed]
  48. Luan, J.F.; Zhao, W.; Feng, J.W.; Cai, H.L.; Zheng, Z.; Pan, B.C.; Wu, X.S.; Zou, Z.G.; Li, Y.M. Structural, photophysical and photocatalytic properties of novel Bi2AlVO7. J. Hazard. Mater. 2009, 164, 781–789. [Google Scholar] [CrossRef]
  49. Xing, C.C.; Zhang, Y.; Liu, Y.P.; Wang, X.; Li, J.S.; Martinez-Alanis, P.R.; Spadaro, M.C.; Guardia, P.; Arbiol, J.; Llorca, J.; et al. Photodehydrogenation of ethanol over Cu2O/TiO2 heterostructures. Nanomaterials 2021, 11, 1399. [Google Scholar] [CrossRef]
  50. Stathi, P.; Solakidou, M.; Deligiannakis, Y. Lattice defects engineering in W-, Zr-doped BiVO4 by flame spray pyrolysis: Enhancing photocatalytic O2 evolution. Nanomaterials 2021, 11, 501. [Google Scholar] [CrossRef]
  51. Thomas, A.M.; Peter, J.; Nagappan, S.; Mohan, A.; Ha, C.S. Dual stimuli-responsive copper nanoparticles decorated SBA-15: A highly efficient catalyst for the oxidation of alcohols in water. Nanomaterials 2020, 10, 2051. [Google Scholar] [CrossRef]
  52. Wang, G.; Wu, F.; Zhang, X.; Luo, M.; Deng, N. Enhanced photodegradation of bisphenol A in the presence of β-cyclodextrin under UV light. J. Chem. Technol. Biot. 2006, 81, 805–811. [Google Scholar] [CrossRef]
  53. Low, J.; Jiang, C.; Cheng, B.; Wageh, S.; Al-Ghamdi, A.; Yu, J. A review of direct Z-scheme photocatalysts. Small Methods 2017, 1700080, 1–21. [Google Scholar] [CrossRef]
  54. Li, X.; Yan, X.; Zuo, S.; Lu, X.; Luo, S.; Li, Z.; Yao, C.; Ni, C. Construction of LaFe1−xMnxO3 /attapulgite nanocomposite for photo-SCR of NOx at low temperature. Chem. Eng. J. 2017, 320, 211–221. [Google Scholar] [CrossRef] [Green Version]
  55. Li, X.; Shi, H.; Zhu, W.; Zuo, S.; Lu, X.; Luo, S.; Yao, C.; Chen, Y. Nanocomposite LaFe1-xNixO3/Palygorskite catalyst for photo-assisted reduction of NOx: Effect of Ni doping. Appl. Catal. B Environ. 2018, 231, 92–100. [Google Scholar] [CrossRef]
  56. Li, X.; Yan, X.; Lu, X.; Zuo, S.; Li, Z.; Yao, C.; Ni, C. Photo-assisted selective catalytic reduction of NO by Z-scheme natural clay based photocatalyst: Insight into the effect of graphene coupling. J. Catal. 2018, 357, 59–68. [Google Scholar] [CrossRef]
  57. Luo, J.; Chen, J.; Guo, R.; Qiu, Y.; Li, W.; Zhou, X.; Ning, X.; Zhan, L. Rational construction of direct Z-scheme LaMnO3/g-C3N4 hybrid for improved visible-light photocatalytic tetracycline degradation. Sep. Purif. Technol. 2018, 211, 882–894. [Google Scholar] [CrossRef]
  58. Tang, Y.; Tao, Y.; Zhou, T.; Yang, B.; Wang, Q.; Zhu, Z.; Xie, A.; Luo, S.; Yao, C.; Li, X. Direct Z-scheme La1-xCexMnO3 catalyst for photothermal degradation of toluene. Environ. Sci. Pollut. R. 2019, 26, 36832–36844. [Google Scholar] [CrossRef]
  59. Wang, J.H.; Zou, Z.G.; Ye, J.H. Synthesis, Structure and Photocatalytic Property of a New Hydrogen Evolving Photocatalyst Bi2InTaO7. Mater. Sci. Forum. 2003, 423-425, 485–490. [Google Scholar] [CrossRef]
  60. Kohno, M.; Ogura, S.; Sato, K.; Inoue, Y. Properties of photocatalysts with tunnel structures: Formation of a surface lattice O radical by the UV irradiation of BaTi4O9 with a pentagonal-prism tunnel structure. Chem. Phys. Lett. 1997, 267, 72–76. [Google Scholar] [CrossRef]
  61. Kudo, A.; Kato, H.; Nakagawa, S. Water Splitting into H2 and O2 on New Sr2M2O7 (M = Nb and Ta) Photocatalysts with Layered Perovskite Structures: Factors Affecting the Photocatalytic Activity. J. Phys. Chem. B. 2000, 104, 571–575. [Google Scholar] [CrossRef]
  62. Nowak, M.; Kauch, B.; Szperlich, P. Determination of energy band gap of nanocrystalline SbSI. Rev. Sci. Instrum. 2009, 80, 046107. [Google Scholar] [CrossRef]
  63. Zhou, F.; Kang, K.; Maxisch, T.; Ceder, G.; Morgan, D. The electronic structure and band gap of LiFePO4 and LiMnPO4. Solid State Commun. 2004, 132, 181–186. [Google Scholar] [CrossRef] [Green Version]
  64. Tauc, J.; Grigorov, R.; Vancu, A. Optical properties and electronic structure of amorphous germanium. Phys. Status Solidi. 1966, 15, 627–637. [Google Scholar] [CrossRef]
  65. Butler, M.A. Photoelectrolysis with YFeO3 electrodes. J. Appl. Phys. 1977, 48, 1914–1920. [Google Scholar] [CrossRef]
  66. Cui, B.Y.; Cui, H.T.; Li, Z.R.; Dong, H.Y.; Li, X.; Zhao, L.F.; Wang, J.W. Novel Bi3O5I2 hollow microsphere and its enhanced photocatalytic activity. Catalysts 2019, 9, 709. [Google Scholar] [CrossRef] [Green Version]
  67. Vallejo, W.; Cantillo, A.; Salazar, B.; Diaz-Uribe, C.; Ramos, W.; Romero, E.; Hurtado, M. Comparative study of ZnO thin films doped with transition metals (Cu and Co) for methylene blue photodegradation under visible irradiation. Catalysts 2020, 10, 528. [Google Scholar] [CrossRef]
  68. Zhuang, Y.; Zhou, M.; Gu, J.; Li, X. Spectrophotometric and high performance liquid chromatographic methods for sensitive determination of bisphenol A. Spectrochim. Acta. A 2013, 122, 153–157. [Google Scholar] [CrossRef] [PubMed]
  69. Liu, W.; Yang, Q.; Wang, Z.; Lv, X.F.; Yang, Z.L. Photocatalytic degradation of trichloroethylene over BiOCl under UV irradiation. Appl. Organomet. Chem. 2018, 32, e4354. [Google Scholar] [CrossRef]
  70. Cheng, X.X.; Chong, R.F.; Cao, Y.Y.; Li, D.L.; Chang, Z.X.; Zhang, L. Influence of Inorganic Anions on Photocatalytic Degeneration of Methylene Blue on Ag3PO4. J. Nanosci. Nanotechnol. 2016, 16, 12489–12497. [Google Scholar] [CrossRef]
  71. Bhatt, D.K.; Patel, U.D. Photocatalytic degradation of Reactive Black 5 using Ag3PO4 under visible light. J. Phys. Chem. Solids 2021, 149, 109768. [Google Scholar] [CrossRef]
  72. Wang, G.; Chen, Q.H.; Liu, Y.P.; Ma, D.; Xin, Y.J.; Ma, X.H.; Zhang, X.W. In situ synthesis of graphene/WO3 co-decorated TiO2 nanotube array photoelectrodes with enhanced photocatalytic activity and degradation mechanism for dimethyl phthalate. Chem. Eng. J. 2017, 337, 322–332. [Google Scholar] [CrossRef]
  73. Liu, Y.; Yu, S.; Zhao, Z.Y.; Dong, F.; Dong, X.A.; Zhou, Y. N-Doped Bi2O2CO3/graphene quantum dot composite photocatalyst: Enhanced visible-light photocatalytic NO oxidation and in situ DRIFTS studies. J. Phys. Chem. C 2017, 121, 12168–12177. [Google Scholar] [CrossRef]
  74. Jiang, L.B.; Yuan, X.Z.; Zeng, G.M.; Liang, J.; Chen, X.H.; Yu, H.B.; Wang, H.; Wu, Z.B.; Zhang, J.; Xiong, T. In-situ synthesis of direct solid-state dual Z-scheme WO3/g-C3N4/Bi2O3 photocatalyst for the degradation of refractory pollutant. Appl. Catal. B 2018, 227, 376–385. [Google Scholar] [CrossRef]
  75. Cao, W.; Jiang, C.Y.; Chen, C.; Zhou, H.F.; Wang, Y.P. A novel Z-scheme CdS/Bi4O5Br2 heterostructure with mechanism analysis: Enhanced photocatalytic performance. J. Alloys Compd. 2021, 861, 158554. [Google Scholar] [CrossRef]
  76. Zhu, H.; Li, Z.; Yang, J. A novel composite hydrogel for adsorption and photocatalytic degradation of bisphenol A by visible light irradiation. Chem. Eng. J. 2018, 334, 1679–1690. [Google Scholar] [CrossRef]
  77. Du, J.; Bao, J.; Liu, Y.; Ling, H.; Zheng, H.; Kim, S.H.; Dionysiou, D.D. Efficient activation of peroxymonosulfate by magnetic Mn-MGO for degradation of bisphenol A. J. Hazard. Mater. 2016, 320, 150–159. [Google Scholar] [CrossRef]
  78. Sharma, J.; Mishra, I.M.; Dionysiou, D.D.; Kumar, V. Oxidative removal of Bisphenol A by UV-C/peroxymonosulfate (PMS): Kinetics, influence of co-existing chemicals and degradation pathway. Chem. Eng. J. 2015, 276, 193–204. [Google Scholar] [CrossRef]
  79. Deonikar, V.G.; Patil, S.S.; Tamboli, M.S.; Ambekar, J.D.; Kulkarni, M.V.; Panmand, R.P.; Umarji, G.G.; Shinde, M.D.; Rane, S.B.; Munirathnam, N.R.; et al. Growth study of hierarchical Ag3PO4/LaCO3OH heterostructures. Phys. Chem. Chem. Phys. 2017, 19, 20541–20550. [Google Scholar] [CrossRef]
  80. Patil, S.S.; Tamboli, M.S.; Deonikar, V.G.; Umarji, G.G.; Ambekar, J.D.; Kulkarni, M.V.; Kolekar, S.S.; Kale, B.B.; Patil, D.R. Magnetically separable Ag3PO4/NiFe2O4 composites with enhanced photocatalytic activity. Dalton T 2015, 44, 20426–20434. [Google Scholar] [CrossRef]
  81. Nguyen, T.B.; Doong, R.A. Heterostructured ZnFe2O4/TiO2 nanocomposites with a highly recyclable visible-light-response for bisphenol A degradation. RSC Adv. 2017, 7, 50006–50016. [Google Scholar] [CrossRef] [Green Version]
  82. Zhang, C.J.; Li, N.J.; Chen, D.Y.; Xu, Q.F.; Li, H.; He, J.H.; Lu, J.M. The ultrasonic-induced-piezoelectric enhanced photocatalytic performance of ZnO/CdS nanofibers for degradation of bisphenol A. J. Alloy Compd. 2021, 885, 160987. [Google Scholar] [CrossRef]
Figure 1. X-ray powder diffraction patterns and Rietveld refinements of Gd2BiTaO7 (red dotted line represented experimental XRD data of Gd2BiTaO7; blue solid line represented simulative XRD data of Gd2BiTaO7; black solid line represented a difference between experimental XRD data of Gd2BiTaO7 and simulative XRD data of Gd2BiTaO7; green vertical line represented observed reflection positions).
Catalysts 12 00022 g001
Figure 2. UV-Vis diffuse reflectance spectra of Gd2BiTaO7.
Catalysts 12 00022 g002
Figure 3. UV-Vis diffuse reflectance spectra and band gap of Ag3PO4.
Catalysts 12 00022 g003
Figure 4. Ultraviolet photoelectron spectroscopy of Ag3PO4.
Catalysts 12 00022 g004
Figure 5. Fourier transform infrared spectra of Ag3PO4.
Catalysts 12 00022 g005
Figure 6. UV-visible absorption spectra of time-dependent bisphenol A with Ag3PO4 and potassium persulfate as photocatalysts under visible light irradiation.
Catalysts 12 00022 g006
Figure 7. The effect of different concentration of Ag3PO4 on the photocatalytic removal efficiency of bisphenol A with Ag3PO4 as a photocatalyst under visible light irradiation.
Catalysts 12 00022 g007
Figure 8. The effect of different anions on the degradation efficiency of bisphenol A with Ag3PO4 and potassium persulfate as photocatalysts under visible light irradiation.
Catalysts 12 00022 g008
Figure 9. The effect of different cations on the degradation efficiency of bisphenol A with Ag3PO4 and potassium persulfate as photocatalysts under visible light irradiation.
Catalysts 12 00022 g009
Figure 10. (a) DMPO spin trapping EPR spectra with Ag3PO4 as catalyst in aqueous dispersion for DMPO–OH and DMPO–O2 under visible light irradiation or under the condition of darkness; (b) DMPO spin trapping EPR spectra with Ag3PO4 and potassium persulfate as catalysts or with Ag3PO4 as catalyst in aqueous dispersion for DMPO–SO4•−, DMPO–OH and DMPO–O2 under visible light irradiation.
Catalysts 12 00022 g010
Figure 11. (a) The effect of different pH values on removal efficiency of bisphenol A with Ag3PO4 and potassium persulfate as catalysts under visible light irradiation or with potassium persulfate as catalyst under conditions of darkness; (b) temporal spectral changes of aqueous solutions of bisphenol A with Ag3PO4 and potassium persulfate as catalysts under visible light irradiation at pH = 10.9.
Catalysts 12 00022 g011aCatalysts 12 00022 g011b
Figure 12. (a) Effect of different radical scavengers on removal rate of bisphenol A with Ag3PO4 and potassium persulfate as catalysts under visible light irradiation; (b) effect of different radical scavengers such as benzoquinone and isopropanol on removal efficiency of bisphenol A with Ag3PO4 and potassium persulfate as catalysts under visible light irradiation.
Catalysts 12 00022 g012aCatalysts 12 00022 g012b
Figure 13. Concentration variation curves of bisphenol A with Ag3PO4 and potassium persulfate as catalysts under visible light irradiation for three cycles of degradation tests.
Catalysts 12 00022 g013
Figure 14. Concentration variation curves of total organic carbon during photocatalytic degradation of bisphenol A with Ag3PO4 and potassium persulfate as catalysts under visible light irradiation for three cycles of degradation tests.
Catalysts 12 00022 g014
Figure 15. Concentration variation curves of bisphenol A during photocatalytic degradation of bisphenol A with Ag3PO4/Gd2BiTaO7 heterojunction photocatalyst as photocatalyst, with N-doped TiO2 as photocatalyst, with Ag3PO4 and potassium persulfate as catalysts, with ZnFe2O4-TiO2 nanocomposite as photocatalyst or with ZnO/CdS hierarchical heterojunction as photocatalyst under visible light irradiation.
Catalysts 12 00022 g015
Figure 16. Concentration variation curves of total organic carbon during photocatalytic degradation of bisphenol A in pharmaceutical wastewater with Ag3PO4/Gd2BiTaO7 heterojunction as photocatalyst, with N-doped TiO2 as photocatalyst, with Ag3PO4 and potassium persulfate as catalysts, with ZnFe2O4-TiO2 nanocomposites as photocatalyst or with ZnO/CdS hierarchical heterojunction as photocatalyst under visible light irradiation.
Catalysts 12 00022 g016
Figure 17. Concentration variation curves of total organic carbon during photocatalytic degradation of bisphenol A in pharmaceutical wastewater with Ag3PO4/Gd2BiTaO7 heterojunction as photocatalyst under visible light irradiation for three cycle degradation tests.
Catalysts 12 00022 g017
Figure 18. Concentration variation curves of bisphenol A during photocatalytic degradation of bisphenol A in pharmaceutical wastewater with Ag3PO4/Gd2BiTaO7 heterojunction as photocatalyst under visible light irradiation for three cycle degradation tests.
Catalysts 12 00022 g018
Figure 19. Observed first-order kinetic plots for the photocatalytic degradation of bisphenol A with Ag3PO4/Gd2BiTaO7 heterojunction as photocatalyst, with N-doped TiO2 as photocatalyst or with Ag3PO4 and potassium persulfate as catalysts under visible light irradiation.
Catalysts 12 00022 g019
Figure 20. Possible photocatalytic degradation mechanism of bisphenol A with Ag3PO4/Gd2BiTaO7 heterojunction as photocatalyst under visible light irradiation.
Catalysts 12 00022 g020
Figure 21. (a) XPS survey spectrum of the Ag3PO4/Gd2BiTaO7 heterojunction photocatalyst before the reaction of photocatalytic degradation of bisphenol A; (b) XPS survey spectrum of the Ag3PO4/Gd2BiTaO7 heterojunction photocatalyst after the reaction of photocatalytic degradation of bisphenol A.
Catalysts 12 00022 g021
Figure 22. XPS spectra of O2−, Ag+, P5+, Gd3+, Bi3+ and Ta5+ from the Ag3PO4/Gd2BiTaO7 heterojunction photocatalyst before the reaction of photocatalytic degradation of bisphenol A.
Catalysts 12 00022 g022
Figure 23. XPS spectra of O2−, Ag+, P5+, Gd3+, Bi3+ and Ta5+ from the Ag3PO4/Gd2BiTaO7 heterojunction photocatalyst after the reaction of photocatalytic degradation of bisphenol A.
Catalysts 12 00022 g023aCatalysts 12 00022 g023b
Figure 24. SEM photograph of Ag3PO4/Gd2BiTaO7 heterojunction photocatalyst.
Catalysts 12 00022 g024
Figure 25. EDS spectrum of Ag3PO4/Gd2BiTaO7 heterojunction photocatalyst.
Catalysts 12 00022 g025
Figure 26. EDS elemental mapping of Ag3PO4/Gd2BiTaO7 heterojunction photocatalyst (Ag, P, O from Ag3PO4 and Gd, Bi, Ta, O from Gd2BiTaO7).
Catalysts 12 00022 g026aCatalysts 12 00022 g026b
Table 1. Structural parameters of Gd2BiTaO7 prepared by solid-state reaction method.
AtomxyzOccupation
Factor
Gd0001
Bi0.50.50.50.5
Ta0.50.50.50.5
O(1)−0.1850.1250.1251
O(2)0.1250.1250.1251
Publisher’s Note: MDPI stays neutral with regard to jurisdictional claims in published maps and institutional affiliations.

