Article

Effect of Calcium Doping Using Aqueous Phase Reforming of Glycerol over Sonochemically Synthesized Nickel-Based Supported ZrO2 Catalyst

by
Ain Syuhada
1,
Mariam Ameen
1,2,*,
Farooq Sher
3,*,
Mohammad Tazli Azizan
4,
Aqsha Aqsha
5,6,7,
Mohd Hizami Mohd Yusoff
1,2 and
Muhamad Syafiq Hazwan Ruslan
8,9
1
Department of Chemical Engineering, Universiti Teknologi PETRONAS, Seri Iskandar 32610, Perak, Malaysia
2
HiCoE, Center for Biofuel and Biochemical Research (CBBR), Institute of Sustainable Buildings (ISB), Universiti Teknologi PETRONAS, Seri Iskandar 32610, Perak, Malaysia
3
Department of Engineering, School of Science and Technology, Nottingham Trent University, Nottingham NG11 8NS, UK
4
Faculty of Chemical Engineering Technology, Universiti Malaysia Perlis, Kangar 01000, Perlis, Malaysia
5
Research Centre on New and Renewable Energy, Institut Teknologi Bandung, Jl. Ganesha No. 10, Bandung 40132, Indonesia
6
Department of Bioenergy Engineering and Chemurgy, Faculty of Industrial Technology, Institut Teknologi Bandung, Sumedang 45363, Indonesia
7
Department of Chemical Engineering, Faculty of Industrial Teknology, Institut Teknologi Bandung, Jl. Ganesha No. 10, Bandung 40132, Indonesia
8
School of Chemical Engineering, College of Engineering, Universiti Teknologi MARA, Shah Alam 40450, Selangor, Malaysia
9
Centre of Lipids Engineering and Applied Research (CLEAR), Ibnu Sina Institute for Scientific & Industrial Research (Ibnu Sina ISIR), Universiti Teknologi Malaysia, Johor Bahru 81310, Johor, Malaysia
*
Authors to whom correspondence should be addressed.
Catalysts 2021, 11(8), 977; https://doi.org/10.3390/catal11080977
Submission received: 9 July 2021 / Revised: 12 August 2021 / Accepted: 12 August 2021 / Published: 16 August 2021
(This article belongs to the Special Issue Novel Electrocatalysts for CO2 Reduction)

Abstract

:
The aqueous phase reforming (APR) of glycerol was studied using sonochemically synthesized 10%Ni-x%Ca/ZrO2 catalysts (where x = 0, 0.5, 3, and 5) for the production of value-added liquid products. The APR reaction was performed in a batch reactor under the following conditions: 20 bar, 230 °C 450 rpm, and 1 h of reaction time. The synthesized catalysts were characterized using XRD, FESEM, BET, and H2-TPR to observe the effect of Ca doping on the physio-chemical properties of the catalysts. The results revealed that, at higher Ca loading, the catalysts experienced serious particles’ agglomeration, which resulted in a larger particles’ size, smaller surface area, and smaller pore volume owing to uneven distribution of the particles. The characterization results of the catalysts confirmed that the Us catalysts have a slightly higher surface area, pore volume, and pore size, as well as highly reducible and fine crystalline structure, compared with WI catalysts. The catalytic performance of the catalysts shows that 1,3-propanediol (1,3-PDO) and 1,2-propanediol (1,2-PDO) were the two main liquid products produced from this reaction. The highest selectivity of 1,3-PDO (23.84%) was obtained over the 10%Ni/ZrO2 catalyst, while the highest selectivity of 1,2-PDO (25.87%) was obtained over the 10%Ni-5%Ca/ZrO2 catalyst.

1. Introduction

The utilization of fossil fuels as the main energy source has led to various environmental problems such as global warming, climate change, and air pollution. This might be caused by the release of greenhouse gases (carbon dioxide, methane, carbon monoxide, and others) into the environment during the burning of fossil fuels. Yumashev, et al. [1] agreed that human development such as urbanization growth, business in total energy consumption, and the level of socio-economic development has influenced fossil fuel consumption. Therefore, to tackle these problems, biodiesel was identified as an alternative new energy source to replace the current fossil fuels. Biodiesel is mainly produced from renewable resources such as vegetable oils, yellow grease, used cooking oils, or animal fats through the transesterification process [2]. During the last decade, the demand for biodiesel in the market has been continuously growing and it is expected that, by the year 2027, global biodiesel production will reach up to 4 billion liters/year [3]. Glycerol is produced as the major byproduct during biodiesel production, with approximately 10 kg of glycerol being produced for every 100 kg of biodiesel produced [4]. However, the abundant supply of this glycerol in the market has led to a sharp decrement in glycerol prices to $0.04 from $0.66/lb [5].
Thus, researchers are now working on the conversion of this glycerol into other valuable liquid products through various catalytic reactions such as fermentation [6], hydrogenation [7], and reforming [8,9]. In all such cases, heterogeneous catalysts have been developed for this application owing to several advantages such as recyclability, high thermal stability, and easy separation from the product [10]. In 2002, Dumesic and co-workers were the first groups to discover the production of hydrogen gas (H2) and value-added chemicals via APR reaction utilizing oxygenated hydrocarbons. APR reaction operates at a relatively low temperature (210 to 250 °C) and pressure (1.5 to 5.0 MPa) compared with other reforming processes (steam reforming and autothermal reforming) [5]. Under these conditions, this APR reaction helps to minimize the undesirable decomposition reaction, which makes this process thermodynamically favorable. Besides that, this APR reaction can also be an alternative process to avoid the utilization of an external hydrogen source, as hydrogen is produced in situ during the reaction via WGS reaction [11,12].
Various metal-based catalysts such as Pt, Pd, and Cu have been studied for this APR reaction and, among them, the Pt-based catalyst is the most common metal catalyst used for this application thanks to its promising capabilities during the reaction [13]. Reynoso, et al. [14] proved that Pt/CoAl2O4 catalysts are highly active during the APR reaction, with glycerol conversion of 99%, and very stable over 100 h time on stream (TOS). Recently, researchers are moving to a cheaper metal-based catalyst, mainly Ni, for the APR reaction, in order to make this process more convenient and economically friendly for application in industry. Zhang and Xu [15] in their study proved that Ni-Al catalysts are highly selective toward the production of the desired product and are highly stable throughout the APR reaction. The addition of a promoter, mainly calcium metal, has recently captured interest, as it has been proven that this promoter enhances the performance of the catalysts during the activity [3]. The use of zirconia oxide (ZrO2) support has been reported recently for APR reaction, and it has been reported that the Ni catalyst supported on ZrO2 significantly improved the yield and selectivity of H2 compared with the other metal oxide support [16].
The catalyst synthesis method plays an important role in improving the physicochemical properties and activity of the catalyst. Many studies in the literature reported on the synthesis of catalysts using a conventional method such as wet impregnation and co-impregnation [17,18]. Although this conventional method involved only a simple mixing and stirring process, this process may lead to a serious particle agglomeration owing to uneven particle distribution [19]. Therefore, to overcome this problem, catalysts synthesized by the sonochemical method have been introduced. This method involved the introduction of high intensity ultrasonic waves, which has been proven to improve the physicochemical properties of the catalysts [20,21]. Shahbudin, et al. [22] investigated the effect of introducing ultrasound irradiation on the physicochemical properties and catalytic activity of Mo-Ni/Al2O3 and Mo-Ni/H-Y zeolite for APR of glycerol and sorbitol for value-added chemicals’ production. They reported that ultrasound irradiation helped to improve the textural properties of the catalysts, including particle dispersion and surface area, as well as the catalytic performance of the catalysts during APR reaction.
Therefore, in the present study, the sonochemical method was selected as the method for catalysts’ synthesis in order to target high selectivity of value-added products as well as to reduce particles’ agglomeration, which can lead to catalysts’ deactivation. To the best of our knowledge, the APR of glycerol using sonochemically synthesized Ni-Ca-based catalysts supported on ZrO2 has not been reported previously, which is the novelty of the present work. In the present study, the APR reaction was investigated using a series of sonochemically synthesized 10%Ni-x%Ca/ZrO2 catalysts (where x = 0, 0.5, 3, and 5) with emphasis on the effect of Ca loading on the physicochemical properties of the catalysts and the distribution of the liquid products. The physicochemical properties and performance of these sonochemically synthesized catalysts were then compared to wet impregnation catalysts to observe the effect of ultrasound irradiation. The synthesized catalysts were characterized using XRD, FESEM coupled with EDX and dot mapping, BET, and H2-TPR analysis. The performance of the catalysts during the reaction is investigated based on the selectivity of the liquid products and glycerol conversion.

2. Results and Discussion

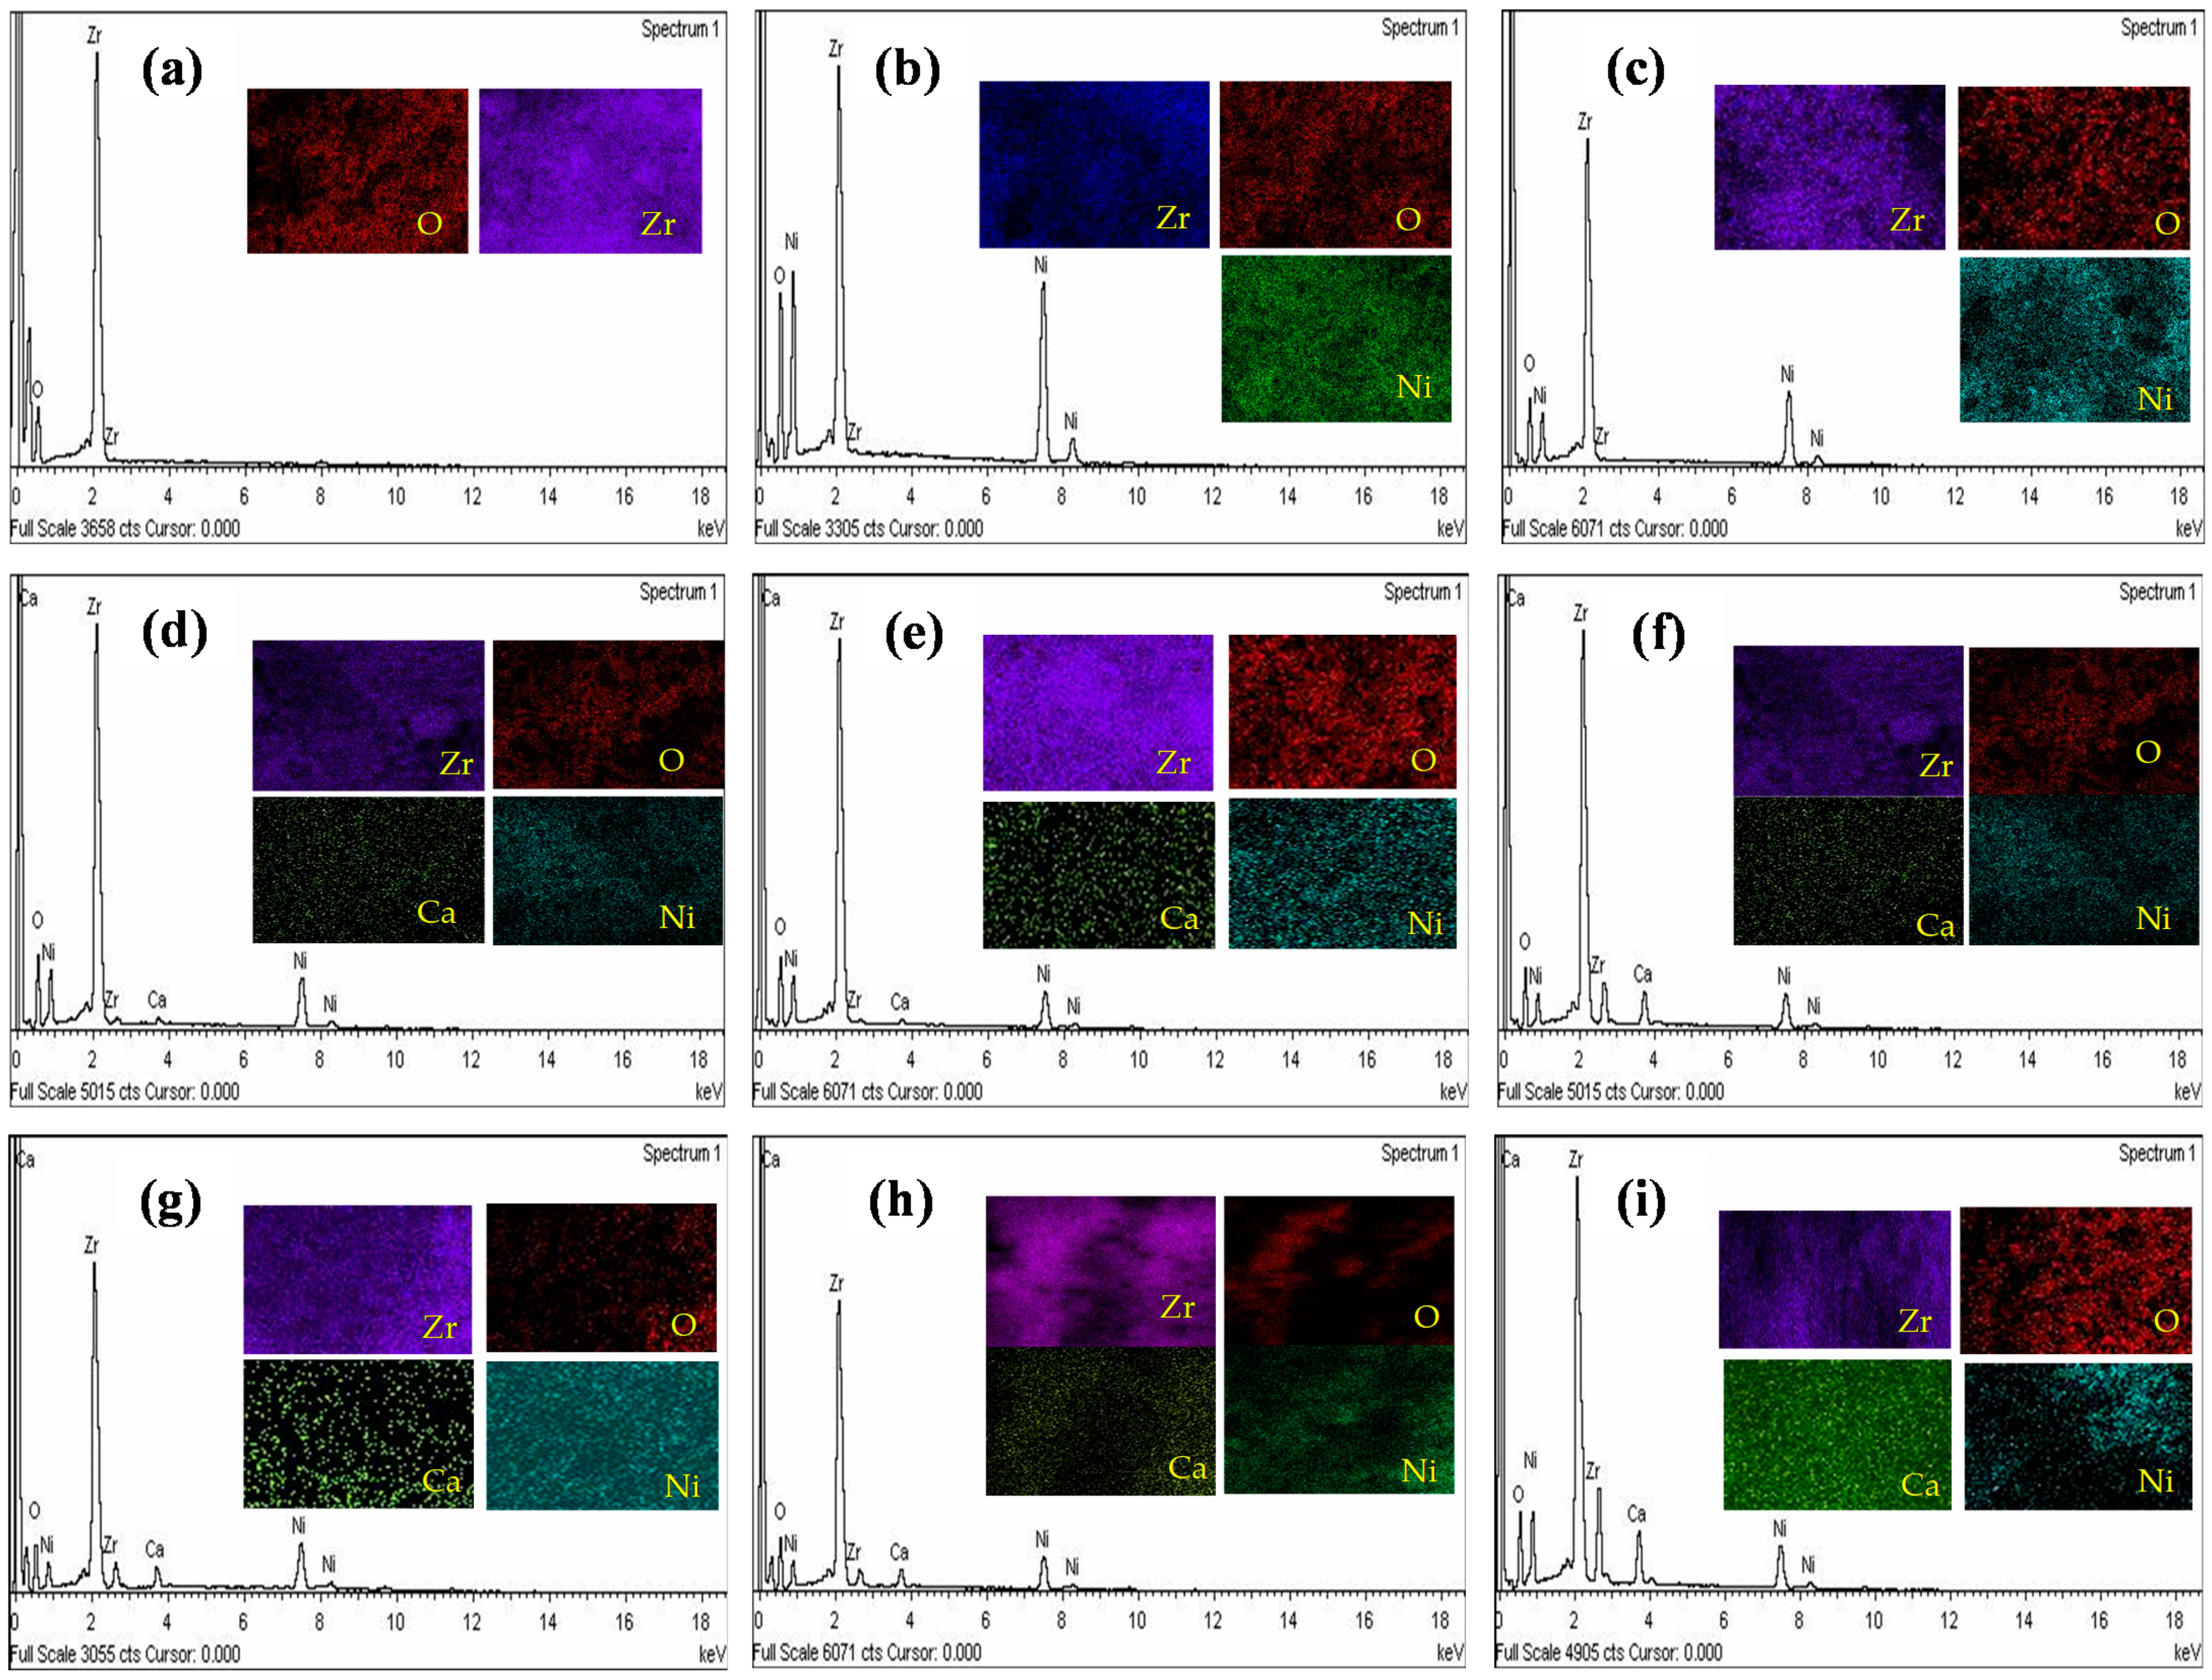
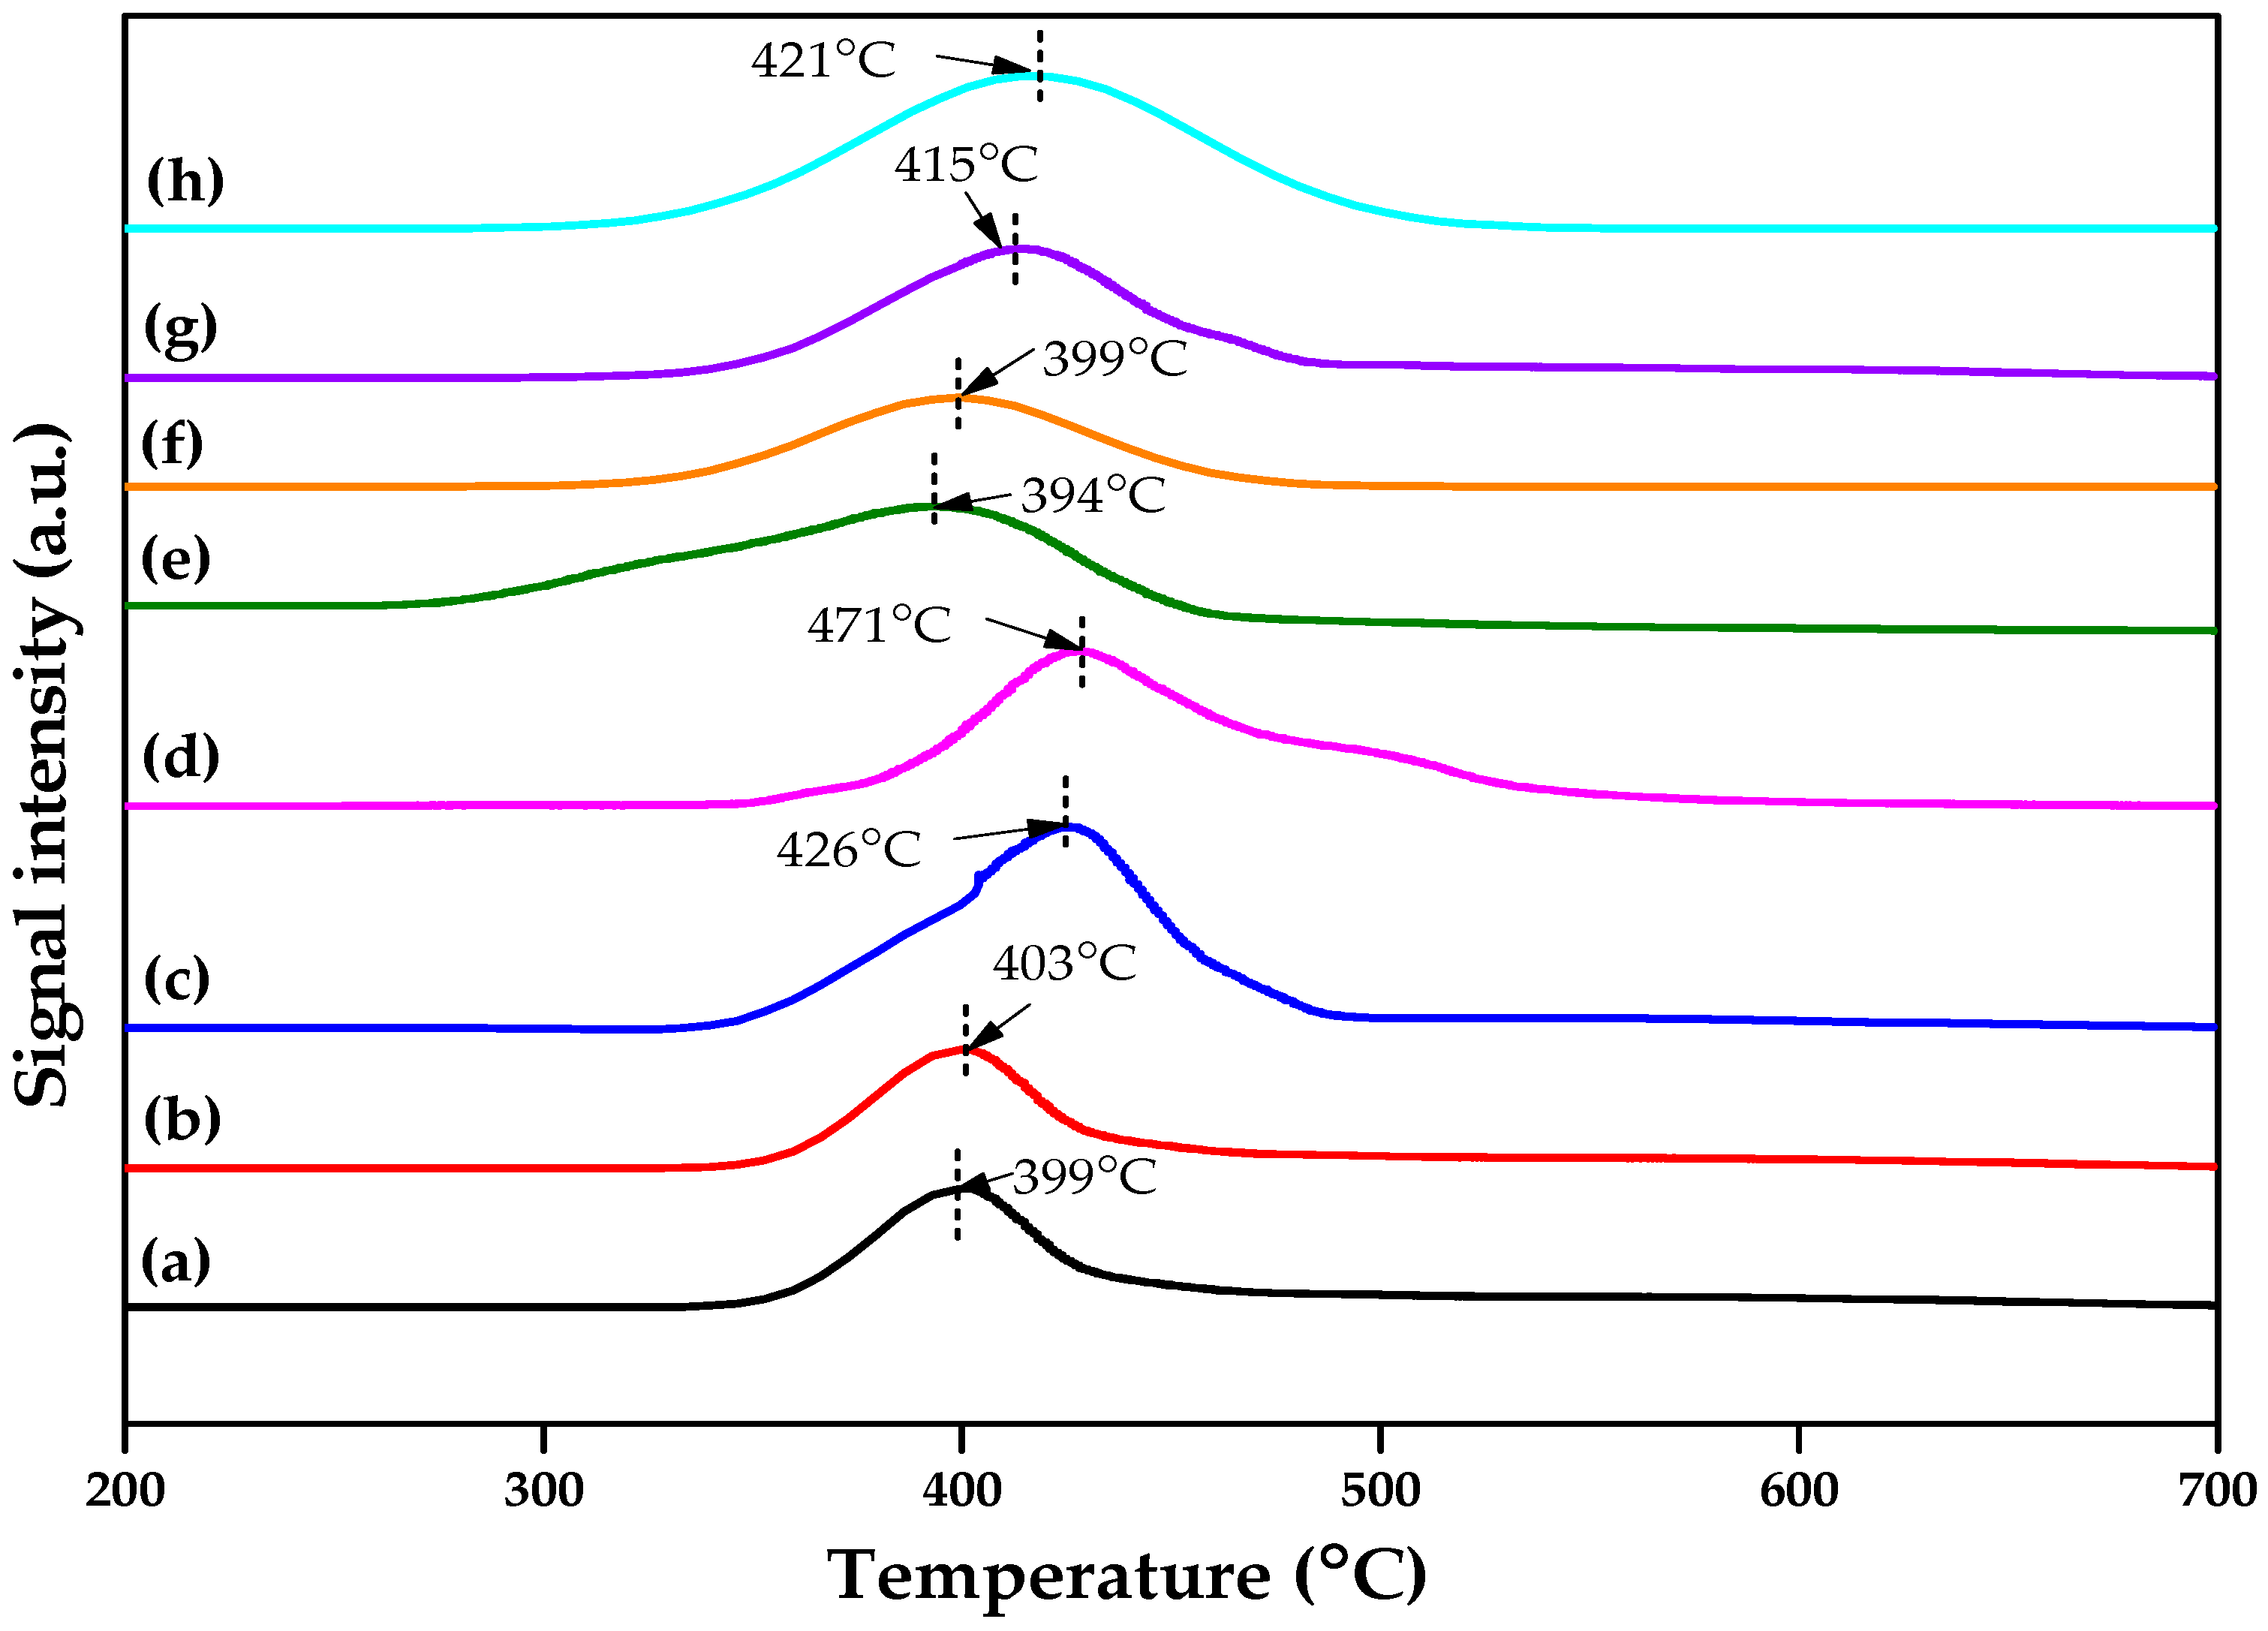
2.1. Structural and Morphological Analysis

Figure 1 presents the XRD patterns of ZrO2, 10%Ni/ZrO2_WI, 10%Ni-0.5%Ca/ZrO2_WI, 10%Ni-3%Ca/ZrO2_WI, 10%Ni-5%Ca/ZrO2_WI, 10%Ni/ZrO2_Us, 10%Ni-0.5%Ca/ZrO2_Us, 10%Ni-3%Ca/ZrO2_Us, and 10%Ni-5%Ca/ZrO2_Us catalysts. The detailed analysis of the XRD patterns shows that the diffraction peaks of ZrO2 are observed at 2θ = 17.54°, 24.16°, 24.55°, 28.28°,31.57°, 34.49°, 35.99°, 38.65°, 41.46°, 44.92°, 45.60°, 49.34°, 50.64°, 51.40°, 54.33°, 55.96°, 57.40°, 58.48°, 59.86°, 60.29°, 61.43°, 62.22°, 63.08°, 64.34°, 65.44°, 68.98°, and 69.16° (JCPDS NO. No. 65-1022), which represents the monoclinic structure of ZrO2 [23]. Nevertheless, the diffraction peaks of NiO are observed at 2θ = 37.49° and 43.1° (JCPDS No. 47-1049) [24,25]. Meanwhile, the CaO diffraction peaks are observed at 2θ = 37.4° and 44.4° (JCPDS NO. No. 82-1691), indicating the cubic structure of CaO [3]. However, the diffraction peaks of CaO are not clearly observed owing to the low content of Ca and overlapping of the CaO peaks with the NiO peaks for both US and WI methods, as agreed upon in the literature [3,26]. From the XRD patterns of all the catalysts, it is observed that the peak intensity of the metal oxides increased with the increase in metal loading. The increase in peaks’ intensity indicates the increase in the catalysts’ crystallinity [27].
For bimetallic Ni- and Ca-supported catalysts, clear and sharp peaks of NiO and CaO are observed for both sonochemical and wet impregnation catalysts. This proved the binary system of NiO-CaO presence in a separate metal oxide form rather than in a mixed oxide form [3]. Comparing the XRD spectra of Us and WI catalysts, it is observed that the sonochemically synthesized catalysts possess a lower peak intensity than wet impregnation catalysts. The low peak intensity indicates that the metal oxides are homogeneously dispersed on the support surface, and thus form a smaller crystallite size and prevent particles’ agglomeration [28]. Ahmadi, Haghighi and Ajamein [20] also reported that catalysts synthesized by the ultrasound-assisted method have slightly lower peak intensity, which indicates that the catalyst is less crystalline owing to the homogenous nucleation of the particles (Figure 1).
The specific surface area (SSA), pore volume, and pore size of WI and Us catalysts are reported in Table 1. The SSA, pore volume, and pore size of ZrO2 support were 24.00 m2/g, 0.42 cm3/g, and 5.08 nm, respectively. From the results, it is observed that the SSA of both WI catalysts Us catalysts decreased with an increase in metal loading. For Us catalysts, it is observed that the addition of Ni caused a slight increase in the specific surface area, pore volume, and pore size of the catalyst to 25.5 m2/g, 0.48 cm3/g, and 6.85 nm, respectively. Further, it increased in the amount of Ca doping from 0.5 to 5 wt.%, and decreased the SSA, pore volume, and pore size of the catalysts from 24.3 to 22.4 m2/g, 0.34 to 0.21 cm3/g, and 5.77 to 3.46 nm, respectively. However, for WI catalysts, the addition of Ni on the ZrO2 support decreased the SSA, pore volume, and pore size to 15.5 m2/g, −0.392 cm3/g, and 4.58 nm, respectively. Further, it increased in the amount of Ca doping from 0 to 5 wt.%, and decreased the SSA, pore volume, and pore size from 14.4 to 11.7 m2/g, 0.305 to 0.204 cm3/g, and 3.64 to 1.01 nm, respectively.
The decrease in surface area with an increase in metal loading might be caused by the particle agglomeration, which resulted in a larger particle size. Meanwhile, the decrease in pore volume and pore size with an increase in metal loading might be caused by the blockage of the pores of the support by the metal/s [29]. These findings agree with those of Numpilai, et al. [30], who also reported a similar trend of decrease in specific surface area, pore volume, and pore size with an increase in metal loading due to particles agglomeration. Comparatively, it was observed that Us catalysts have slightly larger specific surface area compared with WI catalysts. This might be caused by the prominent effect of ultrasound irradiation, which caused a more homogeneous particle distribution, leading to smaller particle size. Ahmadi, Haghighi and Ajamein [20] also reported that high ultrasonic power enhances the nucleation rate, resulting in highly dispersed particles and a greater surface area of catalysts. Furthermore, it is also observed that Us catalysts have a slightly larger pore size and pore volume compared with WI catalysts, a phenomena that leads to a more homogeneous particle distribution [31].
However, the lower specific surface area, pore volume, and pore size of WI methods show that the WI catalysts experienced particles’ agglomeration. This result is supported with XRD and FESEM analysis, as discussed in the previous section (Table 1). The FESEM images, EDX spectra, and dot mapping analysis were performed to observe the morphology of the catalysts synthesized by Us and WI methods, as shown in Figure 2 and Figure 3, respectively. From the FESEM images, it is observed that the ZrO2 support exists in the nano regime with spherical-shaped particles, and in some parts, the particles are highly agglomerated, which is evident by the EDX spectra and dot-mapping images. The addition of Ni on the supports slightly reduced the particle size for both Us and WI catalysts. Moreover, it is also observed that the addition of Ca as a promoter on the Ni-based catalysts has a significant impact on the particle size of the catalysts. It is observed that the increase in Ca loading resulted in larger particle size for both WI and US catalysts. This might be caused by the particles’ agglomeration at higher metal composition owing to uneven particles’ distribution, which is evident by the EDX spectra and dot-mapping images of the catalysts [32,33].
Comparatively, FESEM images of all the catalysts clearly show that sonochemically synthesized catalysts have slightly smaller particles size with homogenous particle distribution, as confirmed by the EDX spectra and dot mapping images. Meanwhile, FESEM images of wet impregnation catalysts show that the catalysts have slightly bigger particle size owing to particles’ agglomeration, which is evident by the EDX spectra and dot mapping images. Particle agglomeration is the major cause of catalysts’ deactivation, which can reduce the activity of the catalysts. Similarly, the decreased in particle agglomeration of catalysts synthesized by the Us method is mainly caused by the introduction of the high-intensity sound wave, which enhanced the nucleation rate of the catalysts and led to homogeneous particles’ distribution, as reported in the literature [20] (Figure 2 and Figure 3). This finding aligns with the XRD results, which confirmed that the Us catalysts have a smaller crystallite size with good metallic crystallites’ dispersion over all the supports compared with WI catalysts (Figure 1).
The reducibility of the catalysts was determined using H2-TPR analysis, as shown in Figure 4. From the H2-TPR spectra, it was observed that all the catalysts possess one broad peak in the range of 300–550 °C, which represents the reduction of NiO with weak interaction with the support [32]. The addition of Ca as a promoter significantly affects the catalyst reducibility, with shifting of the peaks to a higher temperature. For Us catalysts, it is observed that an increase in the amount of Ca doping from 0 to 5 wt.% increases the reduction temperature of the catalysts from 394 to 421 °C. Meanwhile, a similar trend is also observed in WI catalysts. The increase in the amount of Ca doping from 0 to 5 wt.% caused a slight increase in the reduction temperature from 399 to 471 °C. The increase in the reduction temperature at higher metal composition might be caused by the coverage of the Ni surface by Ca species, hindering the reduction of the catalysts [34]. Comparatively, Us catalysts have a lower reduction temperatures than the WI catalysts. This shows that the ultrasound irradiation helps inhomogeneous particle distribution, which improved the reducibility of the catalysts.

2.2. Performance of Catalysts for Glycerol APR

Table 2 shows the selectivity of liquid products produced via APR of glycerol, glycerol conversion, and carbon balance. The dataset present here is a replicate of three data points with a percentage error maintained below than 5%. The liquid product produced was identified as 1,3-propanediol (1,3-PDO), 1,2-propanediol (1,2-PDO, propanol, acetone, and others (unidentified peaks). Remón, et al. [35] summarized the three possible pathways during the APR of glycerol with the presence of suitable catalysts, as shown in Figure 5. In this research, 1.3-PDO and/or 1,2-PDO were identified as one of the main products produced via this APR of glycerol. However, the production of these two main products is a great challenge, as suitable catalysts are necessary to ensure that the reaction proceeds via the desired pathway. The production of 1,3-PDO via this APR reaction proceeds via Pathway 3, which involves dehydration of glycerol to 3-hydroxypropanal (3-HPA) and then hydrogenolysis of 3-HPA to 1,3-PDO in the presence of a Bronsted acid catalyst. 1,3-PDO can then be converted to propanol, which was also identified as one of the products produced via this reaction. Meanwhile, the production of 1,2-PDO (Pathway 2) proceeds via dehydration of glycerol to hydroxy acetone and then hydrogenolysis of hydroxy acetone to 1,2-PDO.
1,2-PDO can then be further converted into acetone or propanol, which were also identified among the products produced via this reaction, whereas ethylene glycol (EG) was produced only as a minor product via dehydrogenation of glycerol to 2,3-dihydroxypropanal and decarbonylation of 2,3-dihydroxypropanal to EG. From the results shown in Table 2, it is observed that 1,3-PDO and 1,2-PDO are the major liquid products produced during APR of glycerol over Ni-Ca/ZrO2 catalysts synthesized by the Us and WI methods. The 10%Ni/ZrO2 catalyst synthesized by both the Us and WI methods shows relatively high selectivity towards the production of 1,3-PDO. This might be caused by the acidic properties of ZrO2 support that drove the reaction towards Pathway 3 (Figure 5) [29].
A significant effect on the selectivity of 1,3-PDO and 1,2-PDO is observed when Ca metals are doped on the Ni-based catalysts. For both Us and WI catalysts, it is observed that the increase in Ca doping from 0.5 to 5 wt.% slightly increases the 1,2-PDO selectivity from 21.9% to 25.9% and 12.3% to 15.7%, respectively. Meanwhile, the 1,3-PDO selectivity shows a decrement from 19.8% to 14.2% and 10.9% to 7.89% with an increase in Ca loading from 0.5 to 5 wt.% for Us and WI catalysts, respectively. Therefore, this shows that the addition of Ca on the Ni-based catalysts has relatively high selectivity towards the production of 1,2-PDO (Pathway 2). This might be caused by the basic properties of Ca metals, which reduced the acidity of the catalysts, and thus led the reaction via Pathway 2 [36]. Meanwhile, other liquid products such as EG, propanol, acetol, ethanol, and methanol were only produced as minor products in this APR of glycerol, with selectivity in the range of 12.31% to 2.21% (Table 2).
In the comparison of the performance of Us and WI catalysts, it is observed that the Us catalysts give a relatively high selectivity of the products produced via APR reaction compared with WI catalysts. Therefore, it can be concluded that the Us catalyst is highly active during the reaction compared with WI catalysts. This might be caused by the effects of ultrasound irradiation, which promotes homogeneous particles’ distribution, resulting in a larger surface area and more active sites for the reaction [25]. For the glycerol conversion, it is observed that all the catalysts have approximately 48 to 51% glycerol conversion, which shows that all the catalysts are slightly active during the reaction. This result is in line with the reported data for this APR of glycerol [28]. Reaction parameters such as temperature, pressure, glycerol concentration, and reaction times play a very important role to ensure high conversion of glycerol to liquid or gas products [35]. Besides that, it is also observed that the glycerol conversion decreased with an increase in metal loading for both the Us and WI methods (Table 2). This might be caused by the decrease in the catalyst activity due to particles’ agglomeration, which resulted in a smaller surface area and active sites for the reaction to occur [37].

3. Materials and Methods

3.1. Materials

Nickel nitrate hexahydrate (Ni(NO3)2·6H2O (98.5%), calcium chloride dihydrate (CaCl2·2H2O) (99.5%), zirconium dioxide (ZrO2) powder (Code: 230693, particle size of 5 µm, 99% trace metal basis), and glycerol (99%) were all purchased from Merck Company, Bandar Sunway, Malaysia, and were of analytical grade. All the chemicals used for analysis purposes such as 1,3-propanediol (99.99%), 1,2-propanediol (99.99%), ethylene glycol (99.98%), propanol (99.99%), and acetone (99.99%) were also purchased from Merck Company, Bandar Sunway, Malaysia. Purified hydrogen (99.99%) and nitrogen (99.99%) gases were supplied by Linde Malaysia (Bayan Lepas, PNG, Malaysia).

3.2. Synthesis of Catalyst

The 10%Ni-x%Ca/ZrO2 catalysts (where x = 0, 0.5, 3, and 5) were synthesized via sonochemical (Us) and wet impregnation methods [25]. The 10 wt.% of the NiO is prepared by dissolving approximately 4.955 g of Ni(NO3)2·6H2O salt in deionized water. Meanwhile, 0.5, 3, and 5 wt.% CaO are prepared by dissolving 0.183, 1.101, and 1.843 g of CaCl2·2H2O salts in deionized water, respectively. The amount of ZrO2 support used to synthesize 10%Ni/ZrO2, 10%Ni-0.5%Ca/ZrO2, 10%Ni-3%Ca/ZrO2, and 10%Ni-5%Ca/ZrO2 catalyst is 9, 8.95, 8.7, and 8.5 g, respectively. Then, the aqueous solutions of nitrate and calcium salts were poured into a 500 mL beaker (diameter, D = 8 cm, height = 12 cm) containing ZrO2 support. The resultant solution was then topped up with deionized water until it reached the maximum volume of 250 mL. For catalysts synthesized by the WI method, the resultant solution was stirred at room temperature for 4 h and 350 rpm using a hot plate. Meanwhile, for catalysts synthesized by the Us method, the resultant solution was then sonicated using an ultrasound sonicator (Model: Q700 Sonica; Fisher Scientific, Shah Alam, Malaysia) at 90 W for 45 min with 30 s pulse ON and 5 s OFF. The samples were then dried using a vacuum oven at 110 °C for 24 h and calcined using a furnace (model: Thermo Scientific FD1535m), with a dimension of 18 × 11 × 16.5 at 500 °C for 4 h in a static air environment.

3.3. Characterization of Catalyst

X-ray diffraction (XRD) analysis was performed using X’ Pert 3 Powder & Empyrean, PANalytical diffractometer (Mavern Panalytical, Petaling Jaya, Malaysia) equipped with a Cu Kα radiation source (λ = 1.5406Ӑ) operating at 45 kV and 40 mA [28]. The diffraction data were collected in the 2θ range of 20°–70° in continuous mode. Brunauer–Emmett–Teller (BET) surface area of the catalysts was determined from nitrogen adsorption–desorption isotherm performed at −196 °C using Micromeritics ASAP 2020 (Micromeritics, Petaling Jaya, Malaysia). The catalyst samples were first degassed at 200 °C for 4 h in a vacuum before the analysis [16]. Field emission scanning electron microscope (FESEM) was performed using VPFESEM, Zeiss Supra 55VP (Zeiss, Petaling Jaya, Malaysia), operating at 5 kV. Before the analysis, the catalysts were coated with a thin film of gold on their surface. The topographical and elemental information of the catalysts was analyzed using energy-dispersive X-ray (EDX) spectroscopy (Shah Alam, Malaysia) [28]. Hydrogen temperature programmed reduction (H2-TPR) was performed using TPDRO, Model:1100, Thermo Scientific (Thermo Scientific, Shah Alam, Malaysia), equipped with thermal conductivity detector (TCD) to measure the H2 consumption during the reduction. The catalysts were first degassed in a flow of nitrogen (N2) gas at 300 °C for 1.5 h to remove the moisture and cooled to room temperature. Then, the catalysts were heated from room temperature until 950 °C at the rate of 10 °C/min in the presence of 5% H2 balanced with N2 with a holding time of 10 min [28].

3.4. Catalyst Performance

Aqueous phase reforming of glycerol was carried out in a PREMEX Autoclave High-Pressure Batch reactor, equipped with a 1000 mL reactor vessel (D = 15 cm, height = 20 cm), magnetic stirrer (type = streamline design, height = 15.5 cm, revolution rate = 450 rpm), pressure gauge, valve, and others (Premex Solution, Kuala Lumpur, KUL, Malaysia). Firstly, 2 g of the powder catalyst was loaded into the reactor and the catalyst was reduced under purified hydrogen at 4 bar, and its reduction temperature was determined from H2-TPR analysis for 1 h. Then, 10 vol% glycerol solution was prepared by mixing 25 mL of pure glycerol with 225 mL distilled water. After the reactor had cooled down to 100 °C, 250 mL of 10 vol% glycerol solution was poured into the reactor. The reaction was conducted at 230 °C, 20 bar of purified N2, and 450 rpm for 1 h. The presence of in situ hydrogen was confirmed by GC-TCD over the catalyst to proceed with further investigation into APR. The liquid product was analyzed using high-performance liquid chromatography (HPLC) equipped with a refractive index (RI) detector (Agilent Technologies, Bayan Lepas, PNG, Malaysia). The analysis was performed using Eclipse XDB C18 column (5 μm, 46 × 150 mm) with a total runtime of 35 min and sulfuric acid with a concentration of 0.005 M as mobile phase injected at a flow rate of 0.6 mL/min into the system. The catalysts’ performance was evaluated based on the selectivity of the liquid products, glycerol conversion, and carbon balance, as shown in Equations (1) to (3), respectively [22].
Selectivity   of   product   ( % ) = Mole   of   product   ( i ) Total   mole   of   glycerol   consumed × 100
Conversion   of   glycerol   ( % ) = Mole   of   glycerol   consumed Mole   of   glycerol   in   × 100
C   balance = 100 [ ( mole   of   feed × n ) in   Σ ( Mole   C i × n ) out ( Mole   of   feed   × n ) in × 100 ]

4. Conclusions

The sonochemically synthesized Ni/ZrO2 catalysts doped with different Ca loading have become a new development in the APR of glycerol for the production of value-added chemicals. The present study showed that the doping of Ca on the Ni/ZrO2 catalysts significantly affects the physicochemical properties of the catalysts and the distribution of the liquid products. It is observed that the increase in Ca composition increases the agglomeration of the particles, which resulted in larger particles sizes and a smaller surface area. Besides that, the reducibility of the catalysts also decreased with an increase in metal loading owing to the strong interaction between metals and support, which required more H2 consumption to reduce the metal oxide. For the effect of ultrasound irradiation on the physicochemical properties of the catalysts, it is observed that the particles of Us catalysts are homogeneously distributed, resulting in larger SSA, pore volume, and pore sizes compared with WI catalysts. Meanwhile, for the distribution of the liquid products, 1,3-PDO and 1,2-PRO were the two main liquid products produced via this APR of glycerol. The highest 1,3-PDO selectivity of 23.84% is obtained over the 10%Ni/ZrO2 catalyst, while the highest selectivity of 1,2-PDO of 25.87% is obtained over the 10%Ni-5%Ca/ZrO2 catalyst. The other products such as propanol, acetone, methanol, ethylene glycol, ethanol, and others (unidentified compounds) are only found as minor products during this APR of glycerol, with selectivity below 15%. All the catalysts were also proven to have a good catalytic performance during the APR reaction, with glycerol conversion above 40%.

Author Contributions

Conceptualization, A.S. and M.A.; Methodology, A.S.; Validation, M.A., M.T.A., A.A., M.H.M.Y. and M.S.H.R.; Formal analysis, A.S. and M.A.; Investigation, A.S.; Resources, A.S., M.A. and F.S.; Writing—original draft preparation, A.S.; Writing—review and editing, M.A., F.S., M.T.A., A.A., M.H.M.Y. and M.S.H.R.; Supervision, M.A., M.T.A., A.A., M.H.M.Y. and M.S.H.R.; Project administration, M.H.M.Y.; Funding acquisition, M.H.M.Y. All authors have read and agreed to the published version of the manuscript.

Funding

This research was funded by Yayasan Universiti Teknologi PETRONAS (YUTP-015LCO-091) and Ministry of Higher Education Malaysia (MoHE) for Higher Institution Centre of Excellence (HICoE) award to the Centre for Biofuels and Biochemical Research (CBBR) for the monetary support (015MA0-052) as well as for the financial support, equipment, and research facilities. The authors would also like to thank Centralized Analytical Lab (CAL), Universiti Teknologi PETRONAS (UTP) for providing analytical equipment to conduct the analysis.

Institutional Review Board Statement

Not applicable.

Informed Consent Statement

Not applicable.

Data Availability Statement

Not applicable.

Conflicts of Interest

The authors declare that they have no known competing financial interests or personal relationships that could have appeared to influence the work reported in this paper.

References

  1. Yumashev, A.; Ślusarczyk, B.; Kondrashev, S.; Mikhaylov, A. Global indicators of sustainable development: Evaluation of the influence of the human development index on consumption and quality of energy. Energies 2020, 13, 2768. [Google Scholar] [CrossRef]
  2. Sadaf, S.; Iqbal, J.; Ullah, I.; Bhatti, H.N.; Nouren, S.; Nisar, J.; Iqbal, M. Biodiesel production from waste cooking oil: An efficient technique to convert waste into biodiesel. Sustain. Cities Soc. 2018, 41, 220–226. [Google Scholar]
  3. Teo, S.H.; Rashid, U.; Thomas Choong, S.Y.; Taufiq-Yap, Y.H. Heterogeneous calcium-based bimetallic oxide catalyzed transesterification of Elaeis guineensis derived triglycerides for biodiesel production. Energy Convers. Manag. 2017, 141, 20–27. [Google Scholar] [CrossRef]
  4. Keera, S.; El Sabagh, S.; Taman, A. Castor oil biodiesel production and optimization. Egypt. J. Pet. 2018, 27, 979–984. [Google Scholar] [CrossRef]
  5. Ciriminna, R.; Pina, C.D.; Rossi, M.; Pagliaro, M. Understanding the glycerol market. Eur. J. Lipid Sci. Technol. 2014, 116, 1432–1439. [Google Scholar] [CrossRef]
  6. Rodriguez, A.; Wojtusik, M.; Ripoll, V.; Santos, V.E.; Garcia-Ochoa, F. 1,3-Propanediol production from glycerol with a novel biocatalyst Shimwellia blattae ATCC 33430: Operational conditions and kinetics in batch cultivations. Bioresour. Technol. 2016, 200, 830–837. [Google Scholar] [CrossRef] [Green Version]
  7. Wei, R.; Qu, X.; Xiao, Y.; Fan, J.; Geng, G.; Gao, L.; Xiao, G. Hydrogenolysis of glycerol to propanediols over silicotungstic acid catalysts intercalated with CuZnFe hydrotalcite-like compounds. Catal. Today 2021. [Google Scholar] [CrossRef]
  8. Callison, J.; Subramanian, N.D.; Rogers, S.M.; Chutia, A.; Gianolio, D.; Catlow, C.R.A.; Wells, P.P.; Dimitratos, N. Directed aqueous-phase reforming of glycerol through tailored platinum nanoparticles. Appl. Catal. B Environ. 2018, 238, 618–628. [Google Scholar] [CrossRef]
  9. Azizan, M.T.; Aqsha, A.; Ameen, M.; Syuhada, A.; Klaus, H.; Abidin, S.Z.; Sher, F. Catalytic reforming of oxygenated hydrocarbons for the hydrogen production: An outlook. Biomass Convers. Biorefin. 2020. [Google Scholar] [CrossRef]
  10. Bavykina, A.; Kolobov, N.; Khan, I.S.; Bau, J.A.; Ramirez, A.; Gascon, J. Metal–Organic Frameworks in Heterogeneous Catalysis: Recent Progress, New Trends, and Future Perspectives. Chem. Rev. 2020, 120, 8468–8535. [Google Scholar] [CrossRef] [Green Version]
  11. Morales-Marín, A.; Ayastuy, J.; Iriarte-Velasco, U.; Gutiérrez-Ortiz, M. Nickel aluminate spinel-derived catalysts for the aqueous phase reforming of glycerol: Effect of reduction temperature. Appl. Catal. B Environ. 2019, 244, 931–945. [Google Scholar] [CrossRef]
  12. Nadzru, N.A.; Syuhada, A.; Azizan, M.T.; Ameen, M. Thermodynamic analysis of aqueous phase reforming of sorbitol. J. Comput. Theor. Nanosci. 2020, 17, 1004–1008. [Google Scholar] [CrossRef]
  13. Kim, Y.; Kim, M.; Jeong, H.; Kim, Y.; Choi, S.H.; Ham, H.C.; Lee, S.W.; Kim, J.Y.; Song, K.H.; Yoon, C.W. High purity hydrogen production via aqueous phase reforming of xylose over small Pt nanoparticles on a γ-Al2O3 support. Int. J. Hydrogen Energy 2020, 45, 13848–13861. [Google Scholar] [CrossRef]
  14. Reynoso, A.J.; Iriarte-Velasco, U.; Gutiérrez-Ortiz, M.A.; Ayastuy, J.L. Highly stable Pt/CoAl2O4 catalysts in Aqueous-Phase Reforming of glycerol. Catal. Today 2021, 367, 278–289. [Google Scholar] [CrossRef]
  15. Zhang, J.; Xu, N. Hydrogen Production from Ethylene Glycol Aqueous Phase Reforming over Ni-Al Layered Hydrotalcite-Derived Catalysts. Catalysts 2020, 10, 54. [Google Scholar] [CrossRef] [Green Version]
  16. Larimi, A.S.; Kazemeini, M.; Khorasheh, F. Aqueous phase reforming of glycerol using highly active and stable Pt0.05CexZr0.95−xO2 ternary solid solution catalysts. Appl. Catal. A Gen. 2016, 523, 230–240. [Google Scholar] [CrossRef]
  17. Kumar, A.; Sinha, A. Comparative study of hydrogen production from steam reforming of acetic acid over synthesized catalysts via MOF and wet impregnation methods. Int. J. Hydrogen Energy 2020, 45, 11512–11526. [Google Scholar] [CrossRef]
  18. Luo, W.; Lyu, Y.; Gong, L.; Du, H.; Jiang, M.; Ding, Y. Alcohol-treated SiO2 as the support of Ir-Re/SiO2 catalysts for glycerol hydrogenolysis. Chin. J. Catal. 2016, 37, 2009–2017. [Google Scholar] [CrossRef]
  19. Pamphile-Adrián, A.J.; Florez-Rodriguez, P.P.; Pires, M.H.M.; Perez, G.; Passos, F.B. Selective hydrogenolysis of glycerol over Ir-Ni bimetallic catalysts. Catal. Today 2017, 289, 302–308. [Google Scholar] [CrossRef]
  20. Ahmadi, F.; Haghighi, M.; Ajamein, H. Sonochemically coprecipitation synthesis of CuO/ZnO/ZrO2/Al2O3 nanocatalyst for fuel cell grade hydrogen production via steam methanol reforming. J. Mol. Catal. A Chem. 2016, 421, 196–208. [Google Scholar] [CrossRef]
  21. Sing Yu, F.W.; Ameen, M.; Aqsha, A.; Izham, M.; Azizan, M.T.; Sher, F. Effects of ultrasound irradiations time over Ni–Mo/γ-Al2O3 catalyst synthesis for 1,3-Propanediol selectively via aqueous phase reforming of glycerol. Case Stud. Chem. Environ. Eng. 2021, 3, 100096. [Google Scholar] [CrossRef]
  22. Shahbudin, M.I.; Jacob, D.M.; Ameen, M.; Aqsha, A.; Azizan, M.T.; Yusoff, M.H.M.; Sher, F. Liquid value-added chemicals production from aqueous phase reforming of sorbitol and glycerol over sonosynthesized Ni-based catalyst. J. Environ. Chem. Eng. 2021, 9, 105766. [Google Scholar] [CrossRef]
  23. Pei, L.; Xie, Y.; Pei, Y.; Yuan, C. Synthesis and formation process of zirconium dioxide nanorods. Mater. Sci. Pol. 2013, 31, 186–192. [Google Scholar] [CrossRef]
  24. Radzi, M.R.M.; Azizan, M.T.; Daud, N.; Topek, M.A.; Abidin, S.Z. Aqueous phase reforming of sorbitol over Ca doped Ni/Al2O3 for value-added chemicals production. Mater. Today Proc. 2018, 5, 21728–21736. [Google Scholar] [CrossRef]
  25. Ameen, M.; Azizan, M.T.; Ramli, A.; Yusup, S.; Yasir, M. Physicochemical Properties of Ni-Mo/γ-Al2O3 Catalysts Synthesized via Sonochemical Method. Procedia Eng. 2016, 148, 64–71. [Google Scholar] [CrossRef]
  26. Mahboob, S.; Haghighi, M.; Rahmani, F. Sonochemically preparation and characterization of bimetallic Ni-Co/Al2O3-ZrO2 nanocatalyst: Effects of ultrasound irradiation time and power on catalytic properties and activity in dry reforming of CH4. Ultrason. Sonochem. 2017, 38, 38–49. [Google Scholar] [CrossRef]
  27. Taghizadeh, M.T.; Vatanparast, M. Ultrasonic-assisted synthesis of ZrO2 nanoparticles and their application to improve the chemical stability of Nafion membrane in proton exchange membrane (PEM) fuel cells. J. Colloid Interface Sci. 2016, 483, 1–10. [Google Scholar] [CrossRef]
  28. Bastan, F.; Kazemeini, M.; Larimi, A.S. Aqueous-phase reforming of glycerol for production of alkanes over Ni/CexZr1−xO2 nano-catalyst: Effects of the support’s composition. Renew. Energy 2017, 108, 417–424. [Google Scholar] [CrossRef]
  29. Ameen, M.; Azizan, M.T.; Ramli, A.; Yusup, S.; Alnarabiji, M.S. Catalytic hydrodeoxygenation of rubber seed oil over sonochemically synthesized Ni-Mo/γ-Al2O3 catalyst for green diesel production. Ultrason. Sonochem. 2019, 51, 90–102. [Google Scholar] [CrossRef] [PubMed]
  30. Numpilai, T.; Cheng, C.K.; Seubsai, A.; Faungnawakij, K.; Limtrakul, J.; Witoon, T. Sustainable utilization of waste glycerol for 1,3-propanediol production over Pt/WOx/Al2O3 catalysts: Effects of catalyst pore sizes and optimization of synthesis conditions. Environ. Pollut. 2021, 272, 116029. [Google Scholar] [CrossRef]
  31. Chen, A.; Guo, H.; Song, Y.; Chen, P.; Lou, H. Recyclable CeO2–ZrO2 and CeO2–TiO2 mixed oxides based Pt catalyst for aqueous-phase reforming of the low-boiling fraction of bio-oil. Int. J. Hydrogen Energy 2017, 42, 9577–9588. [Google Scholar] [CrossRef]
  32. Rahbar Shamskar, F.; Meshkani, F.; Rezaei, M. Ultrasound assisted co-precipitation synthesis and catalytic performance of mesoporous nanocrystalline NiO-Al2O3 powders. Ultrasonics Sonochem. 2017, 34, 436–447. [Google Scholar] [CrossRef] [Green Version]
  33. Daroughegi, R.; Meshkani, F.; Rezaei, M. Enhanced activity of CO2 methanation over mesoporous nanocrystalline Ni-Al2O3 catalysts prepared by ultrasound-assisted co-precipitation method. Int. J. Hydrogen Energy 2017, 42, 15115–15125. [Google Scholar] [CrossRef]
  34. Shang, Z.; Li, S.; Li, L.; Liu, G.; Liang, X. Highly active and stable alumina supported nickel nanoparticle catalysts for dry reforming of methane. Appl. Catal. B Environ. 2017, 201, 302–309. [Google Scholar] [CrossRef]
  35. Remón, J.; Giménez, J.; Valiente, A.; García, L.; Arauzo, J. Production of gaseous and liquid chemicals by aqueous phase reforming of crude glycerol: Influence of operating conditions on the process. Energy Convers. Manag. 2016, 110, 90–112. [Google Scholar] [CrossRef] [Green Version]
  36. Han, L.; Liu, Q.; Lin, K.; Wang, Q.; Rong, N.; Liang, X.; Shaikh, A.R.; Feng, Y.; Zhong, Y. Enhanced hydrogen production via catalytic toluene reforming with in situ carbon dioxide capture: Effects of a hybrid iron-calcium composite prepared by impregnation. Energy Convers. Manag. 2020, 214, 112834. [Google Scholar] [CrossRef]
  37. Stummann, M.Z.; Elevera, E.; Hansen, A.B.; Hansen, L.P.; Beato, P.; Davidsen, B.; Wiwel, P.; Gabrielsen, J.; Jensen, P.A.; Jensen, A.D. Catalytic hydropyrolysis of biomass using supported CoMo catalysts–Effect of metal loading and support acidity. Fuel 2020, 264, 116807. [Google Scholar] [CrossRef]
Figure 1. XRD spectra of (a) ZrO2, (b) 10%Ni/ZrO2_WI, (c) 10%Ni-0.5%Ca/ZrO2_WI, (d) 10%Ni-3%Ca/ZrO2_WI, (e) 10%Ni-5%Ca/ZrO2_WI, (f) 10%Ni/ZrO2_Us, (g) 10%Ni-0.5%Ca/ZrO2_Us, (h) 10%Ni-3%Ca/ZrO2_Us, and (i) 10%Ni-5%Ca/ZrO2_Us catalysts.
Catalysts 11 00977 g001
Figure 2. FESEM images, EDX spectra, and dot mapping images of all the synthesized catalysts: (a) ZrO2, (b) 10%Ni/ZrO2_WI, (c) 10%Ni/ZrO2_Us, (d) 10%Ni-0.5%Ca/ZrO2_Us, (e) 10%Ni-0.5%Ca/ZrO2_WI, (f) 10%Ni-3%Ca/ZrO2_Us, (g) 10%Ni-3%Ca/ZrO2_WI, (h) 10%Ni-5%Ca/ZrO2_Us, and (i) 10%Ni-5%Ca/ZrO2_WI.
Catalysts 11 00977 g002
Figure 3. EDX spectra and dot mapping images of all the synthesized catalysts: (a) ZrO2, (b) 10%Ni/ZrO2_WI, (c) 10%Ni/ZrO2_Us, (d) 10%Ni-0.5%Ca/ZrO2_Us, (e) 10%Ni-0.5%Ca/ZrO2_WI, (f) 10%Ni-3%Ca/ZrO2_Us, (g) 10%Ni-3%Ca/ZrO2_WI, (h) 10%Ni-5%Ca/ZrO2_Us, and (i) 10%Ni-5%Ca/ZrO2_WI.
Catalysts 11 00977 g003
Figure 4. H2-TPR profile of (a) 10%Ni/ZrO2_WI, (b) 10%Ni-0.5%Ca/ZrO2_WI, (c) 10%Ni-3%Ca/ZrO2_WI, (d) 10%Ni-5%Ca/ZrO2_WI, (e) 10%Ni/ZrO2_Us, (f) 10%Ni-0.5%Ca/ZrO2_Us, (g) 10%Ni-3%Ca/ZrO2_Us, and (h) 10%Ni-5%Ca/ZrO2_Us catalysts.
Catalysts 11 00977 g004
Figure 5. Possible reaction pathway during APR of glycerol as summarized by Remón, Giménez, Valiente, García and Arauzo [35]. −H2/+H2 = dehydrogenation/hydrogenation; −H2O = dehydration; −CO = decarbonylation.
Catalysts 11 00977 g005
Table 1. Specific surface area, pore volume, and pore size of the synthesized catalysts.
CatalystSpecific Surface Area (m2/g)Pore Volume (cm3/g)Pore Size (nm)
ZrO224.000.425.08
10%Ni/ZrO2_Us25.500.486.85
10%Ni/ZrO2_WI15.500.394.58
10%Ni-0.5%Ca/ZrO2_Us24.300.345.77
10%Ni-0.5%Ca/ZrO2_WI14.400.313.64
10%Ni-3%Ca/ZrO2_Us23.900.264.04
10%Ni-3%Ca/ZrO2_WI12.500.242.21
10%Ni-5%Ca/ZrO2_Us22.400.213.46
10%Ni-5%Ca/ZrO2_WI11.700.201.01
Table 2. Catalytic performance of various catalysts for glycerol APR.
CatalystCglycerol (%)Selectivity (%)C Balance (%)
1,3-PDO1,2-PDOEGPropanolAcetoneEthanolMethanolOthers Unidentified Compounds
10%Ni/ZrO2_Us50.8 ± 0.223.8 ± 2.317.2 ± 1.310.5 ± 2.15.41 ± 2.27.32 ± 1.05.21 ± 1.36.43 ± 0.918.1 ± 0.894 ± 1.3
10%Ni/ZrO2_WI49.5 ± 1.312.3 ± 1.310.2 ± 2.26.78 ± 1.23.54 ± 3.45.67 ± 0.74.93 ± 1.85.78 ± 1.238.8 ± 1.288 ± 4.0
10%Ni-0.5%Ca/ZrO2_Us49.5 ± 0.919.8 ± 1.021.9 ± 1.012.2 ± 0.89.81 ± 1.28.82 ± 0.77.45 ± 2.38.67 ± 2.53.35 ± 3.592 ± 3.3
10%Ni-0.5%Ca/ZrO2_WI48.2 ± 3.410.9 ± 2.512.3 ± 1.18.76 ± 1.75.21 ± 1.07.89 ± 3.06.98 ± 2.47.84 ± 3.230.1 ± 5.490 ± 1.2
10%Ni-3%Ca/ZrO2_Us49.3 ± 1.315.8 ± 4.724.8 ± 3.414.2 ± 3.210.1 ± 1.29.43 ± 1.79.72 ± 3.49.67 ± 1.41.28 ± 2.995 ± 1.0
10%Ni-3%Ca/ZrO2_WI42.7 ± 4.59.98 ± 3.414.2 ± 2.99.23 ± 2.47.89 ± 3.49.21 ± 2.38.98 ± 1.28.43 ± 3.216.1 ± 3.484 ± 1.2
10%Ni-5%Ca/ZrO2_Us48.2 ± 0.614.2 ± 2.324.9 ± 2.814. 7 ± 1.712.3 ± 2.310.0 ± 3.29.91 ± 0.89.76 ± 4.11.23 ± 3.797 ± 3.4
10%Ni-5%Ca/ZrO2_WI40.2 ± 3.47.89 ± 3.215.7 ± 4.011.4 ± 1.510.5 ± 1.39.98 ± 4.29.34 ± 0.78.98 ± 3.211.2 ± 1.085 ± 1.2
Reaction conditions: T = 230 °C, p = 20 bar, 10 vol.% glycerol in water, 450 rpm, 2 g catalyst, and 1 h reaction time. Cglycerol = glycerol conversion; 1,3-PDO = 1,3-propanediol; 1,2-PDO = 1,2-propanediol; EG = ethylene glycol.
Publisher’s Note: MDPI stays neutral with regard to jurisdictional claims in published maps and institutional affiliations.

