Article

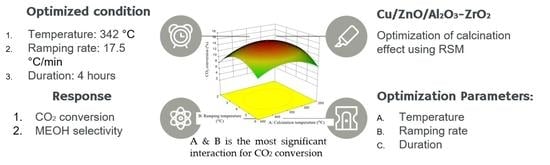
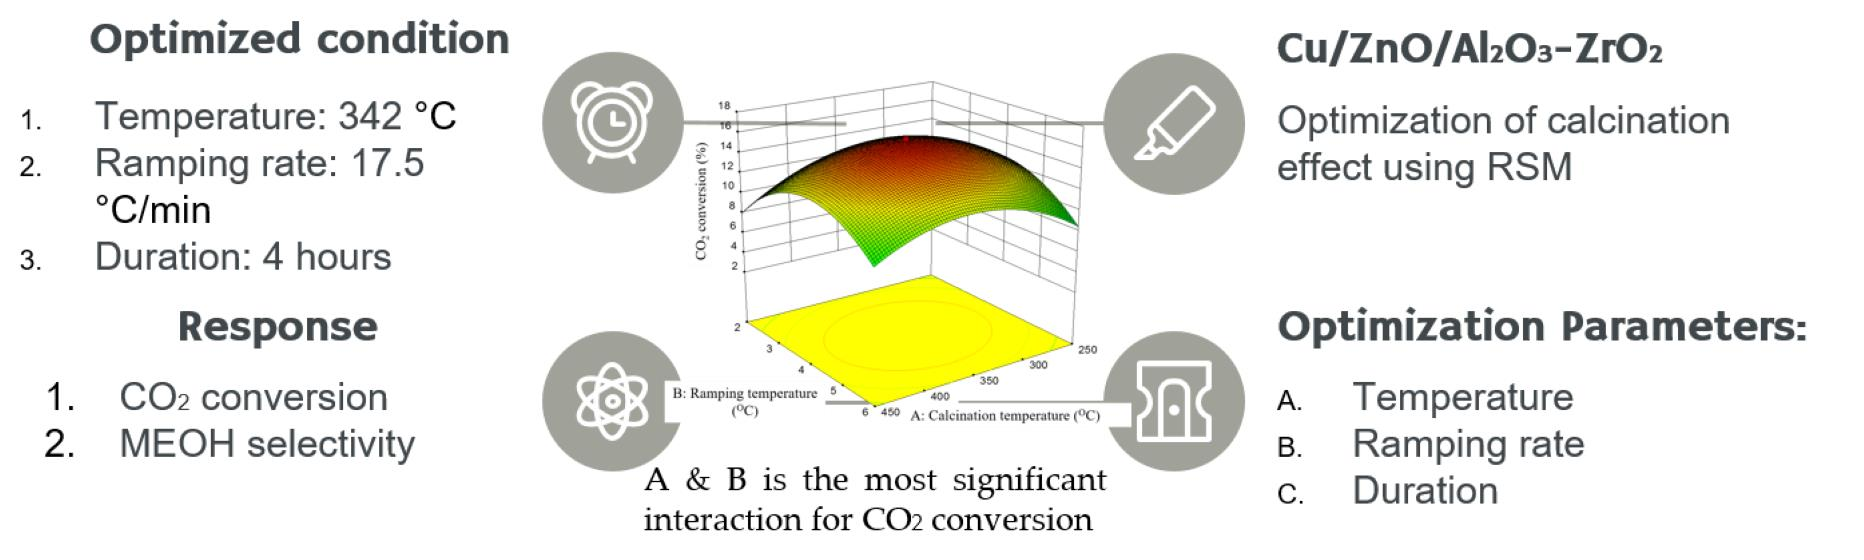
Optimization of Calcination Conditions for Cu/ZnO/Al2O3-ZrO2 Catalyst

by
Nur Insyirah Zulkifli
1,
Nor Hafizah Berahim
1,
Noor Asmawati Mohd Zabidi
1,* and
Sara Faiz Hanna Tasfy
2
1
Department of Fundamental and Applied Sciences, Universiti Teknologi PETRONAS, Seri Iskandar 32610, Malaysia
2
Department of Chemical and Petroleum Engineering, American University of Ras Al Khaimah, Ras Al Khaimah 10021, United Arab Emirates
*
Author to whom correspondence should be addressed.
Catalysts 2021, 11(8), 871; https://doi.org/10.3390/catal11080871
Submission received: 25 June 2021 / Revised: 15 July 2021 / Accepted: 16 July 2021 / Published: 21 July 2021
(This article belongs to the Section Catalytic Materials)

Abstract

:
Promoted Cu/ZnO catalyst was synthesized on Al2O3-ZrO2 support. Effects of calcination conditions on the catalytic performance in a CO2 hydrogenation reaction were studied systematically using the response surface methodology (RSM). The application of RSM with rotatable central composite design (RCCD) for optimization on the influence of catalyst’s calcination variables on the CO2 conversion and methanol selectivity is presented. The calcination variables studied include temperature, A (181–518 °C), ramping rate, B (1–30 °C/min), and duration, C (1–7 h). From the RSM-generated model, the optimum calcination condition for this catalyst was 350 °C with 17.5 °C/min ramping rate for a 4 h duration. At the optimum calcination condition, the catalyst exhibited a Brunauer–Emmett–Teller (BET) surface area of 147 m2/g, a pore volume of 0.31 cm3/g, and a pore diameter of 8.1 nm.

Graphical Abstract

1. Introduction

The hydrogenation of CO2 into value-added products such as methanol and dimethyl ether (DME) is one of the attractive options to mitigate the rise in CO2 concentration in the atmosphere [1,2,3,4,5]. Cu-based catalysts have been recognized as efficient catalysts for the industrial methanol production that uses syngas as the feedstock. Methanol production based on CO2 feedstock is yet to be applied at industrial scale, despite the extensive research conducted in this field. Some of the issues on the CO2 hydrogenation process relates to the co-production of H2O with methanol which would have detrimental effects on the conventional Cu-based catalyst. It was reported by [6,7,8] that the Cu/ZnO catalyst was deactivated due to accelerated crystallization of Cu and ZnO by water produced from CO2-rich feedstock used in the methanol synthesis. Thus, intense efforts on catalyst design for methanol synthesis via CO2 hydrogenation route have been carried out by many researchers around the world [9,10,11,12,13]. Some of the catalyst design approach include introduction of multicomponent system which has the capability to activate the very stable CO2 molecule and dissociate H2 molecule, and to minimize the effects of H2O on the physicochemical properties of the catalyst [6].
Methanol synthesis is a structure-sensitive reaction, thus the efficiency of the catalyst is significantly influenced by the method of preparation of the catalyst, their pre-treatment conditions, active metals component, and choice of support and promoters. The preparation methods for the methanol synthesis catalysts include impregnation, co-precipitation, combustion, and sol–gel [7]. The industrial methanol catalyst is typically prepared using the co-precipitation method. Fujita et al. [14] investigated the effects of calcination and reduction conditions on the physicochemical properties of Cu/ZnO catalyst prepared by the co-precipitation method. They reported that the crystallite size of CuO for a catalyst prepared from aurichalcite precursor was significantly affected by the ramping rate during the calcination process. The crystallite size of CuO was found to increase from 3.9 nm to 8.5 nm when the ramping rate was increased from 5 K/min to 100 K/min. The increase in the ramping rate during the calcination process resulted in a decrease in Cu dispersion and a corresponding decrease in the rate of methanol formation.
The commonly used γ -Al2O3 catalyst support is hydrophilic but ZrO2 is weakly hydrophilic and the usage of ZrO2 as a co-support will be beneficial for the desorption of produced H2O from the CO2 hydrogenation reaction [6]. Zhang et al. [15] reported that addition of up to 15 wt% ZrO2 into γ -Al2O3 improved the dispersion of CuO species and enhanced the catalytic performance in the CO2 hydrogenation reaction.
In the present study, we report the synthesis of Cu/ZnO on mixed oxide support comprising Al2O3 and ZrO2 using the impregnation method. To the best of our knowledge, the effects of calcination conditions on the catalytic performance for CO2 hydrogenation reaction over Cu/ZnO catalyst supported on Al2O3-ZrO2 has not been reported. In the present contribution, the influence of calcination conditions of the promoted Cu/ZnO/Al2O3-ZrO2 catalyst on their catalytic activity in CO2 hydrogenation is systematically studied via response surface methodology (RSM) with rotatable central composite design (CCD).

2. Results and Discussion

2.1. Model Fitting

Three independent variables for the calcination process (temperature, ramping rate, and duration) at different levels were investigated in this study. An experimental design was constructed and analyzed using Design Expert Version 10 (Stat Ease, Minneapolis, MN, USA) in order to find the optimum point of the calcination condition for the synthesized catalyst (MNCZAZ). Optimization of the calcination conditions (calcination temperature, ramping rate, and duration) were carried out with rotational central composite design (CCD), which is the best DOE that applies RSM [16]. CCD is the experimental design introduced by Box and Wilson in 1951. CCD is one of the best experimental designs used in RSM. However, this design requires selection of the correct type of CCD. The CCD types include spherical (SCCD), rotatable (RCCD), orthogonal (OCCD), and face-centered (FCCD) central composite. In this study, the RCCD approach was used to determine the interaction between the process variables and the process response. According to previous research, the common type of CCD is either face-centered or rotatable [17]. One of the reasons for choosing rotatable CCD is the ability to perform extreme analysis in DOE compared to face-centered CCD. Therefore, the studied range would be much wider and more reliable to observe the trends.
The number of tests needed for RCCD includes the standard 2k factorial with the origin at the center, 2k points fixed axially at a distance, say θ, from the center to generate the quadratic terms, and retests at the center; where k is the number of variables [18]. The axial points are chosen to be rotatable, which ensures that the variance of the model prediction is constant at all points equidistant from the design center. Repeats of the test at the center are very important as they provide an independent estimate of the experimental error [19]. For three variables, the recommended number of trials at the center is six. Therefore, the total number of trials required for these three independent variables is 23 + (2 × 3) + 6 = 20 [19,20]. Once the desired ranges of values of the variables are defined, they are coded to be ± 1 for the factorial points, 0 for the midpoints, and ±α for the axial points. The codes are computed as functions of the range of interest of each factor, as shown in Table 1. Table 2 shows the design matrix for the study on calcination conditions and the measured responses (CO2 conversion, methanol selectivity, and methanol yield).
The CO2 conversion, XCO2, and methanol selectivity, SMEOH, were taken as the response variables of the designed experiments. The design of experiment was tabulated in Table 2 and the experimental data were then modeled using polynomial Equation (1) (CO2 conversion) and Equation (2) (methanol selectivity).
XCO2 = 15.84 − 0.052A + 0.38B + 0.18C +1.52AB + 0.52AC + 0.52BC −3.10 A2 − 1.80B2 − 3.92C2
SMEOH = 74.09 + 11.79A + 4.92B − 7.10C −5.03AB + 2.62BC − 5.40BC − 12.25 A2 − 8.45B2 − 16.67C2

2.2. Regression Model Equation and Analysis of Variance (ANOVA)

To determine the best model for both responses, the proposed model should be considered as a favorable beginning [21]. The proposed model by the software is the quadratic model, which shows that both models are adequately sufficient to describe the calcination condition within the experimental range.
As shown in Table 3 for first response parameter, XCO2, the quadratic model is suggested with high significance at a 5% confidence level as indicated by low p-value < 0.0001. On the other hand, the insignificant lack of fit (LOF) value (0.0711), of this study indicates that the model is a good representation of the response as the probability for lack of fit describes the variation of the data around the fitted model. The determination coefficient (R2) values which measures the fitness of the data with the model is at 93%, suggesting that the model is significant with R2 value and adjusted R2 of 0.93 and 0.87, respectively. The value is acceptable because it is very close to unity. The R2 value illustrate the closeness of the selected model to the experimental data points. Meanwhile, the adjusted R2 describes the amount of variation about the mean explained by the model [21]. Furthermore, adequate precision values of the model also show a value higher than 4, which is desirable for the design with value of 15.31.
For a second response, SMEOH, the model is also proved to be significant with R2 value up to 0.96 and LOF of 0.2813.
Multiple regression coefficient of a second order polynomial model describing the effect of catalyst (MNCZAZ) calcination conditions on the values of XCO2 and SMEOH are summarized in Table 4 and Table 5, respectively. The significance of each coefficient was determined by F-value and p-value. The p-value is considered as significant if the value is less than 0.05. For the calcination condition effect of the catalyst (MNCZAZ) on XCO2, the interaction between first order effect of A (temperature) and B (ramping rate) are significant at p value of 0.0224 while the other interactions are not significant (p > 0.05). Furthermore, the second order effect of A (temperature) and C (duration) are also significant with p-value of <0.0001. The same trend is also observed with second order effect of B (ramping rate) with p-value = 0.0044. The coefficient estimate values of the regression model are A = 0.052 (temperature), B = 0.38 (ramping rate), and C = 0.18 (duration). Therefore, ramping rate has the highest effect on the response XCO2, followed by duration and temperature, summarized as B > C > A.
Effects of catalyst (MNCZAZ) calcination conditions on the second response, SMEOH, are shown in Table 5. All three first order effects of A (temperature), B (heating ramp), and C (heating duration) are significant with p-value of <0.0001, 0.0208, and 0.0016, respectively. The interaction between the first order effect of AB and BC are also significant with p-value of 0.0352 and 0.0257, respectively. In addition, the second order effect of A, B, and C are also significant with p-values ≤ 0.0009. The coefficient estimate values of the SMEOH regression model are A = 11.79 (temperature), C = 7.10 (duration), and B = 4.92 (ramping rate).
Based on the corresponding p-value, the first order effect of B is least significant amongst the variables studied as it has lowest coefficient estimation Therefore, temperature has the highest effect to the response SMEOH, followed by duration and ramping rate, summarized as A > C >B.

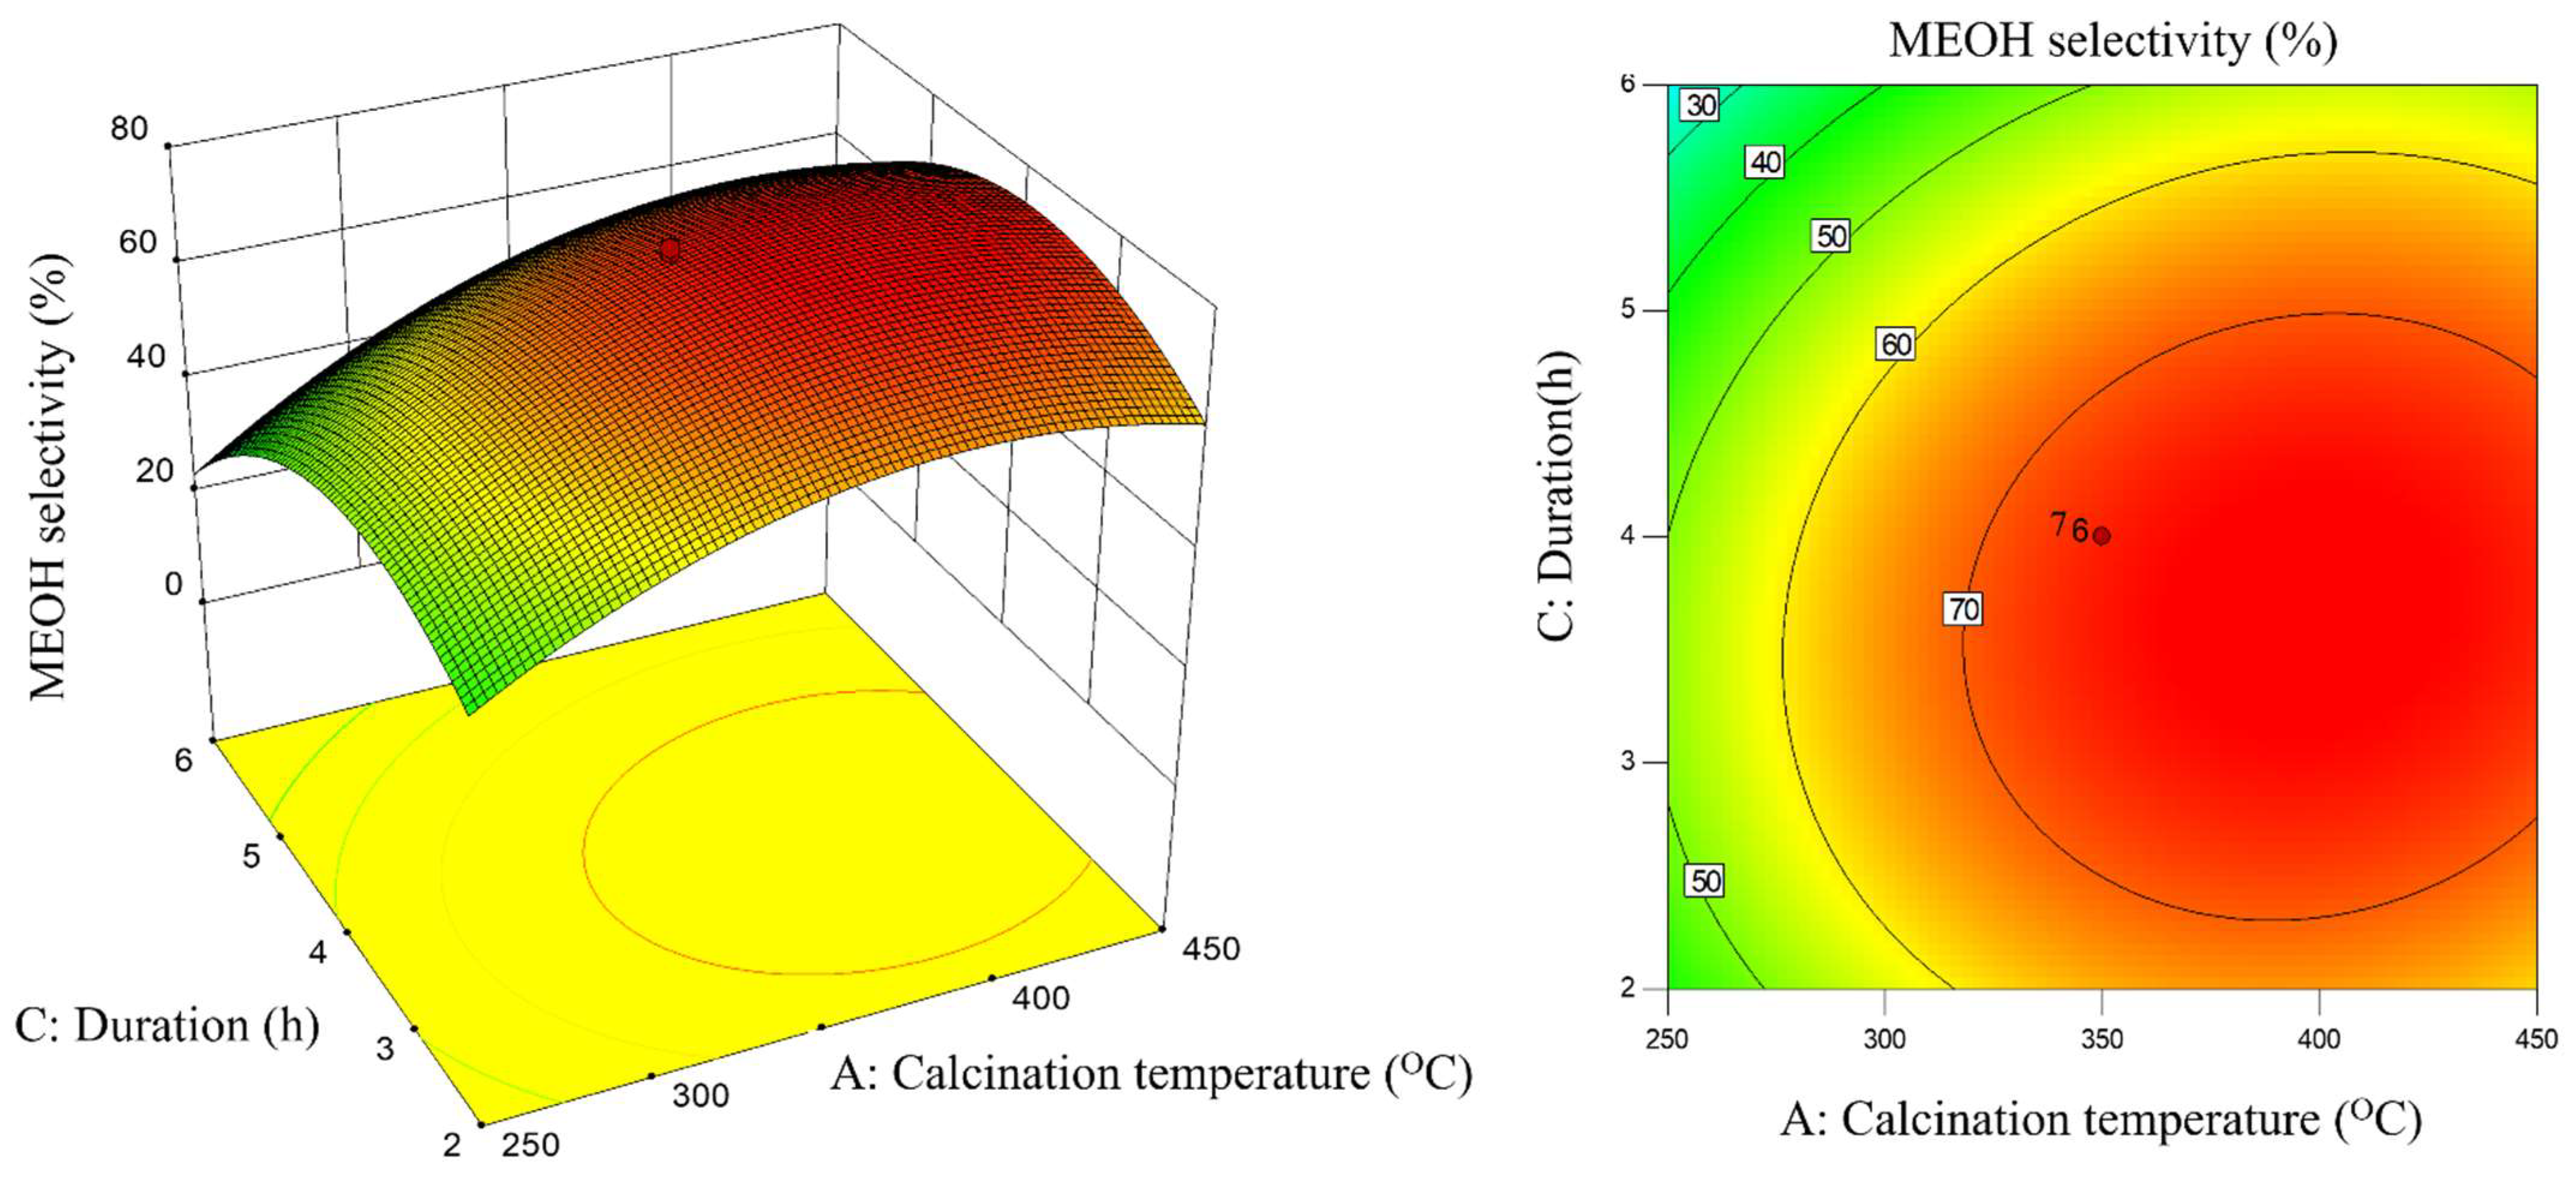
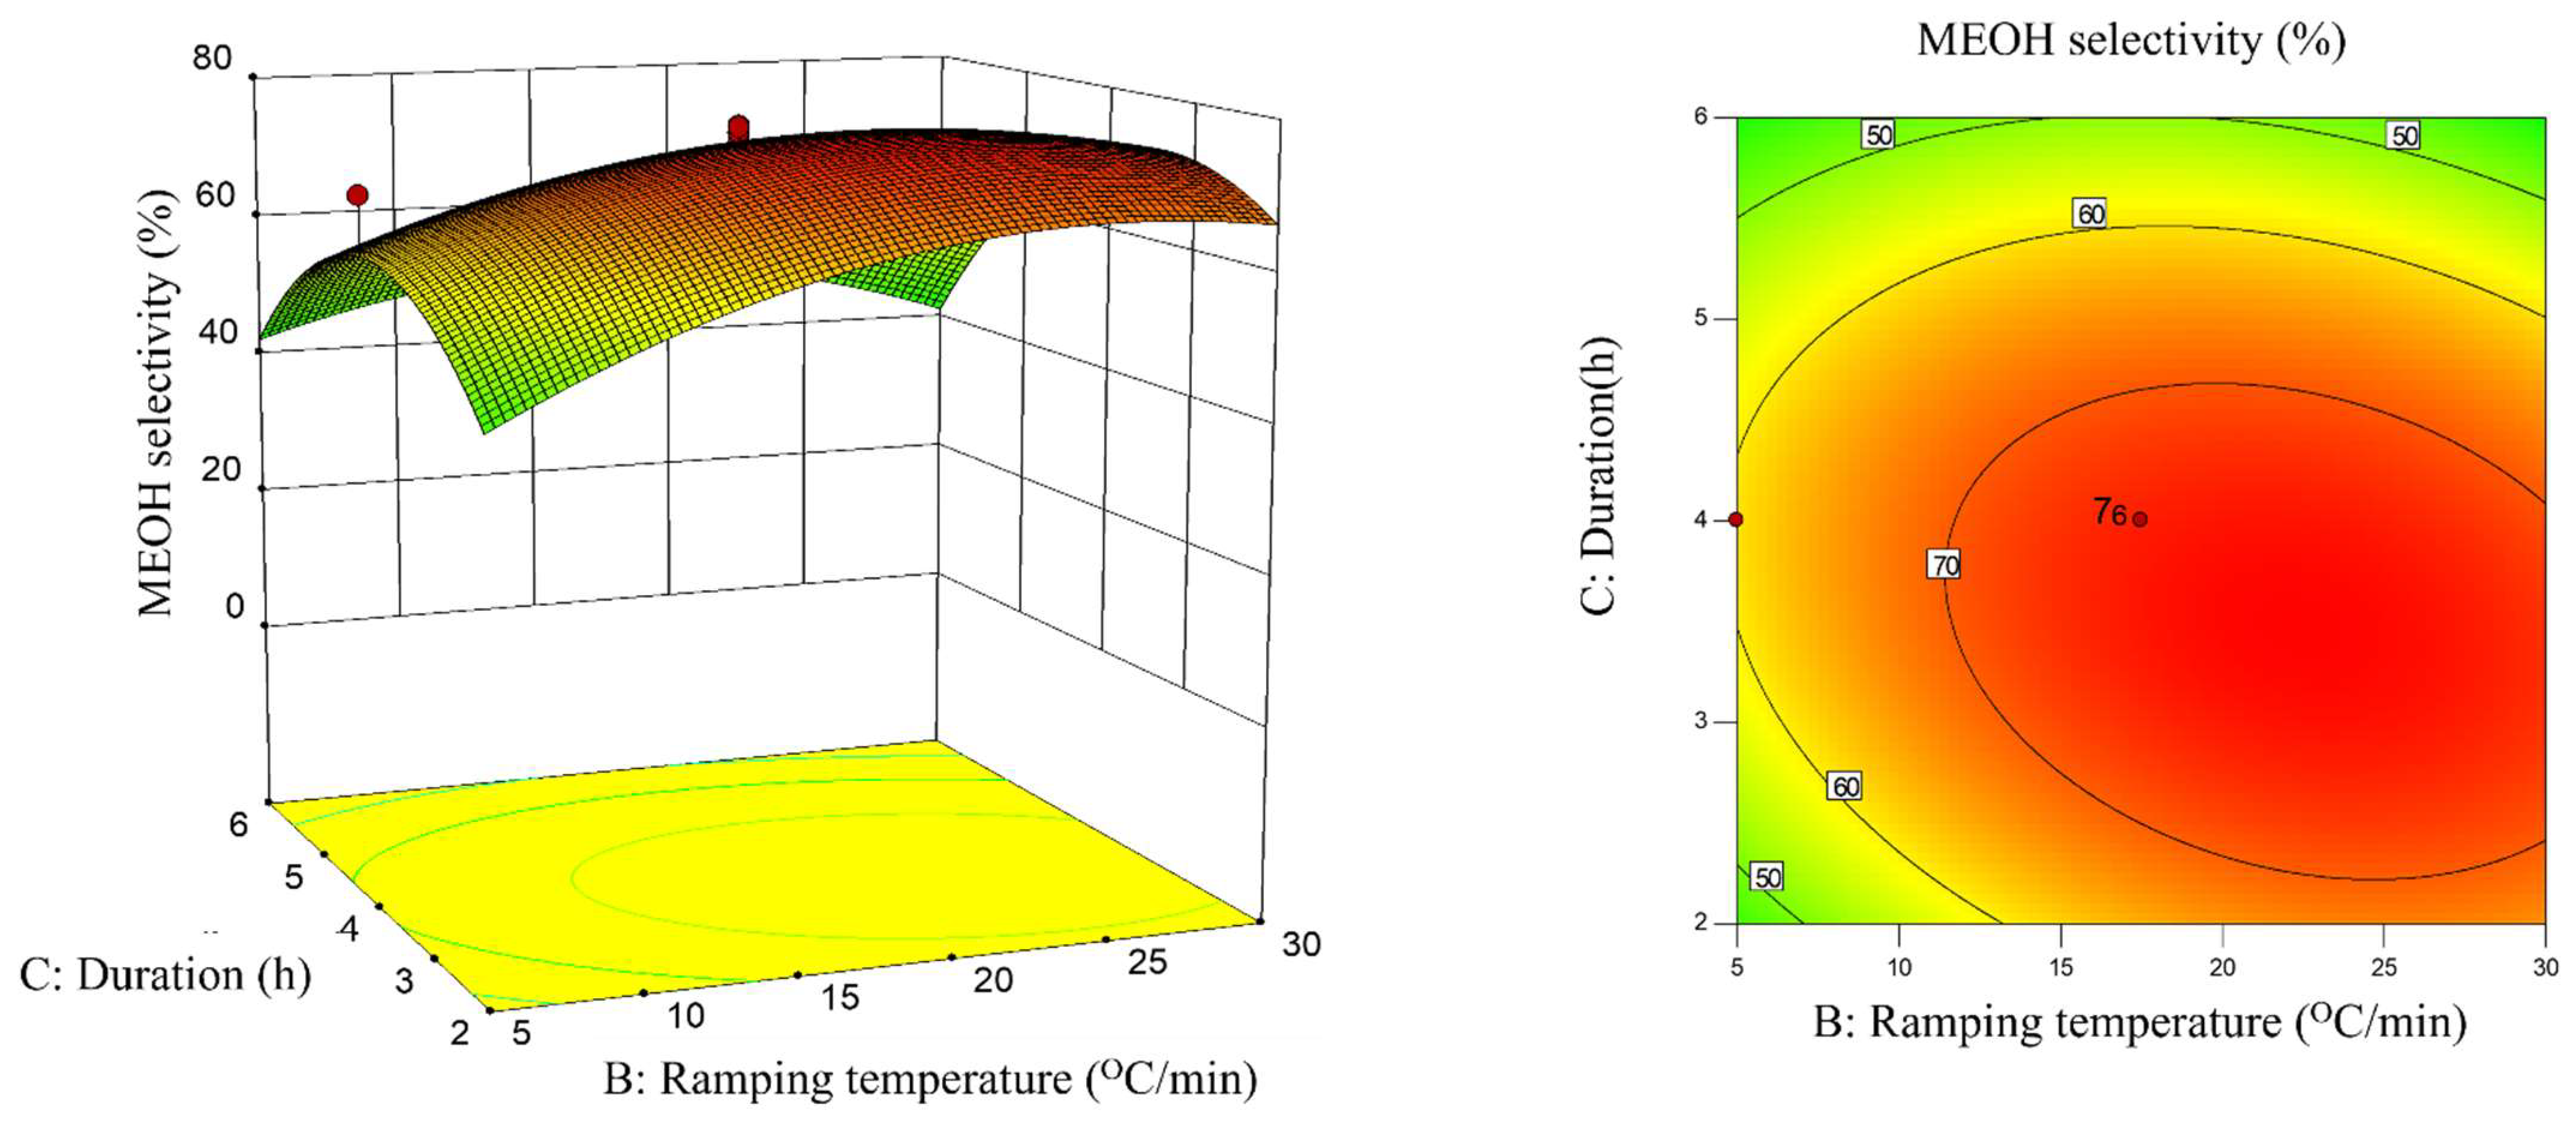
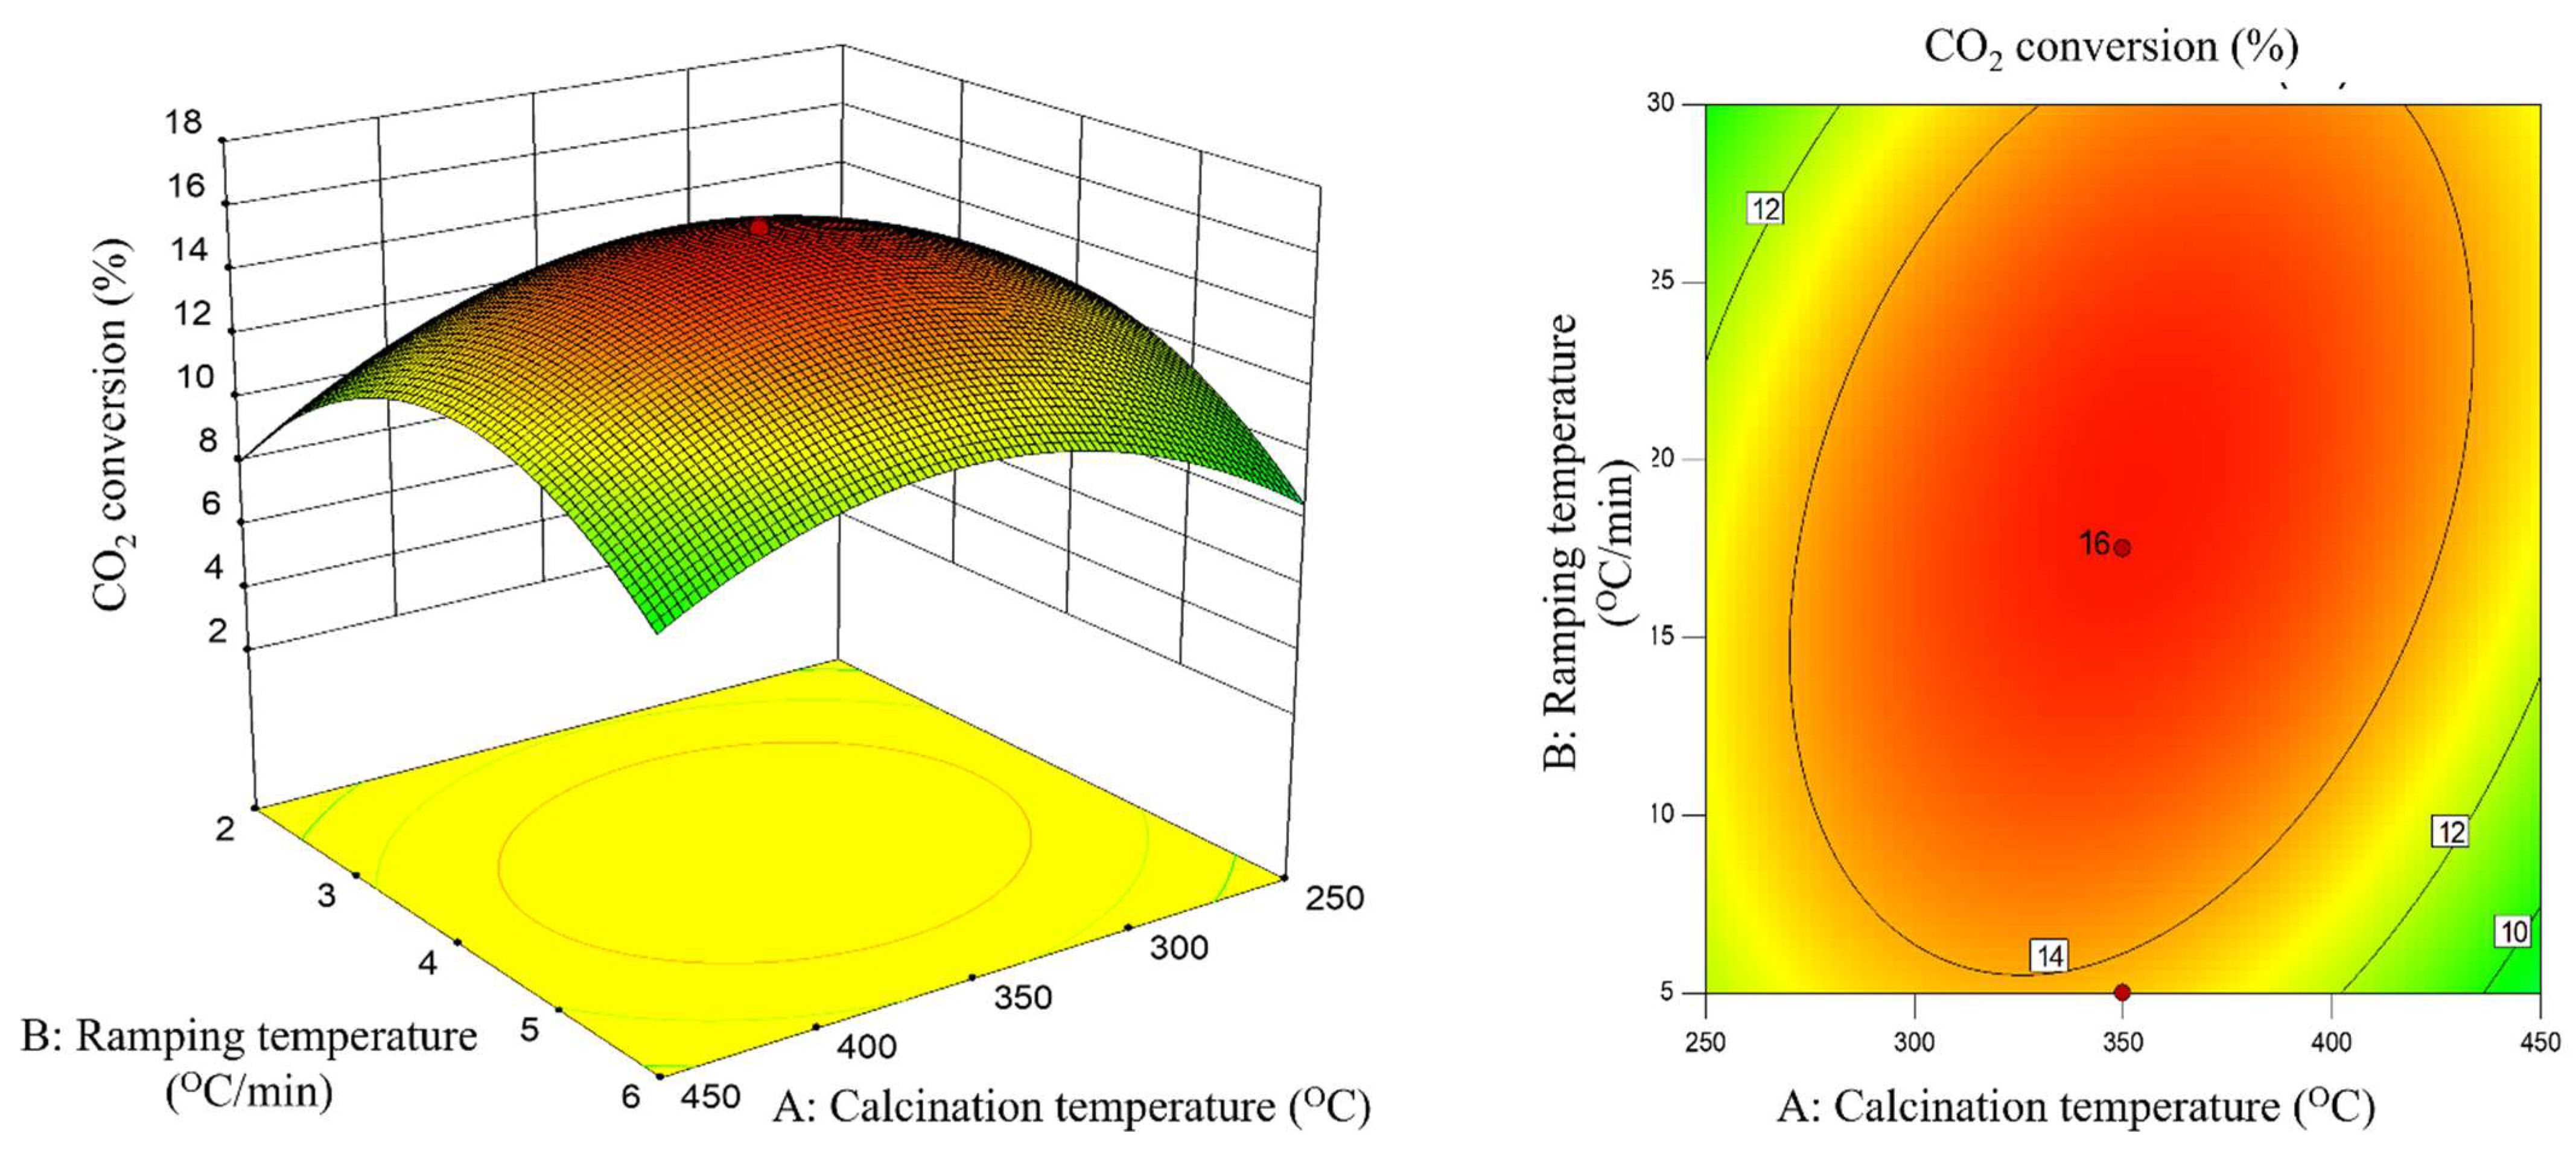
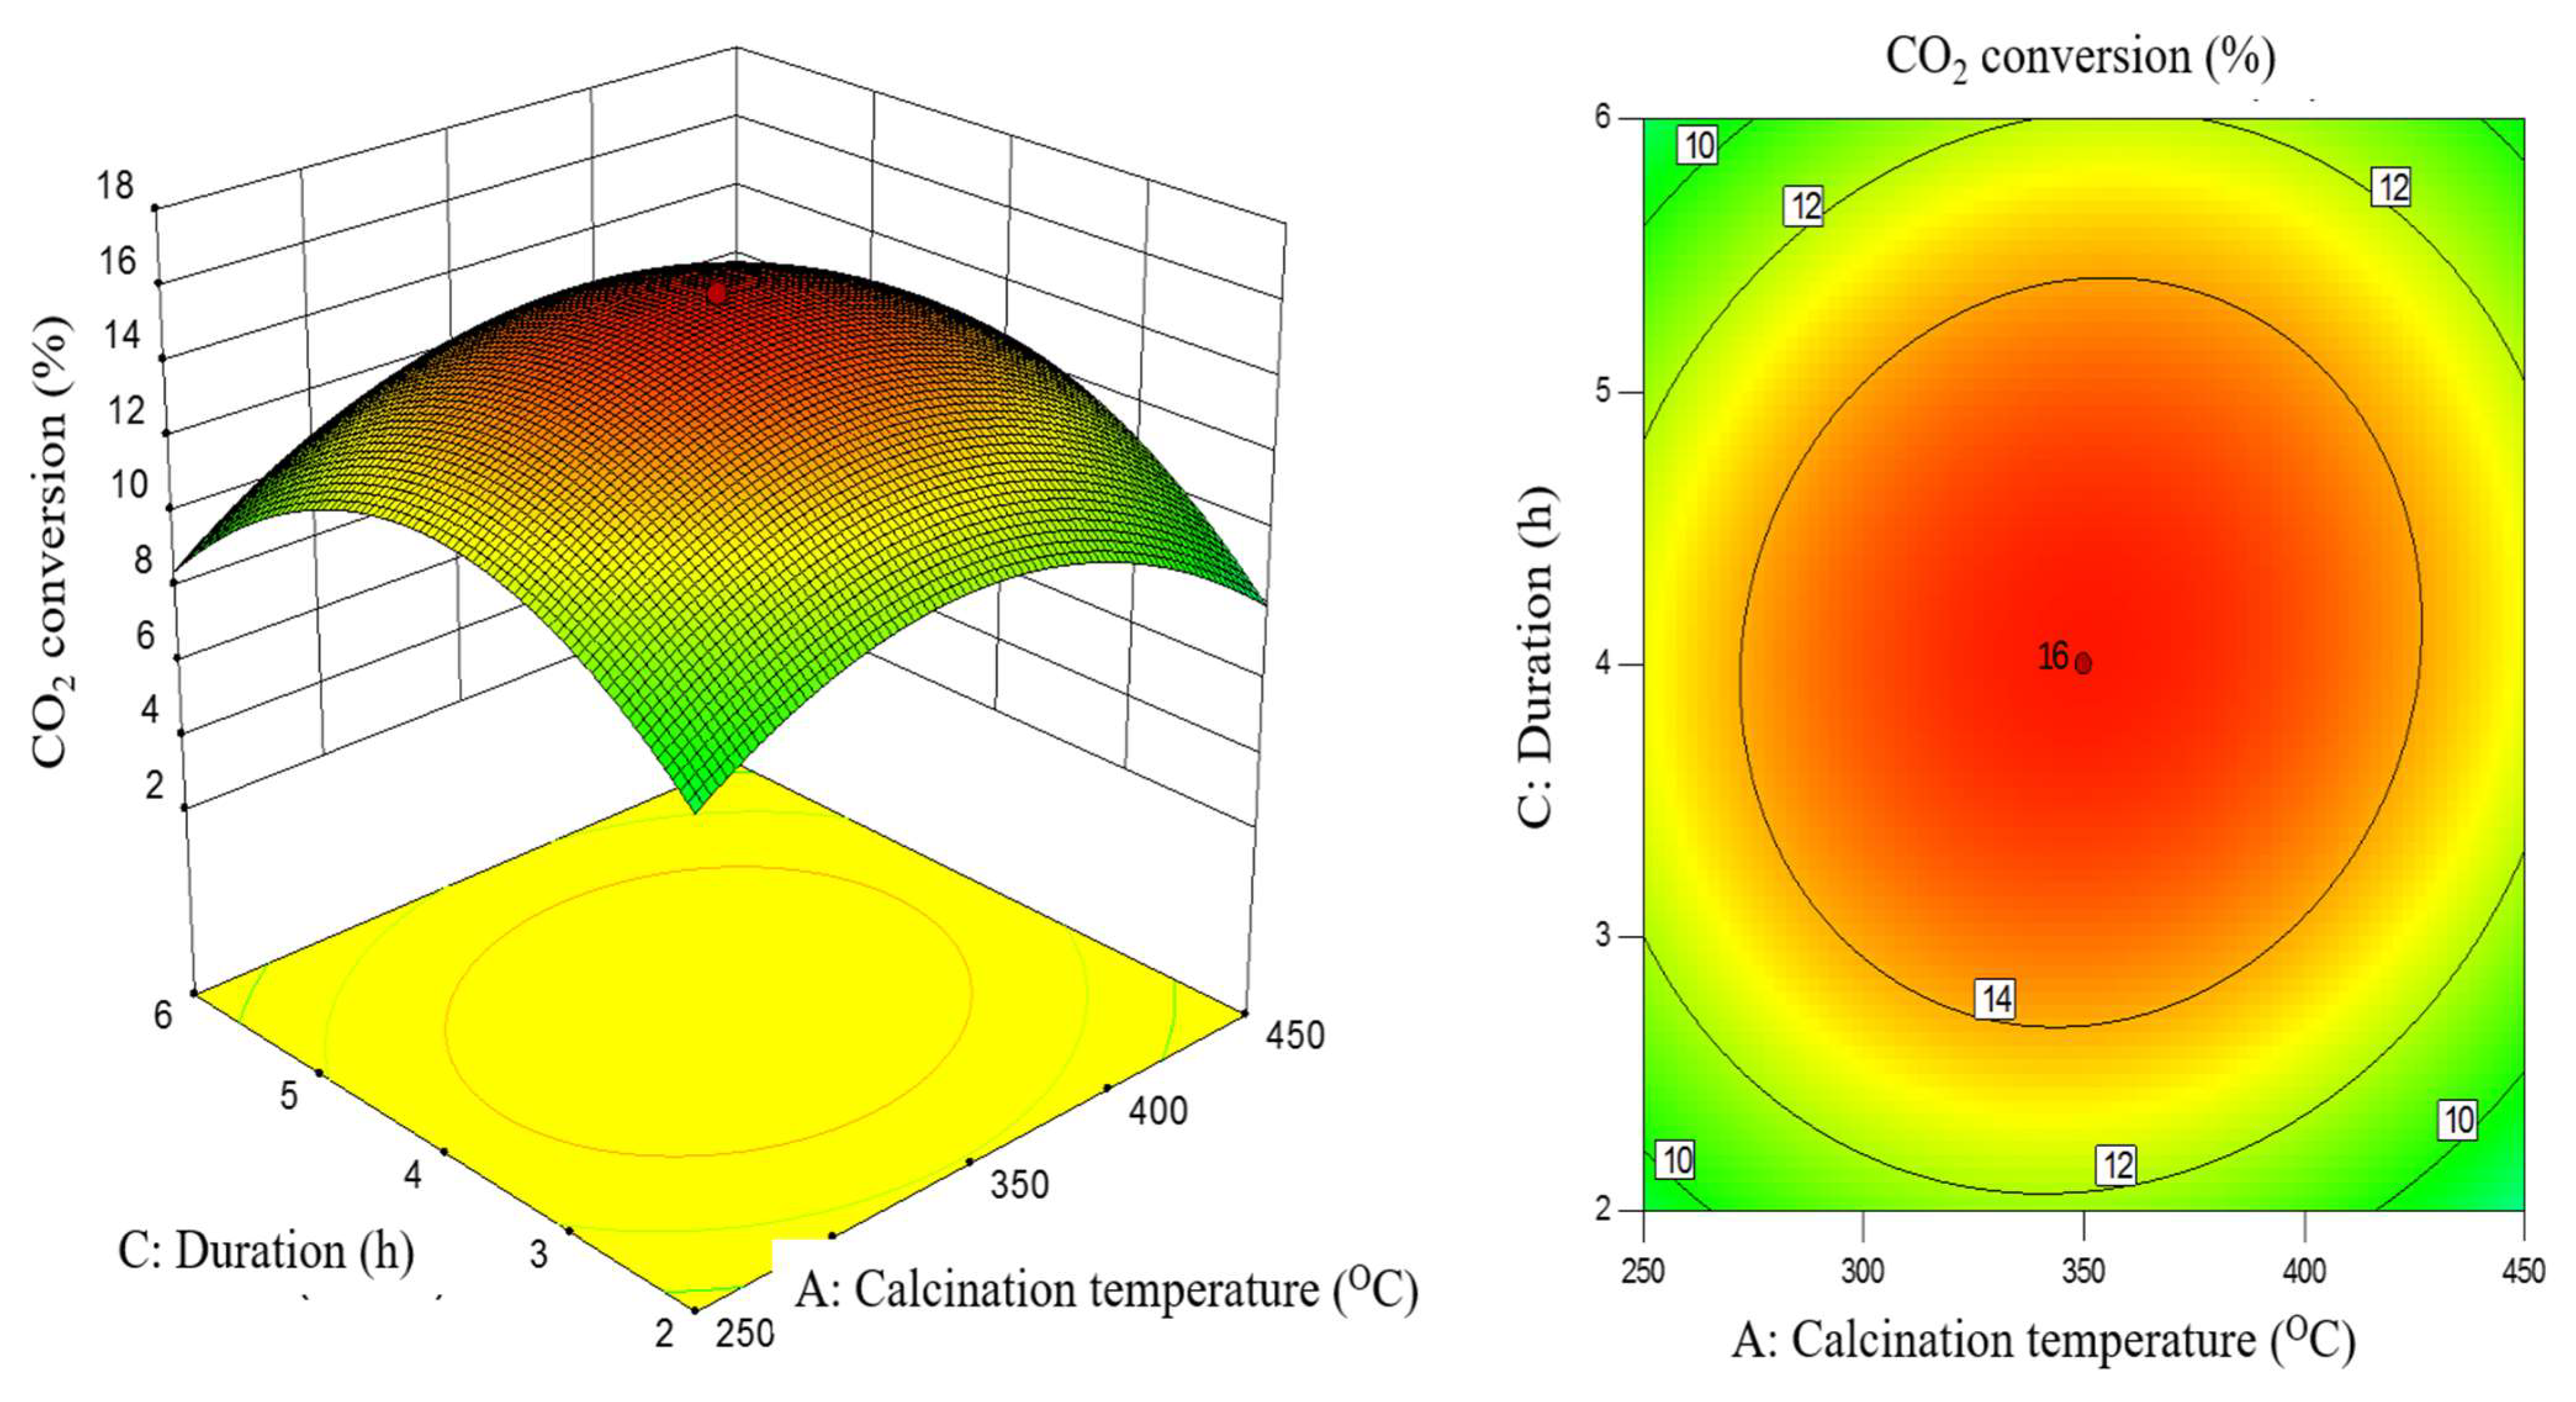
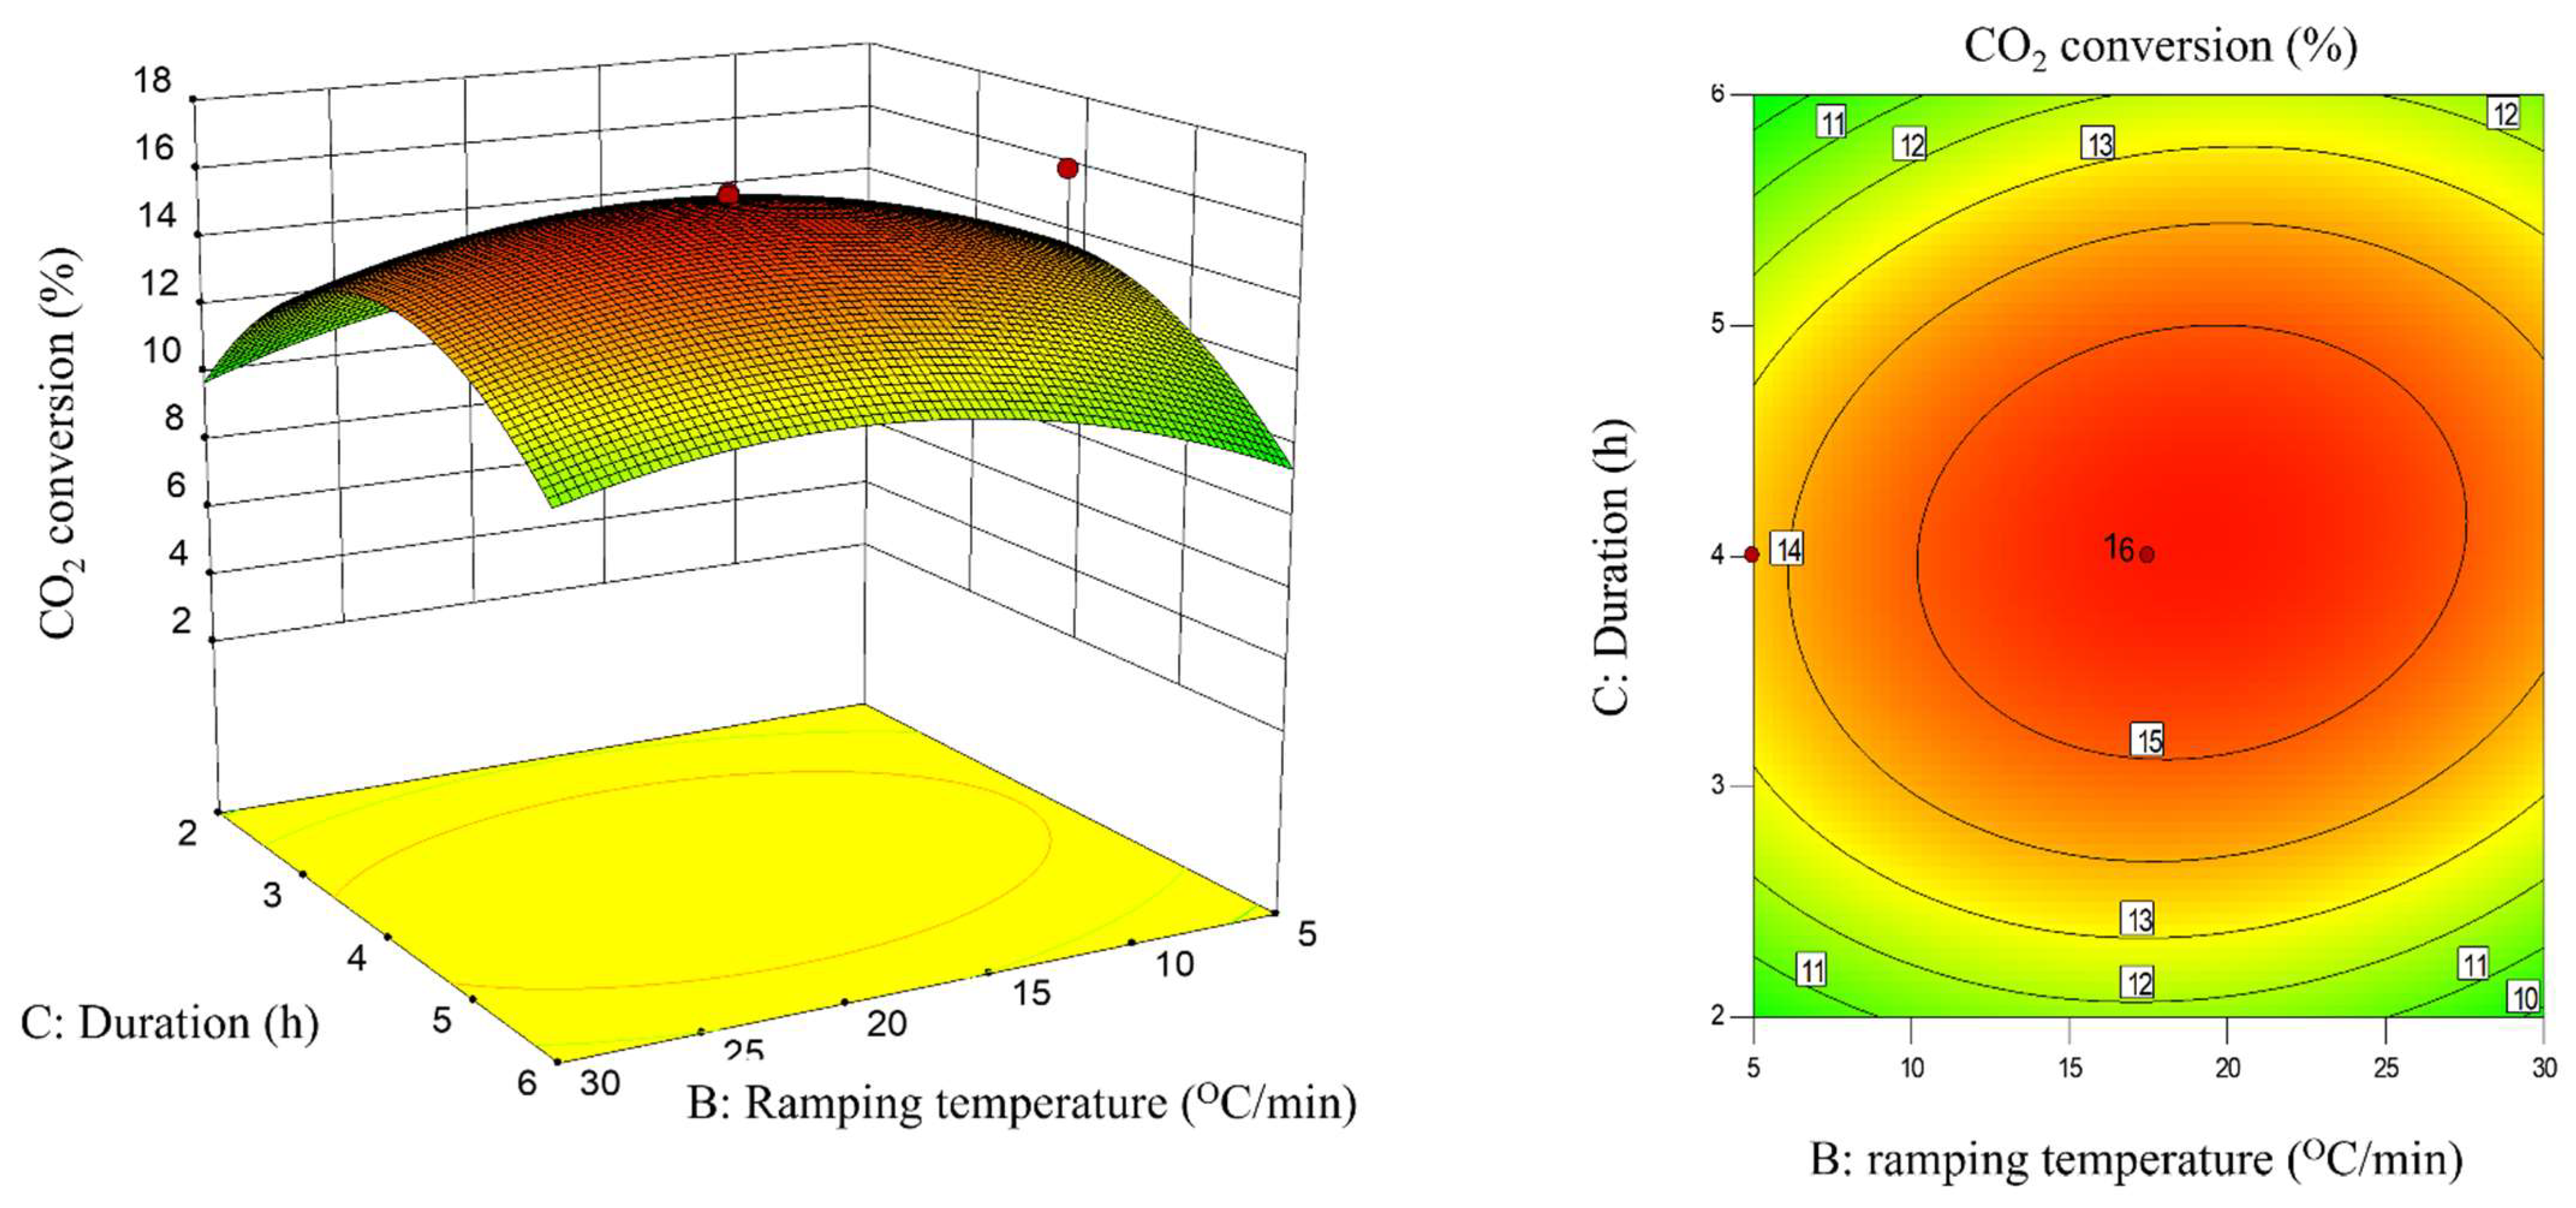
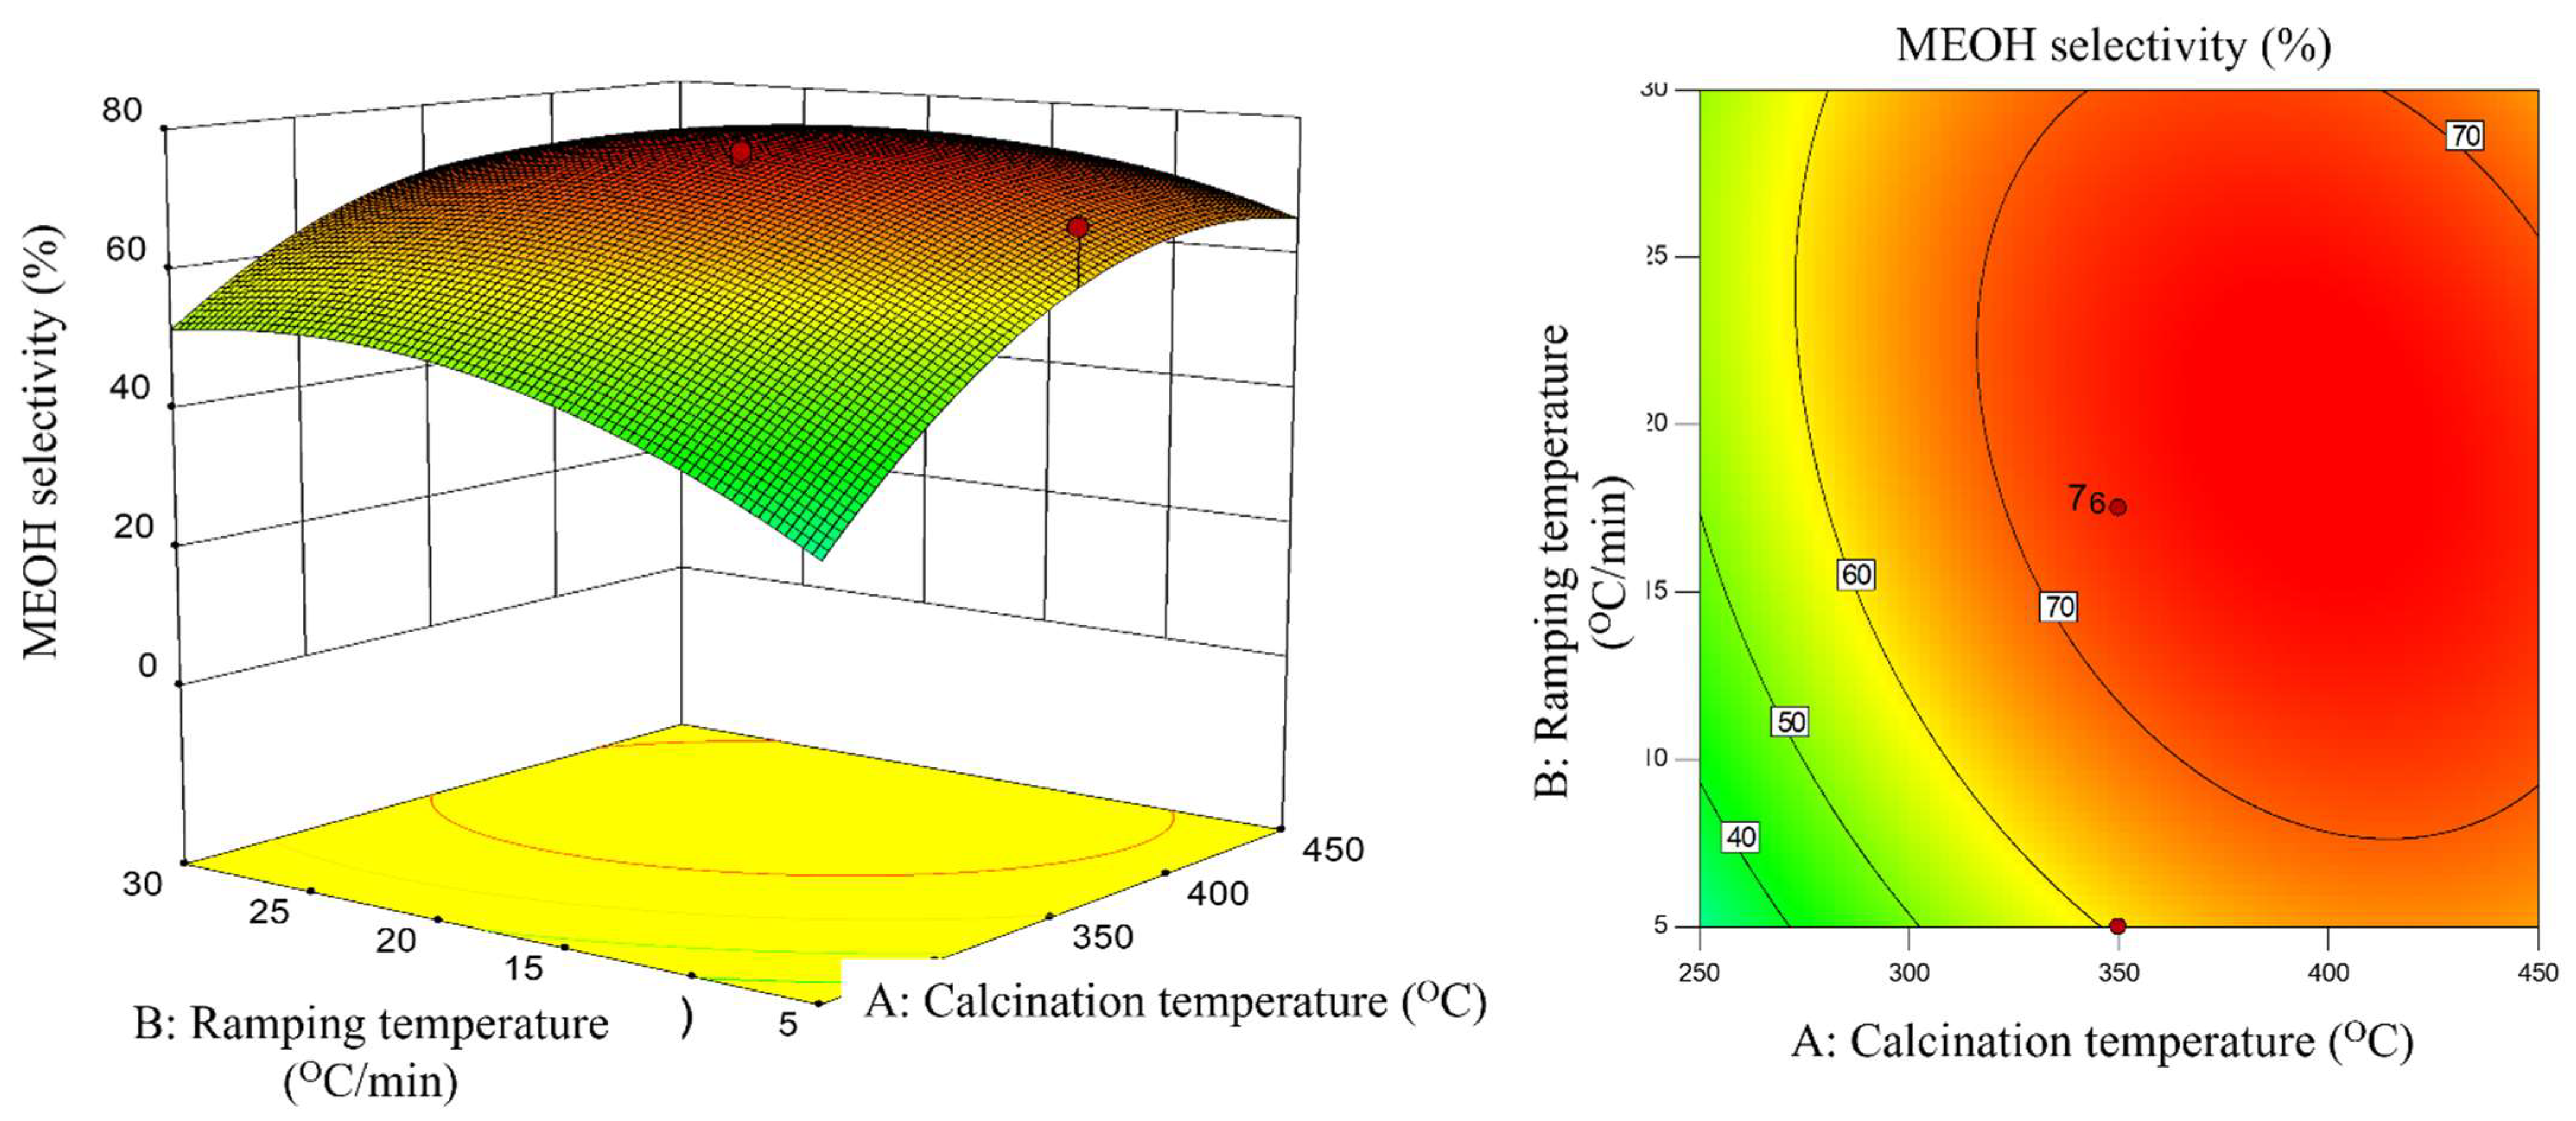
2.3. Interaction Effect of Calcination Condition of Catalyst (MNCZAZ)

The optimum response and the relationship between significant model terms are illustrated in Figure 1, Figure 2, Figure 3, Figure 4, Figure 5 and Figure 6 which exhibit the 3-D curvature and its respective contour plots for:
  • temperature and ramping rate (AB)
  • temperature and duration (AC)
  • ramping rate and duration (BC)
These are the three possible two-factor combination interactions for studying the effects of catalyst (MNCZAZ) calcination conditions on the values of XCO2 and SMEOH.
Figure 1 shows the simultaneous effects of A and B variables which have the most significant influence on the CO2 conversion (XCO2). The values of XCO2 increased when A and B were increased from 181–350 (°C) and 5–17.5 (°C/min), respectively. Increasing the calcination temperature further to 450 and 518 (°C) caused XCO2 to decrease significantly by 10–13% from that of the highest value (16.01%). The same trend was observed when the calcination temperature was decreased from 250 to 181 (°C).
Interaction effects of AB and AC on methanol selectivity are depicted in Figure 4 and Figure 5, respectively. Figure 6 shows the simultaneous effects of B and C, which exhibit the most significant influence on methanol selectivity, (SMEOH) study. The selectivity to methanol was maximized when B was at the center point at 17.5 °C/min and C was increased from 1–4 (h). Increasing or decreasing the ramping rate of 17.5 (°C/min) and duration longer than 4 h caused the SMEOH to decrease significantly by 70–90% from the highest value of 75.86%.

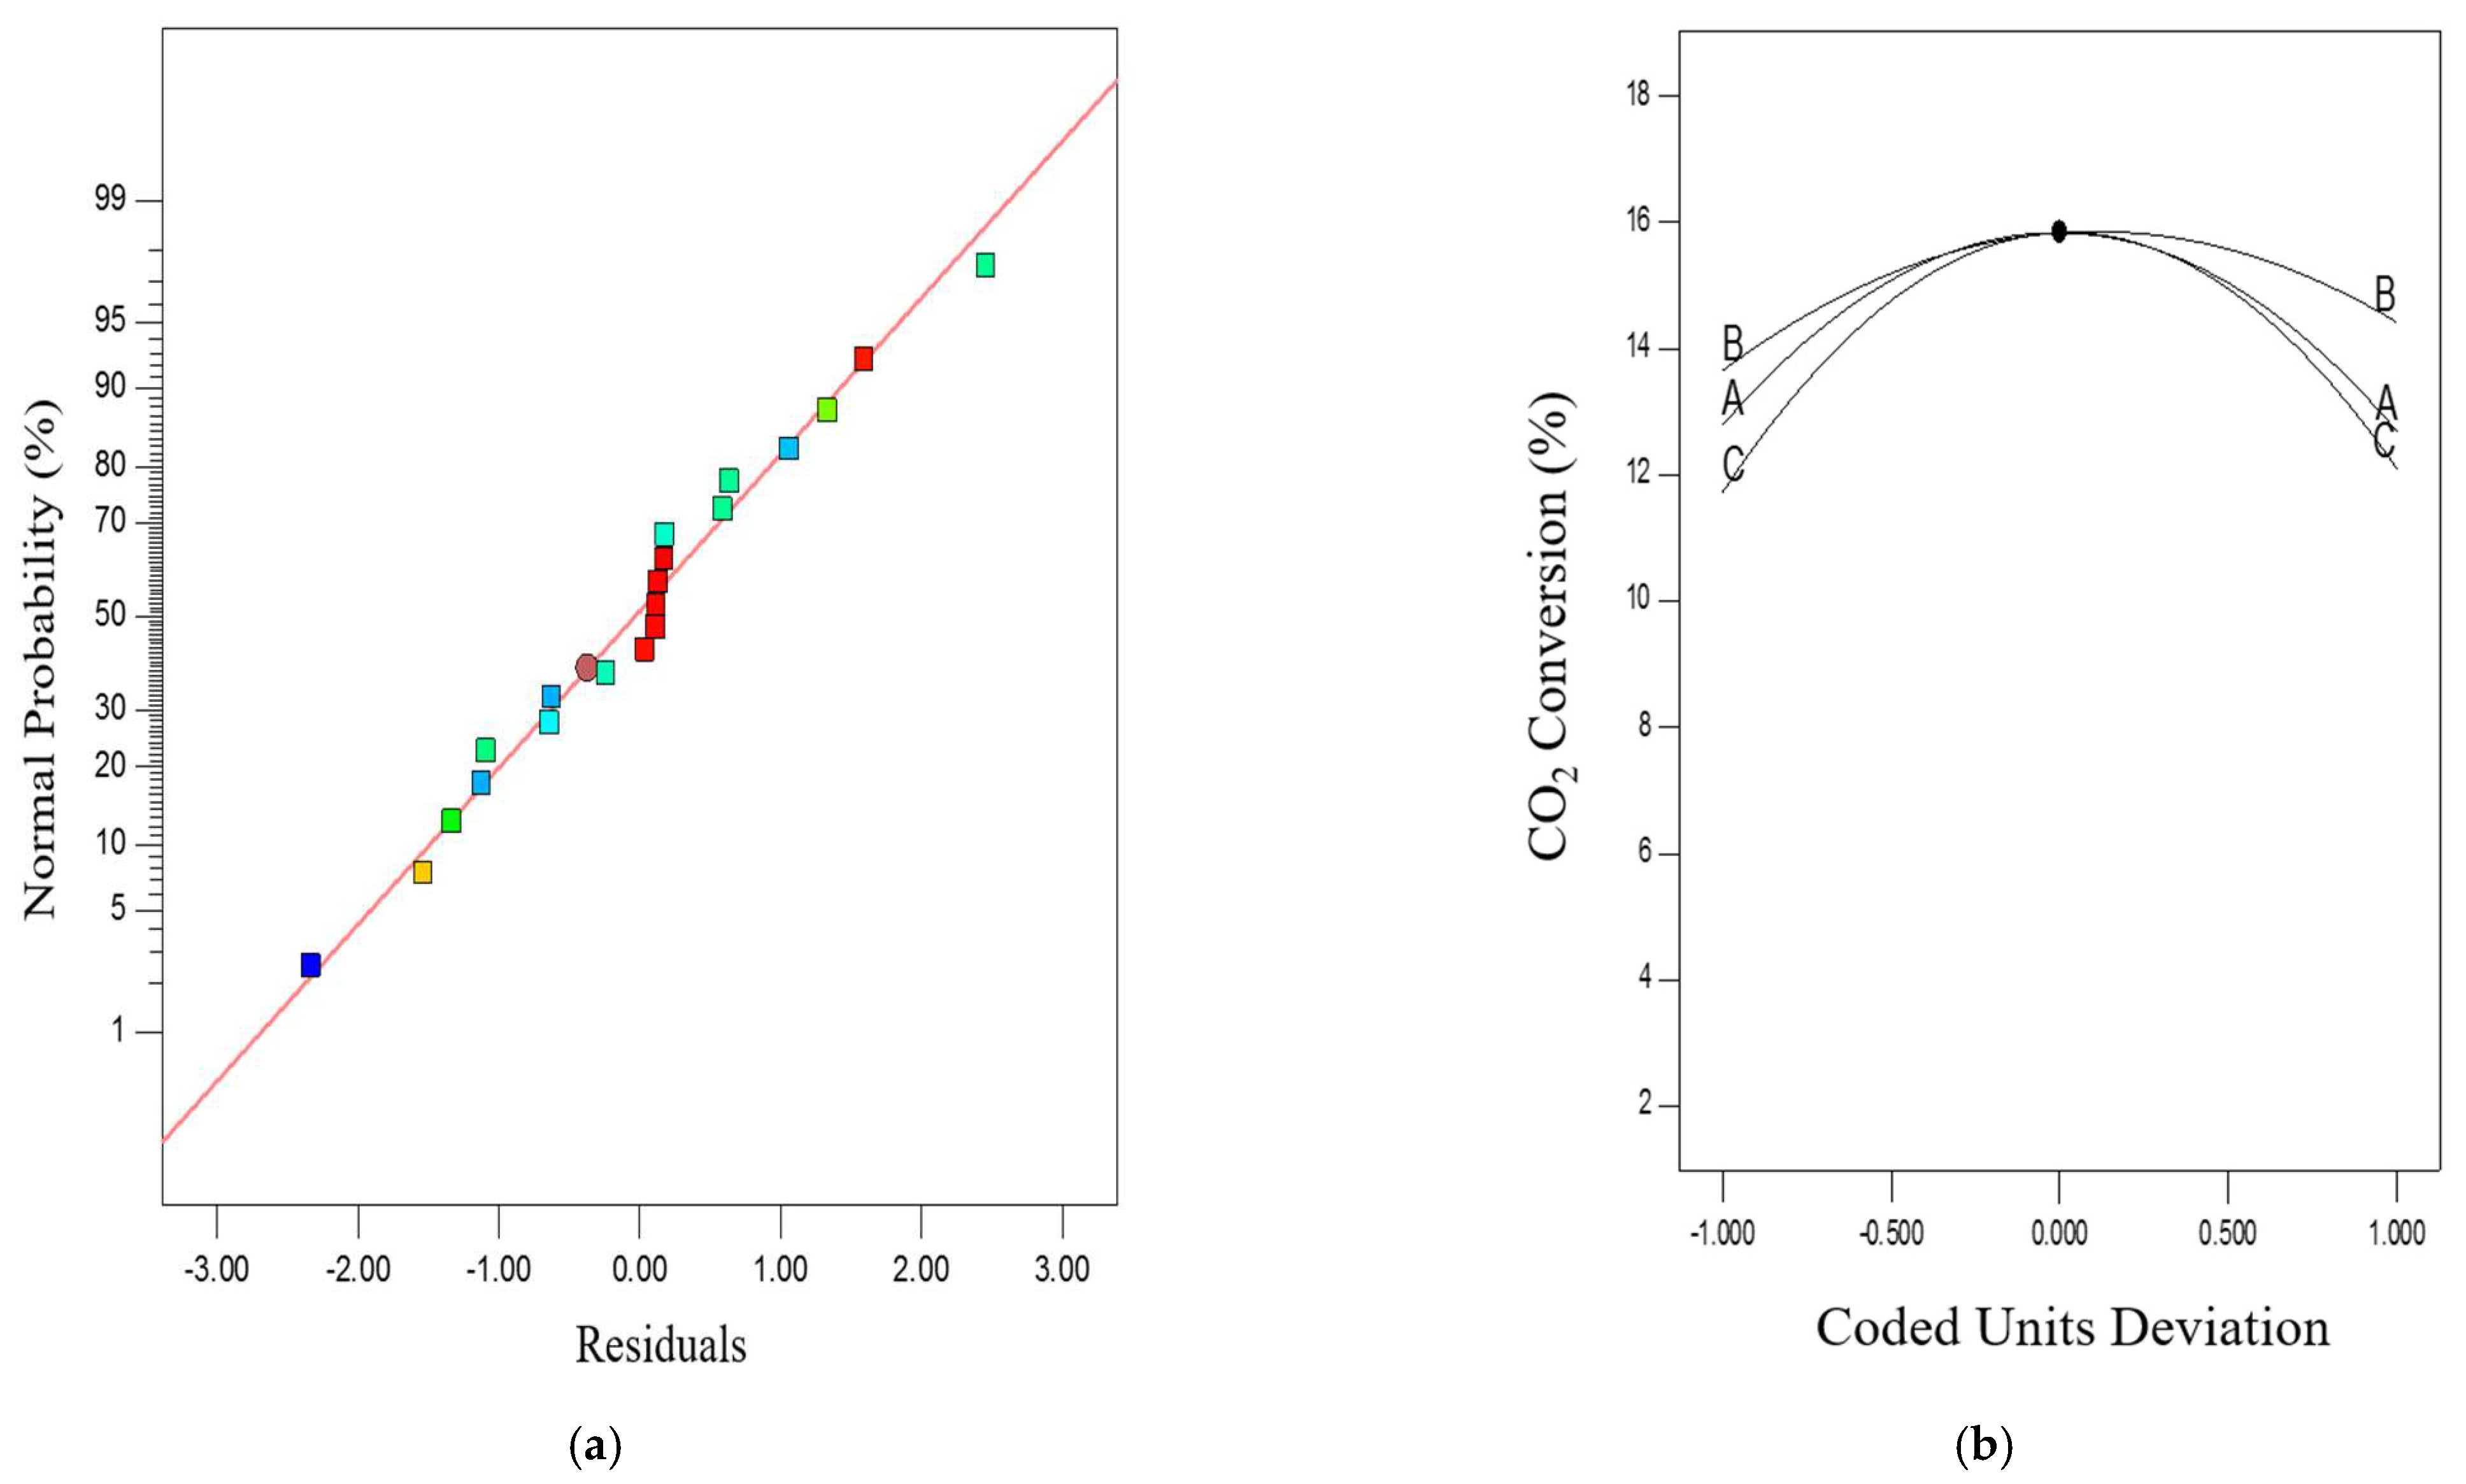
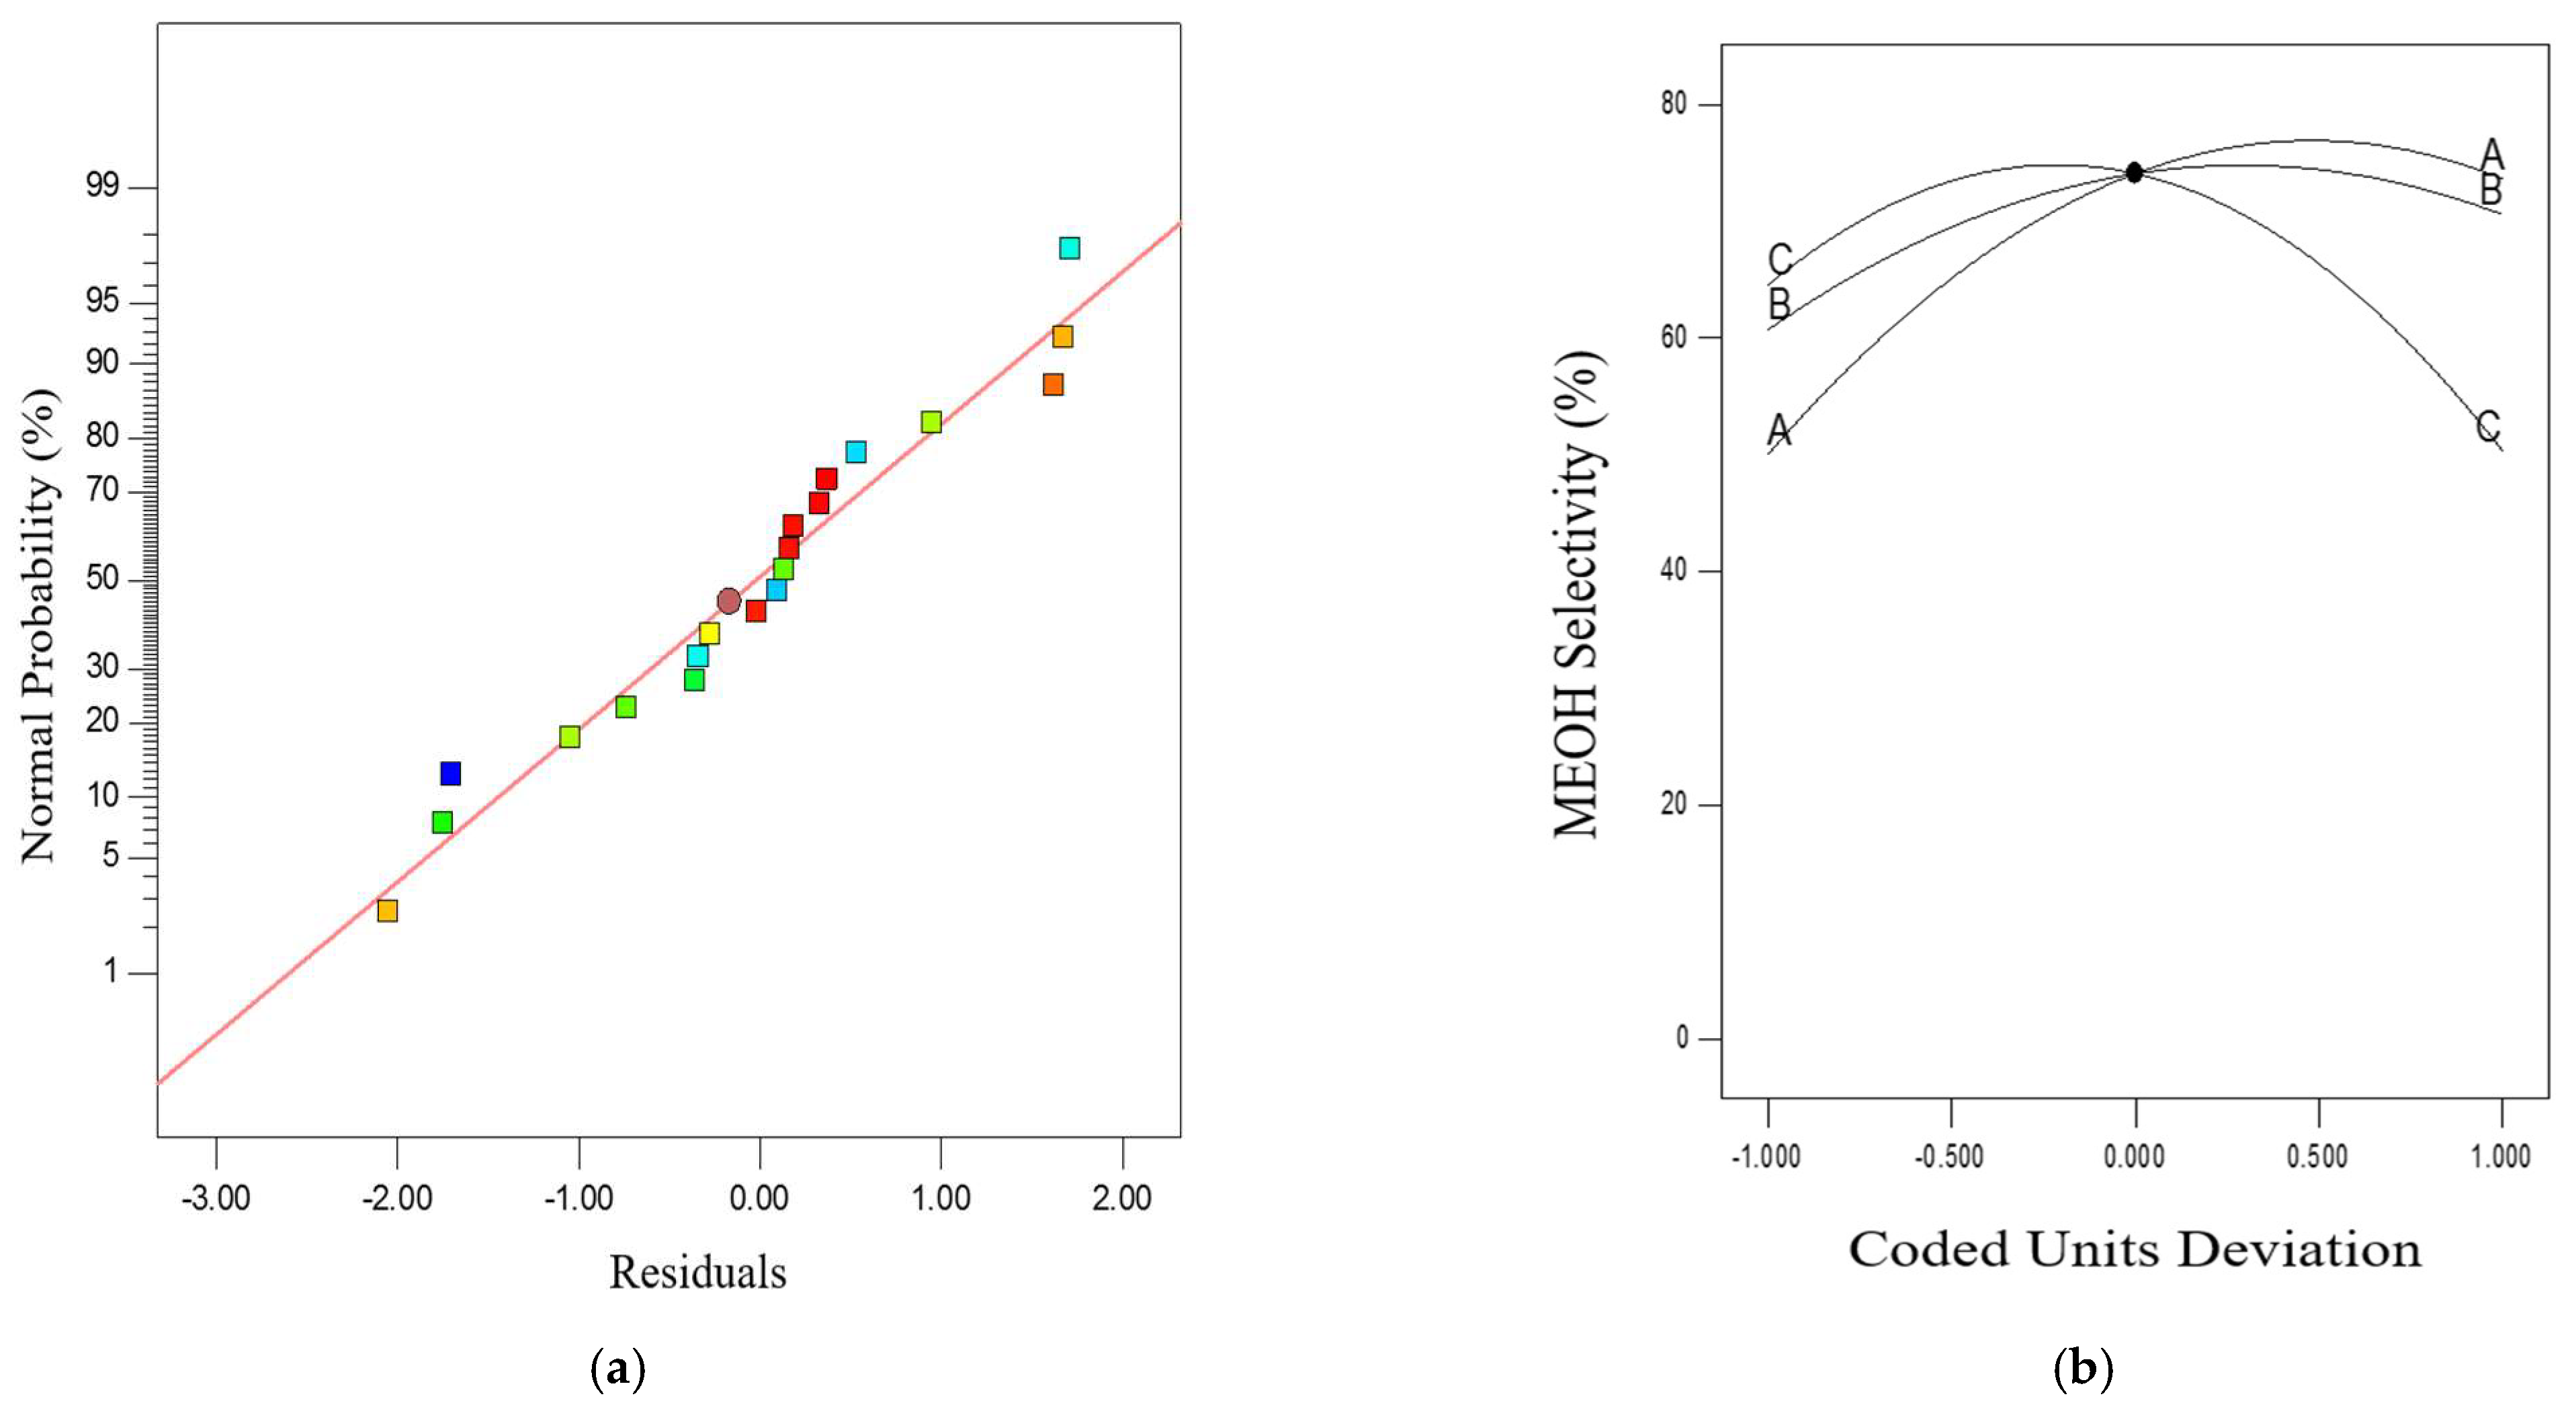
2.4. Diagnostic Plots of the Calcination Parameters to XCO2 and SMEOH Responses

Residual analysis was applied to both models for adequacy inspection to avoid any inadequate fit of the approximating model. The normal probability plots shown in Figure 7 and Figure 8a implied that the experimental data fitted well to the straight lines. These trends indicated normal distribution of the data, thus confirming the normality of the experimental data. The qualification of fit data plots, shown in Figure 7 and Figure 8b, further confirmed good representation of the established polynomial model. The statement was validated as the actual data points fell near the straight line within acceptable variance range, when compared to the calculated value [22]. Based on this analysis, the optimal calcination condition for the catalyst (MNCZAZ) was then calculated using Equation (1) for XCO2 and Equation (2) for SMEOH experiments. To summarize, the analysis agreed with the experimental data where the difference between the calculated and experimental optimal point for XCO2 and SMEOH was only 4.32 and 2.81%, respectively (Table 6).

2.5. RSM Optimizations of Calcination Parameters

The main objective of RSM is to determine the optimum condition for the process. From the analysis, the optimum calcination parameters for CO2 hydrogenation activity of the synthesized catalyst (MNCZAZ) are summarized in Table 6. The selected optimum conditions were based on the maximum XCO2 and SMEOH and its desirability, which is 1.000. Using the same experimental method, three confirmation runs were conducted to validate the results. The calculated XCO2 and SMEOH activity differences with experimental values were approximately 0.7% to 2.1%, respectively. The percentage errors difference between the calculated and experimental values were within the acceptable value of 5%. Thus, these repeated optimized runs further confirmed the reliability of the regression equation model.

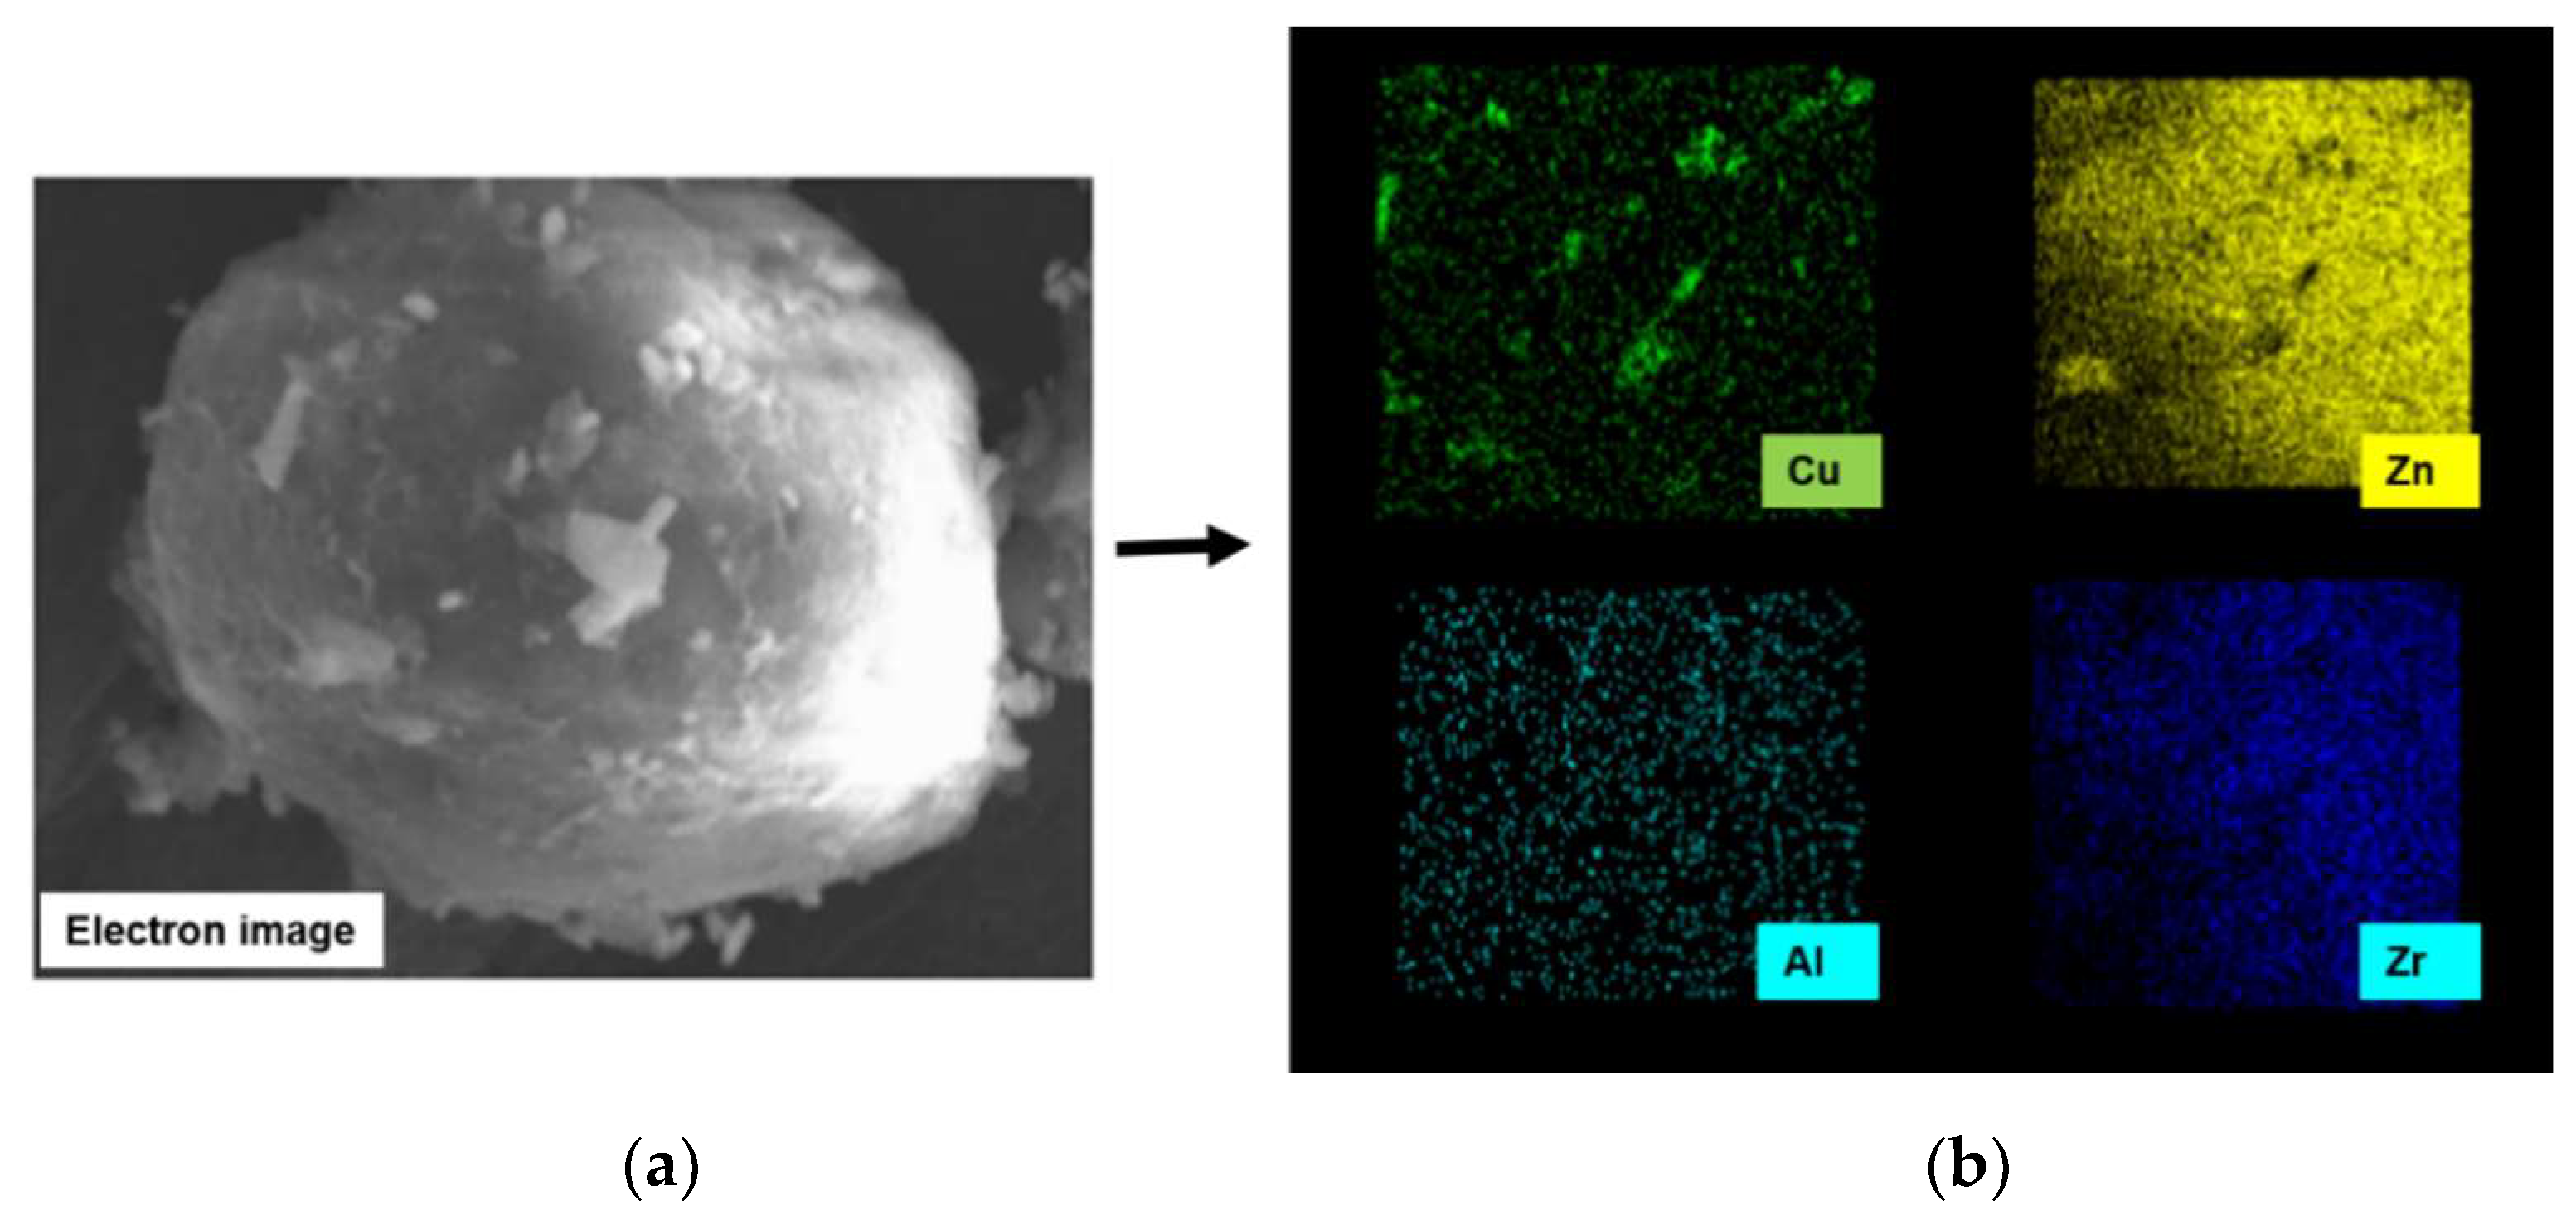
2.6. Textural and Morphological Properties

Figure 9 shows the field-emission scanning electron microscopy (FESEM) image and the elemental maps of the Cu, Zn, Al, Zr of the MNCZAZ catalyst. This elemental map shows that both CuO and ZnO were dispersed on the Al2O3-ZrO2 support with slight agglomeration on the surface (represented by the scattered green and yellow spots).
Table 7 shows the impregnated elemental composition of the catalyst, as determined by X-Ray fluorescence (XRF) technique. The compositions of Cu and Zn as well the Mn and Nb promoters were found to be in good agreement with the theoretical values.
Table 8 shows the textural properties of some of the catalysts which were calcined under various conditions. The data were arranged from the highest to the lowest calcination temperature. The results of ANOVA indicated that calcination temperature had the highest effect to the methanol selectivity. The BET surface areas and pore diameters of the catalyst were found to be influenced by the calcination temperature. The BET surface area increased from 137 m2/g to 167 m2/g as the calcination temperature decreased from 518 °C to 181 °C at the same condition of 17.5 °C /min ramping rate and 4 h duration. An opposite trend was observed for the pore diameter which decreased from 8.9 nm to 7.4 nm when the calcination temperature decreased from 518 to 181 °C. Near the optimum calcination condition, the catalyst exhibited a BET surface area of 147 m2/g, a pore volume of 0.31 cm3/g, and a pore diameter of 8.1 nm, which resulted in the highest methanol selectivity.

3. Materials and Methods

3.1. Experimental Design

A standard response surface methodology (RSM) design, also known as central composite design (CCD), was used to study the calcination parameters of the synthesized Cu-based catalyst (MNCZAZ) for CO2 hydrogenation reaction. The calcination parameters investigated were the temperature, ramping rate, and duration. An empirical model was developed to correlate the response XCO2 and SMEOH to the three respective parameters affecting the CO2 hydrogenation process in methanol synthesis by using a second-degree polynomial equation, as given by the following equation.
γ = β 0 + β 1 A +   β 2 B + β 3 C + β 12 A + β 13 A C + β 23 B C +   β 11 A 2 + β 22 B 2 + β 33 C 2
where γ is the predicted response; β 0 is the constant coefficient; β 1 , β 2   and   β 3 are the linear coeeficients; β 12 , β 13 , and   β 23 are the interaction coefficients; β 11 , β 22 , and   β 33 are the quadratic coefficients; and A, B, C are the coded values of independent input parameters.
To correlate between all responses and analyze the experimental condition with the highest desirability, Design Expert Version 10 (Stat Ease, Minneapolis, MN, USA) was utilized. Analysis of variance (ANOVA) explained every variation in the statistically obtained model and illustrates the importance of each model parameter. The F-test for a confidence level of 95% as well as the lack of fit (LOF) test was used to evaluate the significance of the model. Typically, the model is classified as more significant when it shows greater F-value and smaller p-value.

3.2. Preparation and Characterization of MNCZAZ Catalyst

To synthesize 10 g MNCZAZ catalyst, 0.021 g of Mn(NO3)2·4H2O [Merck, Subang Jaya, Malaysia], 0.014 g of C4H4NNbO9 [Merck, Malaysia], 3.995 g of Cu(NO3)2 [Merck, Malaysia], and 1.644 g of Zn(NO3)2 [Sigma Aldrich, Malaysia], were stirred for 1 h in deionized water then added drop wisely onto the Al2O3-ZrO2 [SASOL, Hamburg, Germany] powder. The composition of the mixed support was 80 wt% Al2O3 and 20 wt% ZrO2. The slurry was continuously stirred for 24 h at pH 7 using 10% ammonia solution, NH4OH [Merck, Malaysia] to maintain the pH. The mixture was filtered and dried at 120 °C for 12 h and then calcined in air under the calcination conditions listed in Table 2.
The surface morphology of the synthesized samples was observed on a Hitachi-8020 field-emission scanning electron microscope (FESEM/EDX) (Hitachi High-Technologies Corporation, Tokyo, Japan) The textural properties were obtained via nitrogen adsorption–desorption isotherms measured on a Micromeritics ASAP 2020 adsorption analyzer (Micromeritics Instrument Corporation, Norcross, GA, USA) Metal contents were determined by X-ray fluorescence using a Bruker S8 Tiger X-ray Spectrometer (Bruker, Wissembourg, France).

3.3. Catalytic Performance Evaluation of MNCZAZ Catalyst

Catalytic activity evaluation was performed in a stainless-steel fixed-bed reactor (Microactivity Reference, PID Eng Tech, Norcross, GA, USA). A 0.2 g sample was reduced in situ by pure H2 flowing at 20 mL min−1 for 2 h prior to the hydrogenation process. Then, CO2 hydrogenation reaction was performed on the reduced catalyst at 22.5 bar, 250 °C, and CO2: H2 (1:3) with a total flow rate of 36 mL/min for 5 h. The reaction condition was fixed for all the catalysts synthesized according to the design matrix (Table 2). A gas chromatograph (Agilent 7890A) equipped with a TCD detector for H2 and CO2 analysis, and an FID detector for analysis of alcohols and other hydrocarbons, were used to analyze the reactor effluents [23]. CO2 conversion, methanol selectivity, and methanol yield were calculated using Equations (4)–(6), respectively.
CO 2   c o n v e r s i o n   ( % ) =   M o l e   o f   CO 2   i n   M o l e   o f   CO 2   o u t   M o l e   o f   CO 2   i n   ×   100
M e t h a n o l   s e l e c t i v i t y   ( % ) = m o l e   o f   m e t h a n o l   p r o d u c e d t o t a l   m o l e   o f   p r o d u c t × 100
M e t h a n o l   y i e l d   ( % ) = CO 2   c o n v e r s i o n   ( % ) 100 × M e t h a n o l   s e l e c t i v i t y   ( % )  

4. Conclusions

In conclusion, the calcination conditions of Cu-based catalysts for methanol synthesis through CO2 hydrogenation process was optimized using RCCD of RSM. Quadratic model was proposed to correlate the experimental variables for both CO2 conversion (XCO2) and methanol selectivity (SMEOH) responses. It was found that the model was able to predict the experimental data to high accuracy for XCO2 and SMEOH with R2 of 0.93 and 0.96, respectively. The interactions among the calcination temperature, A, and ramping rate, B, were found to have the most significant effect on the CO2 conversion; meanwhile, the calcination’s ramping rate and duration (B and C) had a significant effect on the methanol selectivity. The optimization of calcination conditions was studied and the computed values by the models were found to be in good agreement with the experimental values. The optimum calcination condition for a Mn/Nb-promoted Cu/ZnO/Al2O3-ZrO2 catalyst (MNCZAZ) for a CO2 hydrogenation reaction to produce methanol is at 342 °C, with a ramping rate of 17.9 °C per min for 4 h. Confirmatory experiments were conducted to evaluate the accuracy of the optimized conditions and the findings show that the range of deviation was 1.01%.

Author Contributions

Conceptualization, N.A.M.Z. and S.F.H.T.; methodology, N.H.B. and N.I.Z.; formal analysis, N.I.Z.; writing-review and editing, N.I.Z., N.H.B. and N.A.M.Z.; visualization, N.I.Z.; supervision, N.A.M.Z.; funding acquisition, N.A.M.Z. and S.F.H.T. All authors have read and agreed to the published version of the manuscript.

Funding

This research was funded by International Collaborative Research Fund, (Cost center: 015ME0-207).

Acknowledgments

Research support received from Universiti Teknologi PETRONAS and American University of Ras Al Khaimah are gratefully acknowledged.

Conflicts of Interest

The authors declare no conflict of interest.

References

  1. Atsbha, T.A.; Yoon, T.; Seongho, P.; Lee, C.J. A review on the catalytic conversion of CO2 using H2 for synthesis of CO, methanol, and hydrocarbons. J. CO2 Util. 2021, 44, 101413. [Google Scholar] [CrossRef]
  2. Zhang, X.; Zhang, G.; Liu, W.; Yuan, F.; Wang, J.; Zhu, J.; Jiang, X.; Zhang, A.; Ding, F.; Song, C.; et al. Reaction-driven surface reconstruction of ZnAl2O4 boosts the methanol selectivity in CO2 catalytic hydrogenation. Appl. Catal. B Environ. 2021, 284, 119700. [Google Scholar] [CrossRef]
  3. Alsuhaibani, A.S.; Afzal, S.; Challiwala, M.; Elbashir, N.O.; El-Halwagi, M.M. The impact of the development of catalyst and reaction system of the methanol synthesis stage on the overall profitability of the entire plant: A techno-economic study. Catal. Today 2020, 343, 191–198. [Google Scholar] [CrossRef]
  4. Vita, A.; Italiano, C.; Pino, L.; Laganà, M.; Ferraro, M.; Antonucci, V. High-temperature CO2 methanation over structured Ni/GDC catalysts: Performance and scale-up for Power-to-Gas application. Fuel Process. Technol. 2020, 202, 106365. [Google Scholar] [CrossRef]
  5. Ren, S.; Fan, X.; Shang, Z.; Shoemaker, W.R.; Ma, L.; Wu, T.; Li, S.; Klinghoffer, N.B.; Yu, M.; Liang, X. Enhanced catalytic performance of Zr modified CuO/ZnO/Al2O3 catalyst for methanol and DME synthesis via CO2 hydrogenation. J. CO2 Util. 2020, 36, 82–95. [Google Scholar] [CrossRef]
  6. Li, K.; Chen, J.G. CO2 Hydrogenation to Methanol over ZrO2-Containing Catalysts: Insights into ZrO2 Induced Synergy. ACS Catal. 2019, 9, 7840–7861. [Google Scholar] [CrossRef]
  7. Marcos, F.C.; Lin, L.; Betancourt, L.E.; Senanayake, S.D.; Rodriguez, J.A.; Assaf, J.M.; Giudici, R.; Assaf, E.M. Insights into the methanol synthesis mechanism via CO2 hydrogenation over Cu-ZnO-ZrO2 catalysts: Effects of surfactant/Cu-Zn-Zr molar ratio. J. CO2 Util. 2020, 41, 101215. [Google Scholar] [CrossRef]
  8. Wu, J.; Saito, M.; Takeuchi, M.; Watanabe, T. The stability of Cu/ZnO-based catalysts in methanol synthesis from a CO2-rich feed and from a CO-rich feed. Appl. Catal. A Gen. 2001, 218, 235–240. [Google Scholar] [CrossRef]
  9. Din, I.U.; Usman, M.; Khan, S.; Helal, A.; Alotaibi, M.A.; Alharthi, A.I.; Centi, G. Prospects for a green methanol thermo-catalytic process from CO2 by using MOFs based materials: A mini-review. J. CO2 Util. 2021, 43, 101361. [Google Scholar] [CrossRef]
  10. Mureddu, M.; Lai, S.; Atzori, L.; Rombi, E.; Ferrara, F.; Pettinau, A.; Cutrufello, M.G. Ex-LDH-based catalysts for CO2 conversion to methanol and dimethyl ether. Catalysts 2021, 11, 615. [Google Scholar] [CrossRef]
  11. Duyar, M.S.; Gallo, A.; Regli, S.K.; Snider, J.L.; Singh, J.A.; Valle, E.; McEnaney, J.; Bent, S.F.; Rønning, M.; Jaramillo, T.F. Understanding selectivity in CO2 hydrogenation to methanol for mop nanoparticle catalysts using in situ techniques. Catalysts 2021, 11, 143. [Google Scholar] [CrossRef]
  12. Bibi, M.; Ullah, R.; Sadiq, M.; Sadiq, S.; Khan, I.; Saeed, K.; Zia, M.A.; Iqbal, Z.; Ullah, I.; Iqbal, Z.; et al. Catalytic hydrogenation of carbon dioxide over magnetic nanoparticles: Modification in fixed-bed reactor. Catalysts 2021, 11, 592. [Google Scholar] [CrossRef]
  13. Lu, Z.; Sun, K.; Wang, J.; Zhang, Z.; Liu, C. A Highly Active Au/In2O3-ZrO2 Catalyst for Selective Hydrogenation of CO2 to Methanol. Catalysts 2020, 11, 1360. [Google Scholar] [CrossRef]
  14. Fujita, S.I.; Moribe, S.; Kanamori, Y.; Kakudate, M.; Takezawa, N. Preparation of a coprecipitated Cu/ZnO catalyst for the methanol synthesis from CO2- effects of the calcination and reduction conditions on the catalytic performance. Appl. Catal. A Gen. 2001, 207, 121–128. [Google Scholar] [CrossRef]
  15. Zhang, Y.; Fei, J.; Yu, Y.; Zheng, X. Methanol synthesis from CO2 hydrogenation over Cu based catalyst supported on zirconia modified γ-Al2O3. Energy Convers. Manag. 2006, 47, 3360–3367. [Google Scholar] [CrossRef]
  16. Amin, N.A.S.; Zakaria, Z.Y. Optimization of Oxidative Coupling of Methane Using Response Surface Methodology. J. Teknol. 2012, 39, 35–51. [Google Scholar]
  17. Eze, F.C.; Ngonadi, L. Alphabetic Optimality Criteria for 2K Central Composite Design. App. Math. Sci. 2018, 4, 107–118. [Google Scholar]
  18. Aslan, N. Application of response surface methodology and central composite rotatable design for modeling and optimization of a multi-gravity separator for chromite concentration. Powder Technol. 2008, 185, 80–86. [Google Scholar] [CrossRef]
  19. Box, G.E.P.; Hunter, J.S. Multi-Factor Experimental Designs for Exploring Response Surfaces. Ann. Math. Stat. 1957, 28, 195–241. [Google Scholar] [CrossRef]
  20. Obeng, D.P.; Morrell, S.; Napier-Munn, T.J. Application of central composite rotatable design to modelling the effect of some operating variables on the performance of the three-product cyclone. Int. J. Miner. Process. 2005, 76, 181–192. [Google Scholar] [CrossRef]
  21. Anuar, M.A.M.; Amran, N.A.; Ruslan, M.S.H. Optimization of Progressive Freezing for Residual Oil Recovery from a Palm Oil − Water Mixture (POME Model). ACS Omega 2020, 6, 2707–2716. [Google Scholar] [CrossRef] [PubMed]
  22. Saafie, N.; Samsudin, M.R.; Sufian, S. Optimization of methylene blue adsorption via functionalized activated carbon using response surface methodology with central composite design. Key Eng. Mater. 2020, 841, 220–224. [Google Scholar] [CrossRef]
  23. Tasfy, S.F.H.; Mohd Zabidi, N.A.; Shaharun, M.S.; Subbarao, D. Effect of Mn and Pb Promoters on the Performance of Cu/ZnO-Catalyst in CO2 Hydrogenation to Methanol. Appl. Mech. Mater. 2014, 625, 289–292. [Google Scholar] [CrossRef]
Figure 1. Interaction effects of AB on CO2 conversion.
Catalysts 11 00871 g001
Figure 2. Interaction effects of AC on CO2 conversion.
Catalysts 11 00871 g002
Figure 3. Interaction effects of BC for CO2 conversion.
Catalysts 11 00871 g003
Figure 4. Interaction Effect of AB for methanol selectivity.
Catalysts 11 00871 g004
Figure 5. Interaction Effect of AC for methanol selectivity.
Catalysts 11 00871 g005
Figure 6. Interaction Effect of BC for methanol selectivity.
Catalysts 11 00871 g006
Figure 7. CO2 conversion (a) normal probability plot (b) quality of fit data.
Catalysts 11 00871 g007
Figure 8. Methanol Selectivity (a) normal probability plot (b) quality of fit data.
Catalysts 11 00871 g008
Figure 9. (a) FESEM image (b) Elemental mapping of MNCZAZ catalyst obtained by energy dispersive X-ray(FESEM/EDX).
Catalysts 11 00871 g009
Table 1. Independent variables in Experimental Design.
VariablesUnit Levels
−α
Min
−1
Low
0
Mid
1
High

Max
A: Calcination temperature°C181250350450518
B: Ramping rate°C/min1517.53040
C: Duration (h)h12467
Table 2. Experimental design matrix for MNCZAZ calcination condition.
RunABCResponse 1: XCO2Response 2:
SMEOH
YieldMEOH
135017.5416.0275.8612.15
251817.547.1958.354.19
3450563.3552.391.75
42503065.5525.431.41
5250528.1720.911.70
62503027.9747.593.79
74503027.4363.834.74
835017.515.5547.762.65
9250567.875.570.43
103501415.8168.7710.87
1135017.5413.663.18.58
1235017.5415.97411.76
1335017.5416.017512.00
143504049.6352.545.05
1535017.5416.0476.112.2
1645030611.2837.344.21
1735017.5416.175.112.09
1818117.546.4719.521.26
1935017.577.9124.631.94
20450525.7542.462.44
Table 3. Analysis of variance (ANOVA) for the calcination study of MNCZAZ.
XCO2SMEOH
ModelQuadratic ModelQuadratic Model
Standard deviation1.595.84
R20.930.96
Adjusted R20.870.93
Adequate precision9.7515.36
p-value<0.0001<0.0001
F-value15.3128.86
LOF0.07110.2813
Table 4. Coefficient of regression model and their significance for first response, XCO2.
SourceCoefficient
Estimate
F-ValueProb. > FRemarks
Quadratic model 15.31<0.0001significant
A−0.0520.0150.9063insignificant
B0.380.610.4545insignificant
C0.180.160.6949insignificant
AB1.527.270.0224significant
AC0.520.860.3758insignificant
BC0.520.840.3802insignificant
A2−3.1055.75<0.0001significant
B2−1.8013.410.0044significant
C2−3.9062.38<0.0001significant
Table 5. Coefficient of regression model and their significance for second response, SMEOH.
SourceCoefficient EstimateF-ValueProb. > FRemarks
Quadratic model 28.86<0.0001significant
A11.7955.74<0.0001significant
B4.927.510.0208significant
C−7.1018.480.0016significant
AB−5.035.930.0352significant
AC2.621.610.2336insignificant
BC−5.406.850.0257significant
A2−12.2564.72<0.0001significant
B2−8.4521.840.0009significant
C2−16.6783.45<0.0001significant
Table 6. Optimum conditions for the synthesized catalyst (MNCZAZ).
VariablesUnitsOptimum Conditions
A°C342
B°C/min17.9
Ch4
XCO2 activity, calculated%16.2
XCO2 activity, experimental%15.5
Percentage error, XCO2%4.32
SMEOH activity, calculated%74.7
SMEOH activity, experimental%72.6
Percentage error, SMEOH%2.81
Standard deviation%1.01
Table 7. Elemental Composition of MNCZAZ as measured by XRF.
Weight (%)
CuZnMnNb
11.273.720.050.04
Table 8. Textural properties of catalysts calcined under different conditions.
Temperature
(°C)
Ramping Rate (°C/min)Duration (h)SBET (m2/g)Vp
(cm3/g)
DBJH
(nm)
XCO2 (%)SMeOH (%)
51817.541370.318.97.1958.35
450561430.318.63.3552.39
3501041400.316.215.8168.77
35017.541470.318.116.0275.86
250561230.247.67.875.57
18117.541670.317.46.4719.52
SBET is BET surface area; Vp is pore volume; and DBJH is the BJH pore diameter.
Publisher’s Note: MDPI stays neutral with regard to jurisdictional claims in published maps and institutional affiliations.

