
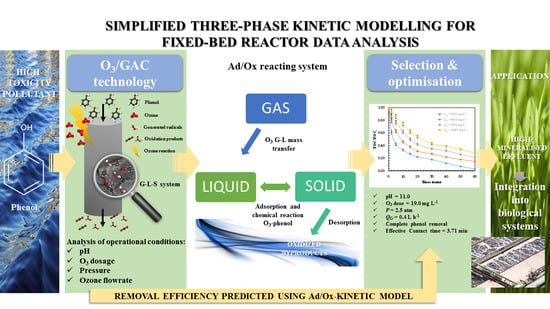
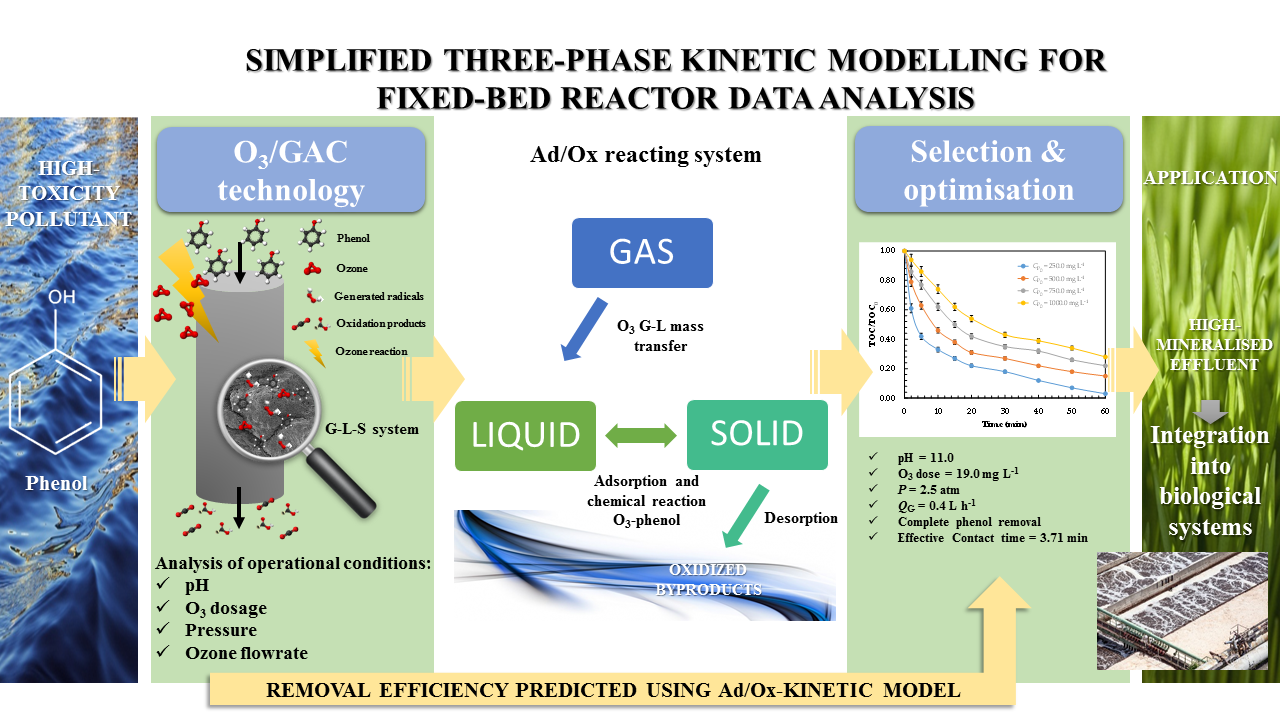
Application of a Combined Adsorption−Ozonation Process for Phenolic Wastewater Treatment in a Continuous Fixed-Bed Reactor

 ,
,  , ,
, ,  and
and
Abstract
1. Introduction
- Homogeneous reaction (at the liquid level):
- Heterogeneous reactions (at the level of the solid):
- Homogeneous propagation and termination reactions:
2. Results and Discussion
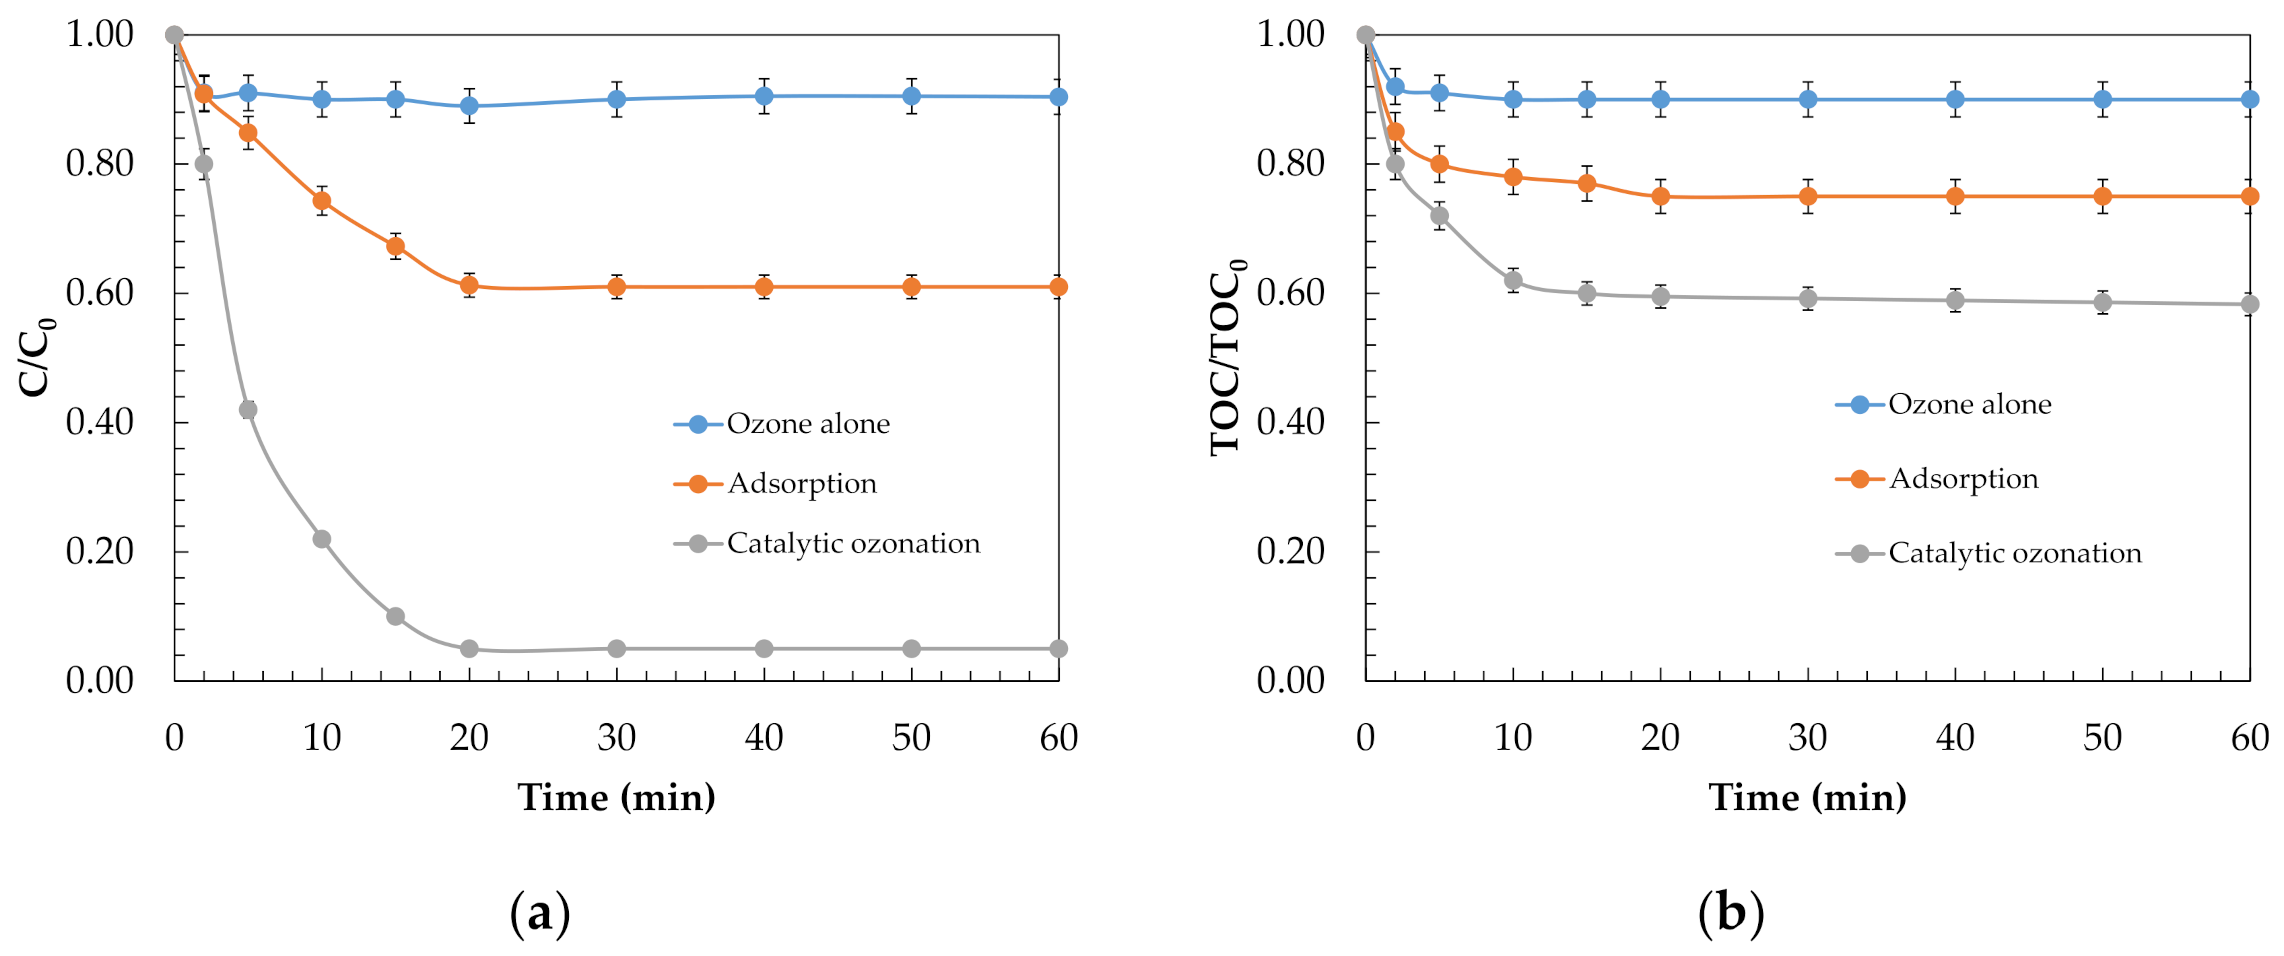
2.1. Removal of Phenol and Mineralisation
2.2. Kinetic Model of the Ad/Ox Process Operated in a Continuous Fixed-Bed Reactor
- The overall oxidation rate of the process is represented by the ozone consumption in the parallel reaction process (both at the liquid and solid level);
- The oxidation rate of the parallel stages, in the liquid phase and on the GAC, were represented by pseudo-first-order kinetics with respect to phenol;
- The GAC was considered a sufficiently porous material, where the diffusion of ozone and phenol into the catalyst particles took place;
- The adsorption kinetics during the Ad/Ox process are represented by a pseudo-second-order kinetic equation (Equation (20));
- The kinetic constant of phenol removal in the solid incorporates the degradation and desorption of organic compounds;
- The degradation kinetics in both liquids and solids, as well as the adsorption, are influenced by the operational conditions of the ozonisation process.
2.3. Determination of the Characteristic Parameters of the Continuous Ad/Ox System
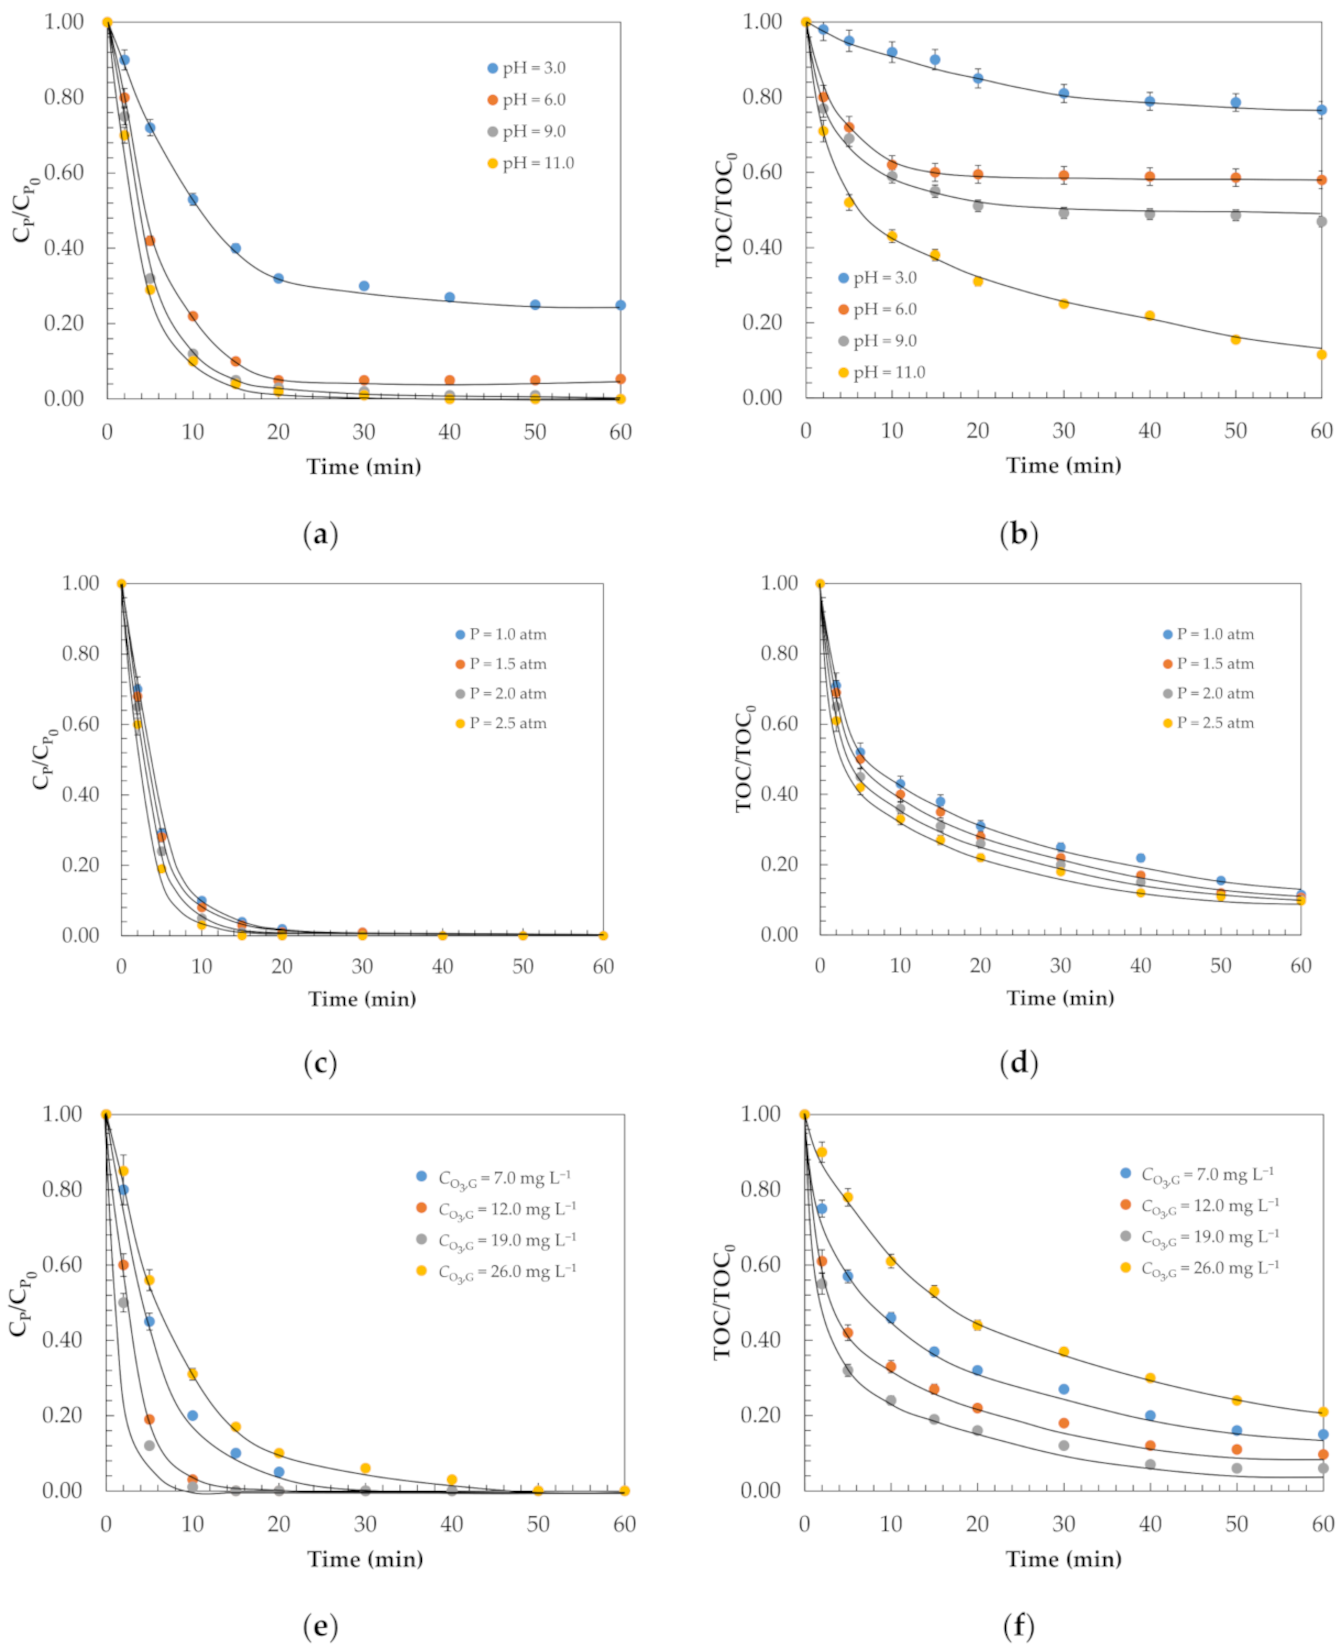
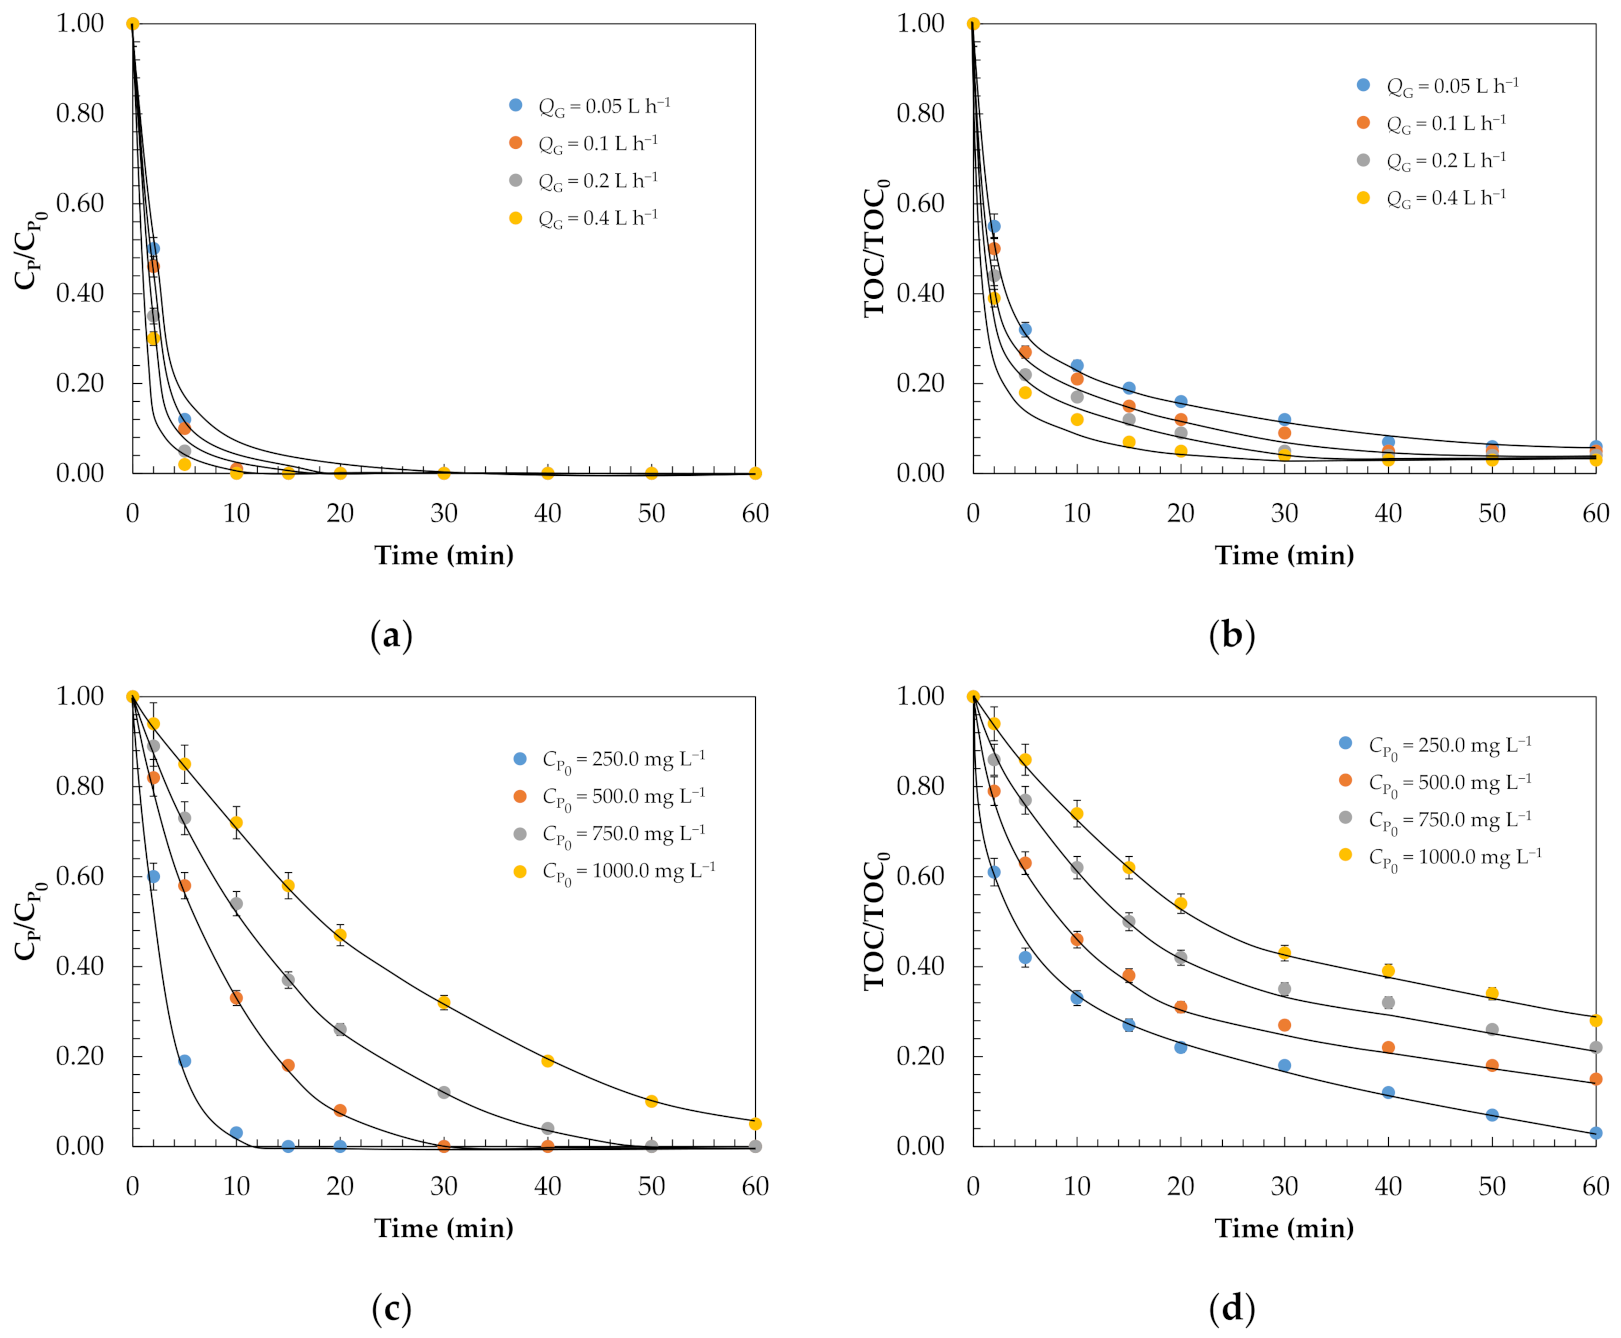
2.4. Effect of Operational Conditions and Kinetic Model Validation
3. Materials and Methods
3.1. Materials
3.2. Analytical Methods
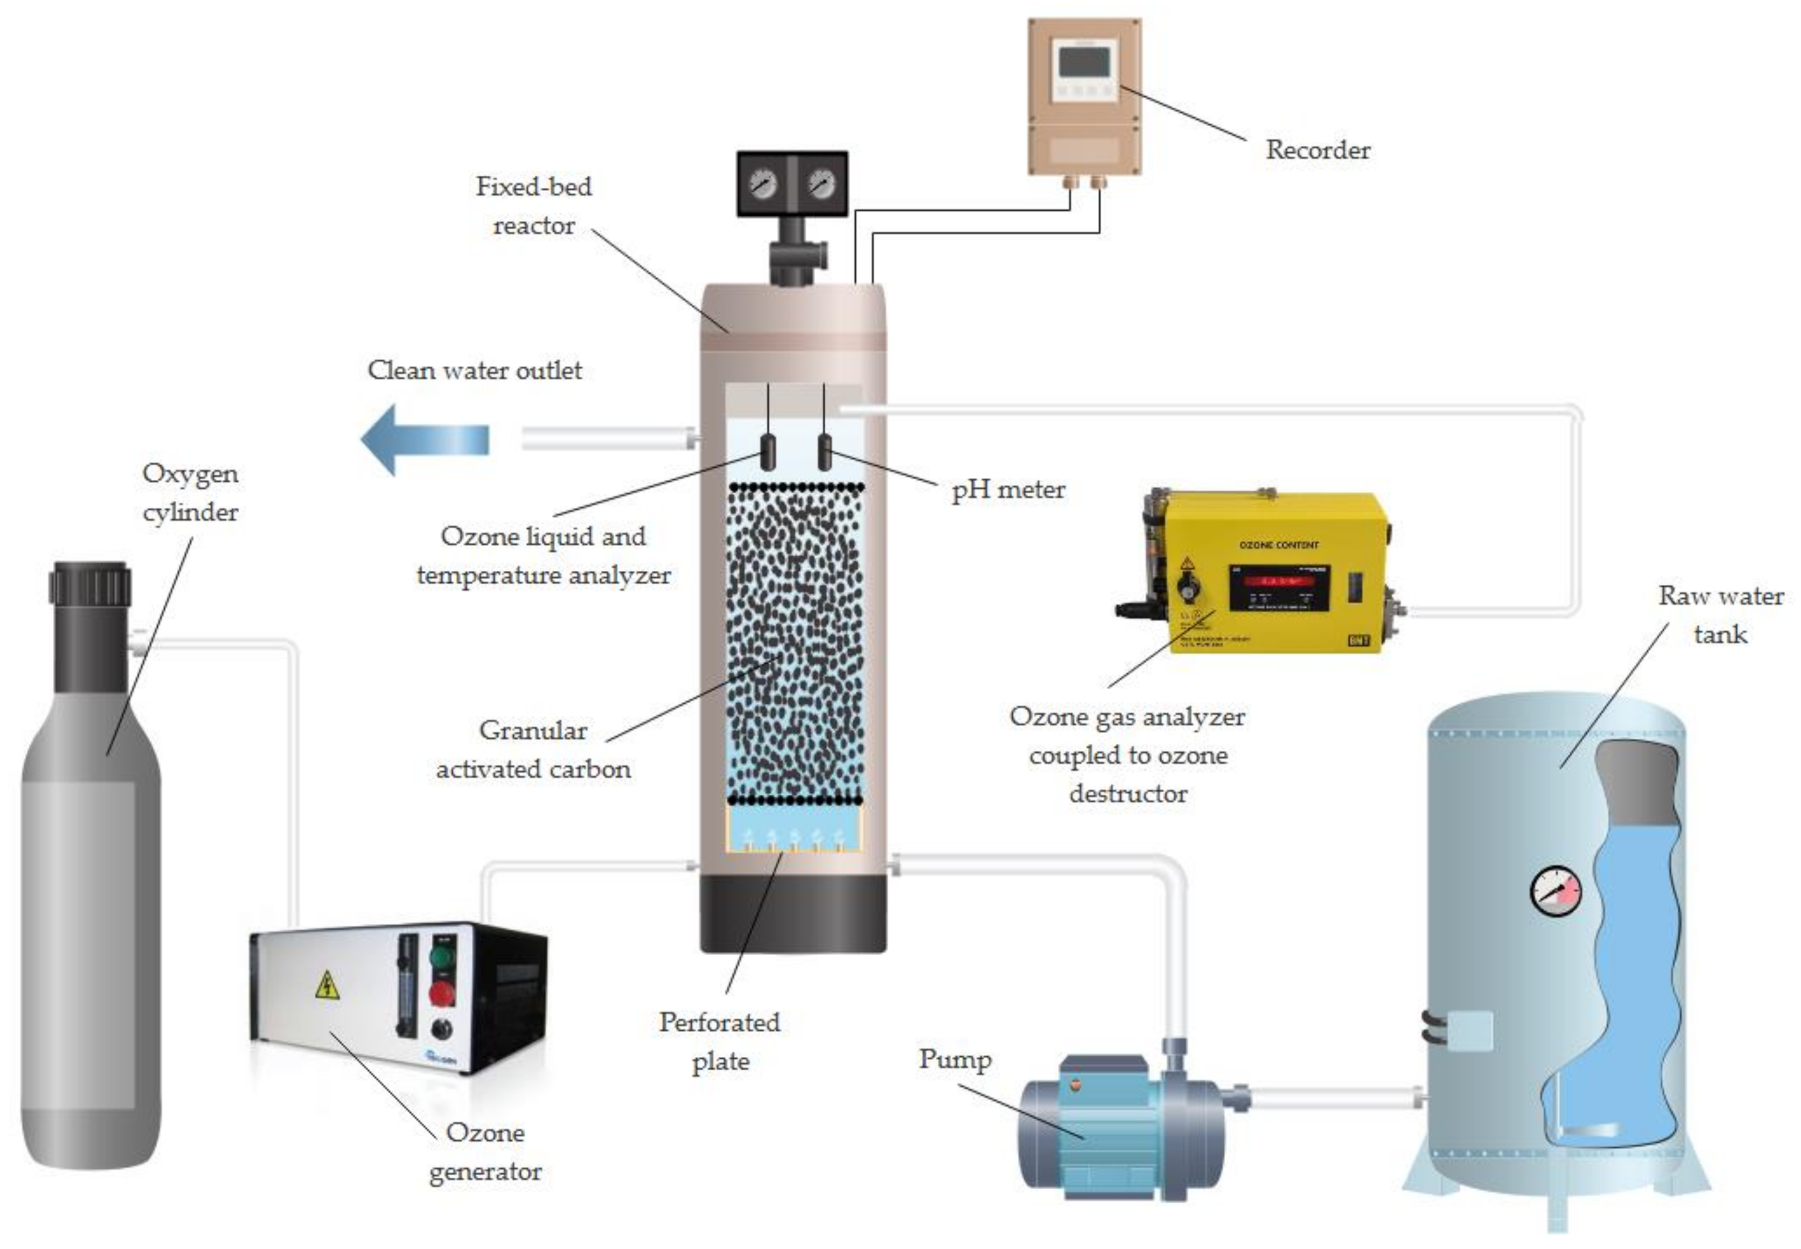
3.3. Experimental Setup in the Continuous Fixed-Bed Catalytic System
3.4. Statistical Analysis
4. Conclusions
Supplementary Materials
Author Contributions
Funding
Acknowledgments
Conflicts of Interest
Nomenclature
| ε | Bed porosity, m3 m−3 |
| ν | Linear velocity of fluid flow, cm min−1 |
| A | Reactor cross-sectional area, cm2 |
| C*O3,L | Concentration of ozone in the equilibrium with the ozone adsorbed on the activated carbon, mg L−1 |
| C*O3,s | Concentration of ozone on the catalyst in equilibrium with the liquid ozone concentration, mg L−1 |
| C*p | Calculated pollutant concentration in the liquid in terms of total organic carbon, mg L−1 |
| Cexp | Experimental pollutant concentration in the liquid, mg L−1 |
| Cmod | Modelled pollutant concentration in the liquid, mg L−1 |
| CO3,G | Concentrations of ozone in the gas phase, mg L−1 |
| CO3,L | Ozone concentration in liquid, mg L−1 |
| Cp | Pollutant concentration in the liquid, mg L−1 |
| DL | Axial dispersion coefficient, cm2 min−1 |
| FG | Ozone mass flow, g O3 h−1 |
| FP | Phenol mass flow, g h−1 |
| He | Henry’s constant, bar L mg−1 |
| k1 | Kinetic oxidation constant of phenol in the liquid, min−1 |
| k2 | Kinetic oxidation constant of phenol in the solid, (mg L−1) (mg g−1 GAC min)−1 |
| kads | Kinetic constant of phenol adsorption, g mg−1 min−1 |
| kc,L | Elemental kinetic constant for the ozonation in the liquid, L mg−1 min−1 |
| kc,S | Elemental kinetic constant for the ozonation in the solid, L mg−1 min−1 |
| KF | Freundlich constant, (mg g−1) (L mg−1)1/n |
| KLa | Volumetric ozone mass transfer coefficient, min−1 |
| kP | Overall kinetic reaction constant referring to the removal of phenol in both the liquid and the solid, min−1 |
| L | Length of tubular reactor, cm |
| m | Slope of the equilibrium line between the liquid and solid phase |
| mCAT | Catalyst’s mass, g |
| MCAT | Concentration of catalyst, g L−1 |
| n | Kinetic reaction order |
| N | Number of experimental values |
| nF | Heterogeneity factor, dimensionless |
| NIIO3 | Ozone consumption in the solid, mg L−1 min−1 |
| NIO3 | Ozone consumption in the liquid, mg L−1 min−1 |
| NO3 | Whole ozone consumption, mg L−1 min−1 |
| P | Pressure, atm |
| P*O3 | Partial pressure of the ozone in equilibrium with the adsorbed ozone on the solid, bar |
| PO3 | Partial pressure of ozone in the gas phase, bar |
| QG | Ozone gas flow, L min−1 |
| QL | Flow rate of liquid through the bed, mL min−1 |
| rO3 | Chemical reaction rate of phenol removal reaction by catalytic ozonation, mg L−1 min−1 |
| rp | Degradation of the pollutant in the liquid, mg L−1 min−1 |
| RSE | Relative standard deviation, % |
| t | Time, min |
| V | Reactor volume, L |
| z | Stoichiometric coefficient of the reaction between phenol and ozone |
| Zp | Concentration of pollutant in the solid, mg g−1 |
| Zp,∞ | Amount of pollutant adsorbed in the solid in equilibrium, mg g−1 |
References
- Akadiri, S.S.; Alola, A.A.; Alola, U.V.; Nwambe, C.S. The role of ecological footprint and the changes in degree days on environmental sustainability in the USA. Environ. Sci. Pollut. Res. 2020, 27, 24929–24938. [Google Scholar] [CrossRef]
- Aitken, D.; Rivera, D.; Godoy-Faúndez, A.; Holzapfel, E. Water Scarcity and the Impact of the Mining and Agricultural Sectors in Chile. Sustainability 2016, 8, 128. [Google Scholar] [CrossRef]
- Electronic Code of Federal Regulations (eCFR). Available online: https://www.ecfr.gov/ (accessed on 27 April 2021).
- European Comission. Directive 2000/60/EC of the European Parliament and of the Council of 23 October 2000 Establishing a Framework for Community Action in the Field of Water Policy. Official Journal 2000, 327, 00001–0073. Available online: data.europa.eu/eli/dir/2000/60/oj (accessed on 22 December 2000).
- United Nations About the Sustainable Development Goals. Available online: https://www.un.org/sustainabledevelopment/sustainable-development-goals/ (accessed on 7 February 2020).
- de Arruda Guelli Ulson de Souza, S.M.; de Souza, F.B.; Ulson de Souza, A.A. Application of Individual and Simultaneous Ozonation and Adsorption Processes in Batch and Fixed-Bed Reactors for Phenol Removal. Ozone Sci. Eng. 2012, 34, 259–268. [Google Scholar] [CrossRef]
- US EPA. Contaminant Candidate List 4-CCL 4. Available online: https://www.epa.gov/ccl/contaminant-candidate-list-4-ccl-4-0 (accessed on 9 October 2018).
- Babich, H.; Davis, D.L. Phenol: A review of environmental and health risks. Regul. Toxicol. Pharmacol. 1981, 1, 90–109. [Google Scholar] [CrossRef]
- Ribeiro, H.B.; Bampi, J.; da Silva, T.C.; Dervanoski, A.; Milanesi, P.M.; Fuzinatto, C.F.; de Mello, J.M.M.; da Luz, C.; Vargas, G.D.L.P. Study of phenol biodegradation in different agitation systems and fixed bed column: Experimental, mathematical modeling, and numerical simulation. Environ. Sci. Pollut. Res. 2020, 27, 45250–45269. [Google Scholar] [CrossRef]
- Esplugas, S.; Giménez, J.; Contreras, S.; Pascual, E.; Rodríguez, M. Comparison of different advanced oxidation processes for phenol degradation. Water Res. 2002, 36, 1034–1042. [Google Scholar] [CrossRef]
- Sumalatha, B.; Narayana, A.V.; Kumar, K.K.; Babu, D.J.; Venkateswarulu, T.C. Phenol Removal from Industrial Effluent Using Emulsion Liquid Memebranes. J. Pharm. Sci. Res. 2016, 8, 307–312. [Google Scholar]
- Chen, L.; Xu, Y.; Sun, Y. Combination of Coagulation and Ozone Catalytic Oxidation for Pretreating Coking Wastewater. Int. J. Environ. Res. Public Health 2019, 16, 1705. [Google Scholar] [CrossRef]
- Pradeep, N.V.; Anupama, S.; Navya, K.; Shalini, H.N.; Idris, M.; Hampannavar, U.S. Biological removal of phenol from wastewaters: A mini review. Appl. Water Sci. 2015, 5, 105–112. [Google Scholar] [CrossRef]
- Klibanov, A.M.; Tu, T.M.; Scott, K.P. Peroxidase-catalyzed removal of phenols from coal-conversion waste waters. Science 1983, 221, 259–261. [Google Scholar] [CrossRef]
- Bevilaqua, J.V.; Cammarota, M.C.; Freire, D.M.G.; Sant’Anna Jr., G.L. Phenol removal through combined biological and enzymatic treatments. Braz. J. Chem. Eng. 2002, 19, 151–158. [Google Scholar] [CrossRef]
- De Luis, A.M.; Lombraña, J.I.; Menéndez, A.; Sanz, J. Analysis of the Toxicity of Phenol Solutions Treated with H2O2/UV and H2O2/Fe Oxidative Systems. Ind. Eng. Chem. Res. 2011, 50, 1928–1937. [Google Scholar] [CrossRef]
- Ferreiro, C.; Villota, N.; de Luis, A.; Lombrana, J.I. Analysis of the effect of the operational variants in a combined adsorption-ozonation process with granular activated carbon for the treatment of phenol wastewater. React. Chem. Eng. 2020, 5, 760–778. [Google Scholar] [CrossRef]
- Salvestrini, S.; Fenti, A.; Chianese, S.; Iovino, P.; Musmarra, D. Diclofenac sorption from synthetic water: Kinetic and thermodynamic analysis. J. Environ. Chem. Eng. 2020, 8, 104105. [Google Scholar] [CrossRef]
- Erto, A.; Chianese, S.; Lancia, A.; Musmarra, D. On the mechanism of benzene and toluene adsorption in single-compound and binary systems: Energetic interactions and competitive effects. Desalin. Water Treat. 2017, 86, 259–265. [Google Scholar] [CrossRef]
- Rout, P.R.; Zhang, T.C.; Bhunia, P.; Surampalli, R.Y. Treatment technologies for emerging contaminants in wastewater treatment plants: A review. Sci. Total Environ. 2021, 753, 141990. [Google Scholar] [CrossRef] [PubMed]
- Rathi, B.S.; Kumar, P.S.; Show, P.-L. A review on effective removal of emerging contaminants from aquatic systems: Current trends and scope for further research. J. Hazard. Mater. 2021, 409, 124413. [Google Scholar] [CrossRef]
- Von Sonntag, C.; Von Gunten, U. Chemistry of Ozone in Water and Wastewater Treatment: From Basic Principles to Applications; Iwa Publishing: London, UK, 2012; ISBN 978-1-84339-313-9. [Google Scholar]
- Jamshidi, N.; Torabian, A.; Azimi, A.; Ghadimkhani, A. Degradation of Phenol in Aqueous Solution by Advanced Oxidation Process. Asian J. Chem. 2009, 21, 673–681. [Google Scholar]
- Ferreiro, C.; Villota, N.; Lombraña, J.I.; Rivero, M.J. Heterogeneous Catalytic Ozonation of Aniline-Contaminated Waters: A Three-Phase Modelling Approach Using TiO2/GAC. Water 2020, 12, 3448. [Google Scholar] [CrossRef]
- Ameta, S. Advanced Oxidation Processes for Wastewater Treatment: Emerging Green Chemical Technology; Elsevier Science: San Diego, CA, USA, 2018; ISBN 978-0-12-810499-6. [Google Scholar]
- Beltran, F.J. Ozone Reaction Kinetics for Water and Wastewater Systems; CRC Press: Boca Raton, FL, USA, 2003; ISBN 978-0-203-50917-3. [Google Scholar]
- Rodríguez, A.; Rosal, R.; Perdigón-Melón, J.A.; Mezcua, M.; Agüera, A.; Hernando, M.D.; Letón, P.; Fernández-Alba, A.R.; García-Calvo, E. Ozone-Based Technologies in Water and Wastewater Treatment. In Emerging Contaminants from Industrial and Municipal Waste; Barceló, D., Petrovic, M., Eds.; Springer: Berlin/Heidelberg, Germany, 2008; Volume 5S/2, pp. 127–175. ISBN 978-3-540-79209-3. [Google Scholar]
- Nawrocki, J. Catalytic ozonation in water: Controversies and questions. Discussion paper. Appl. Catal. B Environ. 2013, 142–143, 465–471. [Google Scholar] [CrossRef]
- Nawrocki, J.; Kasprzyk-Hordern, B. The efficiency and mechanisms of catalytic ozonation. Appl. Catal. B Environ. 2010, 99, 27–42. [Google Scholar] [CrossRef]
- Guo, Y.; Yang, L.; Wang, X. The Application and Reaction Mechanism of Catalytic Ozonation in Water Treatment. J. Environ. Anal. Toxicol. 2012, 2, 2161–0525. [Google Scholar] [CrossRef]
- Criegee, R. Mechanism of Ozonolysis. Angew. Chem. Int. Ed. Engl. 1975, 14, 745–752. [Google Scholar] [CrossRef]
- Lin, S.H.; Wang, C.H. Ozonation of phenolic wastewater in a gas-induced reactor with a fixed granular activated carbon bed. Ind. Eng. Chem. Res. 2003, 42, 1648–1653. [Google Scholar] [CrossRef]
- Xiong, W.; Chen, N.; Feng, C.; Liu, Y.; Ma, N.; Deng, J.; Xing, L.; Gao, Y. Ozonation catalyzed by iron—and/or manganese—supported granular activated carbons for the treatment of phenol. Environ. Sci. Pollut. Res. Int. 2019, 26, 21022–21033. [Google Scholar] [CrossRef]
- Shukla, S.; Kisku, G. Linear and Non-Linear Kinetic Modeling for Adsorption of Disperse Dye in Batch Process. Res. J. Environ. Toxicol. 2015, 9, 320–331. [Google Scholar] [CrossRef]
- Ferreiro, C.; Gómez-Motos, I.; Lombraña, J.I.; de Luis, A.; Villota, N.; Ros, O.; Etxebarria, N. Contaminants of Emerging Concern Removal in an Effluent of Wastewater Treatment Plant under Biological and Continuous Mode Ultrafiltration Treatment. Sustainability 2020, 12, 725. [Google Scholar] [CrossRef]
- Alhamed, Y.A. Adsorption kinetics and performance of packed bed adsorber for phenol removal using activated carbon from dates’ stones. J. Hazard. Mater. 2009, 170, 763–770. [Google Scholar] [CrossRef]
- Rodriguez, C.; Lombrana, J.I.; de Luis, A.; Sanz, J. Oxidizing efficiency analysis of an ozonation process to degrade the dye rhodamine 6G. J. Chem. Technol. Biotechnol. 2017, 92, 656–665. [Google Scholar] [CrossRef]
- Gottschalk, C.; Saupe, A.; Libra, J.A. Ozonation of Water and Waste Water: A practical Guide to Understanding Ozone and Its Application; Wiley-VCH: Weinheim, Germany, 2010. [Google Scholar] [CrossRef]
- Chaichanawong, J.; Yamamoto, T.; Ohmori, T. Enhancement effect of carbon adsorbent on ozonation of aqueous phenol. J. Hazard. Mater. 2010, 175, 673–679. [Google Scholar] [CrossRef] [PubMed]
- Ferreiro, C.; Villota, N.; Lombraña, J.I.; Rivero, M.J.; Zúñiga, V.; Rituerto, J.M. Analysis of a Hybrid Suspended-Supported Photocatalytic Reactor for the Treatment of Wastewater Containing Benzothiazole and Aniline. Water 2019, 11, 337. [Google Scholar] [CrossRef]
- Rekhate, C.V.; Srivastava, J.K. Recent advances in ozone-based advanced oxidation processes for treatment of wastewater—A review. Chem. Eng. J. Adv. 2020, 3, 100031. [Google Scholar] [CrossRef]
- Chand, R.; Molina, R.; Johnson, I.; Hans, A.; Bremner, D.H. Activated carbon cloth: A potential adsorbing/oxidizing catalyst for phenolic wastewater. Water Sci. Technol. J. Int. Assoc. Water Pollut. Res. 2010, 61, 2817–2823. [Google Scholar] [CrossRef]
- Beltrán, F.J.; Rivas, F.J.; Montero-de-Espinosa, R. Mineralization improvement of phenol aqueous solutions through heteroeneous catalytic ozonation. J. Chem. Technol. Biotechnol. 2003, 78, 1225–1233. [Google Scholar] [CrossRef]
- Byun, S.; Cho, S.H.; Yoon, J.; Geissen, S.U.; Vogelpohl, A.; Kim, S.M. Influence of mass transfer on the ozonation of wastewater from the glass fiber industry. Water Sci. Technol. J. Int. Assoc. Water Pollut. Res. 2004, 49, 31–36. [Google Scholar] [CrossRef][Green Version]
- Rosen, H.M. Use of Ozone and Oxygen in Advanced Wastewater Treatment. J. Water Pollut. Control Fed. 1973, 45, 2521–2536. [Google Scholar]
- Buhler, R.; Staehelin, J.; Hoigne, J. Ozone Decomposition in Water Studied by Pulse-Radiolysis 1. HO2/O2− and HO3/O3− as Intermediates. J. Phys. Chem. 1984, 88, 2560–2564. [Google Scholar] [CrossRef]
- Nawaz, F.; Cao, H.; Xie, Y.; Xiao, J.; Chen, Y.; Ghazi, Z.A. Selection of active phase of MnO2 for catalytic ozonation of 4-nitrophenol. Chemosphere 2017, 168, 1457–1466. [Google Scholar] [CrossRef]
- Yang, L.; Sheng, M.; Li, Y.; Xue, W.; Li, K.; Cao, G. A hybrid process of Fe-based catalytic ozonation and biodegradation for the treatment of industrial wastewater reverse osmosis concentrate. Chemosphere 2020, 238, 124639. [Google Scholar] [CrossRef] [PubMed]
- Hu, E.; Wu, X.; Shang, S.; Tao, X.; Jiang, S.; Gan, L. Catalytic ozonation of simulated textile dyeing wastewater using mesoporous carbon aerogel supported copper oxide catalyst. J. Clean. Prod. 2016, 112, 4710–4718. [Google Scholar] [CrossRef]
- Lin, S.H.; Wang, C.H. Adsorption and catalytic oxidation of phenol in a new ozone reactor. Environ. Technol. 2003, 24, 1031–1039. [Google Scholar] [CrossRef] [PubMed]
- Ribao, P.; Rivero, M.J.; Ortiz, I. TiO2 structures doped with noble metals and/or graphene oxide to improve the photocatalytic degradation of dichloroacetic acid. Environ. Sci. Pollut. Res. Int. 2017, 24, 12628–12637. [Google Scholar] [CrossRef]
- Kaledin, L.A.; Tepper, F.; Kaledin, T.G. Pristine point of zero charge (p.p.z.c.) and zeta potentials of boehmite’s nanolayer and nanofiber surfaces. Int. J. Smart Nano Mater. 2016, 7, 1–21. [Google Scholar] [CrossRef]
- Wu, C.; Liu, X.; Wei, D.; Fan, J.; Wang, L. Photosonochemical degradation of Phenol in water. Water Res. 2001, 35, 3927–3933. [Google Scholar] [CrossRef]
- Association, A.P.H. Standard Methods for the Examination of Water and Wastewater; American Public Health Association: Washington, DC, USA, 2005; ISBN 978-0-87553-047-5. [Google Scholar]
- Alfonso-Muniozguren, P.; Ferreiro, C.; Richard, E.; Bussemaker, M.; Lombraña, J.I.; Lee, J. Analysis of Ultrasonic Pre-treatment for the Ozonation of Humic Acids. Ultrason. Sonochem. 2020, 71, 105359. [Google Scholar] [CrossRef]
- Sanchez, M.; Rivero, M.J.; Ortiz, I. Kinetics of dodecylbenzenesulphonate mineralisation by TiO2 photocatalysis. Appl. Catal. B Environ. 2011, 101, 515–521. [Google Scholar] [CrossRef]


| pH = 3.0 | pH = 6.0 | pH = 9.0 | pH = 11.0 | |
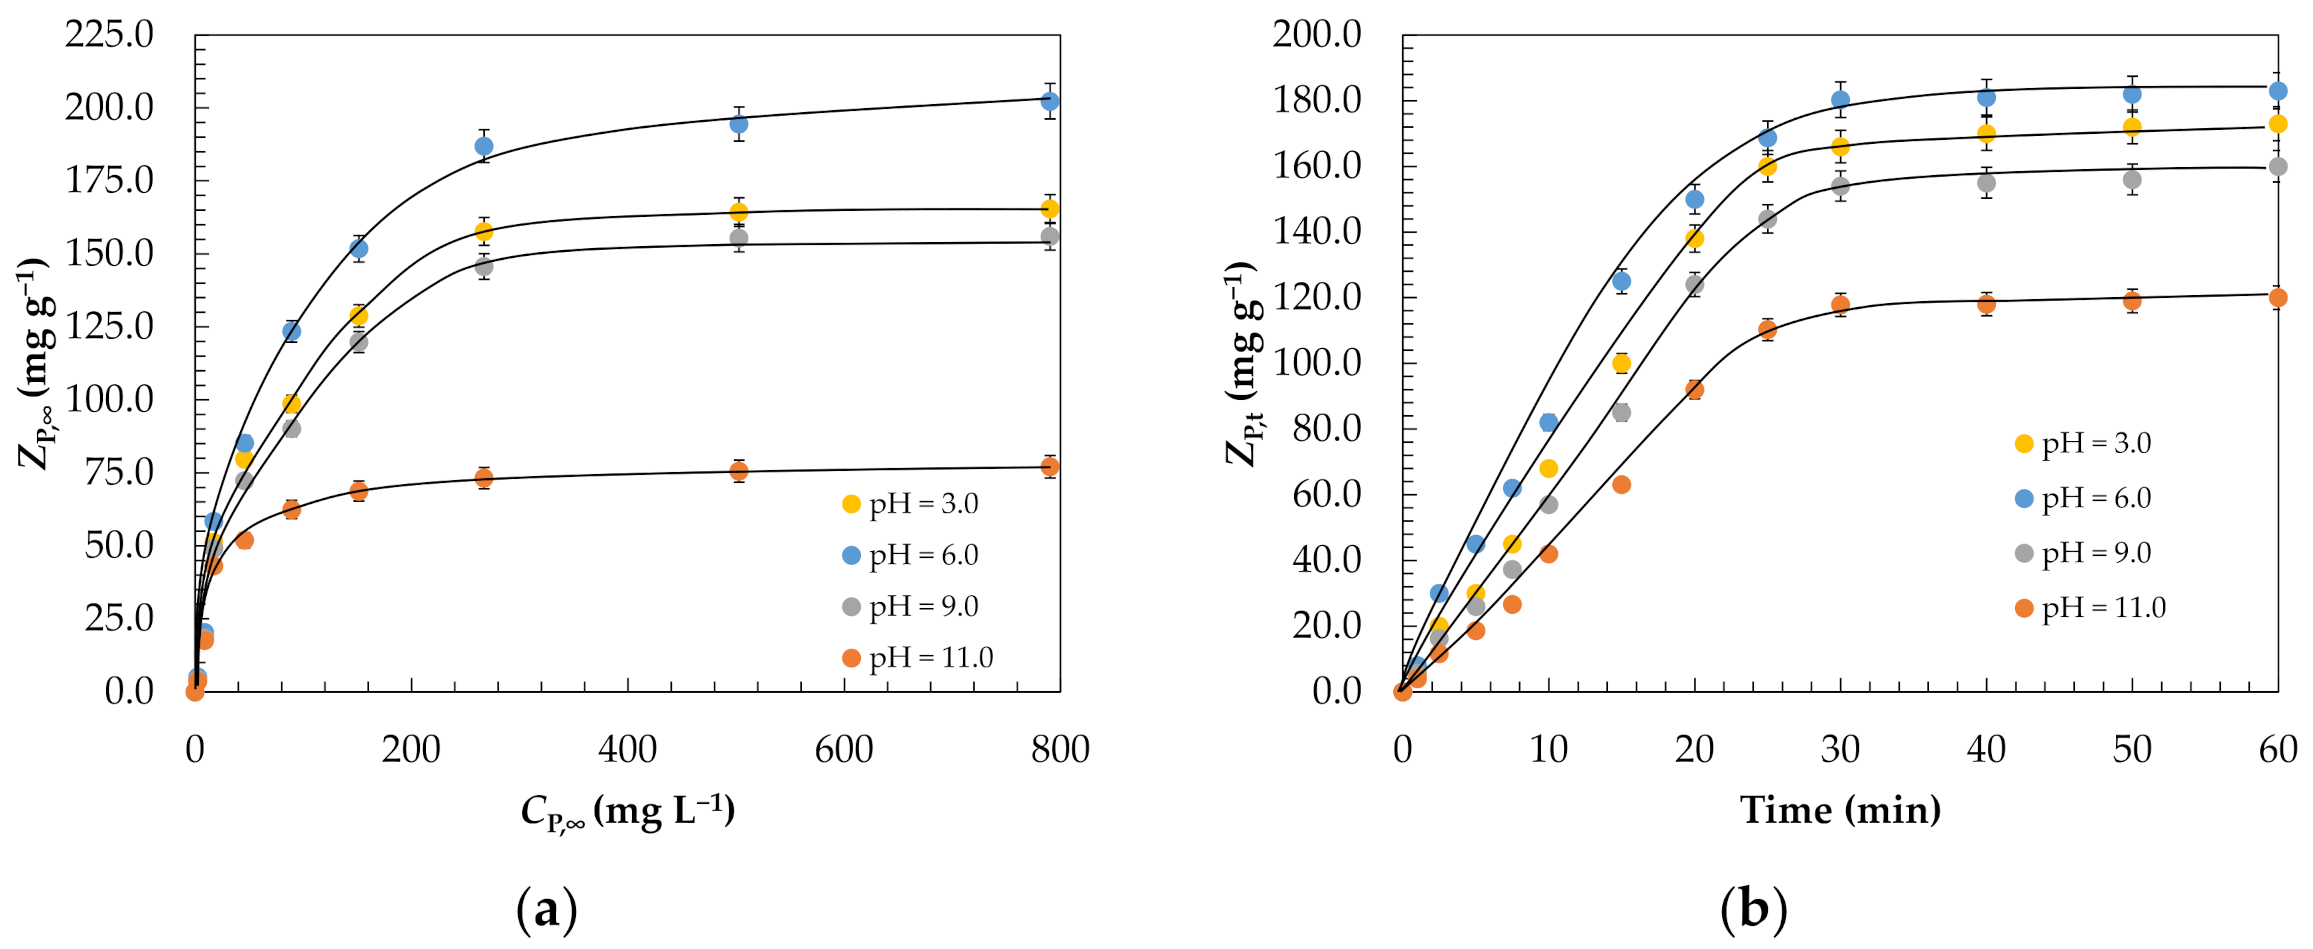
| Equilibrium | ||||
| KF, (mg g−1) (L mg−1)1/nF | 1.89 | 2.01 | 1.82 | 1.49 |
| nF | 1.12 | 1.19 | 1.10 | 1.06 |
| R2 | 0.981 | 0.995 | 0.984 | 0.991 |
| Kinetic | ||||
| kads, g mg−1 min−1 | 2.77 × 10⁻⁴ | 3.10 × 10⁻⁴ | 2.52 × 10⁻⁴ | 4.85 × 10⁻⁵ |
| R2 | 0.992 | 0.987 | 0.996 | 0.993 |
| Parameter/Evolution | Effect of pH 1 | |||
|---|---|---|---|---|
| pH = 3.0 | pH = 6.0 | pH = 9.0 | pH = 11.0 | |
| Phenol removal | ||||
| k1 (min−1) | 0.05 | 0.09 | 0.12 | 0.20 |
| k2 × 103 (mg L−1)(mg g−1 GAC min)−1 | 3.8 | 4.6 | 3.7 | 2.1 |
| RSE (%) | 4.5 | 5.3 | 5.0 | 4.8 |
| Mineralisation | ||||
| k1 × 101 (min−1) | 0.009 | 0.017 | 0.022 | 0.038 |
| k2 × 104 (mg L−1)(mg g−1 GAC min)−1 | 0.71 | 0.86 | 0.69 | 0.39 |
| RSE (%) | 3.7 | 4.1 | 3.9 | 4.4 |
| Effect of pressure 2 | ||||
| P = 1.0 atm | P = 1.5 atm | P = 2.0 atm | P = 2.5 atm | |
| Phenol removal | ||||
| k1 (min−1) | 0.20 | 0.21 | 0.22 | 0.23 |
| k2 × 103 (mg L−1)(mg g−1 GAC min)−1 | 2.1 | 2.1 | 2.1 | 2.2 |
| RSE (%) | 4.1 | 4.6 | 4.0 | 5.2 |
| Mineralisation | ||||
| k1 × 101 (min−1) | 0.038 | 0.039 | 0.041 | 0.044 |
| k2 × 104 (mg L−1)(mg g−1 GAC min)−1 | 0.39 | 0.39 | 0.39 | 0.42 |
| RSE (%) | 4.5 | 4.2 | 4.7 | 4.3 |
| Effect of ozone gas concentration 3 | ||||
| CO3,G = 7.0 mg L−1 | CO3,G = 12.0 mg L−1 | CO3,G = 19.0 mg L−1 | CO3,G = 26.0 mg L−1 | |
| Phenol removal | ||||
| k1 (min−1) | 0.19 | 0.23 | 0.24 | 0.15 |
| k2 × 103 (mg L−1)(mg g−1 GAC min)−1 | 2.0 | 2.2 | 2.4 | 1.8 |
| RSE (%) | 5.3 | 4.9 | 4.9 | 5.1 |
| Mineralisation | ||||
| k1 × 101 (min−1) | 0.036 | 0.044 | 0.045 | 0.028 |
| k2 × 104 (mg L−1)(mg g−1 GAC min)−1 | 0.37 | 0.42 | 0.45 | 0.34 |
| RSE (%) | 4.8 | 4.2 | 4.6 | 4.7 |
| Effect of ozone flow rate 4 | ||||
| QG = 0.05 L h−1 | QG = 0.1 L h−1 | QG = 0.2 L h−1 | QG = 0.4 L h−1 | |
| Phenol removal | ||||
| k1 (min−1) | 0.24 | 0.25 | 0.26 | 0.27 |
| k2 × 103 (mg L−1)(mg g−1 GAC min)−1 | 2.4 | 2.4 | 2.5 | 2.5 |
| RSE (%) | 4.7 | 4.9 | 4.4 | 4.2 |
| Mineralisation | ||||
| k1 × 101 (min−1) | 0.045 | 0.047 | 0.049 | 0.051 |
| k2 × 104 (mg L−1)(mg g−1 GAC min)−1 | 0.45 | 0.45 | 0.47 | 0.47 |
| RSE (%) | 5.0 | 4.4 | 4.8 | 4.3 |
| Effect of initial phenol concentration 5 | ||||
| CP0 = 250.0 mg L−1 | CP0 = 500.0 mg L−1 | CP0 = 750.0 mg L−1 | CP0 = 1000.0 mg L−1 | |
| Phenol removal | ||||
| k1 (min−1) | 0.27 | 0.19 | 0.17 | 0.16 |
| k2 ×103 (mg L−1)(mg g−1 GAC min)−1 | 2.5 | 2.7 | 3.0 | 3.2 |
| RSE (%) | 4.0 | 4.3 | 4.8 | 4.5 |
| Mineralisation | ||||
| k1 × 101 (min−1) | 0.051 | 0.036 | 0.031 | 0.030 |
| k2 × 104 (mg L−1)(mg g−1 GAC min)−1 | 0.47 | 0.51 | 0.56 | 0.60 |
| RSE (%) | 4.2 | 4.6 | 3.9 | 4.4 |
| Property | Kemisorb® 530 |
|---|---|
| SBET (m2 g−1) | 961.5 |
| Sext (m2 g−1) | 410.4 |
| VT (cm3 g−1) | 0.38 |
| Vmicro (cm3 g−1) | 0.24 |
| Vmeso (cm3 g−1) | 0.14 |
| Vmeso/VT (%) | 36.8 |
| Vmicro/VT (%) | 63.2 |
| DP (Å) | 27.9 |
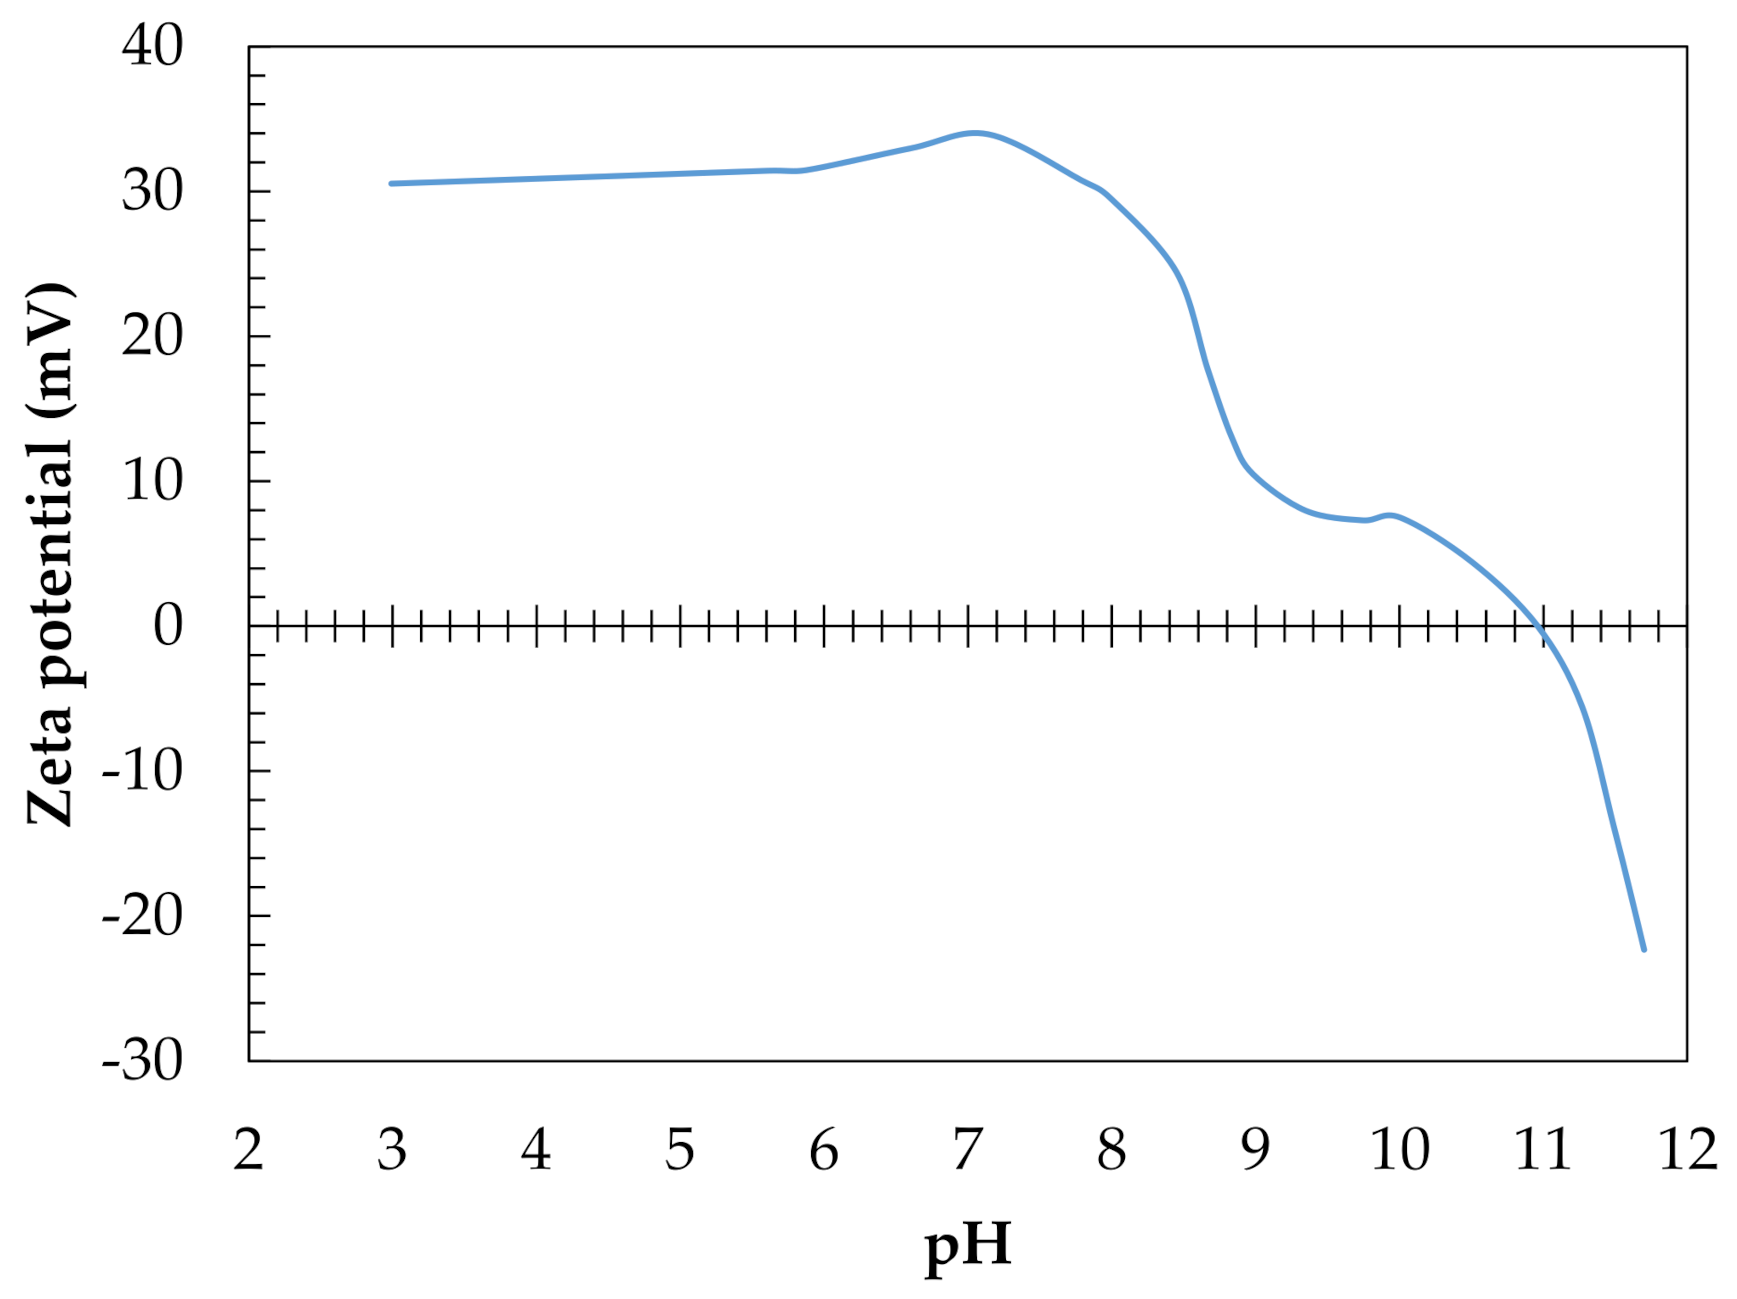
| pHpzc | 10.95 |
| Ash (%) | 11.99 |
| Apparent density (kg m−3) | 432.1 |
Publisher’s Note: MDPI stays neutral with regard to jurisdictional claims in published maps and institutional affiliations. |
© 2021 by the authors. Licensee MDPI, Basel, Switzerland. This article is an open access article distributed under the terms and conditions of the Creative Commons Attribution (CC BY) license (https://creativecommons.org/licenses/by/4.0/).
Share and Cite
Ferreiro, C.; de Luis, A.; Villota, N.; Lomas, J.M.; Lombraña, J.I.; Camarero, L.M. Application of a Combined Adsorption−Ozonation Process for Phenolic Wastewater Treatment in a Continuous Fixed-Bed Reactor. Catalysts 2021, 11, 1014. https://doi.org/10.3390/catal11081014
Ferreiro C, de Luis A, Villota N, Lomas JM, Lombraña JI, Camarero LM. Application of a Combined Adsorption−Ozonation Process for Phenolic Wastewater Treatment in a Continuous Fixed-Bed Reactor. Catalysts. 2021; 11(8):1014. https://doi.org/10.3390/catal11081014
Chicago/Turabian StyleFerreiro, Cristian, Ana de Luis, Natalia Villota, Jose María Lomas, José Ignacio Lombraña, and Luis Miguel Camarero. 2021. "Application of a Combined Adsorption−Ozonation Process for Phenolic Wastewater Treatment in a Continuous Fixed-Bed Reactor" Catalysts 11, no. 8: 1014. https://doi.org/10.3390/catal11081014
APA StyleFerreiro, C., de Luis, A., Villota, N., Lomas, J. M., Lombraña, J. I., & Camarero, L. M. (2021). Application of a Combined Adsorption−Ozonation Process for Phenolic Wastewater Treatment in a Continuous Fixed-Bed Reactor. Catalysts, 11(8), 1014. https://doi.org/10.3390/catal11081014