
High Efficient and Cost Effective Titanium Doped Tin Dioxide Based Photocatalysts Synthesized via Co-precipitation Approach

 ,
,  ,
,
Abstract
:1. Introduction
2. Results
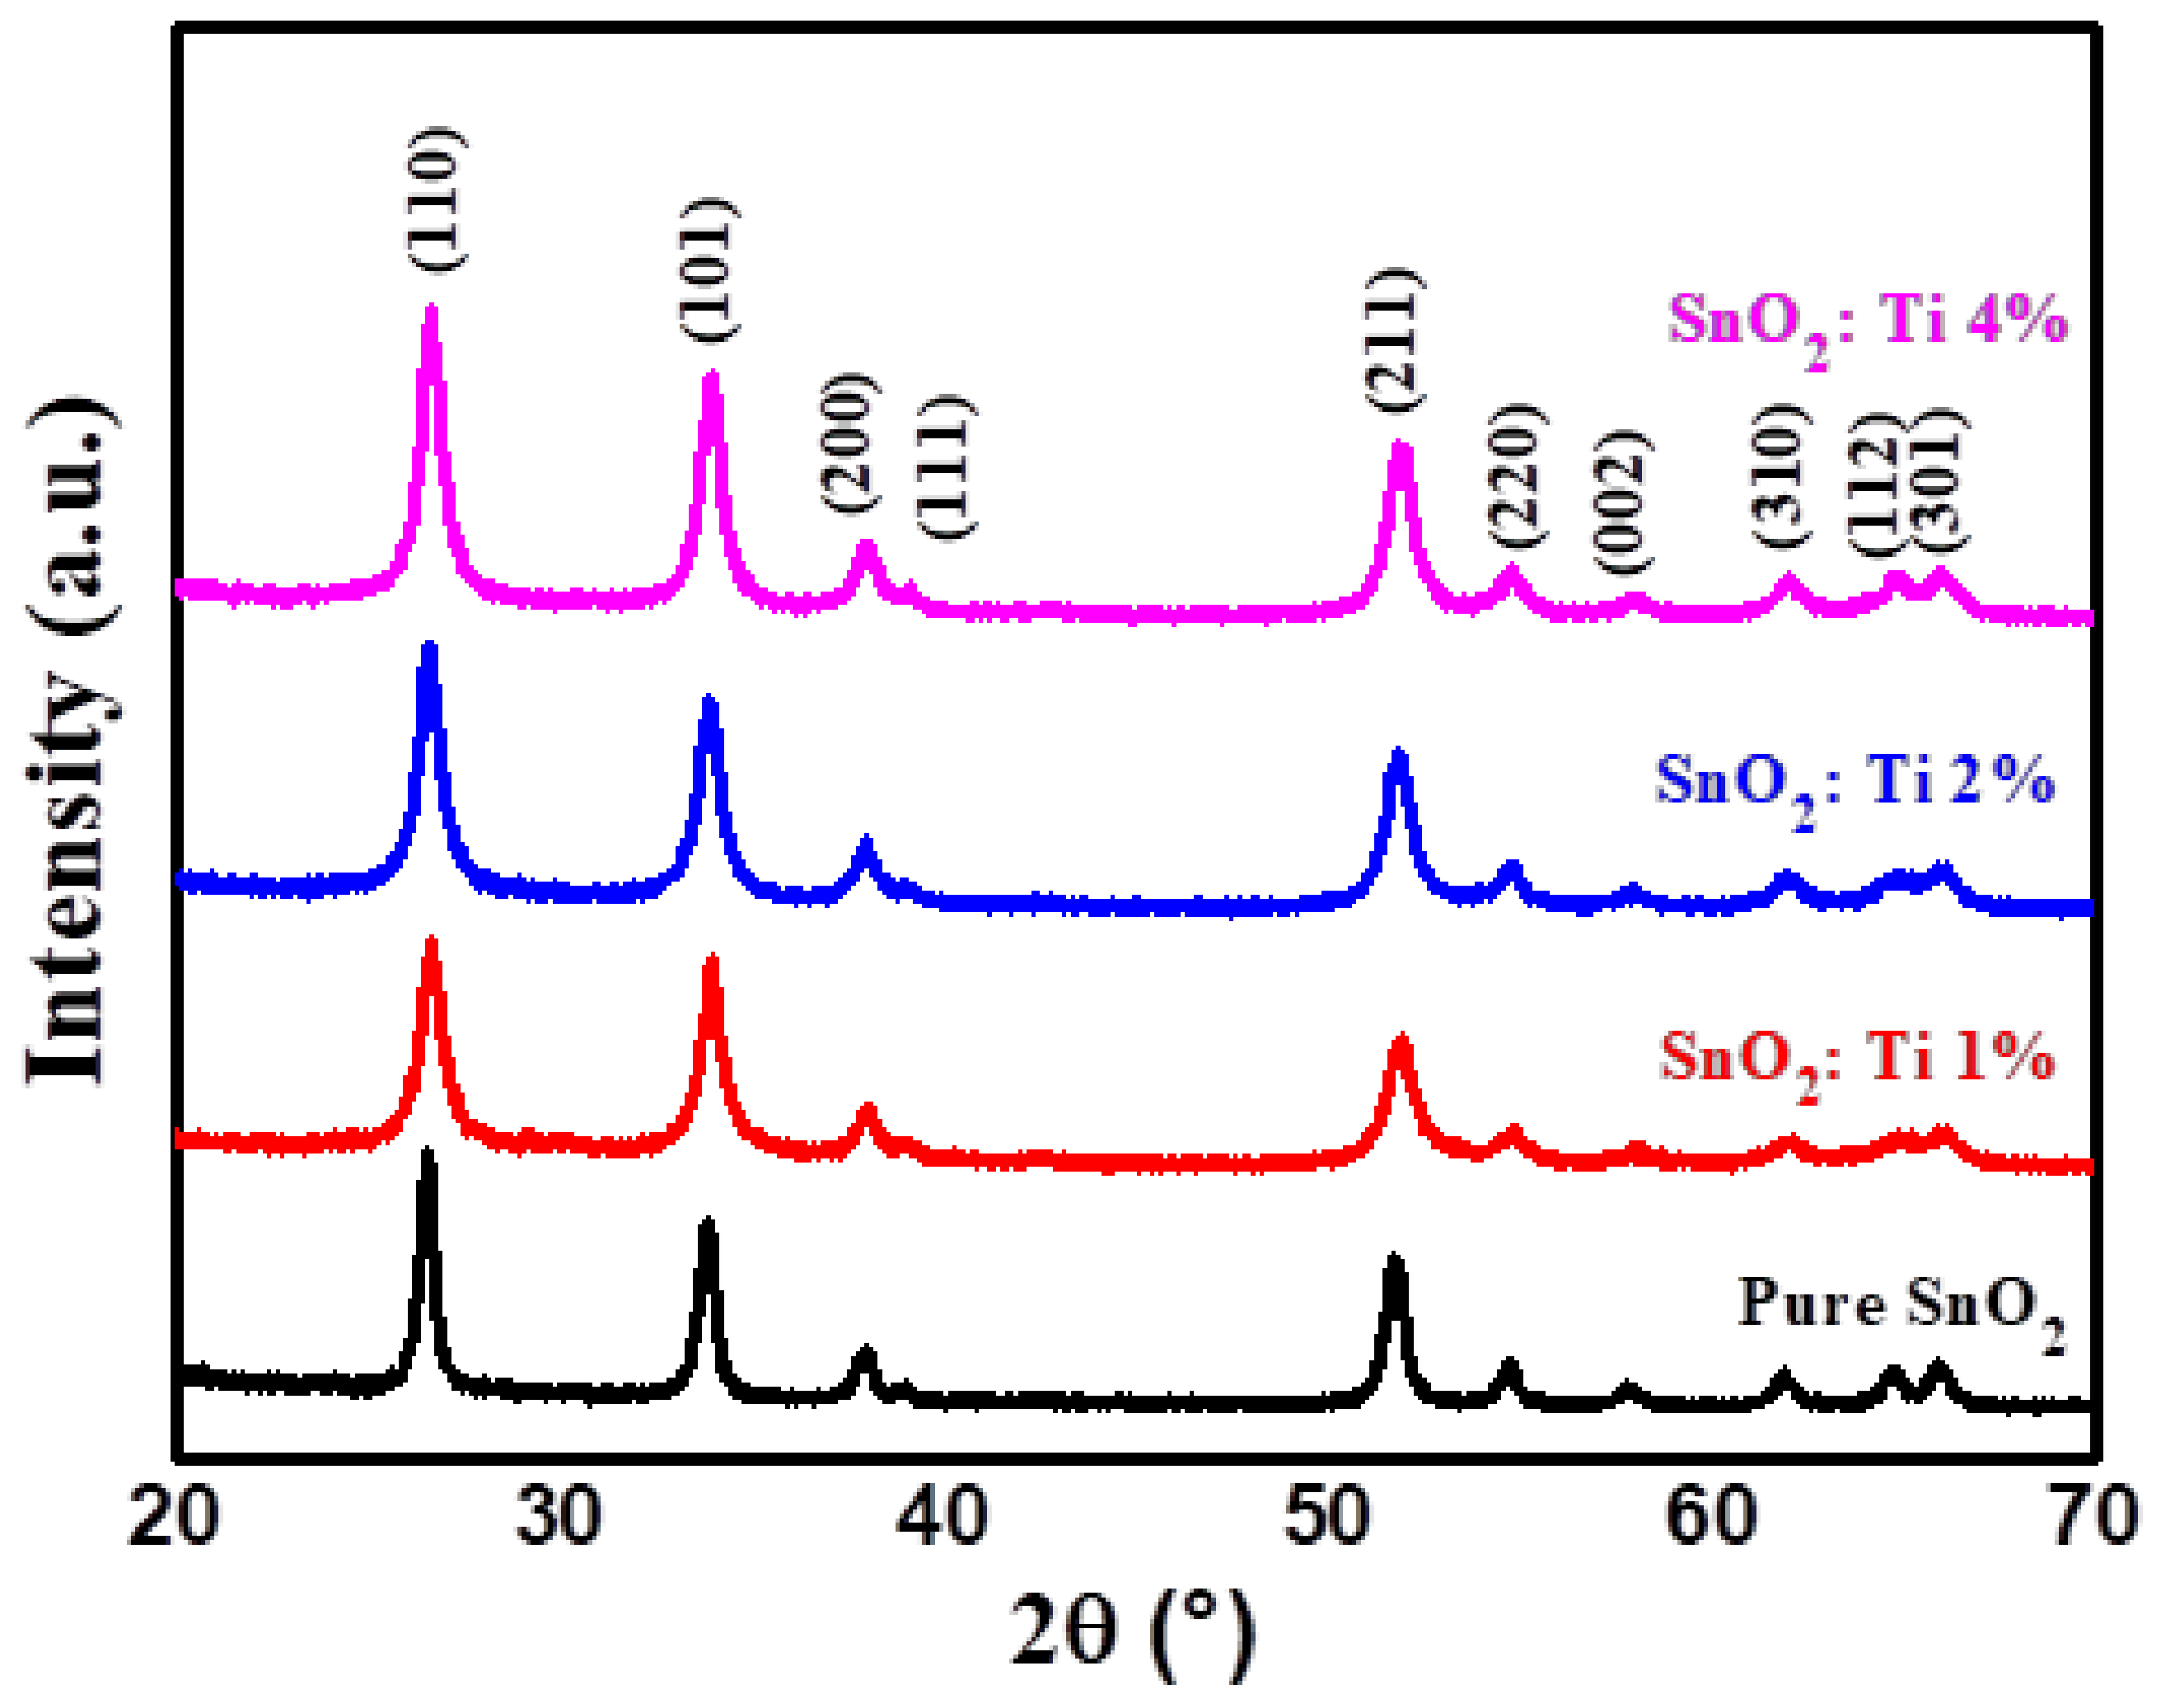
2.1. X-Ray Diffraction Analysis
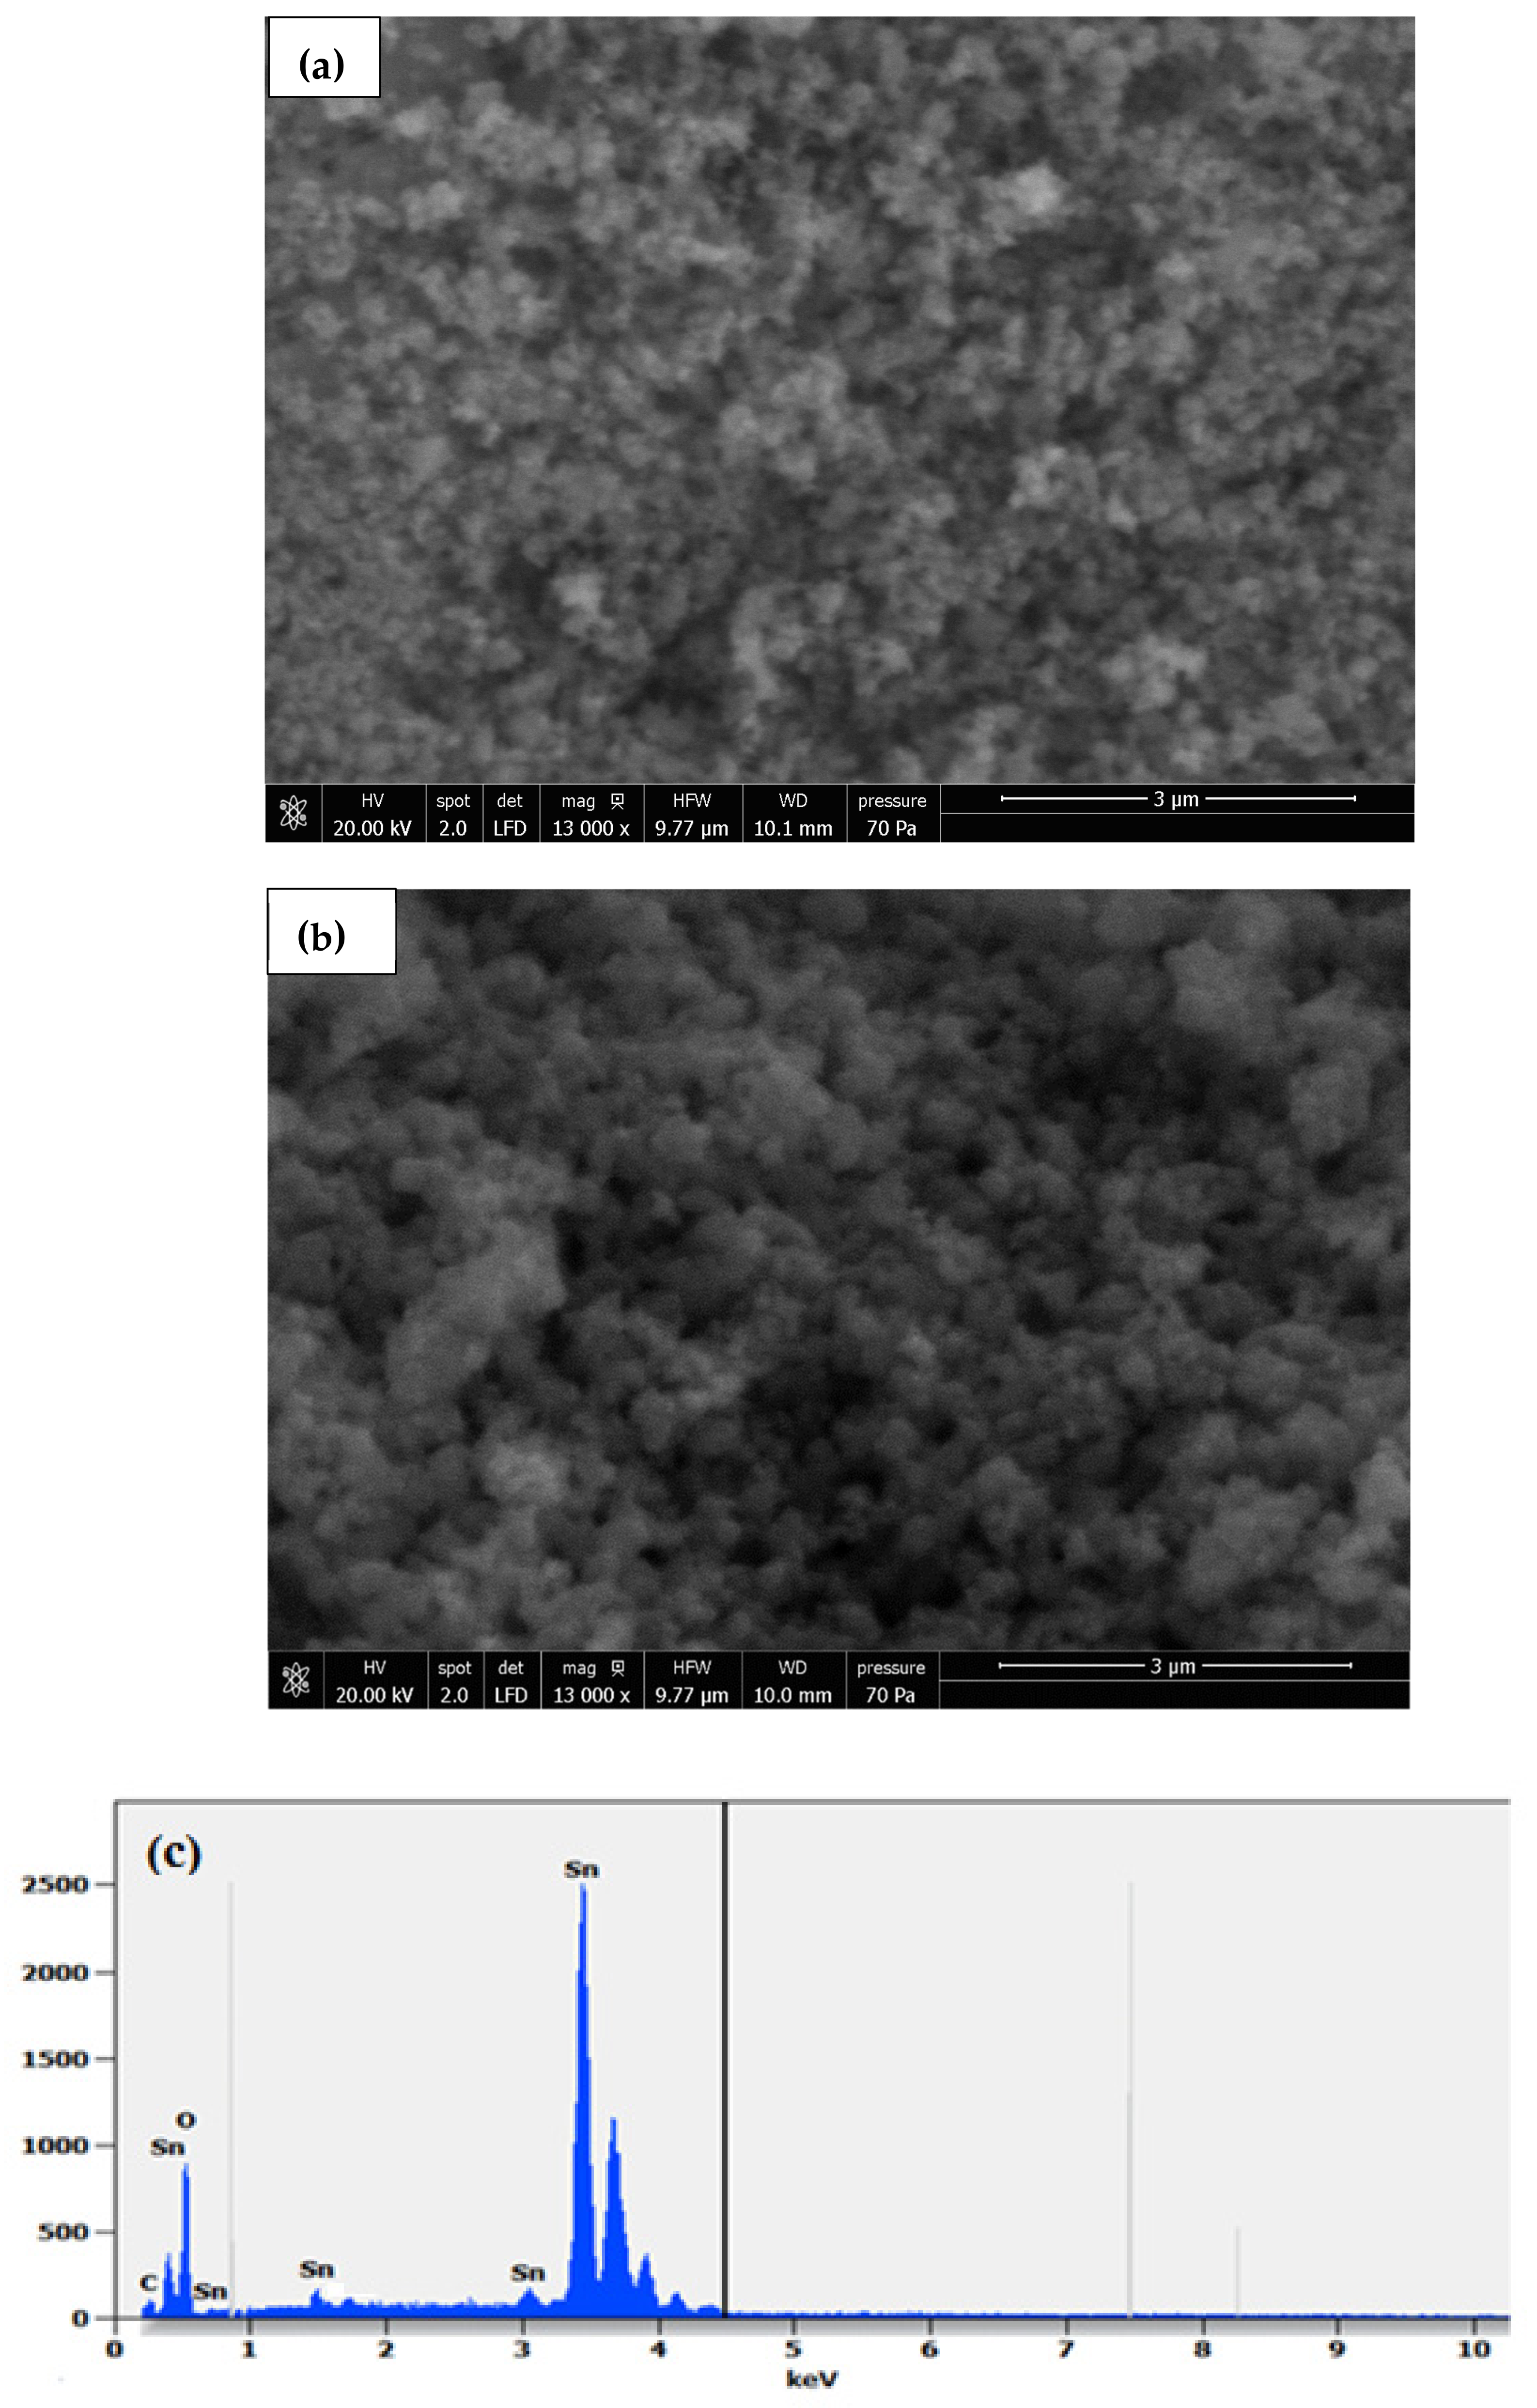
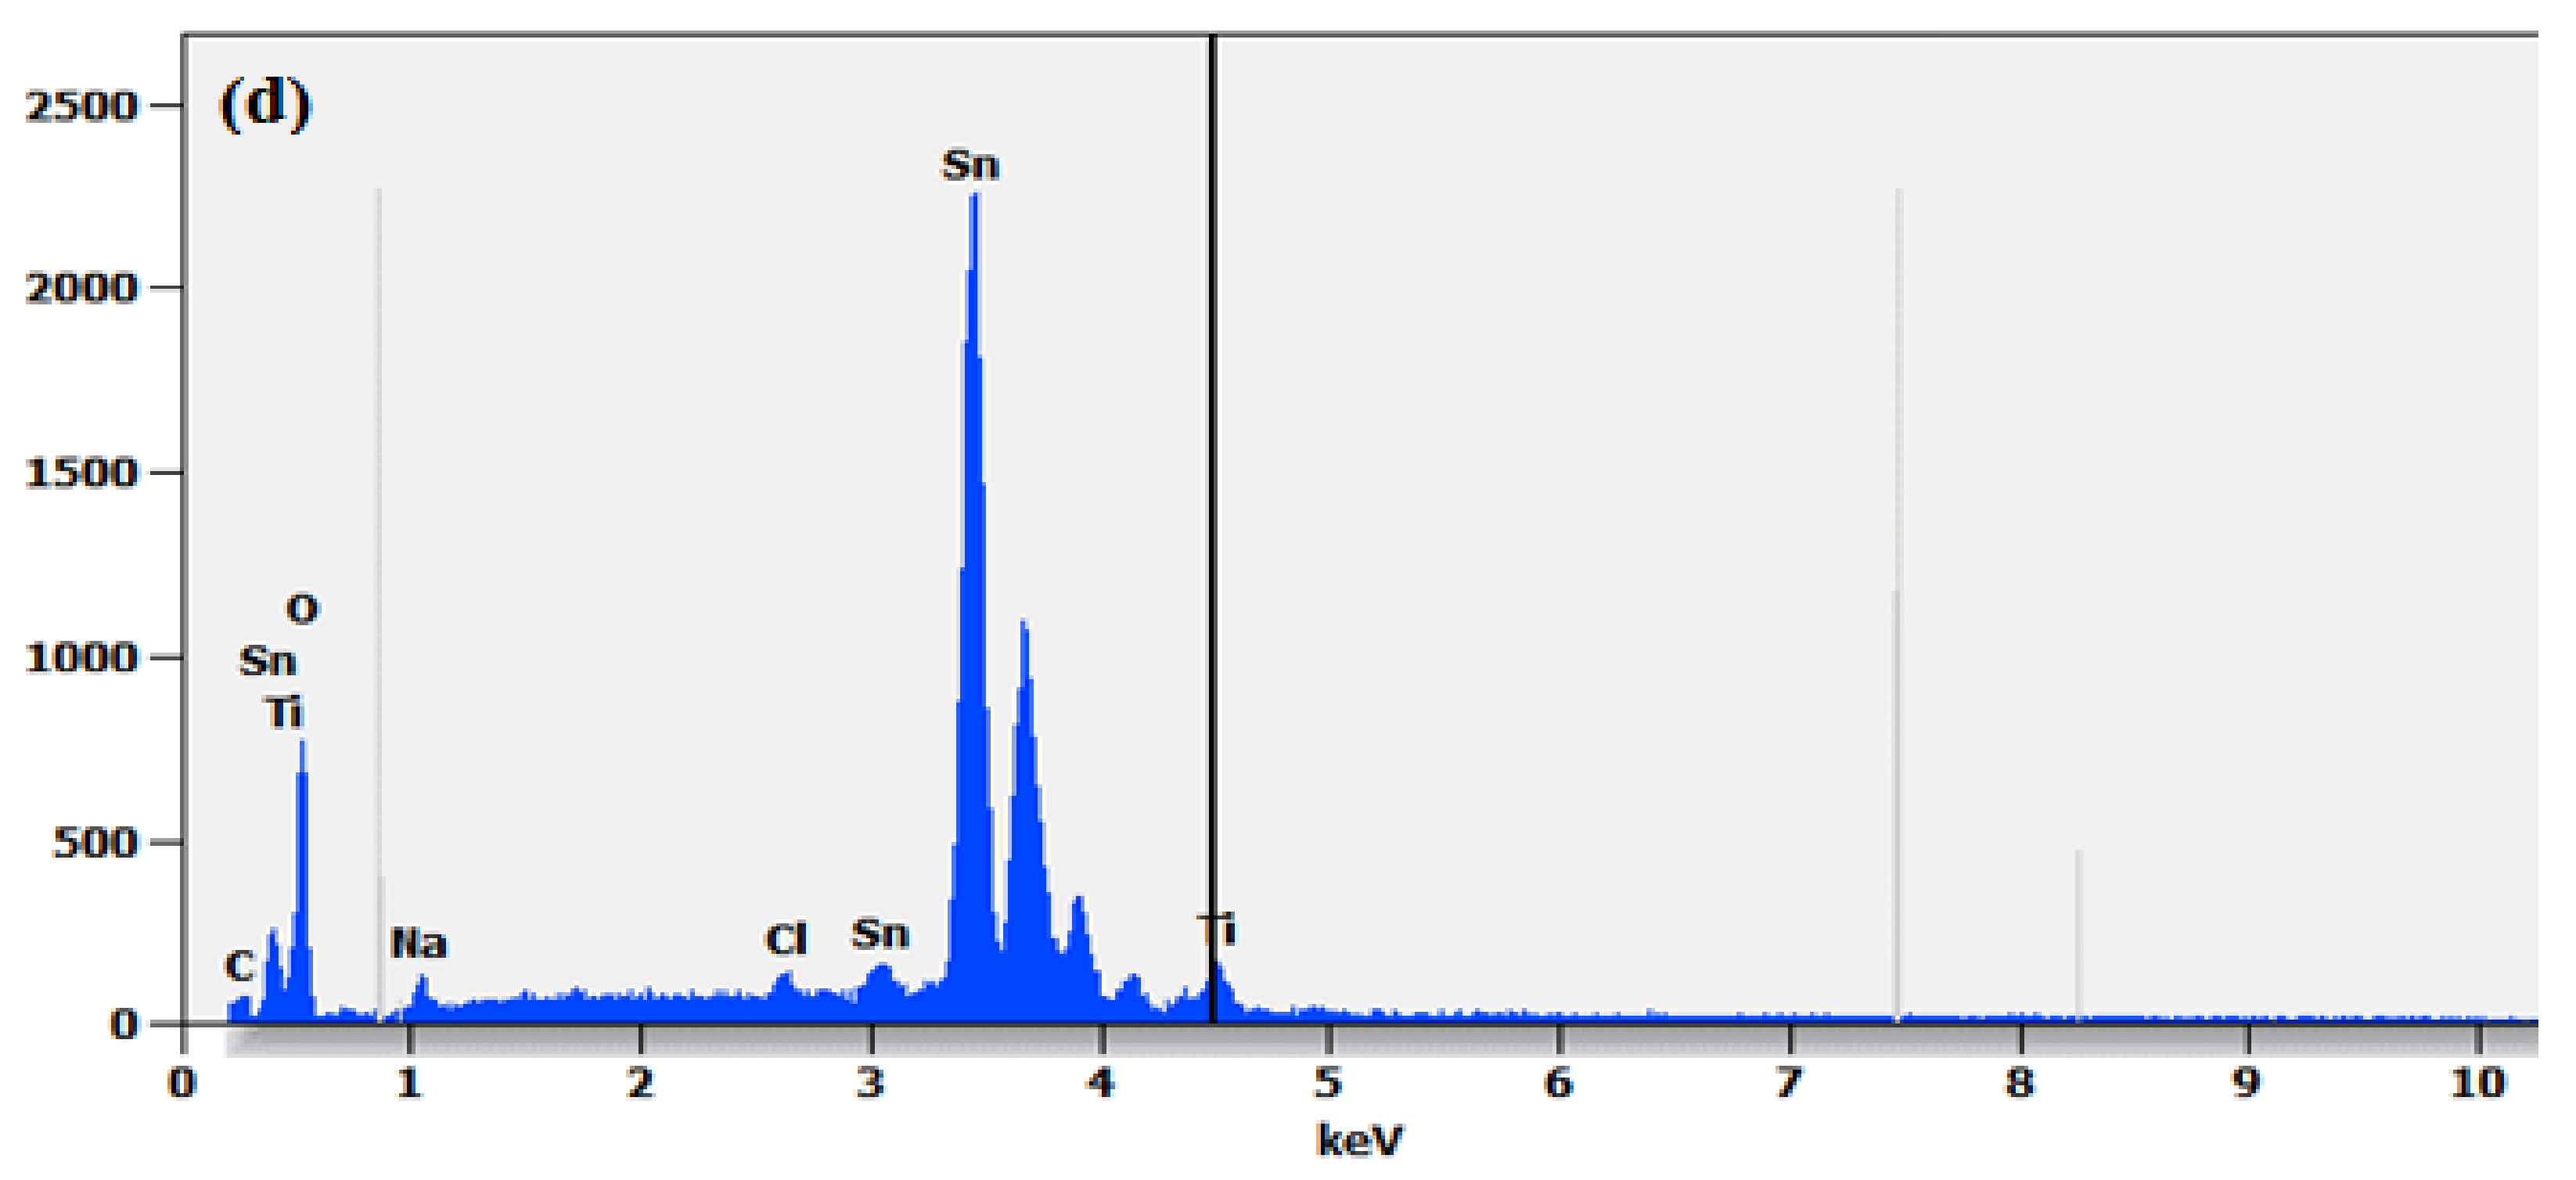
2.2. Morphological Properties
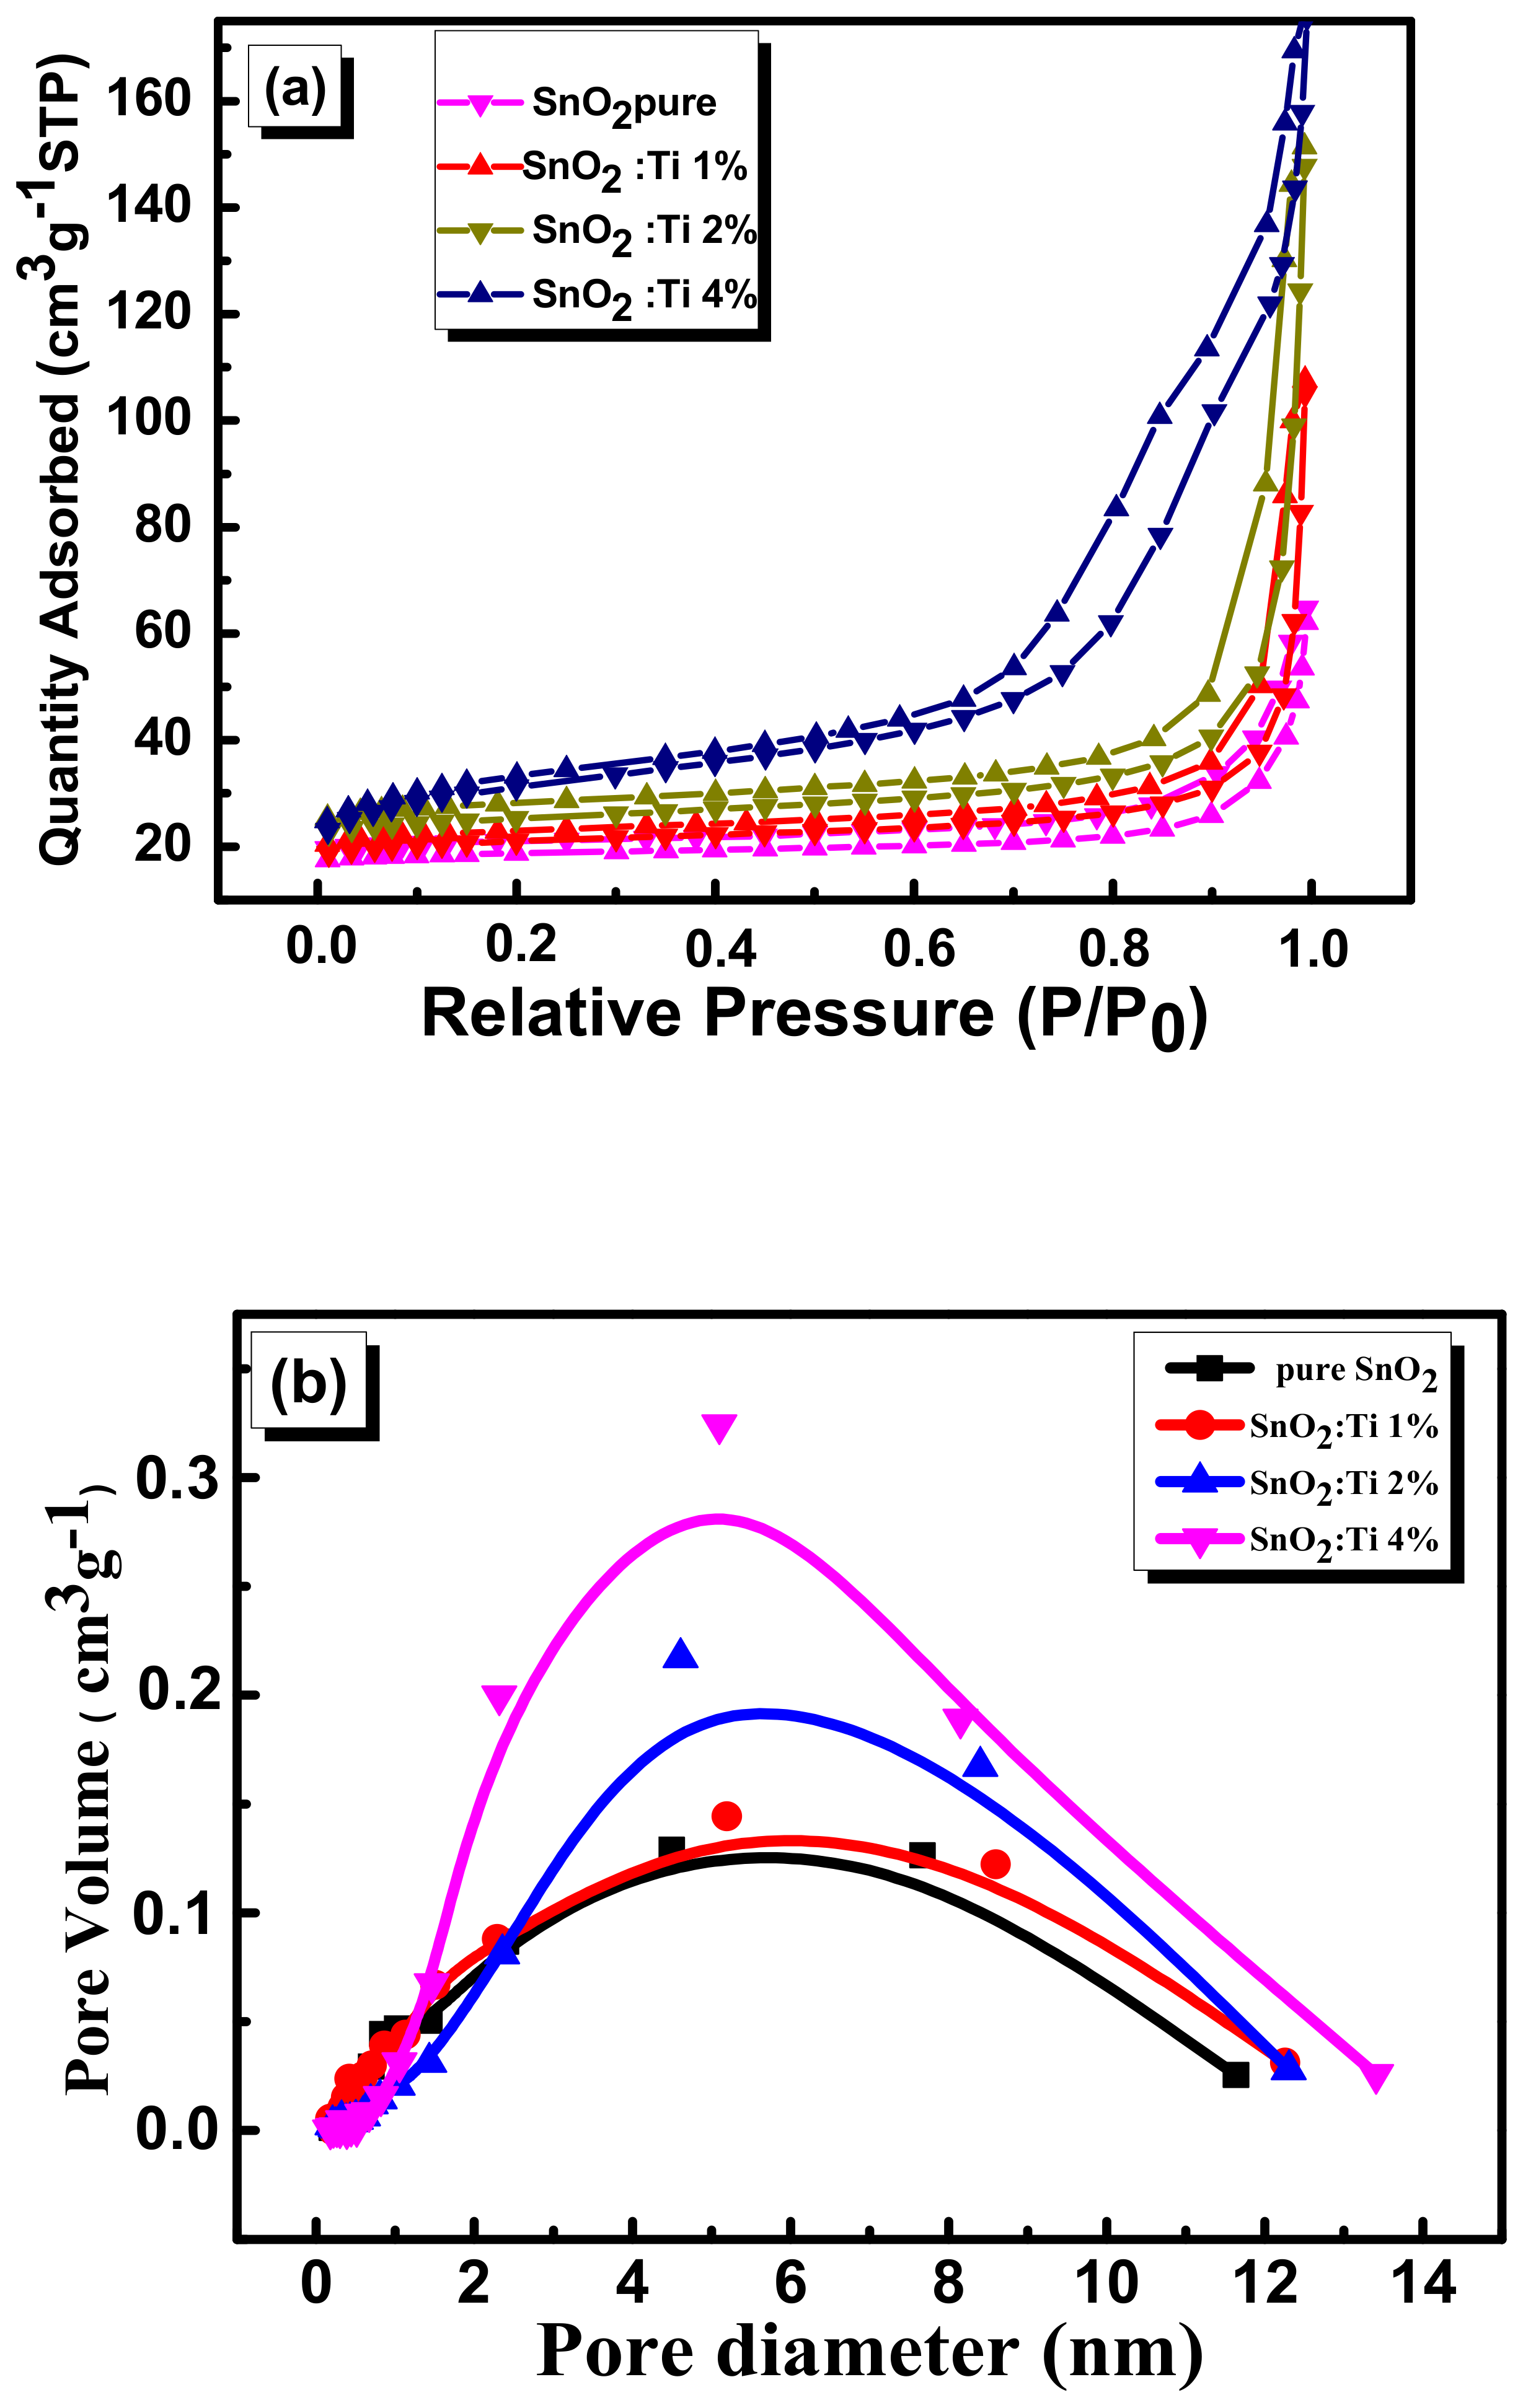
2.3. Textural Properties
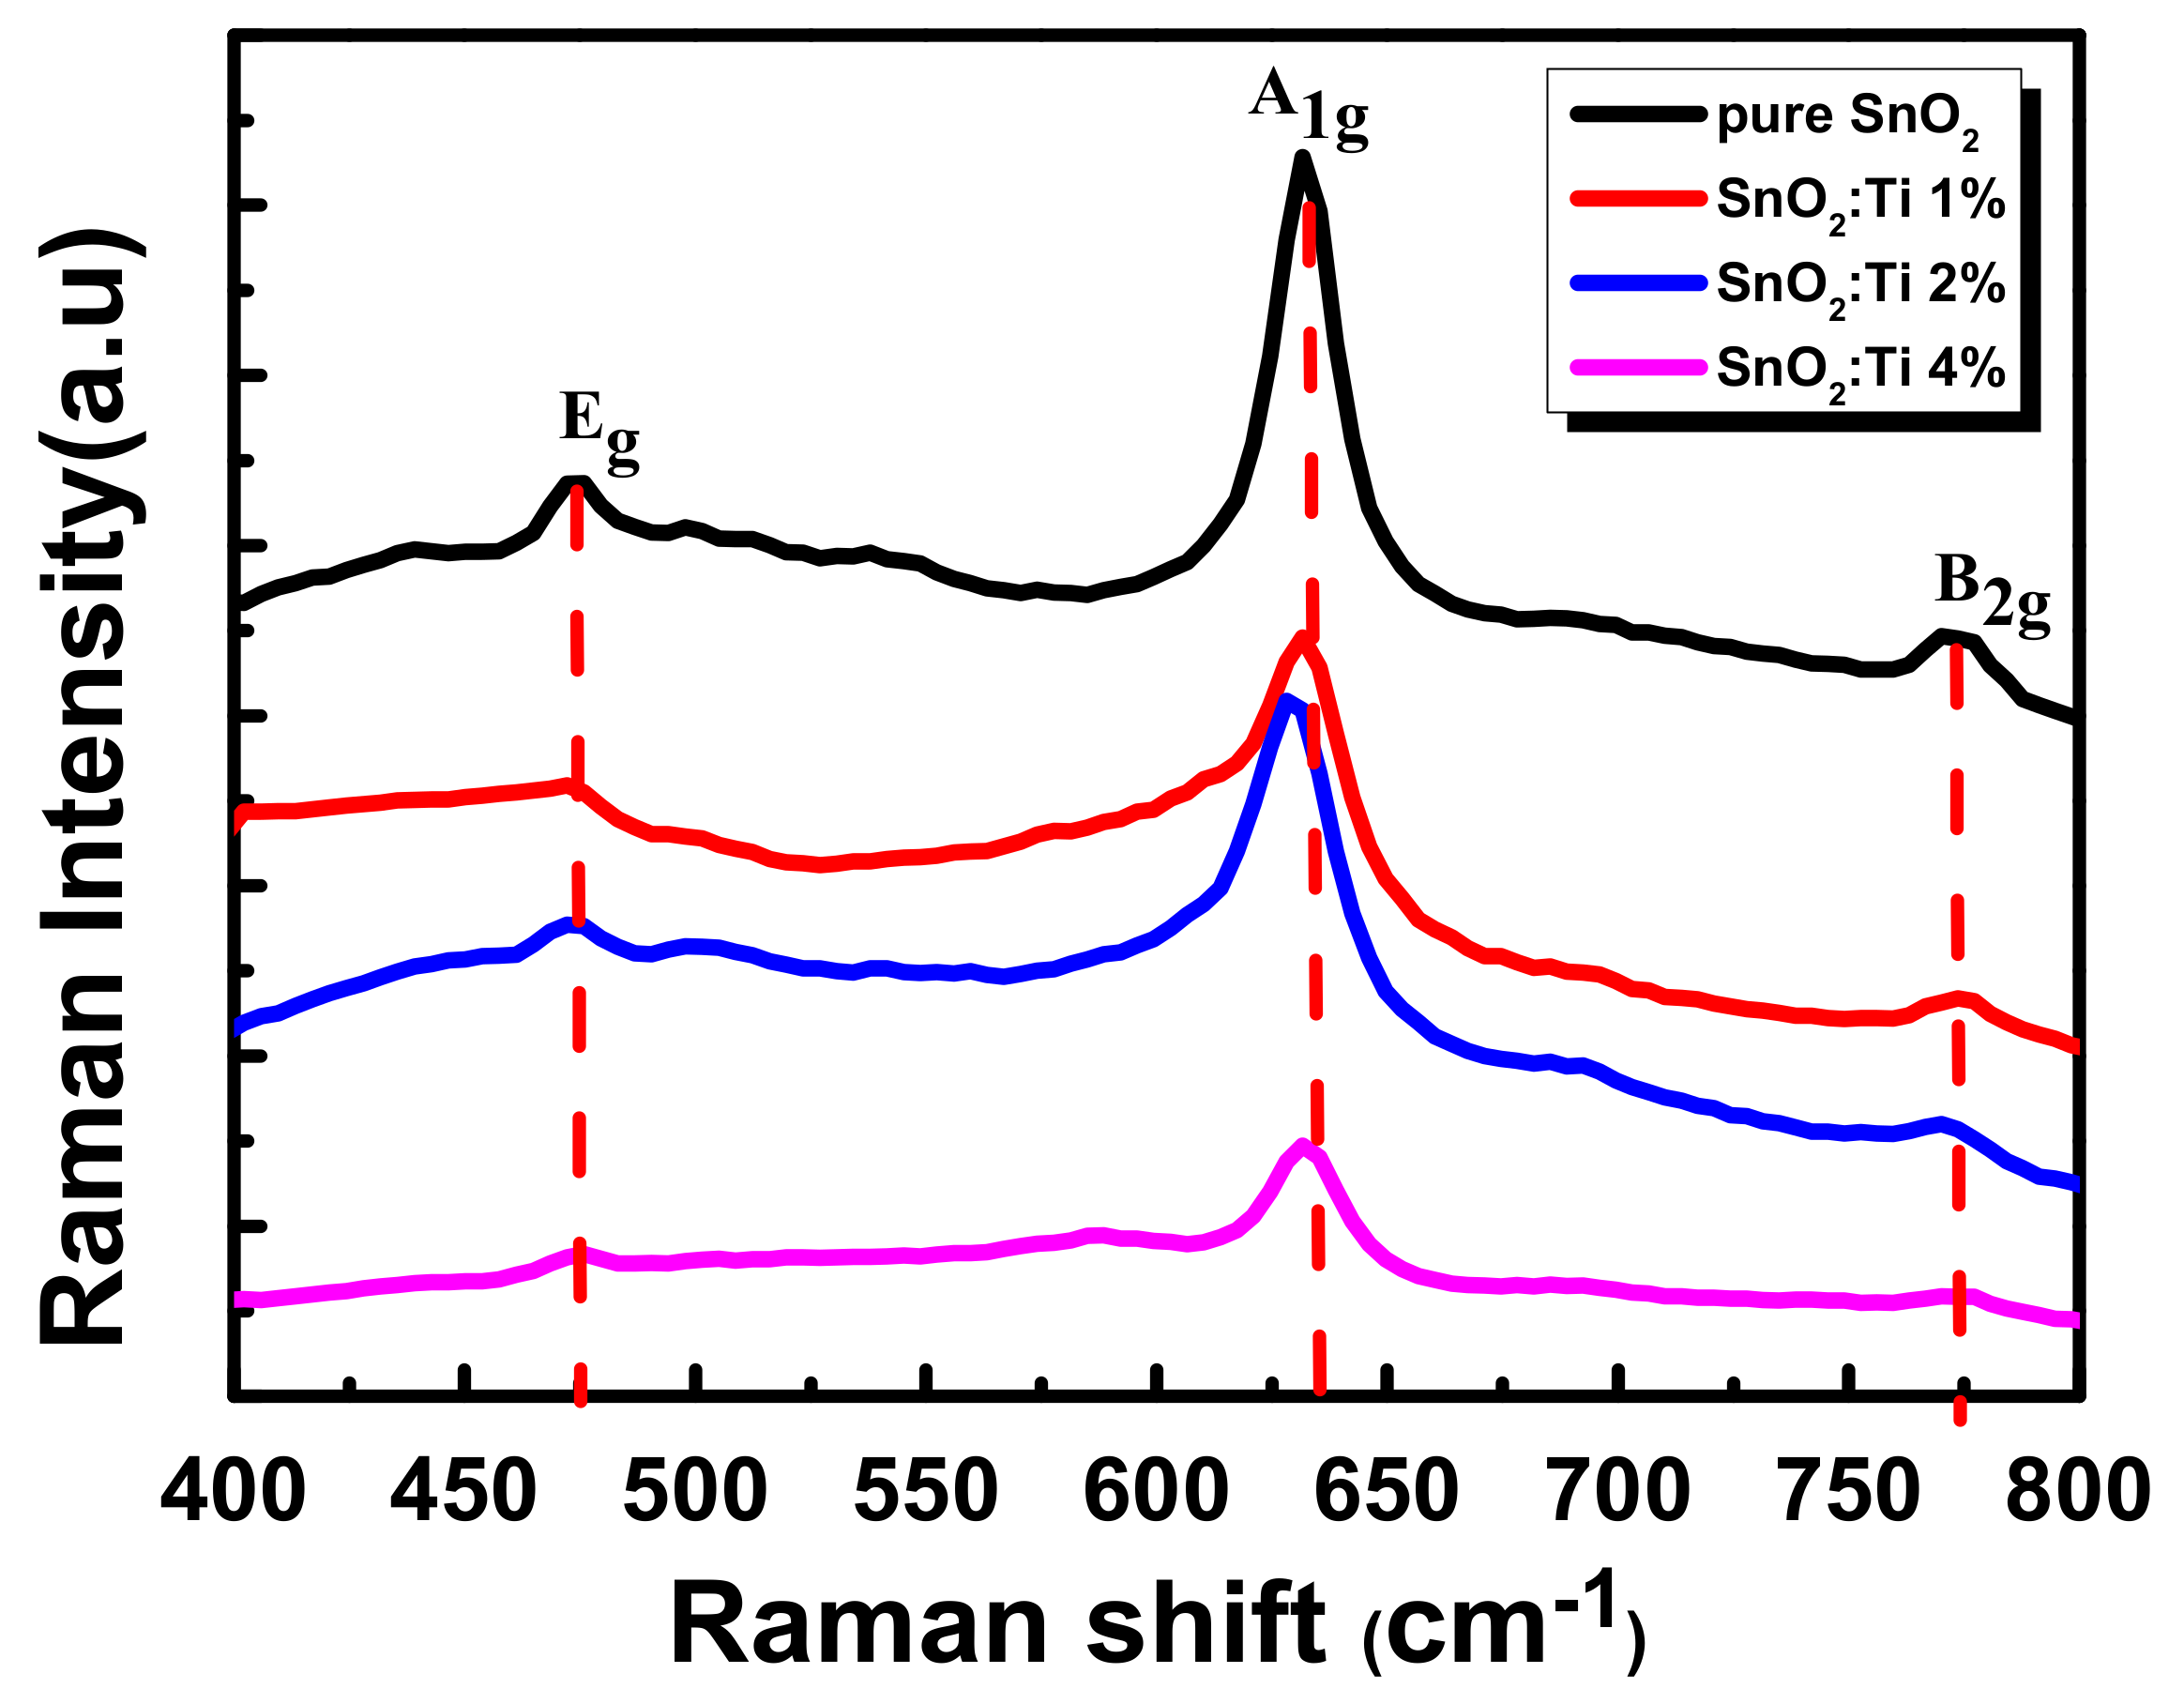
2.4. Raman Analysis
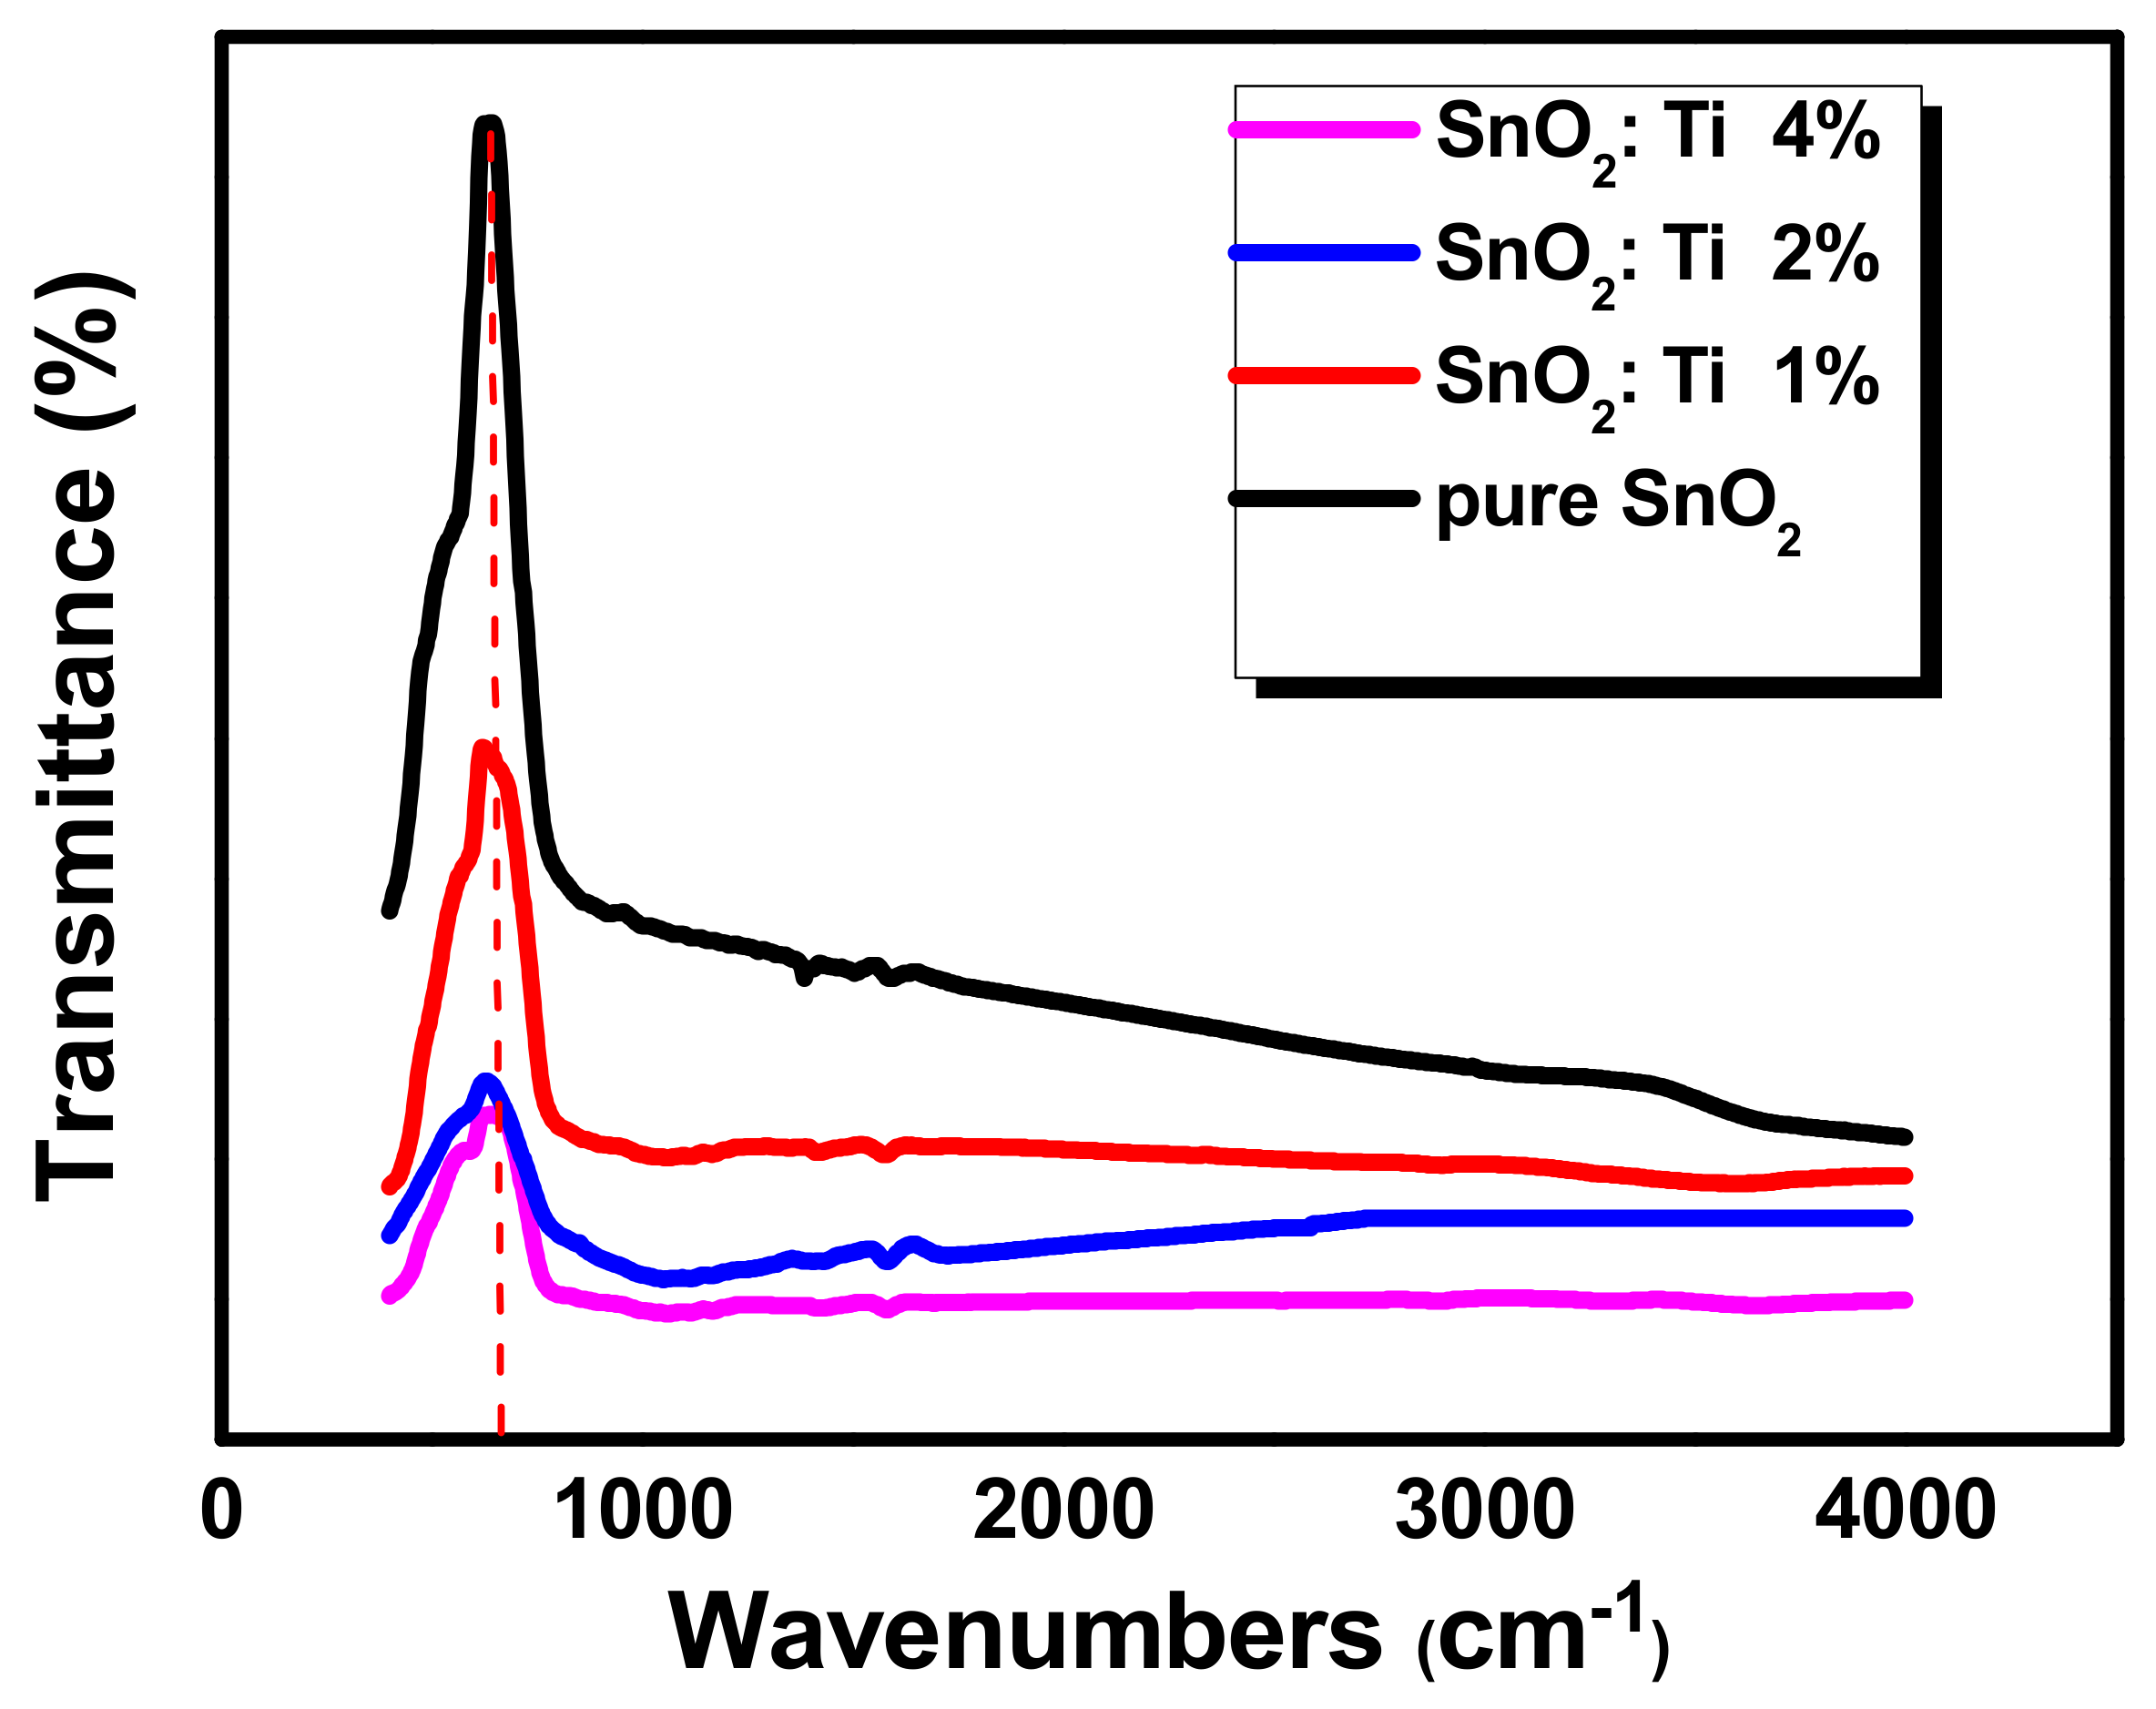
2.5. FTIR Analysis
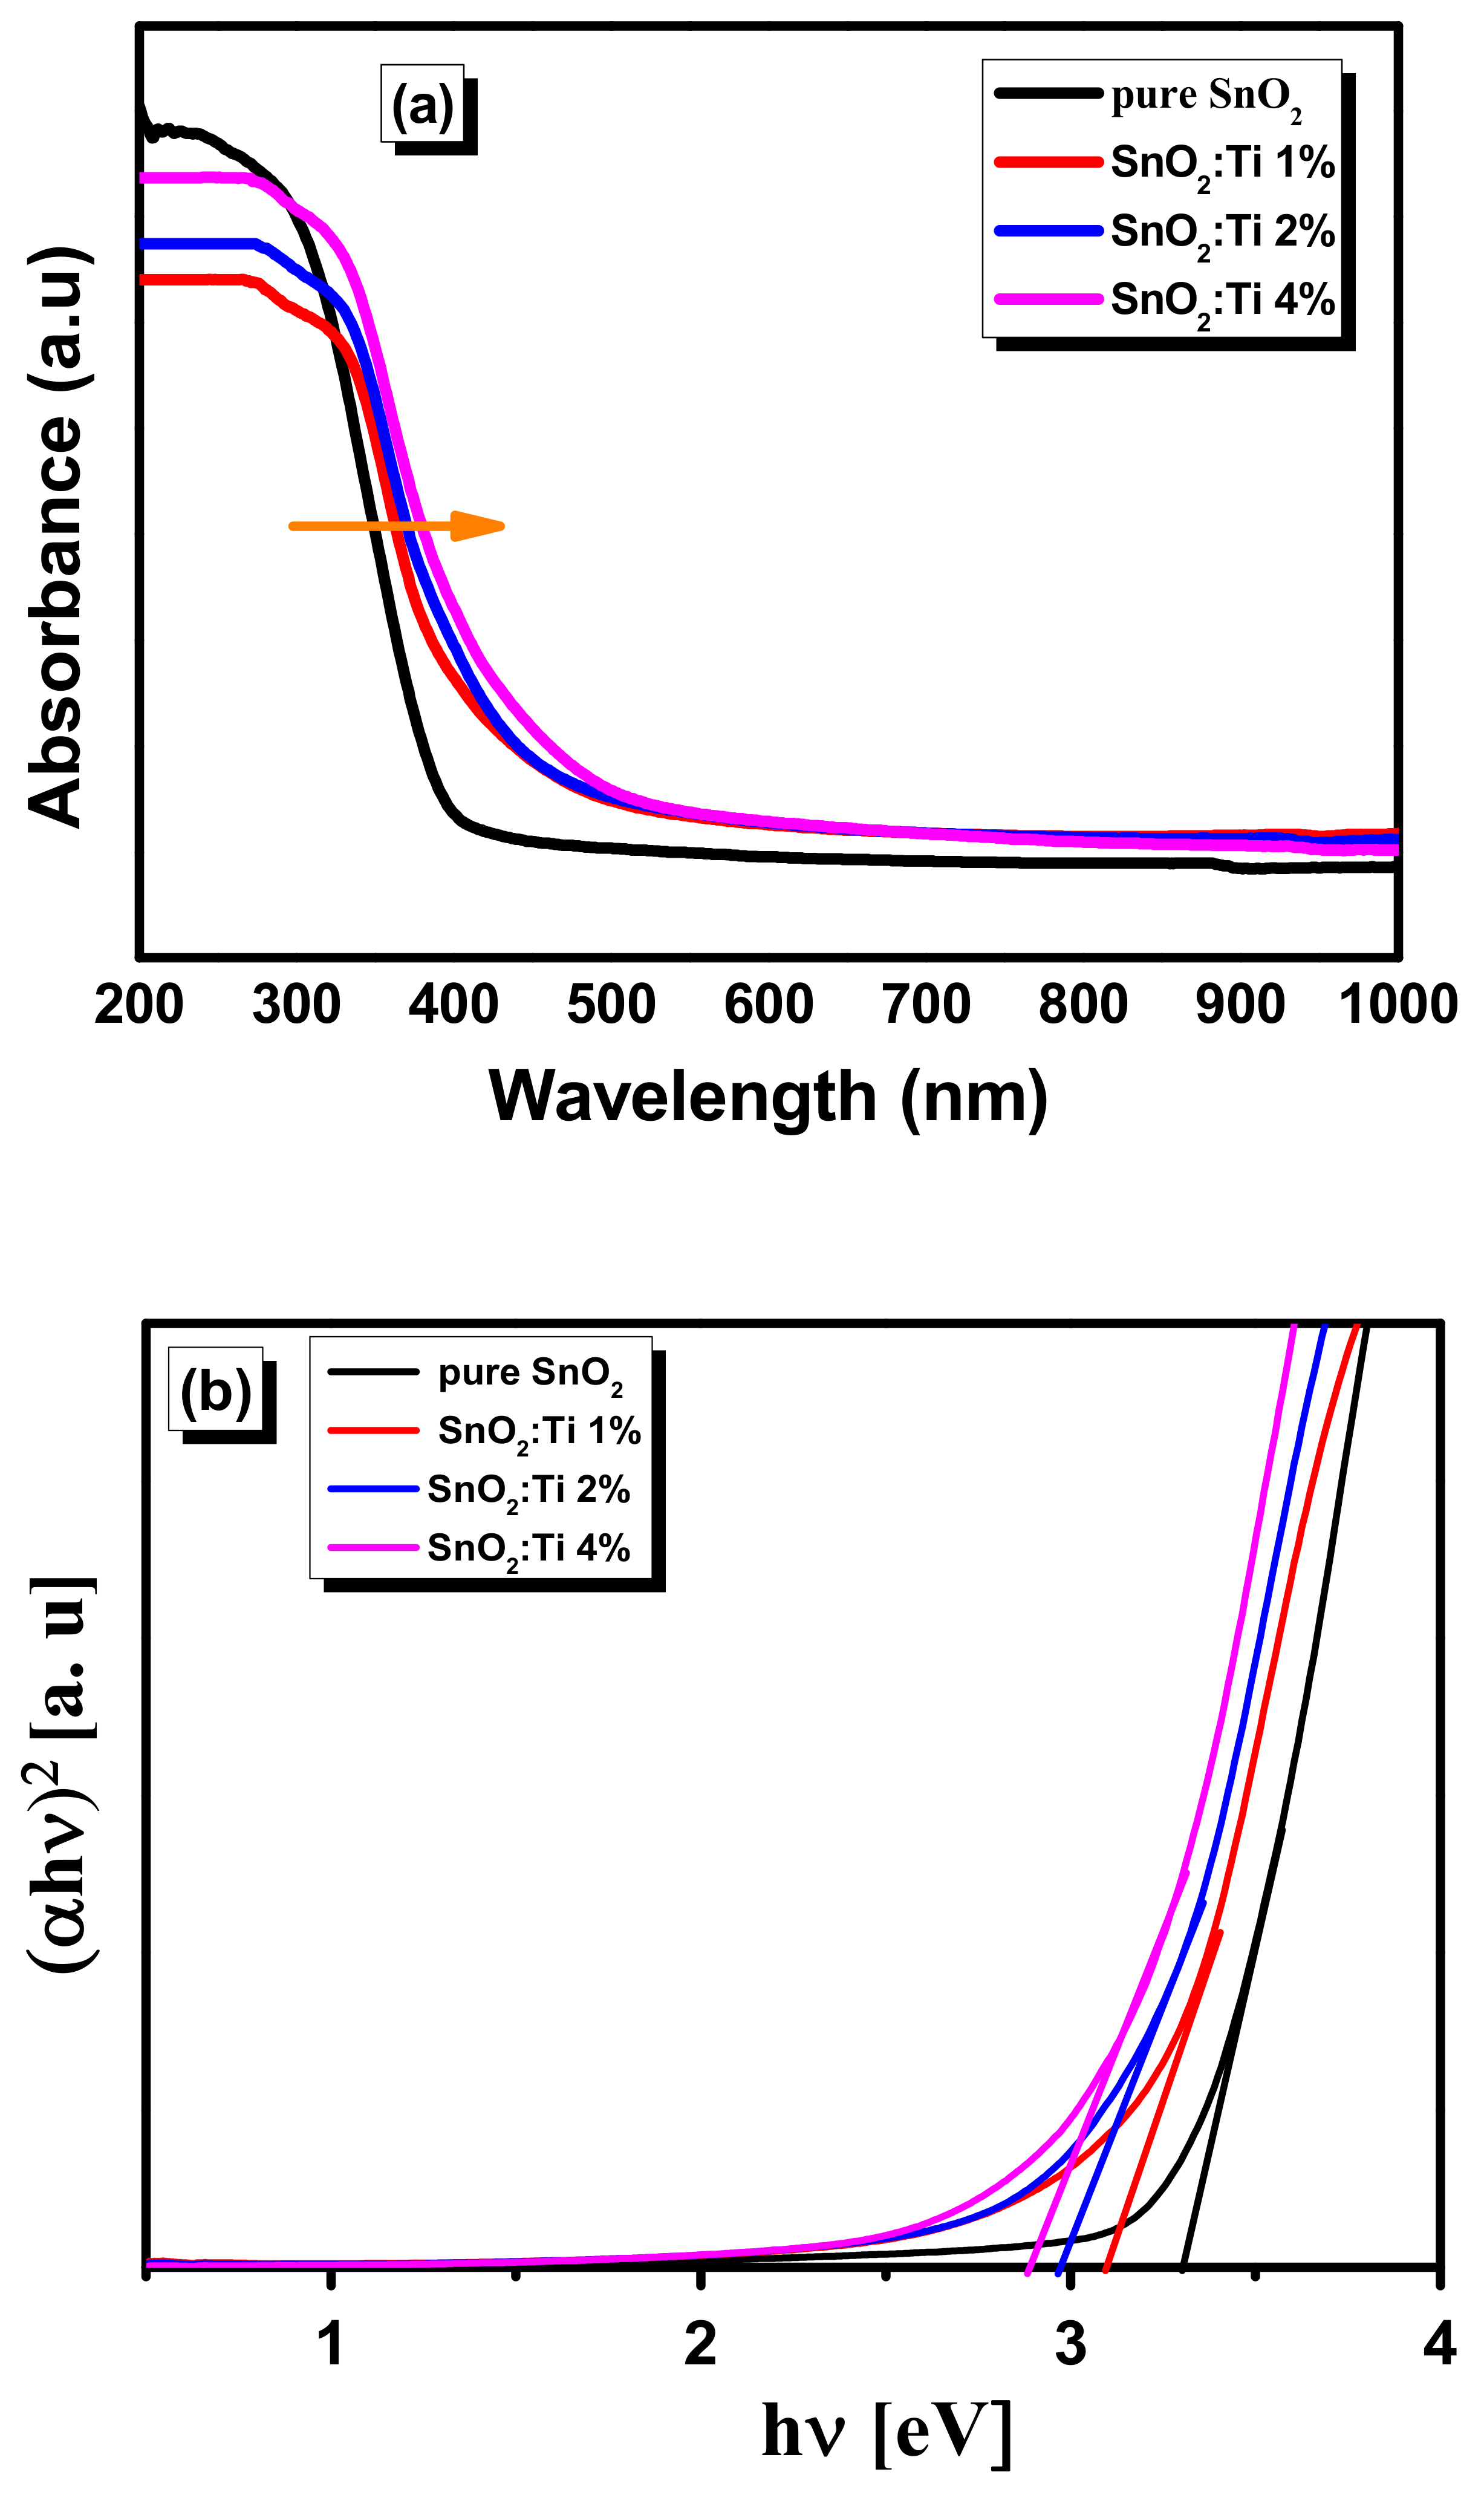
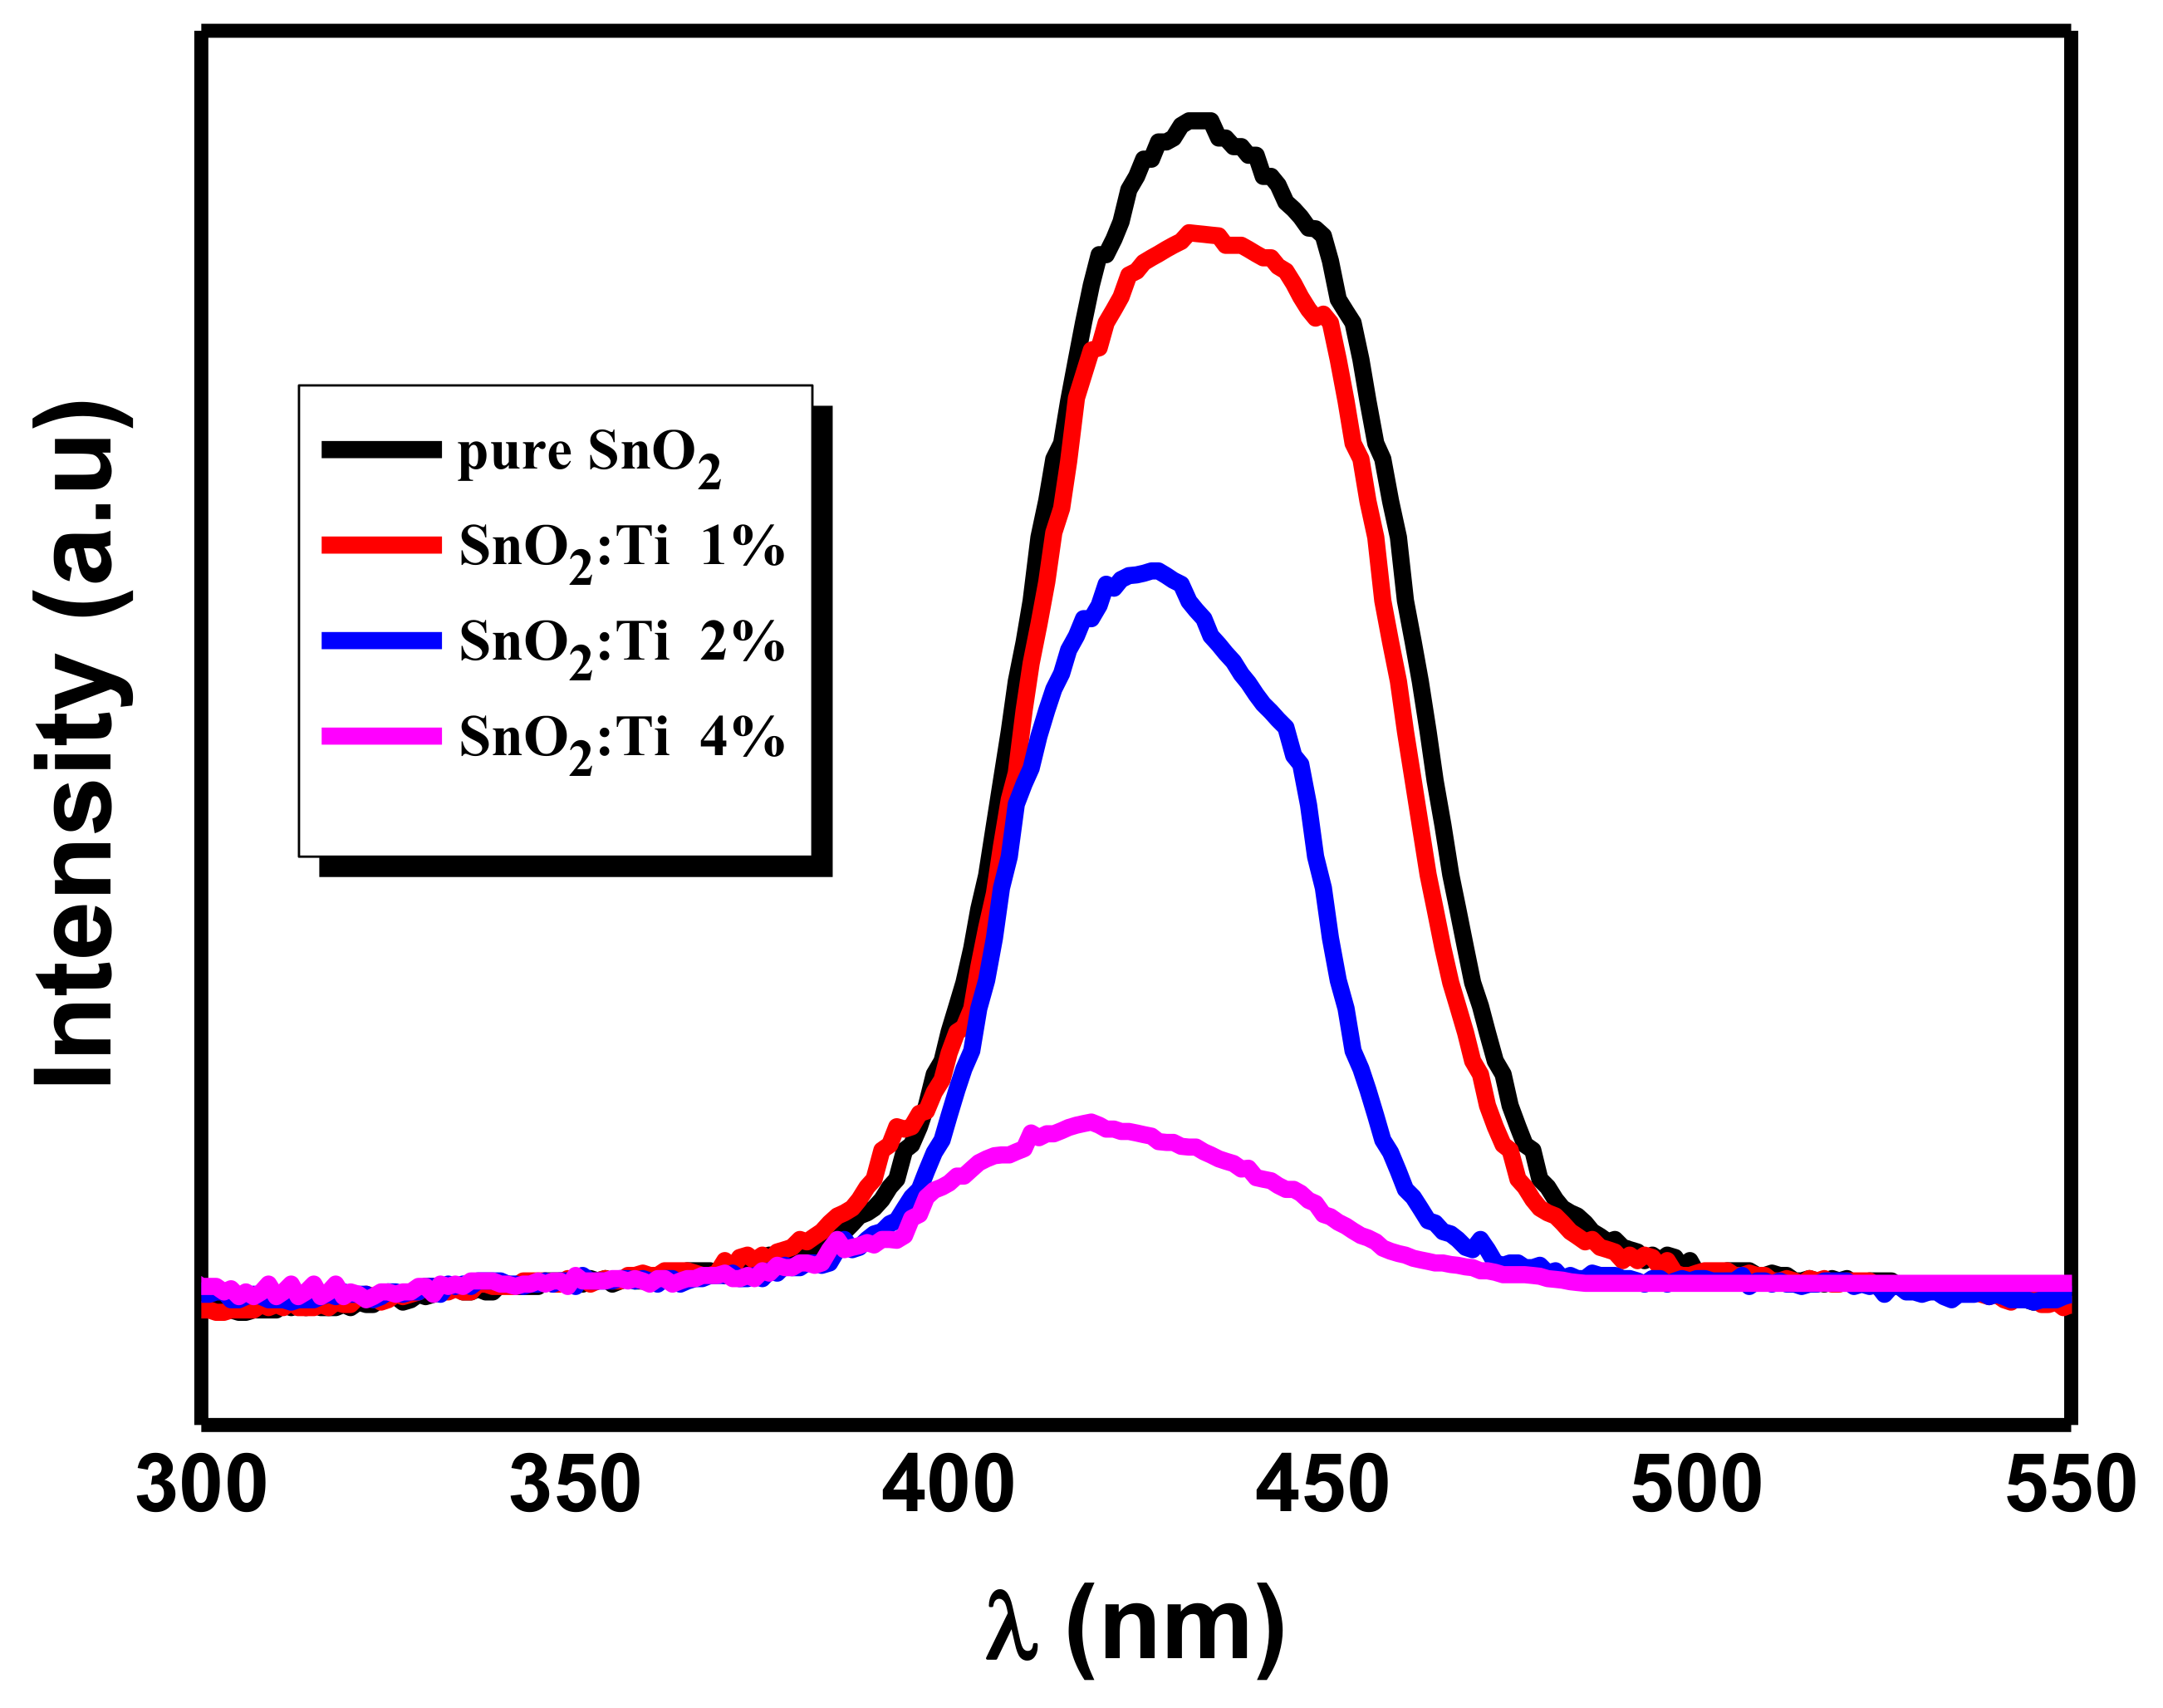
2.6. Optical Properties
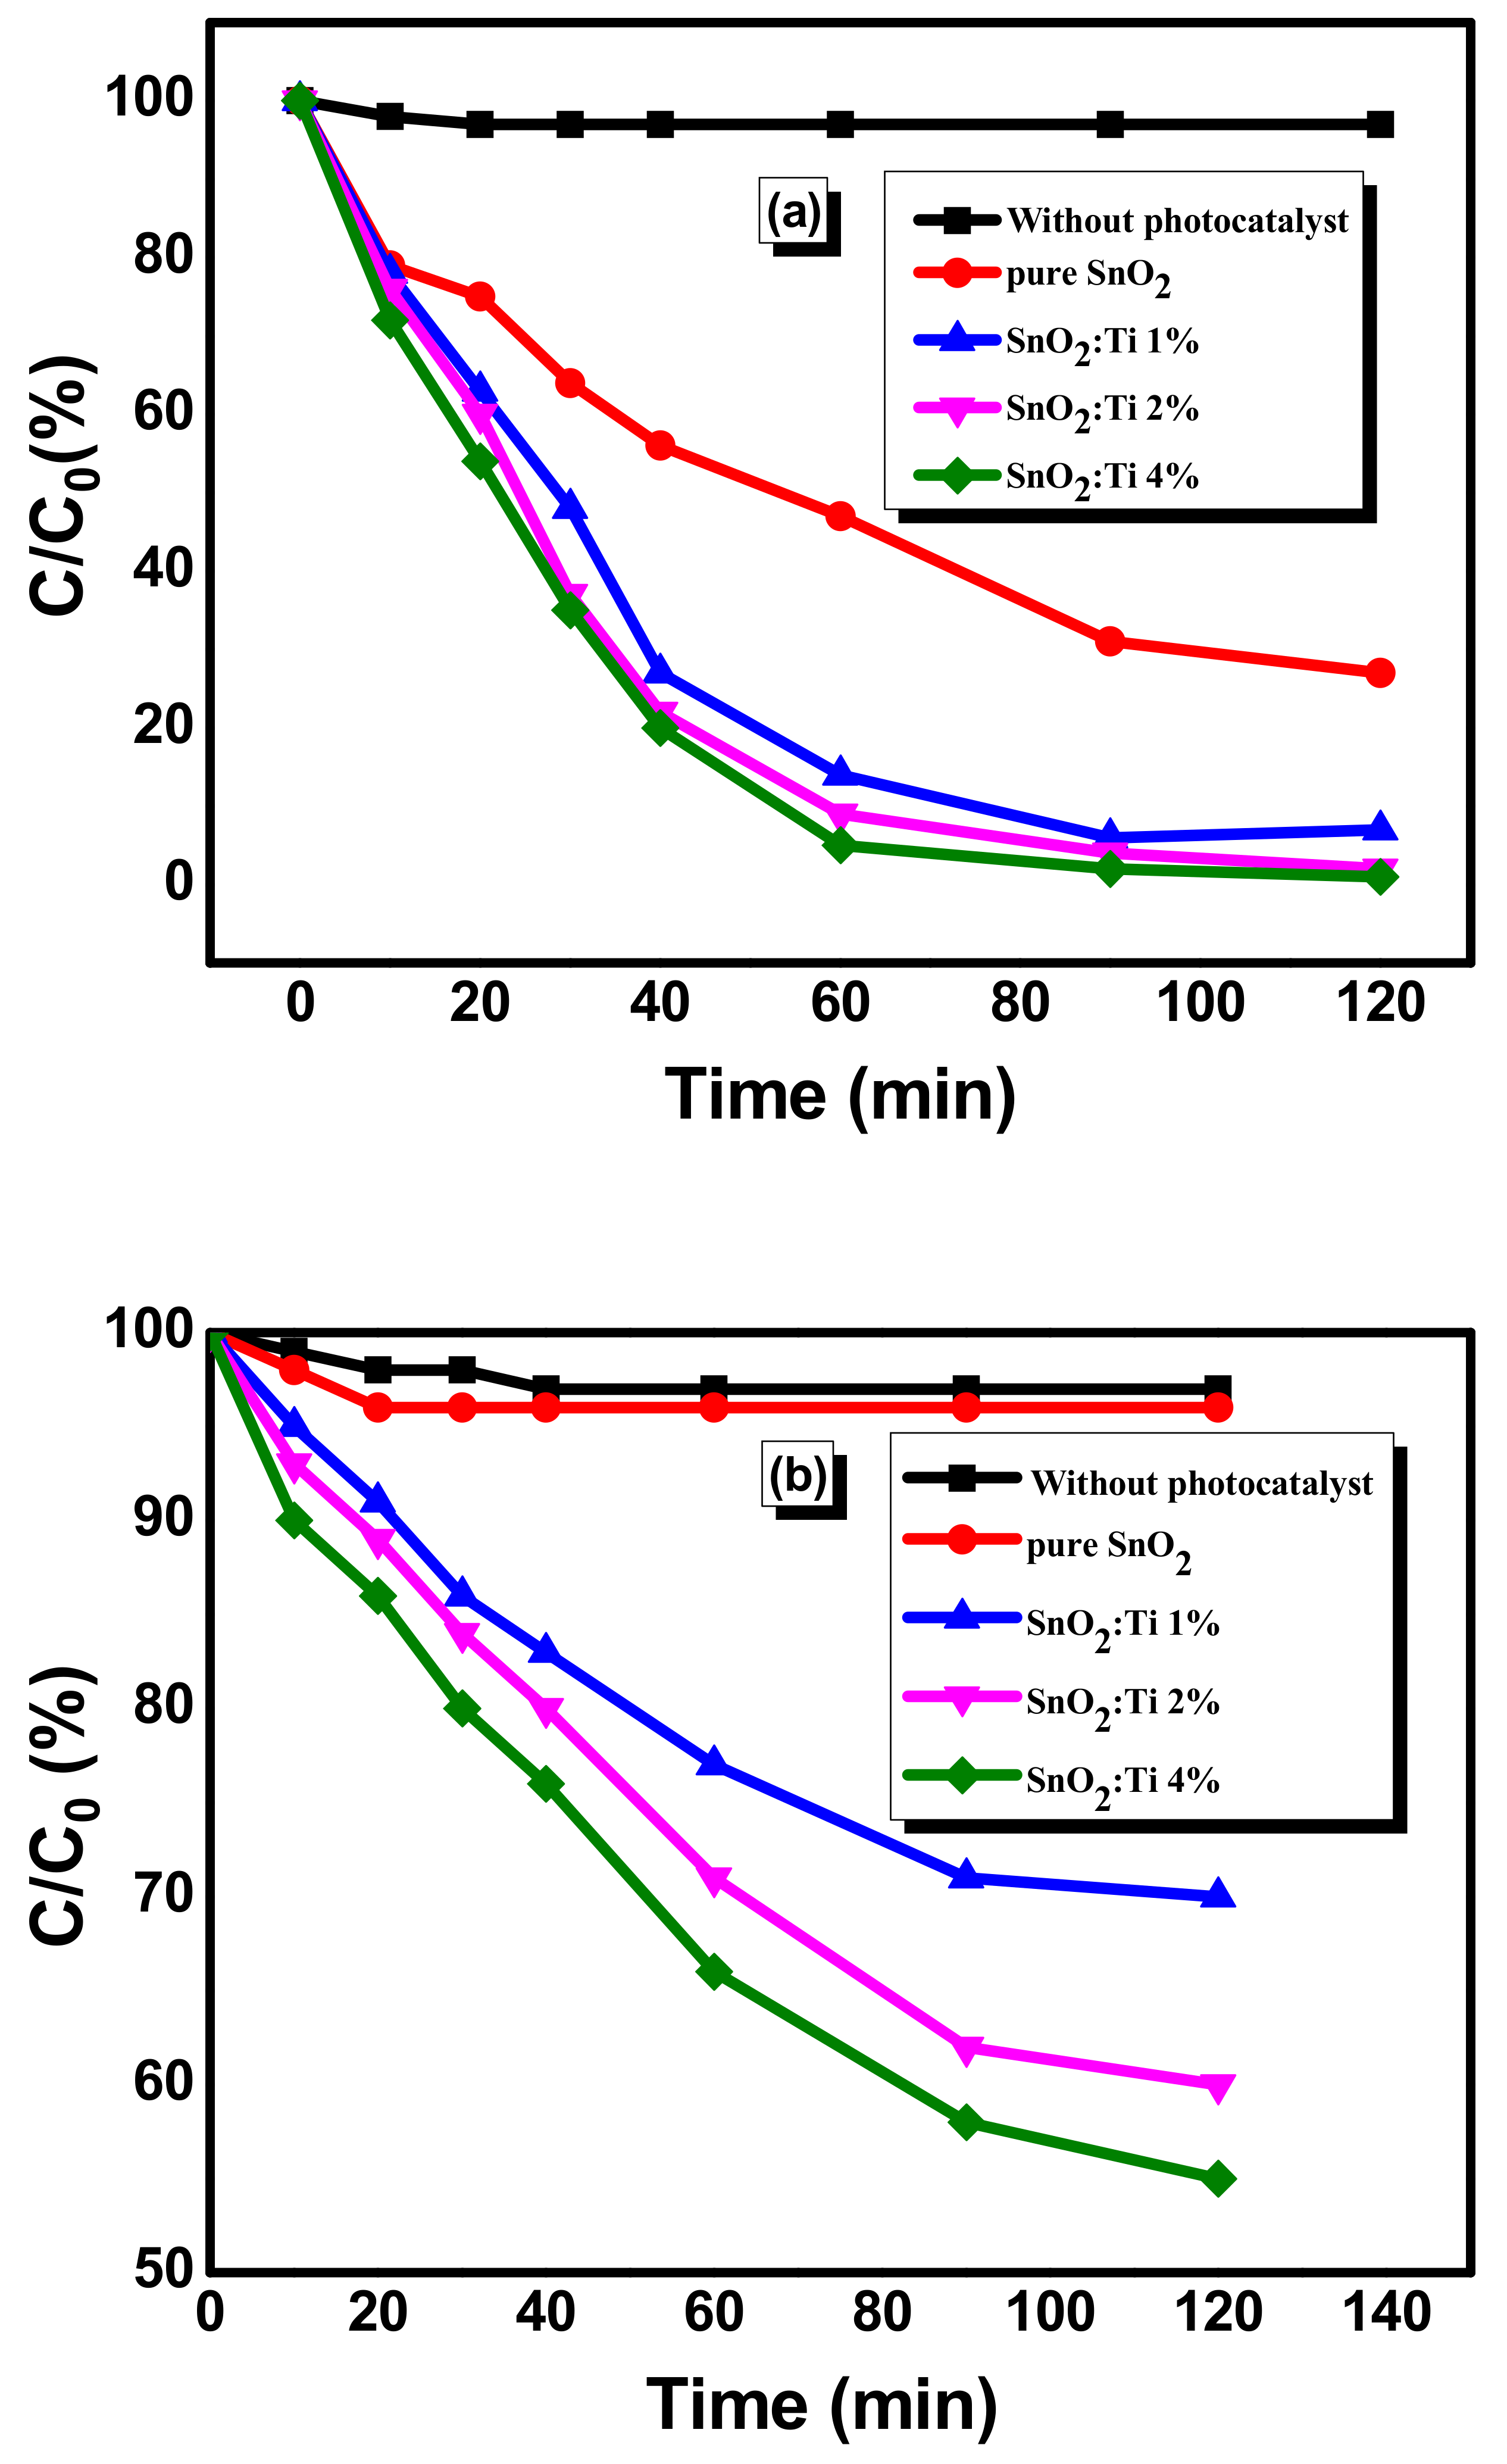
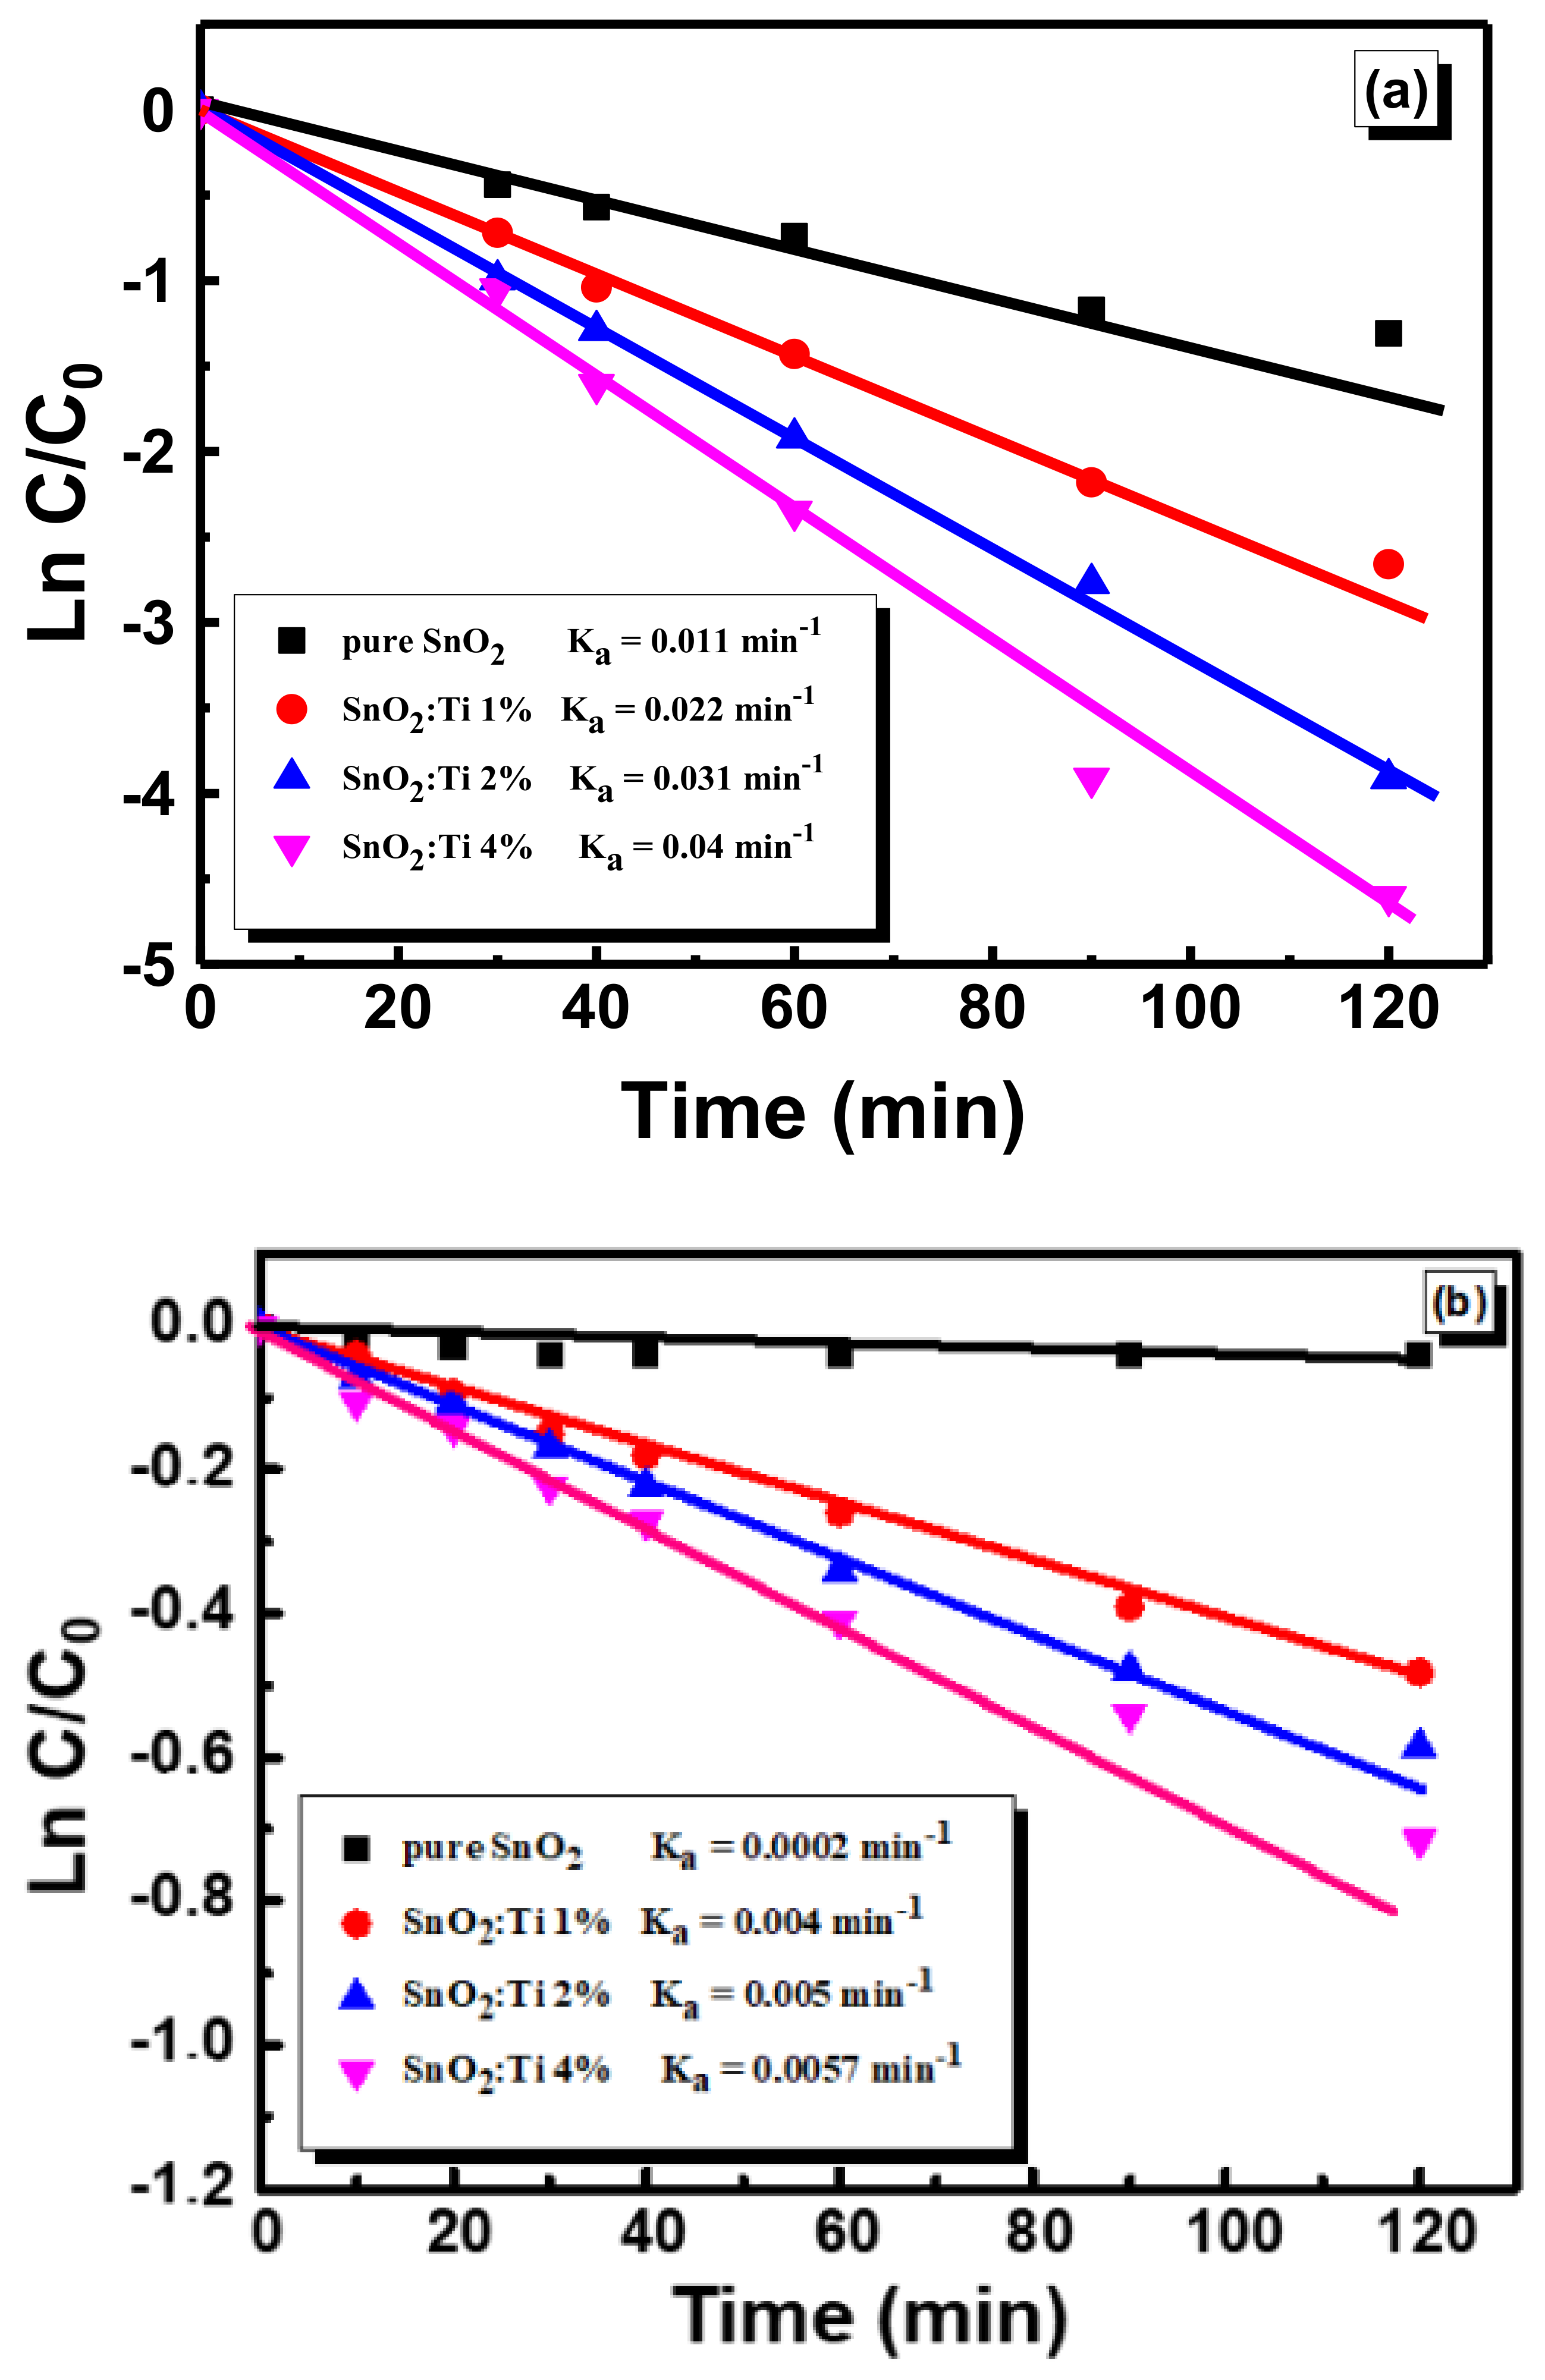
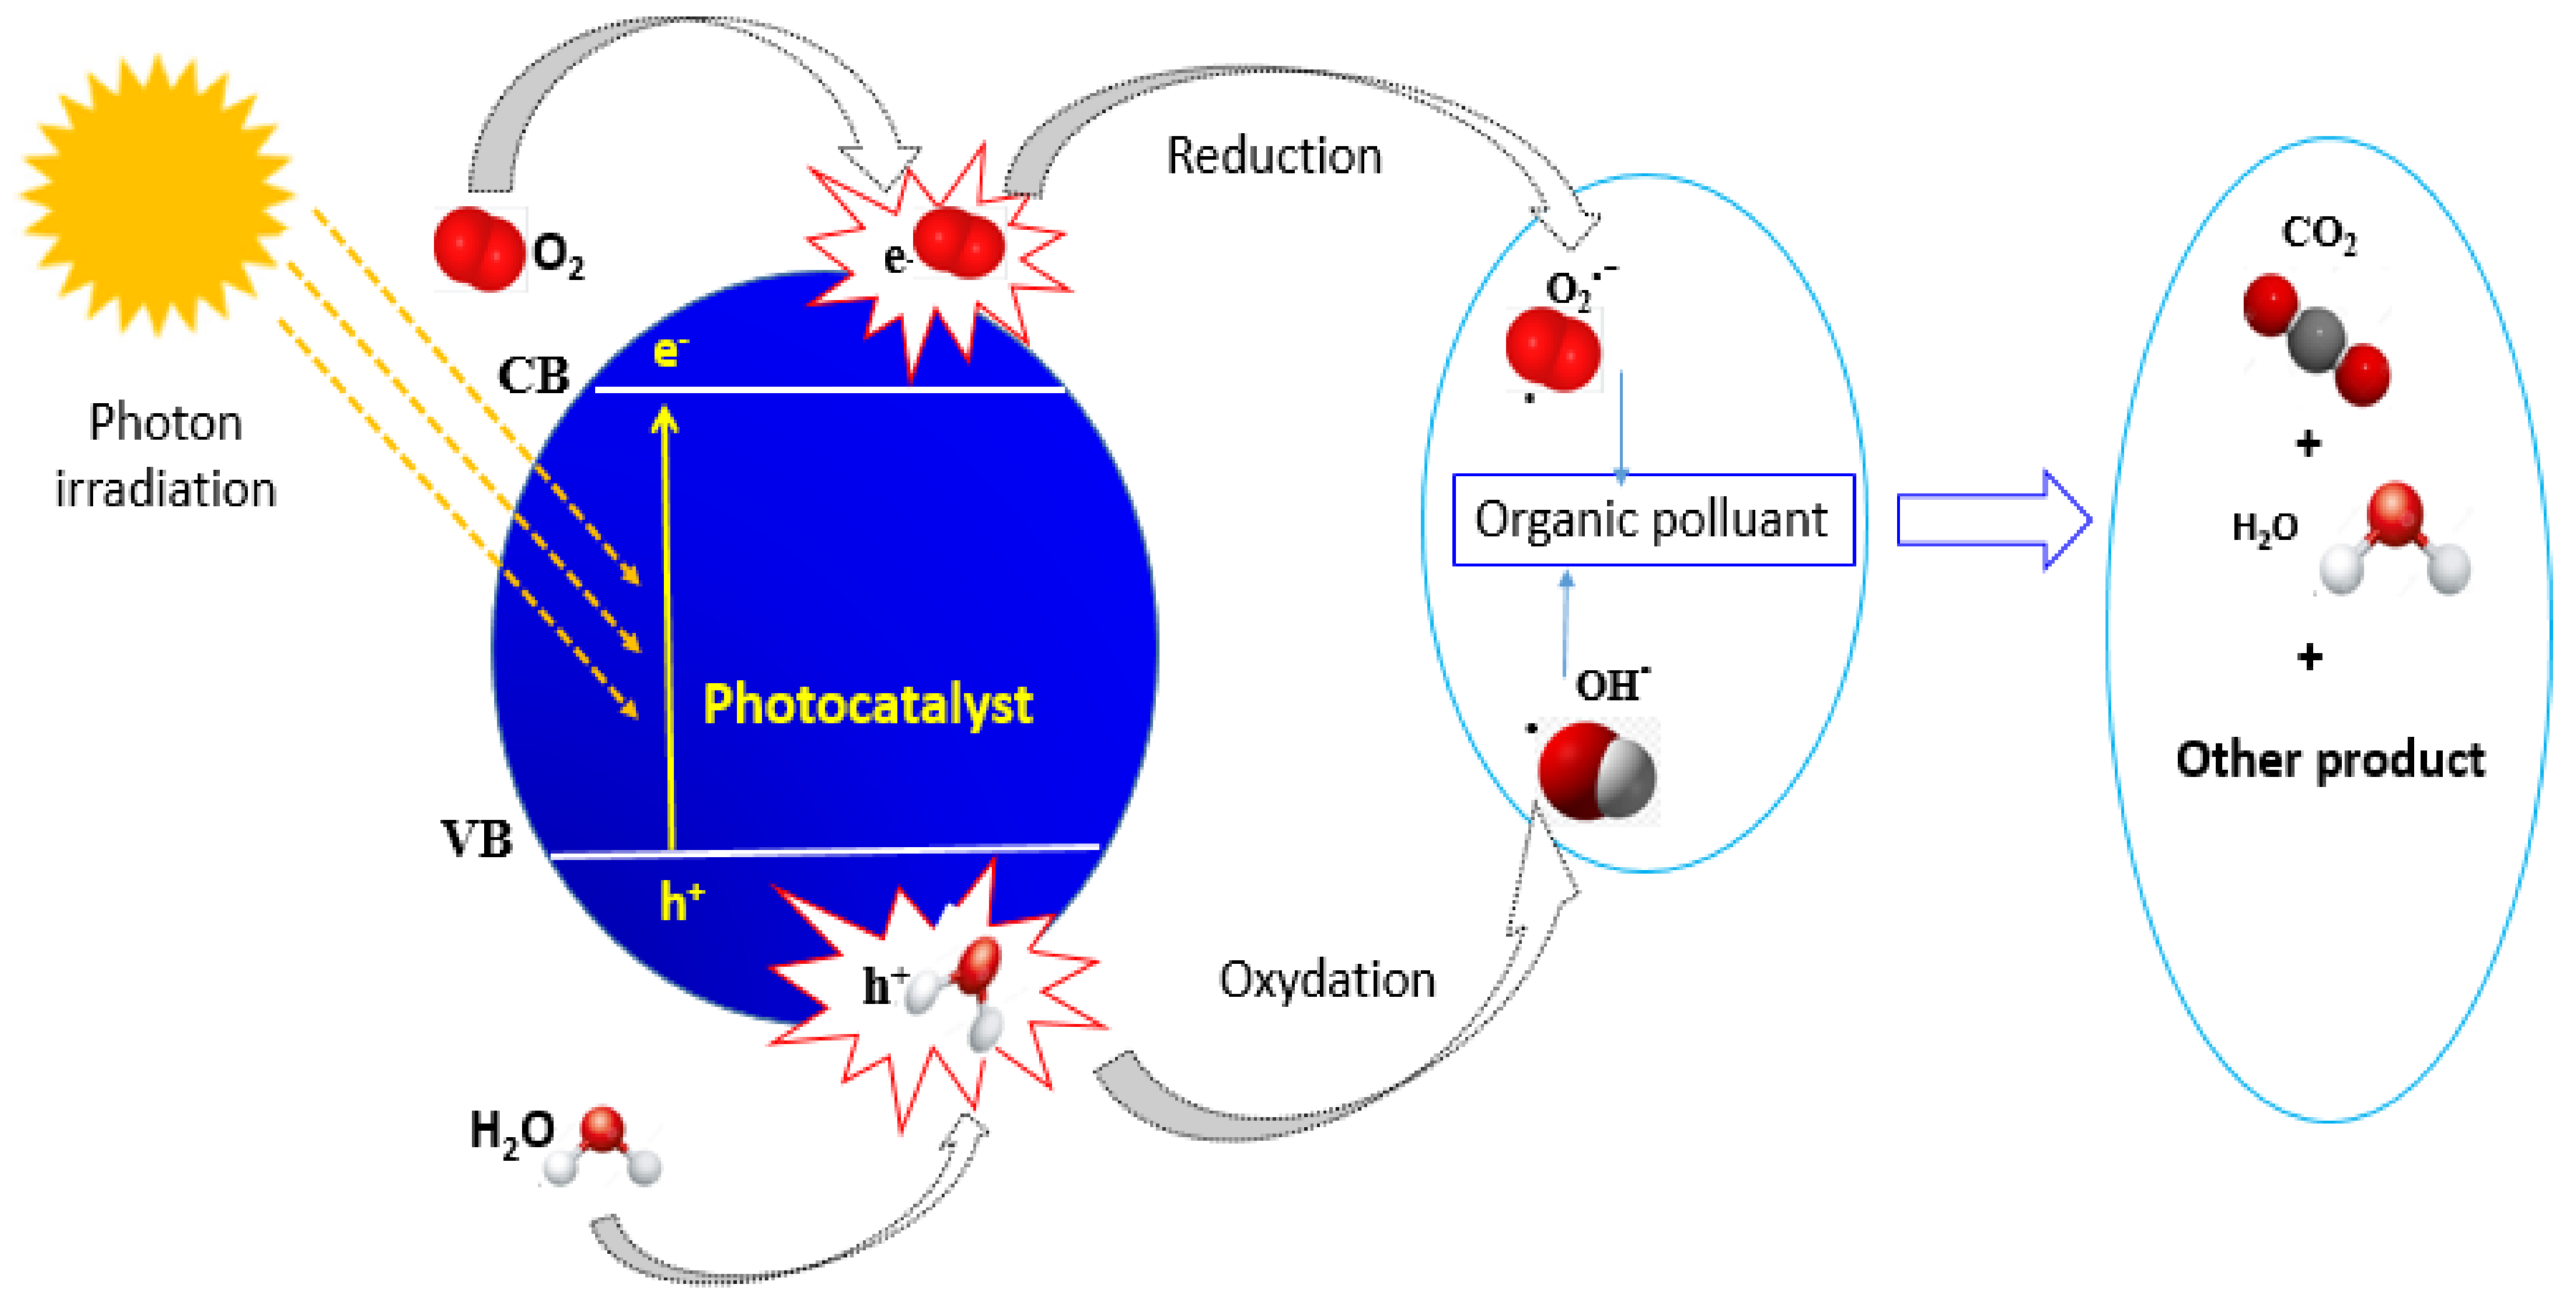
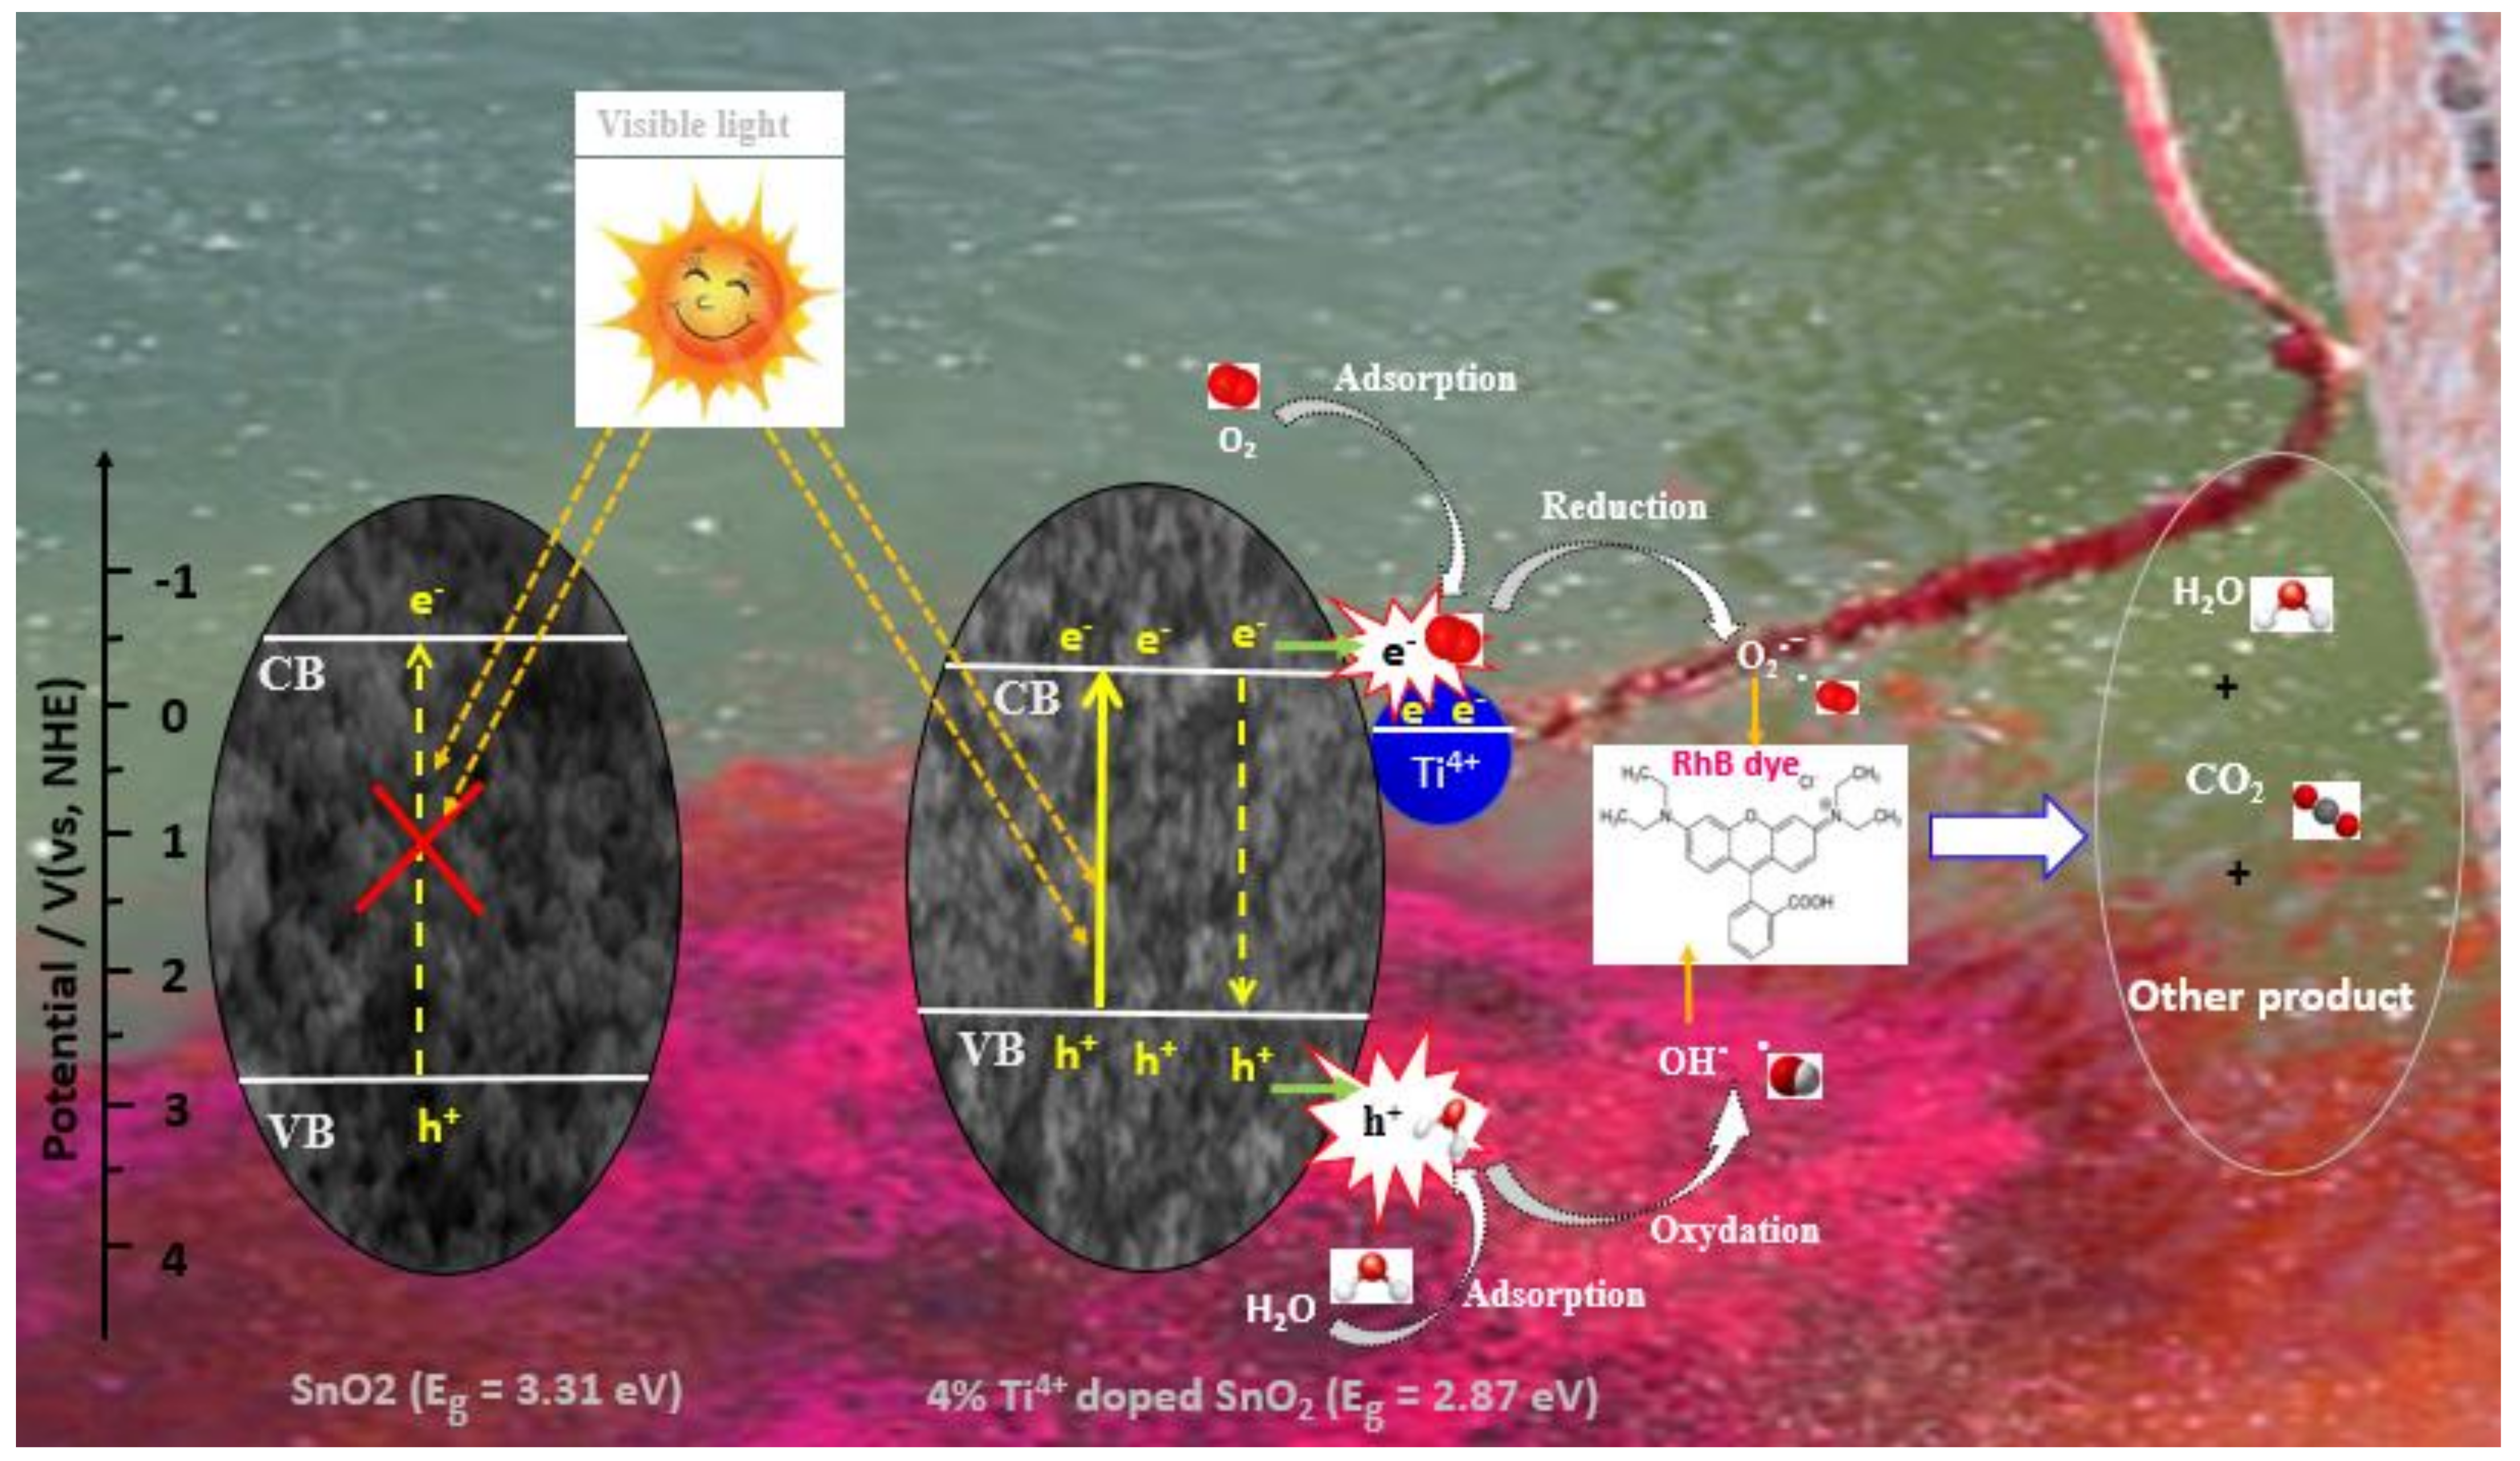
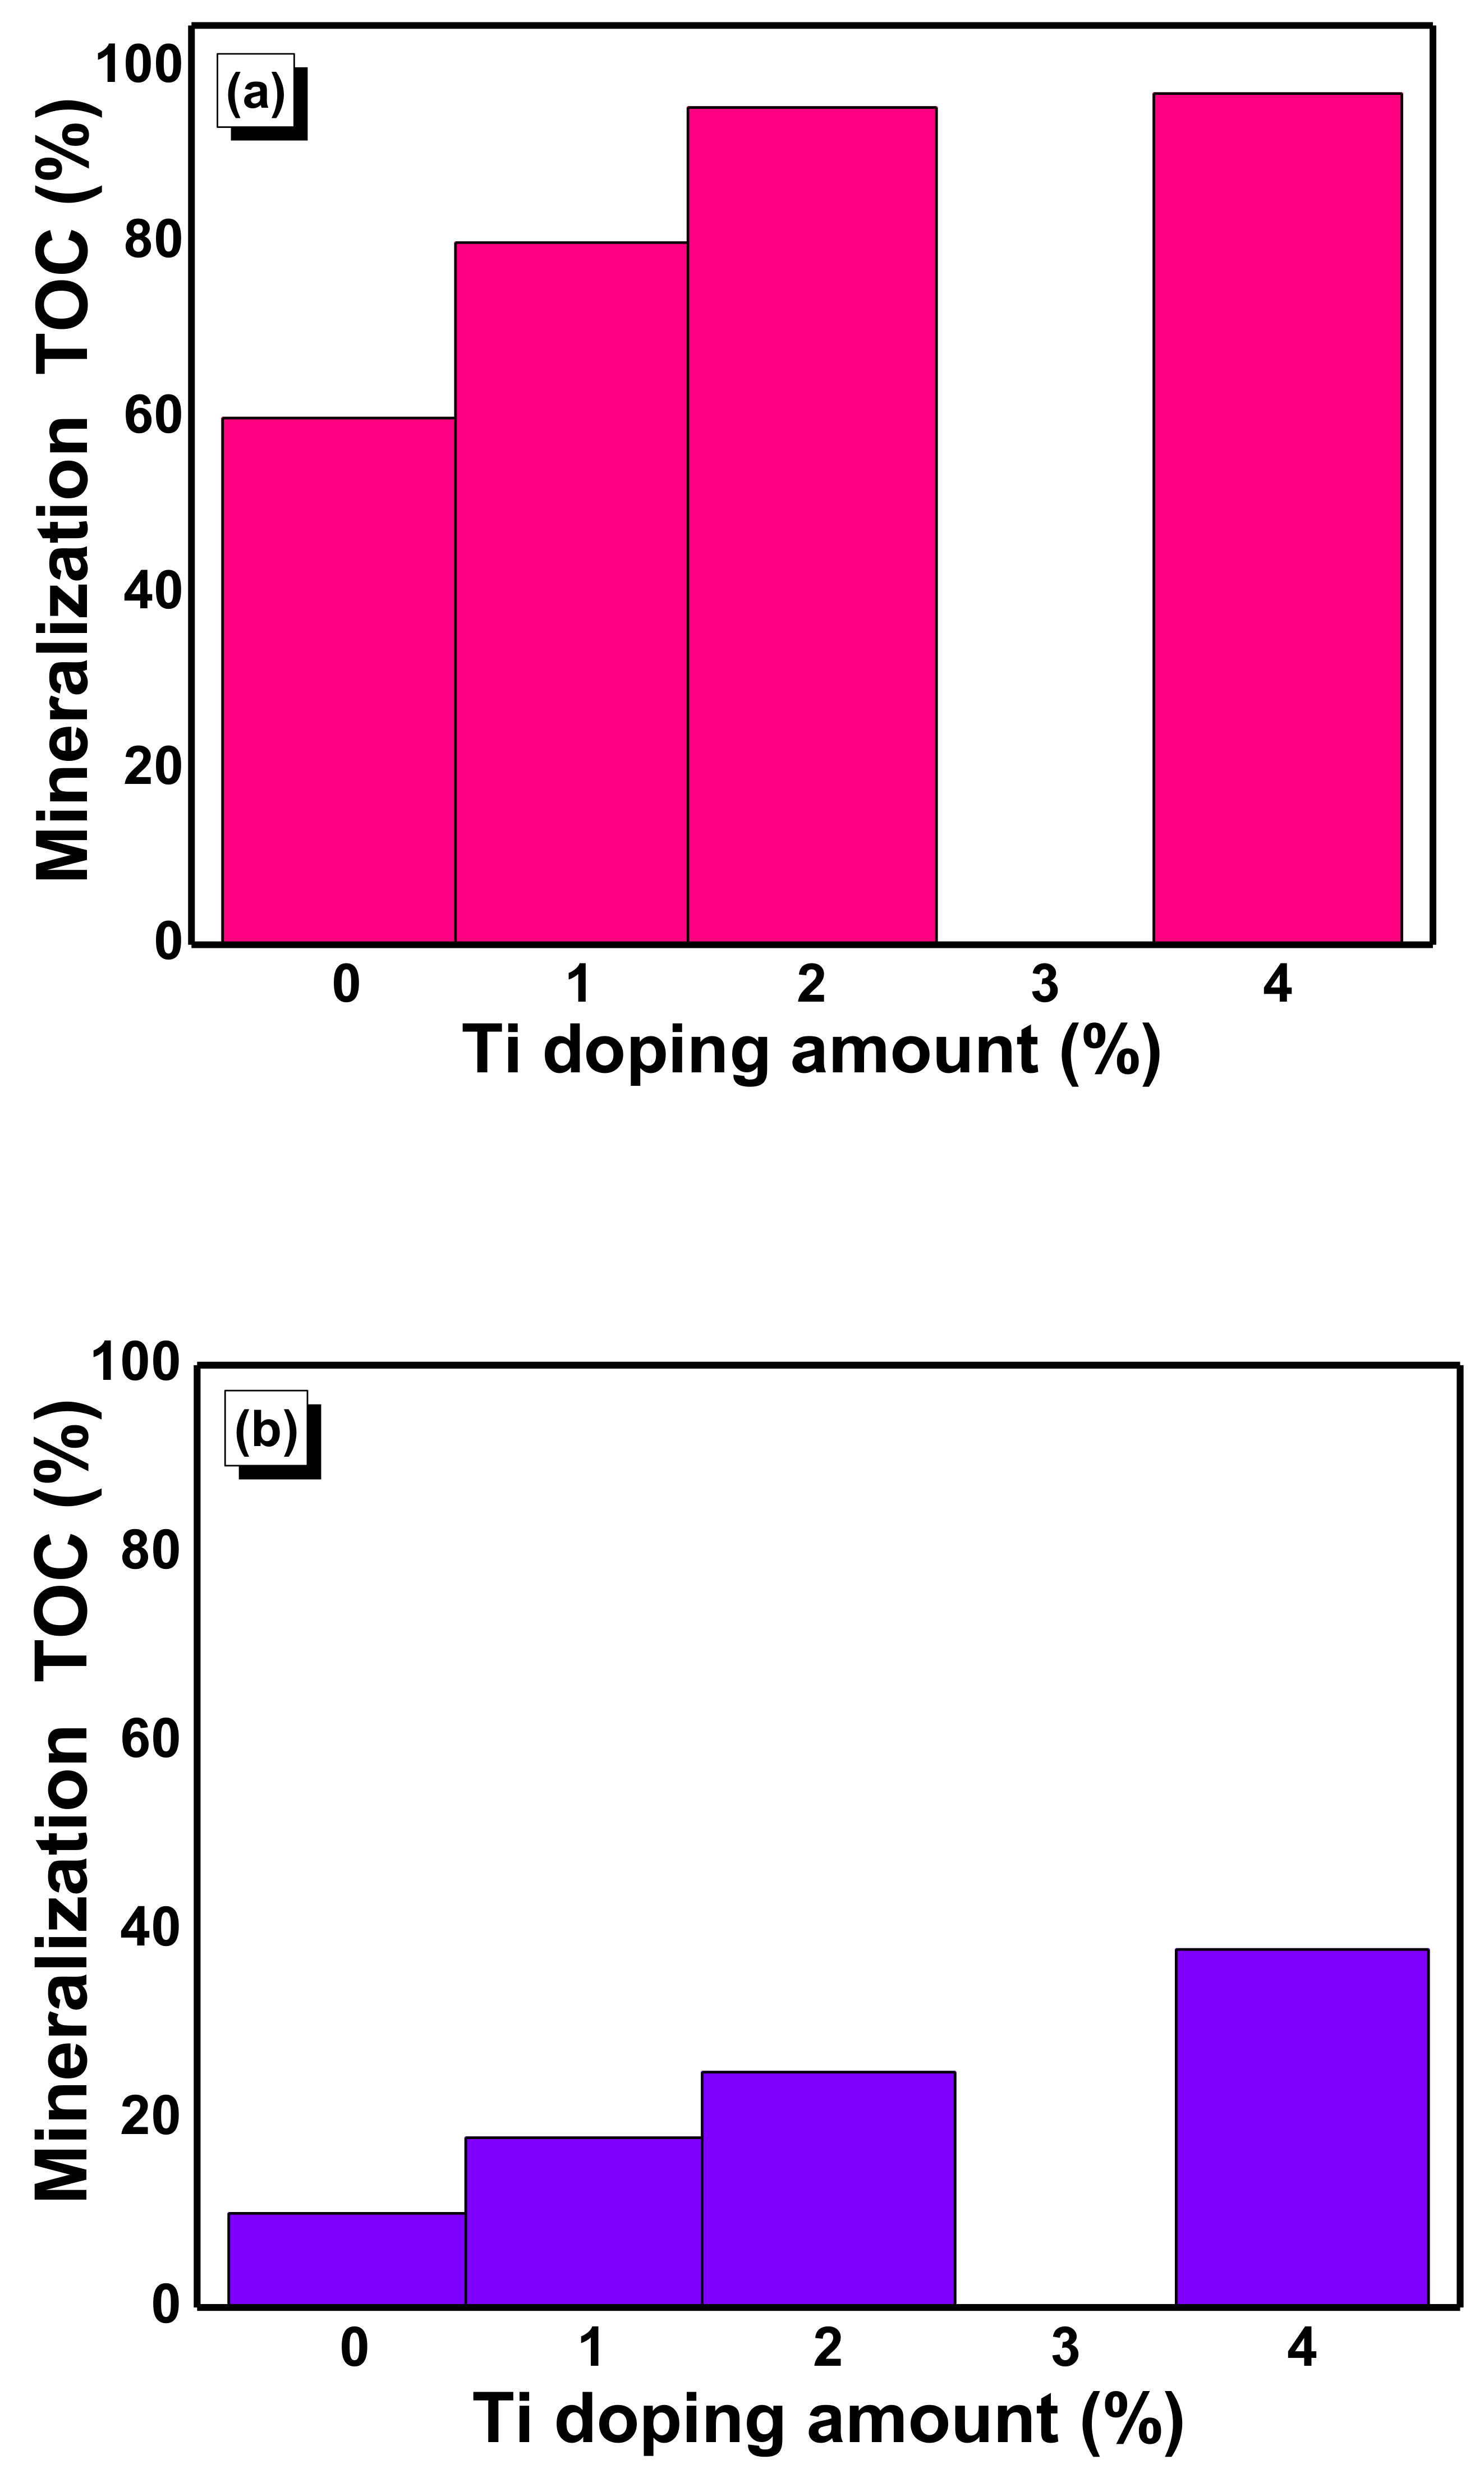
2.7. Photocatalytic Activity of Nanostructured Ti–SnO2 Photocatalysts
3. Experimental Details
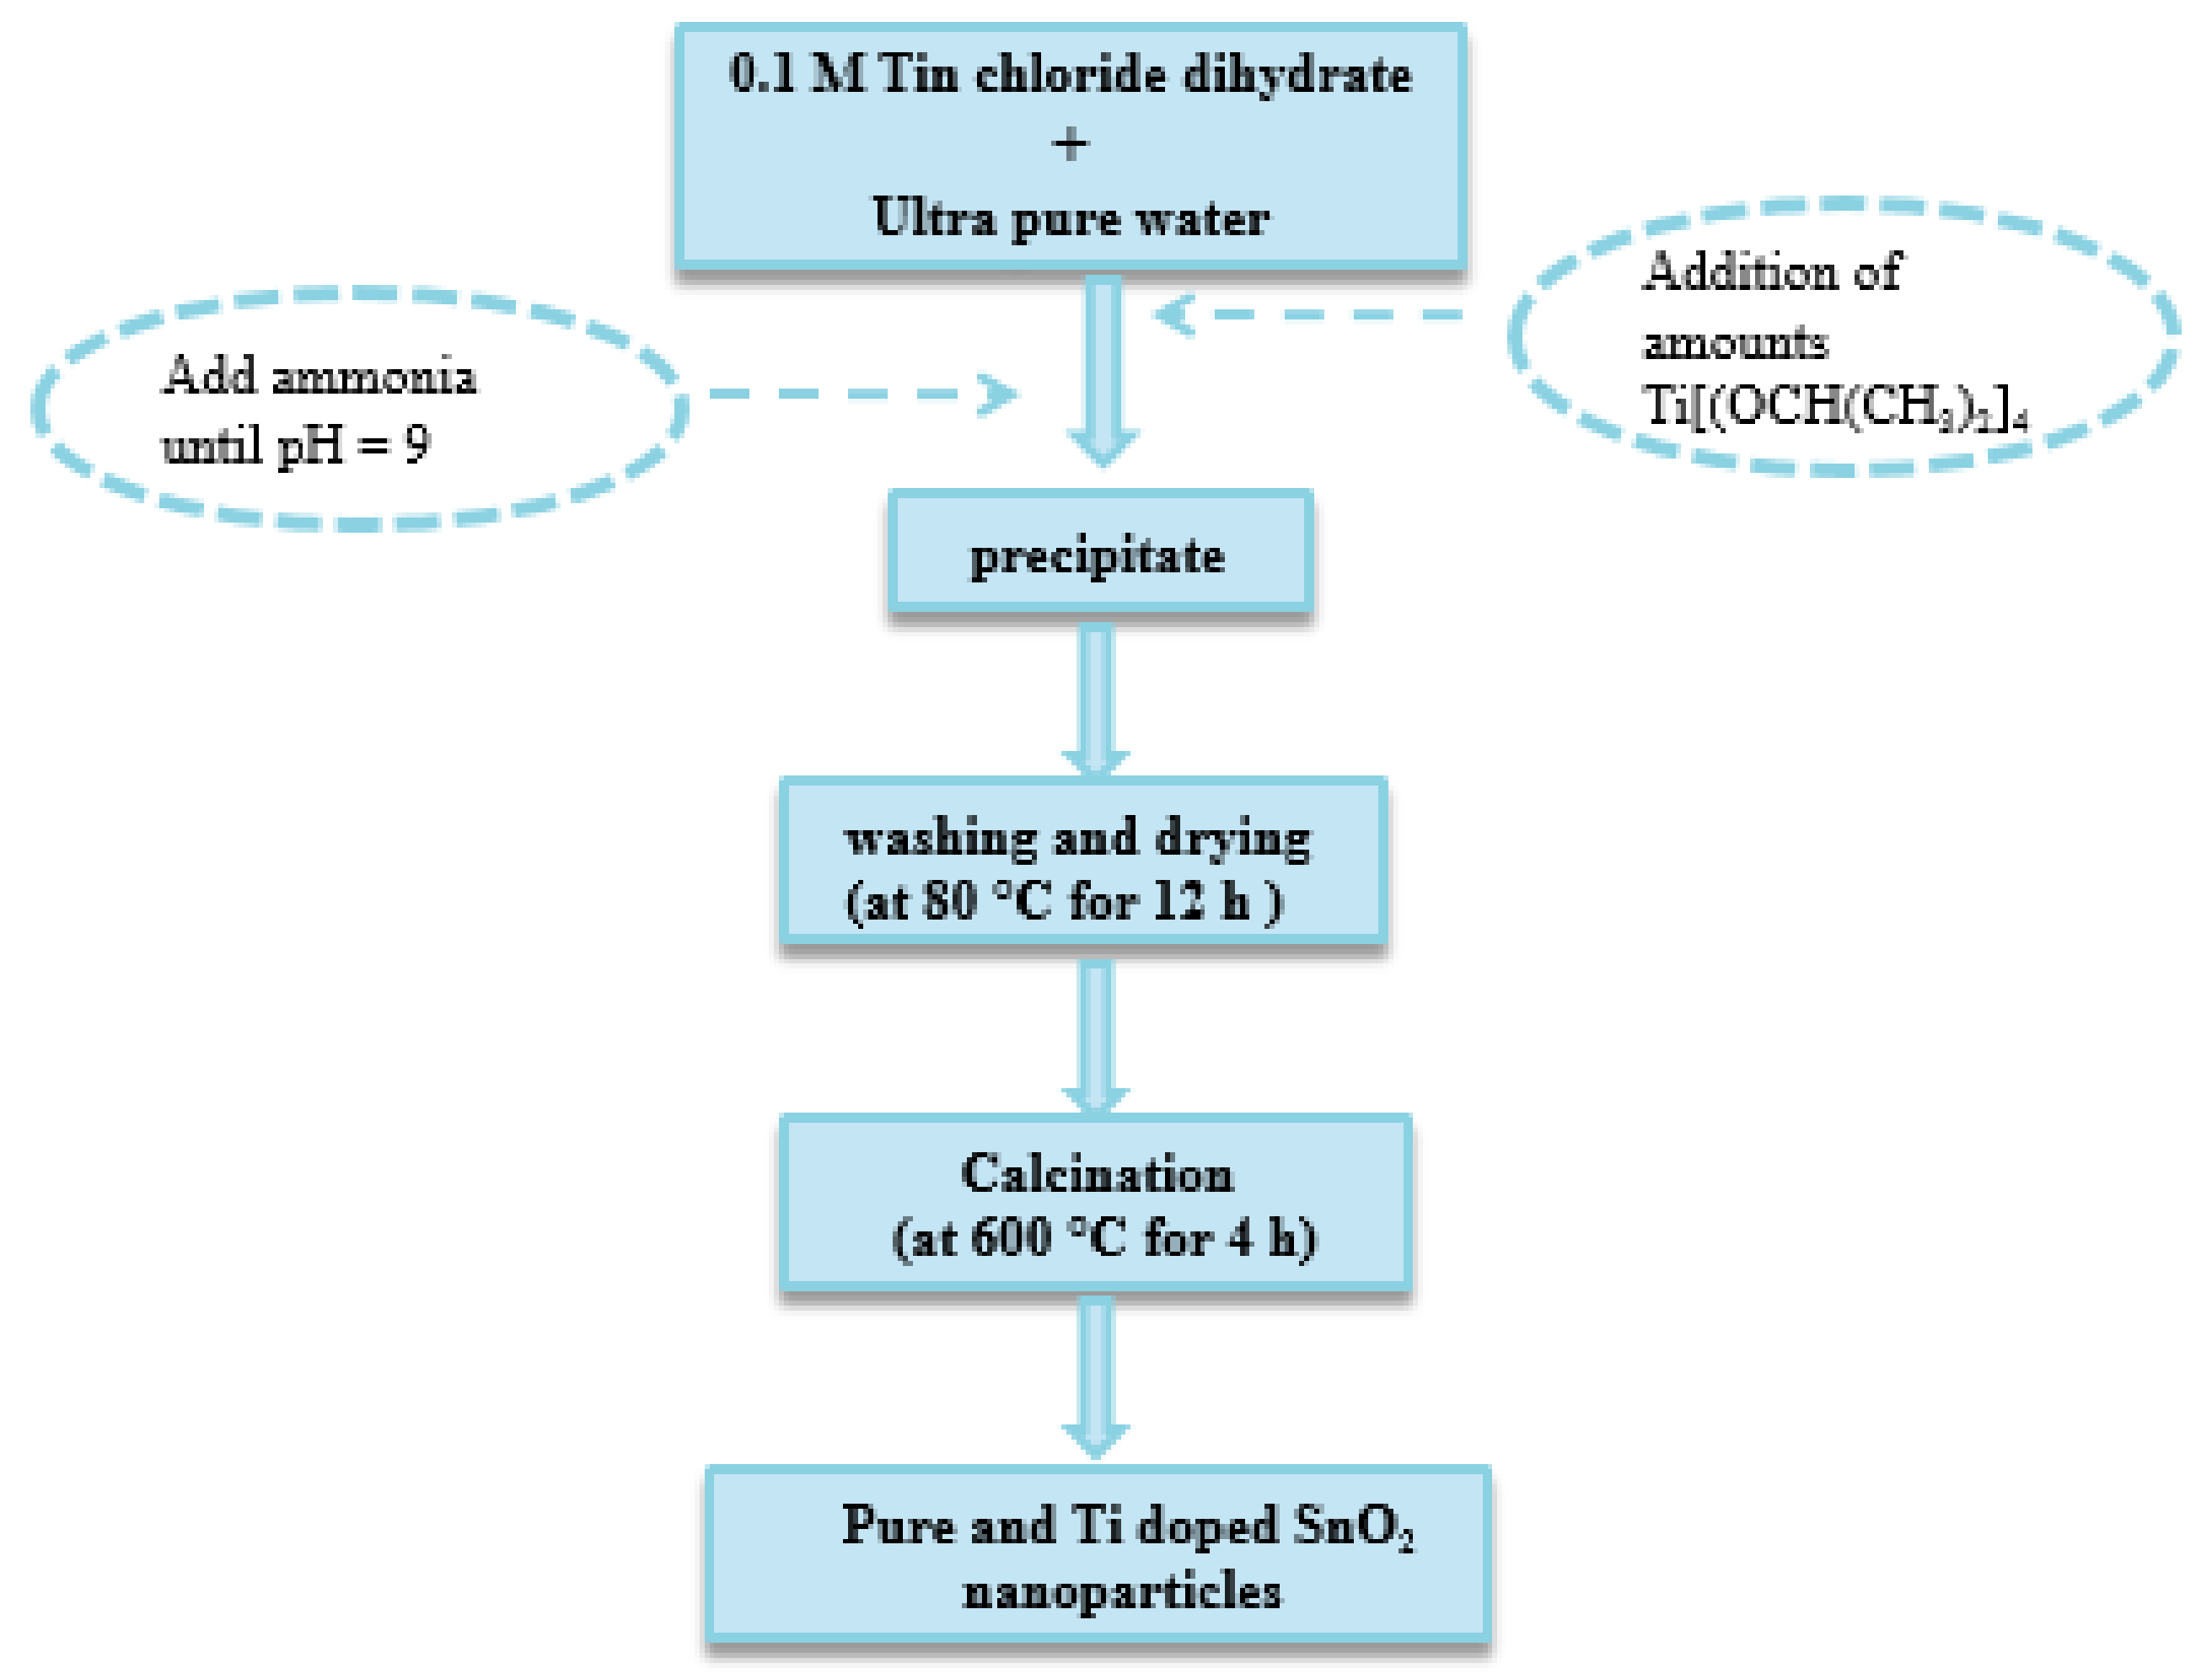
3.1. Preparation of Pure and Ti Doped SnO2 Nanoparticles
3.2. Samples Characterization
3.3. Photocatalytic Performance
4. Conclusions
Author Contributions
Funding
Data Availability Statement
Acknowledgments
Conflicts of Interest
References
- Zeng, G.M.; Chen, M.; Zeng, Z.T. Risks of neonicotinoid pesticides. Science 2013, 340, 1403. [Google Scholar] [CrossRef] [PubMed]
- Anandhan, M.; Prabaharan, T. Environmental impacts of natural dyeing process using pomegranate peel extract as a dye. Int. J. Appl. Eng. Res. 2018, 13, 7765–7771. [Google Scholar]
- Kaur, S.; Rani, S.; Mahajan, R.K.; Asif, M.; Gupta, V.K. Synthesis and adsorption properties of mesoporous material for the removal of dye safranin: Kinetics, equilibrium, and thermodynamics. J. Ind. Eng. Chem. 2015, 22, 19–27. [Google Scholar] [CrossRef]
- Ajmal, A.; Majeed, I.; Malik, R.N.; Idriss, H.; Nadeem, M.A. Principles and mechanisms of photocatalytic dye degradation on TiO2 based photocatalysts: A comparative overview. RSC Adv. 2014, 4, 37003–37026. [Google Scholar] [CrossRef]
- Eftekhari, S.; Habibi-Yangjeh, A.; Sohrabnezhad, S.H. Application of AlMCM-41 for competitive adsorption of methylene blue and rhodamine B: Thermodynamic and kinetic studies. J. Hazard. Mater. 2010, 178, 349–355. [Google Scholar] [CrossRef]
- Hirayama, J.; Kondo, H.; Miura, Y.-K.; Abe, R.; Kamiya, Y. Highly effective photocatalytic system comprising semiconductor photocatalyst and supported bimetallic non-photocatalyst for selective reduction of nitrate to nitrogen in water. Catal. Commun. 2012, 20, 99–102. [Google Scholar] [CrossRef] [Green Version]
- Li, Y.; Bastakoti, B.P.; Imura, M.; Hwang, S.M.; Sun, Z.; Kim, J.H.; Dou, S.X.; Yamauchi, Y. Synthesis of mesoporous TiO2/SiO2 hybrid films as an efficient photocatalyst by polymeric micelle assembly. Chem. Eur. J. 2014, 20, 6027–6032. [Google Scholar] [CrossRef]
- Bastakoti, B.P.; Sakka, Y.; Wu, K.C.-W.; Yamauchi, Y. Synthesis of highly photocatalytic TiO2 microflowers based on solvothermal approach using N, N-dimethylformamide. Nanosci. Nanotechnol. 2015, 15, 4747–4751. [Google Scholar]
- Pan, S.; Wang, S.; Zhang, Y.; Xu, S.; Kong, F.; Luo, Y.; Tian, Y.; Teng, X.; Li, G. Surface Fe3+-decorated pristine SnO2 nanoparticles with enhanced OH radical generation performance. Catal. Commun. 2012, 24, 96–99. [Google Scholar] [CrossRef]
- Agarwal, S.; Tyagi, I.; Gupta, V.K.; Sohrabi, M.; Mohammadi, S.; Golikand, A.N.; Fakhri, A. Iron doped SnO2/Co3O4 nanocomposites synthesized by sol-gel and precipitation method for metronidazole antibiotic degradation. Mater. Sci. Eng. C 2017, 70, 178–183. [Google Scholar] [CrossRef]
- Letifi, H.; Litaiem, Y.; Dridi, D.; Ammar, S.; Chtourou, R. Enhanced photocatalytic activity of vanadium-doped SnO2 nanoparticles in rhodamine B degradation. Adv. Condens. Matter Phys. 2019. [Google Scholar] [CrossRef] [Green Version]
- Reddy, C.V.; Babu, B.; Vattikuti, S.P.; Ravikumar RV SS, N.; Shim, J. Structural and optical properties of vanadium doped SnO2 nanoparticles with high photocatalytic activities. J. Lumin. 2016, 179, 26–34. [Google Scholar] [CrossRef]
- Rashad, M.M.; Ismail, A.A.; Osama, I.; Ibrahim, I.A.; Kandil, A.-H.T. Decomposition of Methylene Blue on Transition Metals Doped SnO2 Nanoparticles. Clean Soilairwater 2014, 42, 657–663. [Google Scholar]
- Babu, B.; Reddy, C.V.; Shim, J.; Ravikumar, R.V.S.S.N.; Park, J. Effect of cobalt concentration on morphology of Co-doped SnO2 nanostructures synthesized by solution combustion method. J. Mater. Sci. Mater. Electron. 2016, 27, 5197–5203. [Google Scholar] [CrossRef]
- Divya, J.; Pramothkumar, A.; Gnanamuthu, S.J.; Victoria, D.B. Structural, optical, electrical and magnetic properties of Cu and Ni doped SnO2 nanoparticles prepared via Co-precipitation approach. Phys. B Condens. Matter 2020, 588, 412169. [Google Scholar] [CrossRef]
- Ahmed, A.; Siddique, M.N.; Ali, T.; Tripathi, P. Enhanced Photocatalytic Performance of Ni-Doped SnO2 Nanoparticles. In AIP Conference Proceedings; American Institute of Physics: College Park, MD, USA, 2019; Volume 211, p. 030158. [Google Scholar]
- Selvi, R.T.; Nallaiyan, M.; Nisha, S.; Sagadevan, S.; Mohammad, F.; Sadaiyandi, K.; Raj, K.P.; Ashokkumar, L.; Latha, M.B.; Lett, J.A. Comparative studies on structural, optical, and biological properties of SnO2 and Ni-doped SnO2 nanocrystals. Mater. Res. Express 2019, 6, 125099. [Google Scholar] [CrossRef]
- Vignesh, K.; Hariharan, R.; Rajarajan, M.; Suganthi, A. Photocatalytic performance of Ag doped SnO2 nanoparticles modified with curcumin. Solid State Sci. 2013, 21, 91–99. [Google Scholar] [CrossRef]
- Wu, W.; Liao, L.; Zhang, S.; Zhou, J.; Xiao, X.; Ren, F.; Sun, L.; Dai, Z.; Jiang, C. Non-centrosymmetric Au–SnO2 hybrid nanostructures with strong localization of plasmonic for enhanced photocatalysis application. Nanoscale 2013, 5, 5628–5636. [Google Scholar] [CrossRef]
- Chang, Y.C.; Yan, C.Y.; Wu, R.J. Preparation of Pt@ SnO2 Core-Shell Nanoparticles for Photocatalytic Degradation of Formaldehyde. J. Chin. Chem. Soc. 2014, 61, 345–349. [Google Scholar] [CrossRef]
- Liu, X.M.; Wu, S.L.; Chu, P.K.; Zheng, J.; Li, S.L. Characteristics of nano Ti-doped SnO2 powders prepared by sol–gel method. Mater. Sci. Eng. A 2006, 426, 274–277. [Google Scholar] [CrossRef]
- Sakthiraj, K.; Balachandrakumar, K. Influence of Ti addition on the room temperature ferromagnetism of tin oxide (SnO2) nanocrystal. J. Magn. Magn. Mater. 2015, 395, 205–212. [Google Scholar] [CrossRef]
- Ran, L.; Zhao, D.; Gao, X.; Yin, L. Highly crystalline Ti-doped SnO2 hollow structured photocatalyst with enhanced photocatalytic activity for degradation of organic dyes. CrystEngComm 2015, 17, 4225. [Google Scholar] [CrossRef]
- Richardson, S.D.; Wilson, C.S.; Rusch, K.A. Use of rhodamine water tracer in the marshland upwelling system. Ground Water 2004, 42, 678. [Google Scholar] [CrossRef]
- Chen, C.; Liu, P.; Lu, C.H. Synthesis and characterization of nano-sized ZnO powders by direct precipitation method. Chem. Eng. J. 2008, 144, 509–513. [Google Scholar] [CrossRef]
- Wang, J.; Wan, Y.; Wang, X.; Pu, Y.; Ali, N.; Yuan, S.; Zhang, Q.; Bilal, M. Fabrication and characterization of inverse opal tin dioxide as a novel and high-performance photocatalyst for degradation of Rhodamine B dye. Inorg. Nano Metal Chem. 2021, 51, 150–158. [Google Scholar] [CrossRef]
- Ahmed, A.; Ali, T.; Naseem Siddique, M.; Ahmad, A.; Tripathi, P. Enhanced room temperature ferromagnetism in Ni doped SnO2 nanoparticles: A comprehensive study. J. Appl. Phys. 2017, 122, 083906. [Google Scholar] [CrossRef]
- Sujatha, K.; Seethalakshmi, T.; Sudha, A.P.; Shanmugasundaram, O.L.; Sujatha, K.; Seethalakshmi, T.; Sudha, A.P.; Shanmugasundaram, O.L. Photocatalytic activity of pure, Zn doped and surfactants assisted Zn doped SnO2 nanoparticles for degradation of cationic dye. Nano Struct. Nano Objects 2019, 18, 100305. [Google Scholar] [CrossRef]
- Dridi, D.; Bouaziz, L.; Karyaoui, M.; Litaiem, Y.; Chtourou, R. Effect of silver doping on optical and electrochemical properties of ZnO photoanode. J. Mater. Sci. Mater. Electron. 2018, 29, 8267–8278. [Google Scholar] [CrossRef]
- Asaithambia, S.; Sakthivela, P.; Karuppaiaha, M.; Sankara, U.; Balamurugana, K.; Yuvakkumara, R.; Thambiduraib, M.; Ravia, G. nvestigation of electrochemical properties of various transition metals doped SnO2 spherical nanostructures for supercapacitor applications. J. Energy Storage 2020, 31, 101530. [Google Scholar] [CrossRef]
- Alvarez-Roca, R.; Desimone, M.; da Silva, M.G.; Ponce, M.A.; Longo, E. Vanadium Doping Effect on Multifunctionality of SnO2 Nanoparticles. J. Mater. Appl. 2020, 9, 38–45. [Google Scholar] [CrossRef]
- Biag, A.B.A.; Vadamalar, R.; Jayanthi, P. Fabrication of Zr-doped SnO2 nanoparticles with synergistic influence for improved visible-light photocatalytic action and antibacterial performance. Appl. Water Sci. 2020. [Google Scholar] [CrossRef] [Green Version]
- Zhong, J.B.; Ma, D.; He, X.Y.; Li, J.Z.; Chen, Y.Q. Preparation, characterization and photocatalytic performance of TiO2/CexZr1− xO2 toward the oxidation of gaseous benzene. J. Mater. Chem. 2010, 256, 2859–2862. [Google Scholar] [CrossRef]
- Sohn, J.R.; Han, J.S.; Lim, J.S. Spectroscopic study of V2O5 supported on zirconia and modified with MoO3. Mater. Chem. Phys. 2005, 91, 558–566. [Google Scholar] [CrossRef]
- Srinivas, K.; Vithal, M.; Sreedhar, B.; Raja, M.M.; Reddy, P.V. Structural, optical, and magnetic properties of nanocrystalline Co doped SnO2 based diluted magnetic semiconductors. J. Phys. Chem. C 2009, 113, 3543. [Google Scholar] [CrossRef]
- Acharya, S.A.; Maheshwari, N.; Tatikondewar, L.; Kshirsagar, A.; Kulkarni, S.K. Ethylenediamine-mediated wurtzite phase formation in ZnS. Cryst. Growth Des. 2013, 13, 1369–1376. [Google Scholar] [CrossRef]
- Rahman, M.U.; Wei, M.; Xie, F.; Khan, M. Efficient dye-sensitized solar cells composed of nanostructural ZnO doped with Ti. Catalysts 2019, 9, 273. [Google Scholar] [CrossRef] [Green Version]
- Toloman, D.; Popa, A.; Raita, O.; Stan, M.; Suciu, R.; Miclaus, M.O.; Biris, A.R. Luminescent properties of vanadium-doped SnO2 nanoparticles. Opt. Mater. 2014, 37, 223–228. [Google Scholar] [CrossRef]
- Blessi, S.; MariaLuminaSonia, M.; Vijayalakshmi, S.; Pauline, S. Preparation and characterization of SnO2 nanoparticles by hydrothermal method. Int. J. Chem. Res. 2014, 6, 2153–2155. [Google Scholar]
- Rashad, M.M.; Ismail, A.A.; Osama, I.; Ibrahim, I.A.; Kandil AH, T. Photocatalytic decomposition of dyes using ZnO doped SnO2 nanoparticles prepared by solvothermal method. Arab. J. Chem. 2014, 7, 71–77. [Google Scholar] [CrossRef] [Green Version]
- Dridi, D.; Litaiem, Y.; Karyaoui, M.; Chtourou, R. Correlation between photoelectrochemical and photoluminescence measurements of Ag-doped ZnO/ITO photoanode. Eur. Phys. J. App. Phys. 2019, 85, 20401. [Google Scholar] [CrossRef]
- Soltan, W.B.; Ammar, S.; Olivier, C.; Toupance, T. Influence of zinc doping on the photocatalytic activity of nanocrystalline SnO2 particles synthesized by the polyol method for enhanced degradation of organic dyes. J. Alloys Compd. 2017, 729, 638–647. [Google Scholar] [CrossRef]
- Alam, U.; Khan, A.; Ali, D.; Bahnemann, D.; Muneer, M. Comparative photocatalytic activity of sol–gel derived rare earth metal (La, Nd, Sm and Dy)-doped ZnO photocatalysts for degradation of dyes. RSC Adv. 2018, 8, 17582. [Google Scholar] [CrossRef] [Green Version]


| Sample | (hkl) | d-Spacing (Å) | a = b (Å) | c (Å) | Average Crystallite Size from XRD (nm) |
|---|---|---|---|---|---|
| Pure SnO2 | (110) | 3.346 | 4.731 | 3.183 | 19.9 |
| (101) | 2.641 | ||||
| (211) | 1.764 | ||||
| SnO2: Ti 1% | (110) | 3.347 | 4.733 | 3.187 | 14.5 |
| (101) | 2.645 | ||||
| (211) | 1.762 | ||||
| SnO2: Ti 2% | (110) | 3.361 | 4.742 | 3.189 | 14 |
| (101) | 2.651 | ||||
| (211) | 1.765 | ||||
| SnO2: Ti 4% | (110) | 3.357 | 4.747 | 3.19 | 13.1 |
| (101) | 2.646 | ||||
| (211) | 1.766 |
| Samples | Specific Surface Area (m2/g) | Pore Volume (cm3/g) | Average Pore Size (nm) | Band Gap [eV] |
|---|---|---|---|---|
| pure SnO2 | 16.12 | 0.1274 | 2.06 | 3.31 |
| SnO2:Ti 1% | 19.03 | 0.1428 | 2.09 | 3.16 |
| SnO2:Ti 2% | 23 | 0.2161 | 2.15 | 3.01 |
| SnO2:Ti 4% | 55.3 | 0.3241 | 2.5 | 2.87 |
| Sample | Kapp(min−1)d1 | Kapp(min−1)d2 |
|---|---|---|
| Pure SnO2 | 0.011 | 0.0002 |
| SnO2: Ti 1% | 0.022 | 0.004 |
| SnO2: Ti 2% | 0.031 | 0.005 |
| SnO2: Ti 4% | 0.04 | 0.0057 |
Publisher’s Note: MDPI stays neutral with regard to jurisdictional claims in published maps and institutional affiliations. |
© 2021 by the authors. Licensee MDPI, Basel, Switzerland. This article is an open access article distributed under the terms and conditions of the Creative Commons Attribution (CC BY) license (https://creativecommons.org/licenses/by/4.0/).
Share and Cite
Letifi, H.; Dridi, D.; Litaiem, Y.; Ammar, S.; Dimassi, W.; Chtourou, R. High Efficient and Cost Effective Titanium Doped Tin Dioxide Based Photocatalysts Synthesized via Co-precipitation Approach. Catalysts 2021, 11, 803. https://doi.org/10.3390/catal11070803
Letifi H, Dridi D, Litaiem Y, Ammar S, Dimassi W, Chtourou R. High Efficient and Cost Effective Titanium Doped Tin Dioxide Based Photocatalysts Synthesized via Co-precipitation Approach. Catalysts. 2021; 11(7):803. https://doi.org/10.3390/catal11070803
Chicago/Turabian StyleLetifi, Hanen, Donia Dridi, Yousra Litaiem, Salah Ammar, Wissem Dimassi, and Radhouane Chtourou. 2021. "High Efficient and Cost Effective Titanium Doped Tin Dioxide Based Photocatalysts Synthesized via Co-precipitation Approach" Catalysts 11, no. 7: 803. https://doi.org/10.3390/catal11070803
APA StyleLetifi, H., Dridi, D., Litaiem, Y., Ammar, S., Dimassi, W., & Chtourou, R. (2021). High Efficient and Cost Effective Titanium Doped Tin Dioxide Based Photocatalysts Synthesized via Co-precipitation Approach. Catalysts, 11(7), 803. https://doi.org/10.3390/catal11070803