Article

The Effect of MoS2 Active Site Dispersion on Suppression of Polycondensation Reactions during Heavy Oil Hydroconversion

by
Khusain M. Kadiev
,
Anton L. Maximov
and
Malkan Kh. Kadieva
*
A.V. Topchiev Institute of Petrochemical Synthesis, Russian Academy of Sciences, 119991 Moscow, Russia
*
Author to whom correspondence should be addressed.
Catalysts 2021, 11(6), 676; https://doi.org/10.3390/catal11060676
Submission received: 24 April 2021 / Revised: 21 May 2021 / Accepted: 24 May 2021 / Published: 26 May 2021

Abstract

:
In this work, the composition, structural and morphological features, and particle size of the active phase of the catalyst (MoS2), synthesized in-situ during the heavy oil hydroconversion performed in continuous flow reactor on lab-scale pilot flow unit at T = 450 °C, P = 6.0–9.0 MPa, V = 1.0 h−1, H2/feed = 1000 nL/L, catalyst concentration C (Mo) = 0.01–0.08%wt have been studied. It has been shown that MoS2 formed during hydroconversion is represented by nanosized particles stabilized by polycondensation products as a result of strong adsorption and aggregation with the components of the hydroconversion reaction medium. The influence of morphological characteristics of catalyst nanoparticles on the feed conversion, the yield of gaseous and liquid products, and the quality of distillate fractions, as well as the yield of polycondensation products, have been studied. It has been established that an increase in MoS2 active site dispersion, both due to a decreased plate length and lower stacking numbers in MoS2 cluster, enhances hydroconversion effectivity, particularly, in suppressing polycondensation reactions.

1. Introduction

Development and introduction of novel resource-saving technologies is the main trend of the oil refining industry in economically developed countries. Due to the ever-growing world demand for energy, much attention is paid to the deep processing of fossil hydrocarbons (heavy oils, bitumen) and the involvement of secondary raw materials (heavy oil residues, polymer waste, non-food biomass waste) in the fuel production. The increasing proportion of heavy oil in overall extracted raw materials and the need for deeper oil refining to at least 95% are the main factors indicating the importance of research and development of new selective methods for heavy oil processing to produce distillate fractions. These processes should be based on breaking C–C, C–S, C–N bonds in high molecular oil components and hydrogenation of the resulting radical fragments, providing selective conversion of heavy raw materials with the formation of less branched hydrocarbons with a higher hydrogen/carbon ratio [1].
Heavy crude oil is a complex dispersed system tending to rapid destabilization under thermal reactions. Heterorganic components, resins, and asphaltenes produce unstable radical fragments during thermal destruction, which are involved in polycondensation and polymerization (in the absence of suppressing factors). This leads to the formation of coke deposits and almost irreversible deactivation of traditional supported heterogeneous catalysts. Efficient processing of heavy organic feedstock requires development and introduction of fundamentally new catalytic systems [2]. The nature and characteristics of the catalyst are among the most important tools for achieving high performance indicators for heavy oil conversion in thermal processes involving hydrogen [1,3,4,5].
Advanced solutions to deep processing of heavy petroleum feedstock have been found during the development of hydrogenation processes (hydroconversion, hydrocracking) performed in the presence of nanosized catalysts formed in slurry reactors without traditional catalyst carriers [2,4,6,7,8,9,10]. Today, several hydrogenation processes for heavy oil processing using nanosized dispersed catalysts in slurry reactors have been scaled to the pilot, pilot-industrial and industrial levels [11]. It is possible to synthesize catalysts ex-situ preparing nanosized suspensions [12,13] and prepare the catalyst in-situ in the reaction medium [14,15,16].
In-situ synthesis of the nanosized hydrocarbon hydrogenation catalysts is by far the most studied area. The active form of the catalyst (metal sulfide) is formed in-situ from precursors (metal salts). Metal sulfide forms in the reactor upon contact with the processed feed under the high temperature in a reducing medium. A sulfidizing agent (H2S) forms by thermolysis of sulfur-containing feed components. Most researchers agree that molybdenum disulfide is the most effective hydroconversion catalyst, which can be formed in the reaction medium either from oil-soluble precursors (molybdenum carbonyl or naphthenate) or reverse emulsions of ammonium molybdate [15,17,18].
During heavy oil hydrogenation, the active sites of nanosized catalyst particles provide mainly two processes: hydrogenation and hydroconversion of destruction products of high molecular components and suppression of polycondensation and polymerization of high molecular radical fragments leading to coke formation. Therefore, the parameters characterizing the efficiency of the catalyst and the overall process are [19]: (1) hydrogen activation estimated by the hydrogen chemical consumption or TOF, (2) distillation product yield as a result of feed conversion; (3) polycondensation product (coke) yield. Enhanced efficiency is associated with an increase in the first two parameters and a decrease in the last one. As a result, total feedstock conversion with the addition of a catalyst may even decrease, but the liquid product selectivity may rise [9,20]. Practically, during hydroconversion of heavy oil feedstock [21], the unconverted heavy part of the feedstock and nanoscale catalyst can be returned to the process (recycled) in a single stream without intermediate separation [9,21,22]. The nanosized catalyst retains its activity upon repeated recycling to a hydroconversion reactor [9,16,21]. Recycle of the unconverted residue allows to achieve high feed conversion with the effective coke suppression (not exceeding 0.1%wt.).
The study of nanosized catalyst particles removed from the reactor with recyclable residue allows to relate their structure features to catalytic activity [9,14]. It is traditionally considered that layered molybdenum sulfide stacking act as the active phase of sulfide catalysts, for which two types of sites are distinguished—rim sites of the lower and upper sulfide layers active in hydrogenation reactions, and edge sites of the inner layers active in hydrodesulfurization [23,24,25]. The structure of MoS2 clusters formed during in-situ hydroconversion (morphology and geometric parameters) and the relative amounts of different sites largely determine the hydrogenation activity, heteroatomic compounds, and inhibition of high molecular compounds during the conversion of model compounds [23,26,27] and crude oil [9,16]. Understanding the characteristics of the active catalyst phase is extremely important for explaining its functioning and controlling its activity, as was shown in References [9,16,18], when studying heavy feed hydroconversion in a slurry reactor for catalysts obtained from oil-soluble precursors. There are no data on studying the effect of the properties of particles formed from reverse molybdate emulsions in a continuous flow reactor.
The aim of this work is to study the composition, structural and morphological features and particle sizes of the active catalyst phase (MoS2) synthesized in-situ from reverse emulsions of ammonium molybdate during heavy oil hydroconversion in continuous flow mode, as well as their influence on the feed conversion efficiency, mainly for hydrogenation functions evaluated by suppressing polycondensation.

2. Results and Discussion

2.1. Hydroconversion Results

According to previous research [14], it was established that the size and morphology of a molybdenum-containing catalyst formed in-situ in a continuous flow reactor in hydroconversion process depend both on the impact of polycondensation reactions, i.e., yield of coke, and on the content of converted feed, i.e., conversion. It was also observed that under the conditions destabilizing the catalyst disperse state in the reaction medium the aggregation of monolayer MoS2 particles into packs and spheres and their adsorption on the coke particles takes place. The catalyst almost quantitatively concentrates in solid polycondensation products (coke) and in 500 °C+ fraction of hydroconversion products, which makes it possible to separate and investigate the catalyst nanoparticles [14].
In this research, the study of the catalyst effects on hydroconversion activity, especially on suppression of polycondensation reactions, was conducted in two series of experiments with varying catalyst concentrations and total pressure in the reaction zone (Table 1). The catalyst activity was evaluated by the yields and properties of hydroconversion products, and by values of 360 °C+ conversion and yield of polycondensation solids (yield of toluene insolubles (TI)). The active phase of the catalyst was observed as a component of TI samples and analyzed by elemental analysis and transmission electron microscopy (with electron diffraction) methods.
The loading of catalyst precursor in tests #1–3 (Table 1) was varied in the range of 0.01–0.08%wt. (counting on Mo). Tests #2, 4–5 were conducted at constant precursor loading (i.e., constant catalyst concentration) at different total pressure in reactor (P = 60, 70 and 90 atm). The results for non-catalytic test also are presented in Table 1.
The yields of gaseous and distillate products, as well as properties of distillate products, are presented in Table 2 and Table 3.
The results on both experimental series show that rate of feed conversion and undesired impact of polycondensation reactions depend on the amount of catalyst (i.e., precursor loading) and on the pressure significantly. With other things being equal, the results for non-catalytic and catalytic tests compared show that the catalyst introduction into the reactant mixture significantly affects conversion rates by reducing the 360 °C+ conversion and yield of polycondensation products. Higher content of lighter hydrocarbons (components of IBP–180 °C and 180–360 °C fractions) and sulfur in them, compared to the feed (Table 2 and Table 3), apparently, results from decomposition of sulfur-containing and high-boiling components of 520 °C+ feed fraction under the experimental conditions.
The catalyst precursor loading increased from C(Mo) = 0.01 to 0.08%wt. (tests #1, 2, 3) resulted in decrease of 360 °C+ conversion and polycondensation solids yield (by 6 times). At the same time, a decrease in the gaseous products yield is observed. The yields of IBP–180 °C and 180–360 °C fractions are lower (Table 2), as well as the sulfur content in them (Table 3). The sulfur content in 360–520 °C fraction of feed and sulfur content in 360–520 °C fraction of catalytic hydroconversion products are similar and almost stable with an increase of catalyst loading. The content of unsaturated compounds in IBP–180 °C and 180–360 °C fractions estimated by iodine numbers is nonmonotonic: it increases at 0.05%wt. Mo (test #2) and reaches the lowest values at 0.08%wt. of Mo (test #3).
Thus, dispersed catalyst decreases the overall conversion towards the desired valuable products. At the same time, the catalyst decreases the buildup of both coke and gaseous products.
The total pressure increase complexly affected the effectivity of hydroconversion (Table 1). An increase of pressure in the range of 60–70 atm (tests #4 and 2) leads to an increase in the 360 °C+ conversion (by 5.4%). At the same time, polycondensation products yield increases significantly (by 0.9%—almost 4 times). At the higher pressure (90 atm, test #5) a slight decrease in 360 °C+ conversion (by 1.6%) is observed compared to 70 atm. The yield of polycondensation products dropped significantly (by 0.9%wt.).
In all the experiments, the values for 360 °C+ conversion, as well as for polycondensation solids yield, are lower in the presence of a catalyst, than in its absence.
In the pressure variation series, the highest gaseous products yield, and the lowest yield of IBP–180 °C and 180–360 °C, fractions are obtained after hydroconversion at P = 60 atm (test #4) (Table 2). At higher pressure, at P = 70 and 90 atm (test #2, 5), the yield of gaseous and distillate products does not change, except for for IBP–180 °C, 360–520 °C with slight change of these values. The sulfur content in IBP–180 °C and 180–360 °C fractions raise with the pressure to highest values at P = 70 atm and then decreased at P = 90 atm. The content of sulfur for 360–520 °C and content of unsaturated compounds for IBP–180°C and 180–360 °C fractions are lower at higher pressures.

2.2. Elemental Composition of Polycondensation Products

The polycondensation products (i.e., TI) extracted from 520 °C + fraction of hydroconversion products were investigated by bulk elemental analysis to determine the contents of N, C, H, S, and Mo. Then, values of H/C and S/Mo ratios for the TI samples were calculated. H/C ratio is supposed to characterize the aromaticity degree of the organic compounds, and S/Mo ratio allows to evaluate the completeness of molybdenum sulfidation.
The results presented in Table 4 show that a predominance element in the composition of TI solids is carbon. S/Mo values for TI samples are higher than for MoS2 and lie in a wide range (2.3 < S/Mo < 42). It may indicate almost complete sulfidation of molybdenum during in-situ formation in hydroconversion reactor.
In addition, nitrogen is observed in the composition of TI samples (Table 4), which can be associated with some species of ammonium salts (ammonium sulfate, etc.).
H/C value makes ~0.1 (wt.) or 1.2 (atomic), which is close to that determined for asphaltenes (1.0–1.2) [28,29,30]. Many researches [11] had discussed the role and the nature of carbonateous matrix, which MoS2 nanoparticles are strongly associated with. Asphaltene molecules are known to possess polarity and tend to interact with different solid surfaces resulting in sorbtion and stabilizing catalyst particles [31]. In Reference [30], it was noted that MoS2-based catalyst particles were stabilized by the components of reaction medium. The composition of these hydrocarbon stabilizing compounds is identical to that of heptane-insoluble asphaltenes separated from the same feed. The composition of the catalyst stabilized by carbon-containing components it was proposed in Reference [30] to describe with the formula MoSxCy, where the x and y values increase with decreasing MoS2 particle size. Asphaltenes most tend to interact with the dispersed phase of the hydroconversion medium even at the reverse emulsion preparation stage compared to other oil disperse system components [32]. Formation of the carbon-containing matrix strongly adsorbing nanoscale particles of the unsupported catalyst for hydroconversion process was observed in researches concerning in-situ and ex-situ sulfidation of nanosized hydroconversion catalysts [2,33]. The composition of polycondensation products expressed by the gross formula MoSxCy is given in Table 4. It can be seen that the x and y values for in-situ synthesized catalysts vary over a wide range (2.3 < x < 42; 34 < y < 1359) and significantly exceed those given in Reference [30], which may indicate small MoS2 particle size in the studied TI samples.

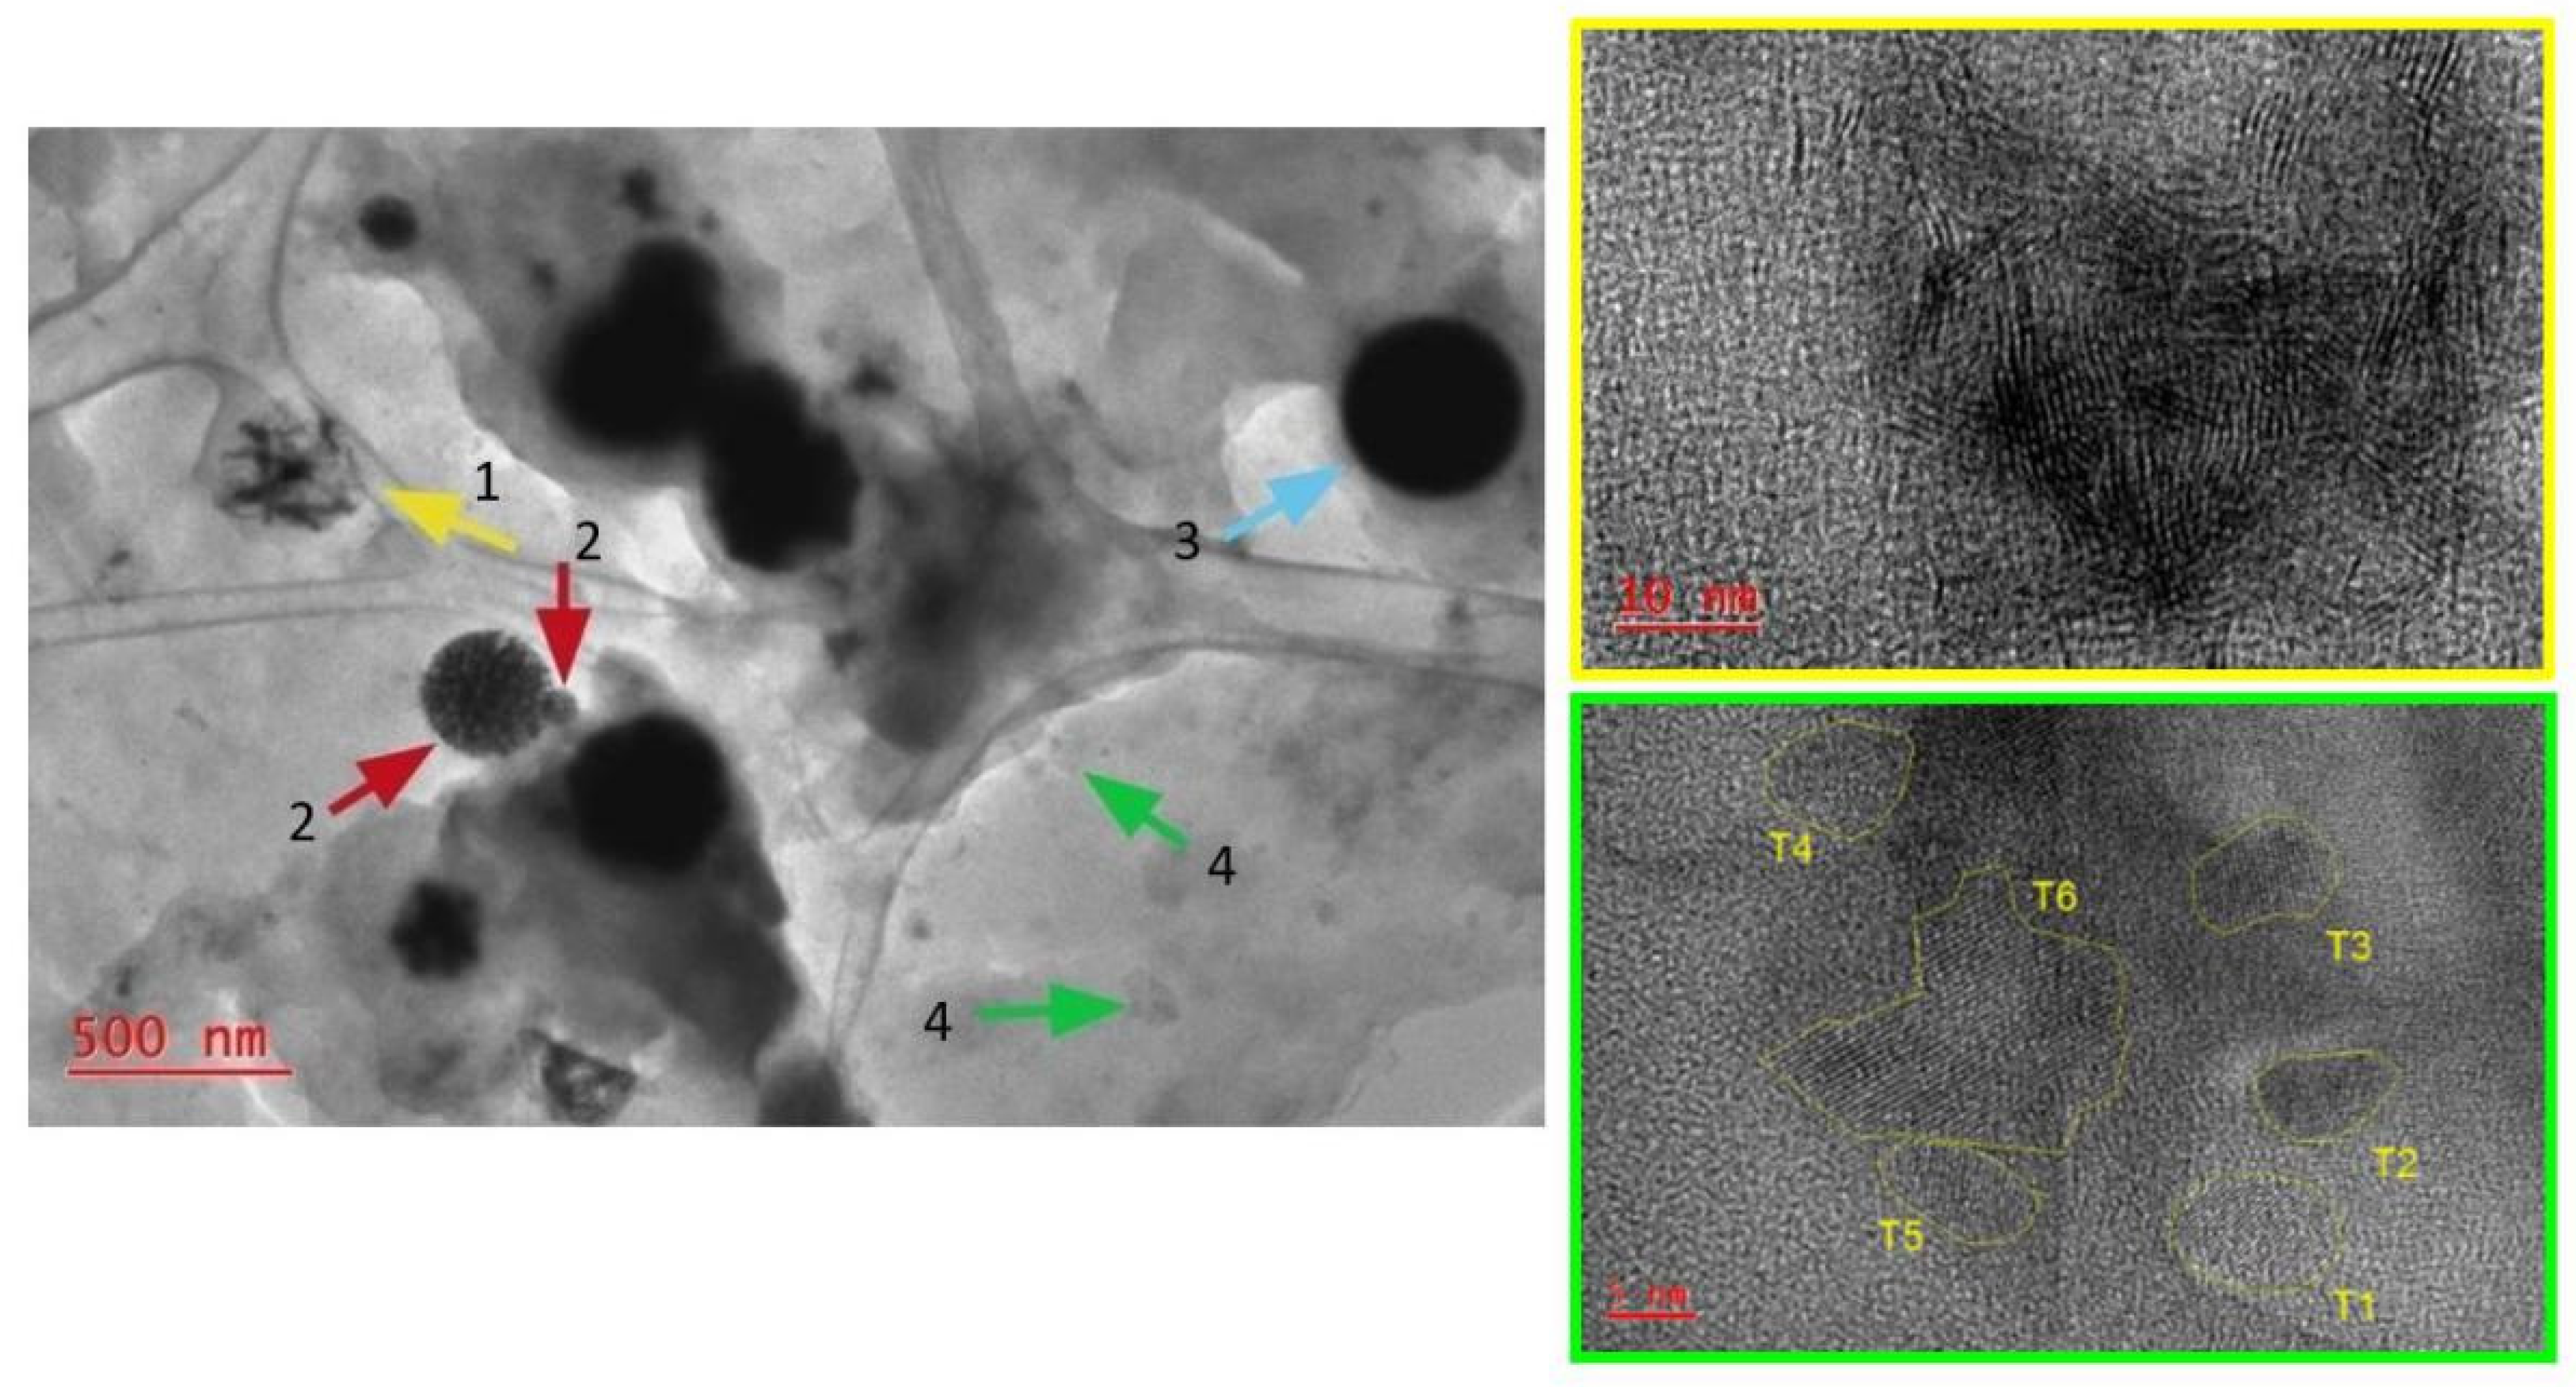
2.3. Study of Catalyst Particles Dispersity and Composition

TEM results for polycondensation products corresponding to experimental series with precursor loading variation (#1–3) and total pressure variation (#2, 4–5) are presented in Figure 1 and Figure 2 (and Supplementary Figures S1–S8).
A translucent matrix that contains more contrasting particles of different morphology and structure were observed by TEM for all the TI samples. According to References [14,17], more contrasting particles observed on TEM images always contain precursor metals and may be interpreted as Mo-containing catalyst particles, while translucent matrix mainly consist of carbon and may be interpreted as carbon-containing matrix. A diffraction pattern for the carbon-containing matrix indicated predominantly amorphous nature of the matrix (Supplementary Figure S1).
The results of TEM study and analysis results for the polycondensation products are summarized in Table 5. The interpretation of TEM images for molybdenum sulfide-based catalysts is discussed in literature [11,18,34,35,36]. As a rule, molybdenum sulfide particles on TEM images are displayed by the fragments with a layered structure and dark bands, which are parallelly grouped or disoriented, corresponding to the molybdenum sulfide crystal lattice oriented by the basal plane along the microscope electron beam [34]. In our research, layered formations of Mo sulfide produced in-situ during bituminous oil hydroconversion under flowing conditions display morphological diversity. For example, Figure 1 for the TI sample from test #2 (C(Mo) = 0.05wt.%, P = 70 atm) contains images of irregular formations (by arrow 1), spherical porous particles (arrows 2), bulk spherical particles (arrow 3), and polycrystals consisting of nanocrystallites (arrows 4). Particles with a layered contrast observed had interplanar distance values of 0.62–0.65 nm. This may correspond to MoS2 or Mo3S4 phases: interplanar distance for (002) MoS2 plane—6.15 A and for (101) Mo3S4 plane—6.4 A. According to some relevant studies [8,9,15,37], formation of Mo3S4 under the test conditions seems unlikely, as Mo3S4 does not appear under the conditions of MoS2 synthesis. Mo3S4 can be synthesized from the complex compounds like MxMo3S4 and under severe conditions (1000 °C) [38,39]. However, based on our previous experience [2,14,17] and XRD-results (Supplementary Figure S12), since uncontrolled behavior features of the reverse emulsions and high pressure effect are possible, presence of the Mo3S4 cannot be dismissed.
In Reference [14], authors postulated possible presence of the same MoS2 and Mo3S4 phases in the Mo-containing catalyst synthesized in-situ during hydroconversion of different feed. Higher magnification TEM image in Figure 2 display particles with a layered contrast, which possessed irregularities in the interlayer distances. The measurements showed that these regions differ by the interplanar distance values which lie in the range of 0.62–0.8 nm. These irregularities in the interlayer distances can be interpreted as the existence of molybdenum sulfide regions with variable composition or crystal structure defects. An increase in the interlayer distance in the bulk phases of MoS2 can also occur if the parallel orientation of the layers is disrupted due to exfoliation under special conditions [40,41].
For the TI sample from test #1 (C(Mo) = 0.01wt.%, P = 70 atm), the size of non-aggregated (isolated) particles lied in the range of 10 nm–1 μm, which is higher compared with test #2 (C(Mo) = 0.05wt.%). This may be due to the high yield of polycondensation products observed in conditions of test #1 (Table 2).
For all TI samples, molybdenum sulfide nanoplates, according to TEM observations, tend to assemble into openwork formations of about 100 nm consisting of randomly arranged plates (Supplementary Figure S2). In addition, they tended to assemble into round and irregularly shaped particles (Supplementary Figure S3). The periphery of such particles contained molybdenum sulfide mono-slabs and multilayered stackings. For the TI sample from test #3 (C(Mo) = 0.08%wt., P = 70 atm), the molybdenum sulfide formations had the most pronounced morphological diversity and unusual structure. Mono- and multilayer elongated particles were clustered into agglomerates, rounded particles with onion-like structure, openwork formations, and bulk rounded particles (Supplementary Figure S4). This sample compared with previous ones (tests #1 and #2) has higher contents of initial monolayered structural formations of molybdenum sulfide (monoslabs) and onion-like structures. Apparently, conditions of the test #3 provided the preservation of the highly dispersed state of monolayered MoS2 particles. Highly dispersed MoS2 particles tend to assemble and grow under non-equilibrium conditions, resulting the multilayered stackings, aggregates, and onion-like structures. Higher stability of monolayered MoS2 particles may be reached due to a relatively low conversion of feed and, consequently, a higher content of asphaltenes in product mixture in test #3 (compared to tests #1 and #2). Asphaltenes as the most polar components of oil disperse systems can play the surfactants role and stabilize nanosized particles [13].
TEM study with additional electron diffraction analysis revealed that some TI samples (from tests #1, #2) contained nanosized particles of metallic Mo (Mo0, #42-1120, SpectrData). These particles displayed monocrystalline and polycrystalline structure, as well as formed ultrafine agglomerates of spheres (Supplementary Figures S5 and S6). This finding is unexpected, because formation of reduced phases of metallic Mo under the test conditions seems unlikely. If MoS2 is formed first, then, to be reduced in the bulk with H2, it needs at least 700 °C [42]. At this temperature, MoS2 can reduce directly to metallic Mo. If Mo-oxide is formed first, then, again, metallic molybdenum seems unlikely to be obtained at hydroconversion conditions [43]. At these conditions, MoO2 phase seems by far the most expected one. So, a more substantial evidence on formation of reduced Mo phase should be provided. Anyway, according to TEM images, the quantity of as-called Mo0 particles was insignificant compared with the layered Mo sulfide particles, so, their effect can be neglected.
TEM results for TI samples from test #4 (P = 60 atm) and test #5 (P = 90 atm) did not show much difference in morphological diversity and size of catalyst particles compared with P = 70 atm (test #2) (Supplementary Figures S7–S9). Molybdenum-containing particles consisted of randomly arranged plates with an interplanar distance of 0.62–0.65 nm corresponding to MoS2 and Mo3S4 phases. Periphery of such particles always had a halo of isolated monoslabs or stacked molybdenum sulfide plates. Again, as it was mentioned above, test #2 (P = 70 atm), TI sample from test #4 (P = 60 atm) also contained nanocrystalline particles, that were identified as reduced Mo (Mo0, #42-1120, SpectrData) (Supplementary Figure S8). TI sample from test #5 (P = 90 atm) was not found to contain Mo0 particles.
The results of analyzing high-resolution TEM images for Mo-containing solids (TI) were used to determine morphological parameters (average plate length ( L ¯ ), average number of plates per stacking ( N ¯ )) and active site dispersion for catalyst active phase (MoS2) (Table 6; Supplementary Tables S1 and S2).
A survey XPS analysis for Mo-containing solids (TI) showed that the main surface phase with a predominant signal in the spectra was a carbon-containing one C1s spectrum with E of 284.6 eV, while graphite-like carbon gives the C1s spectrum with E of 284.5 eV ± 0.1 eV. The form of XPS-spectra did not imply an objective determination of Mo-containing species with acceptable accuracy.

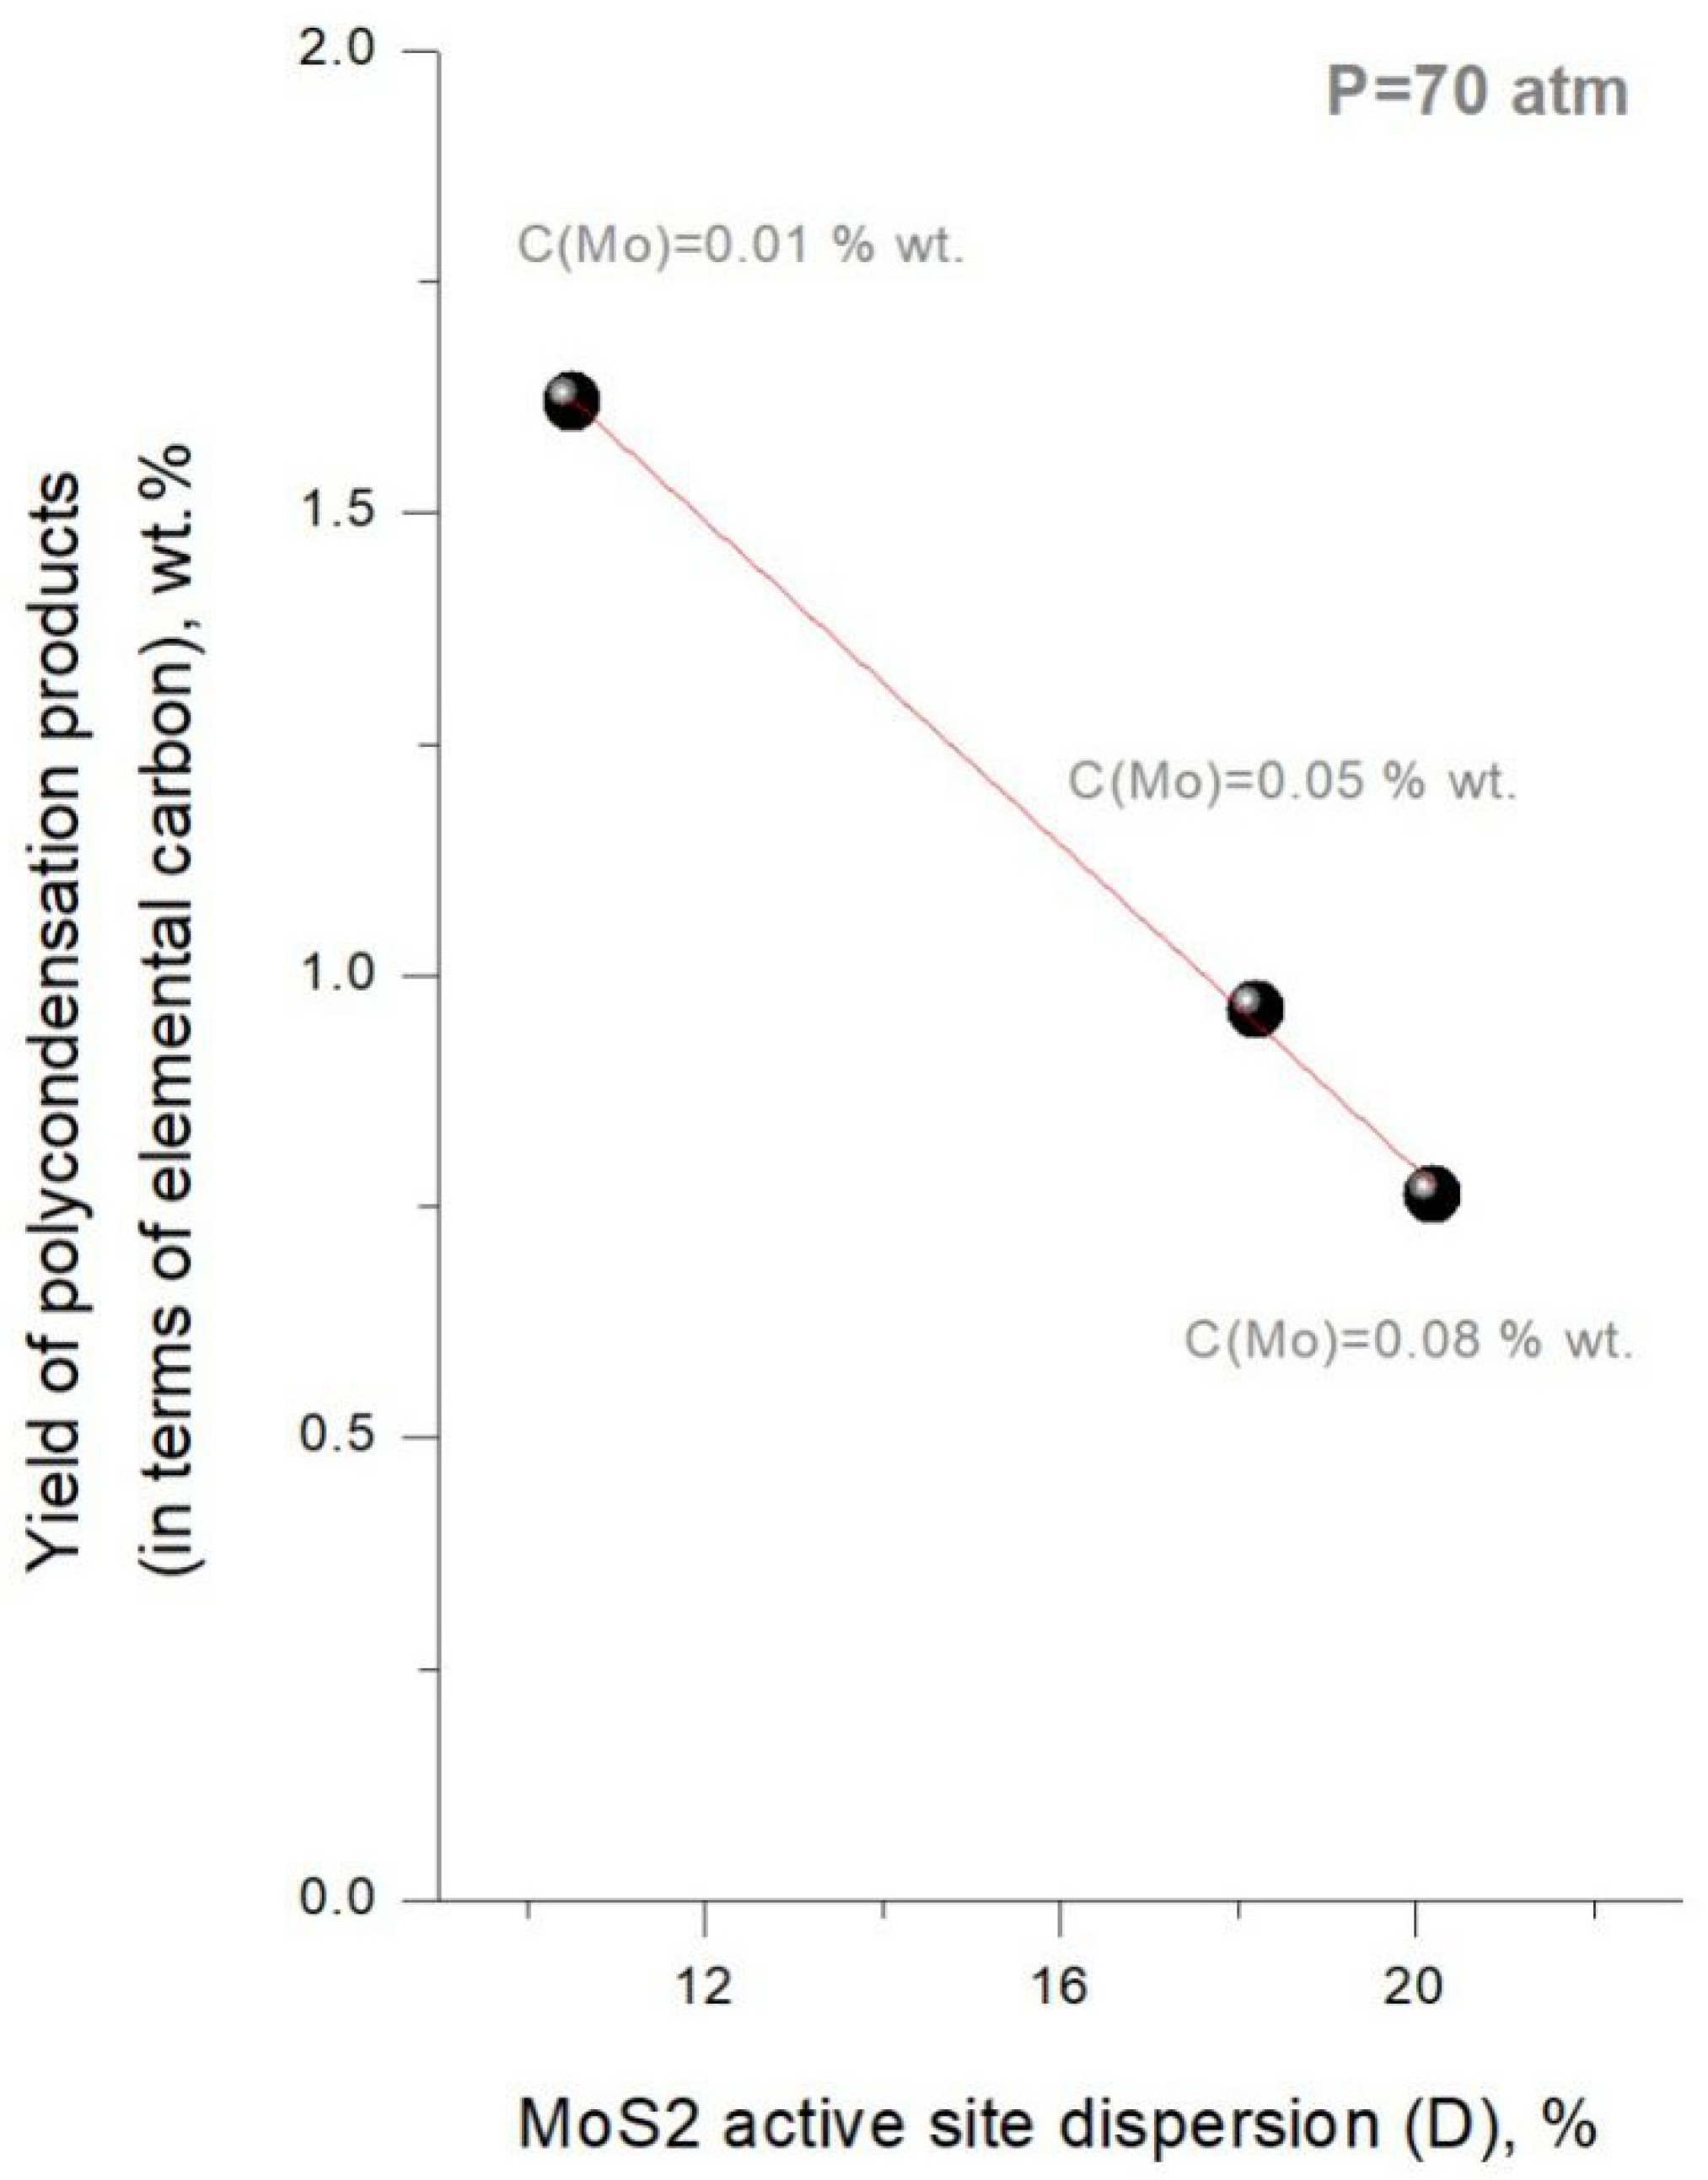
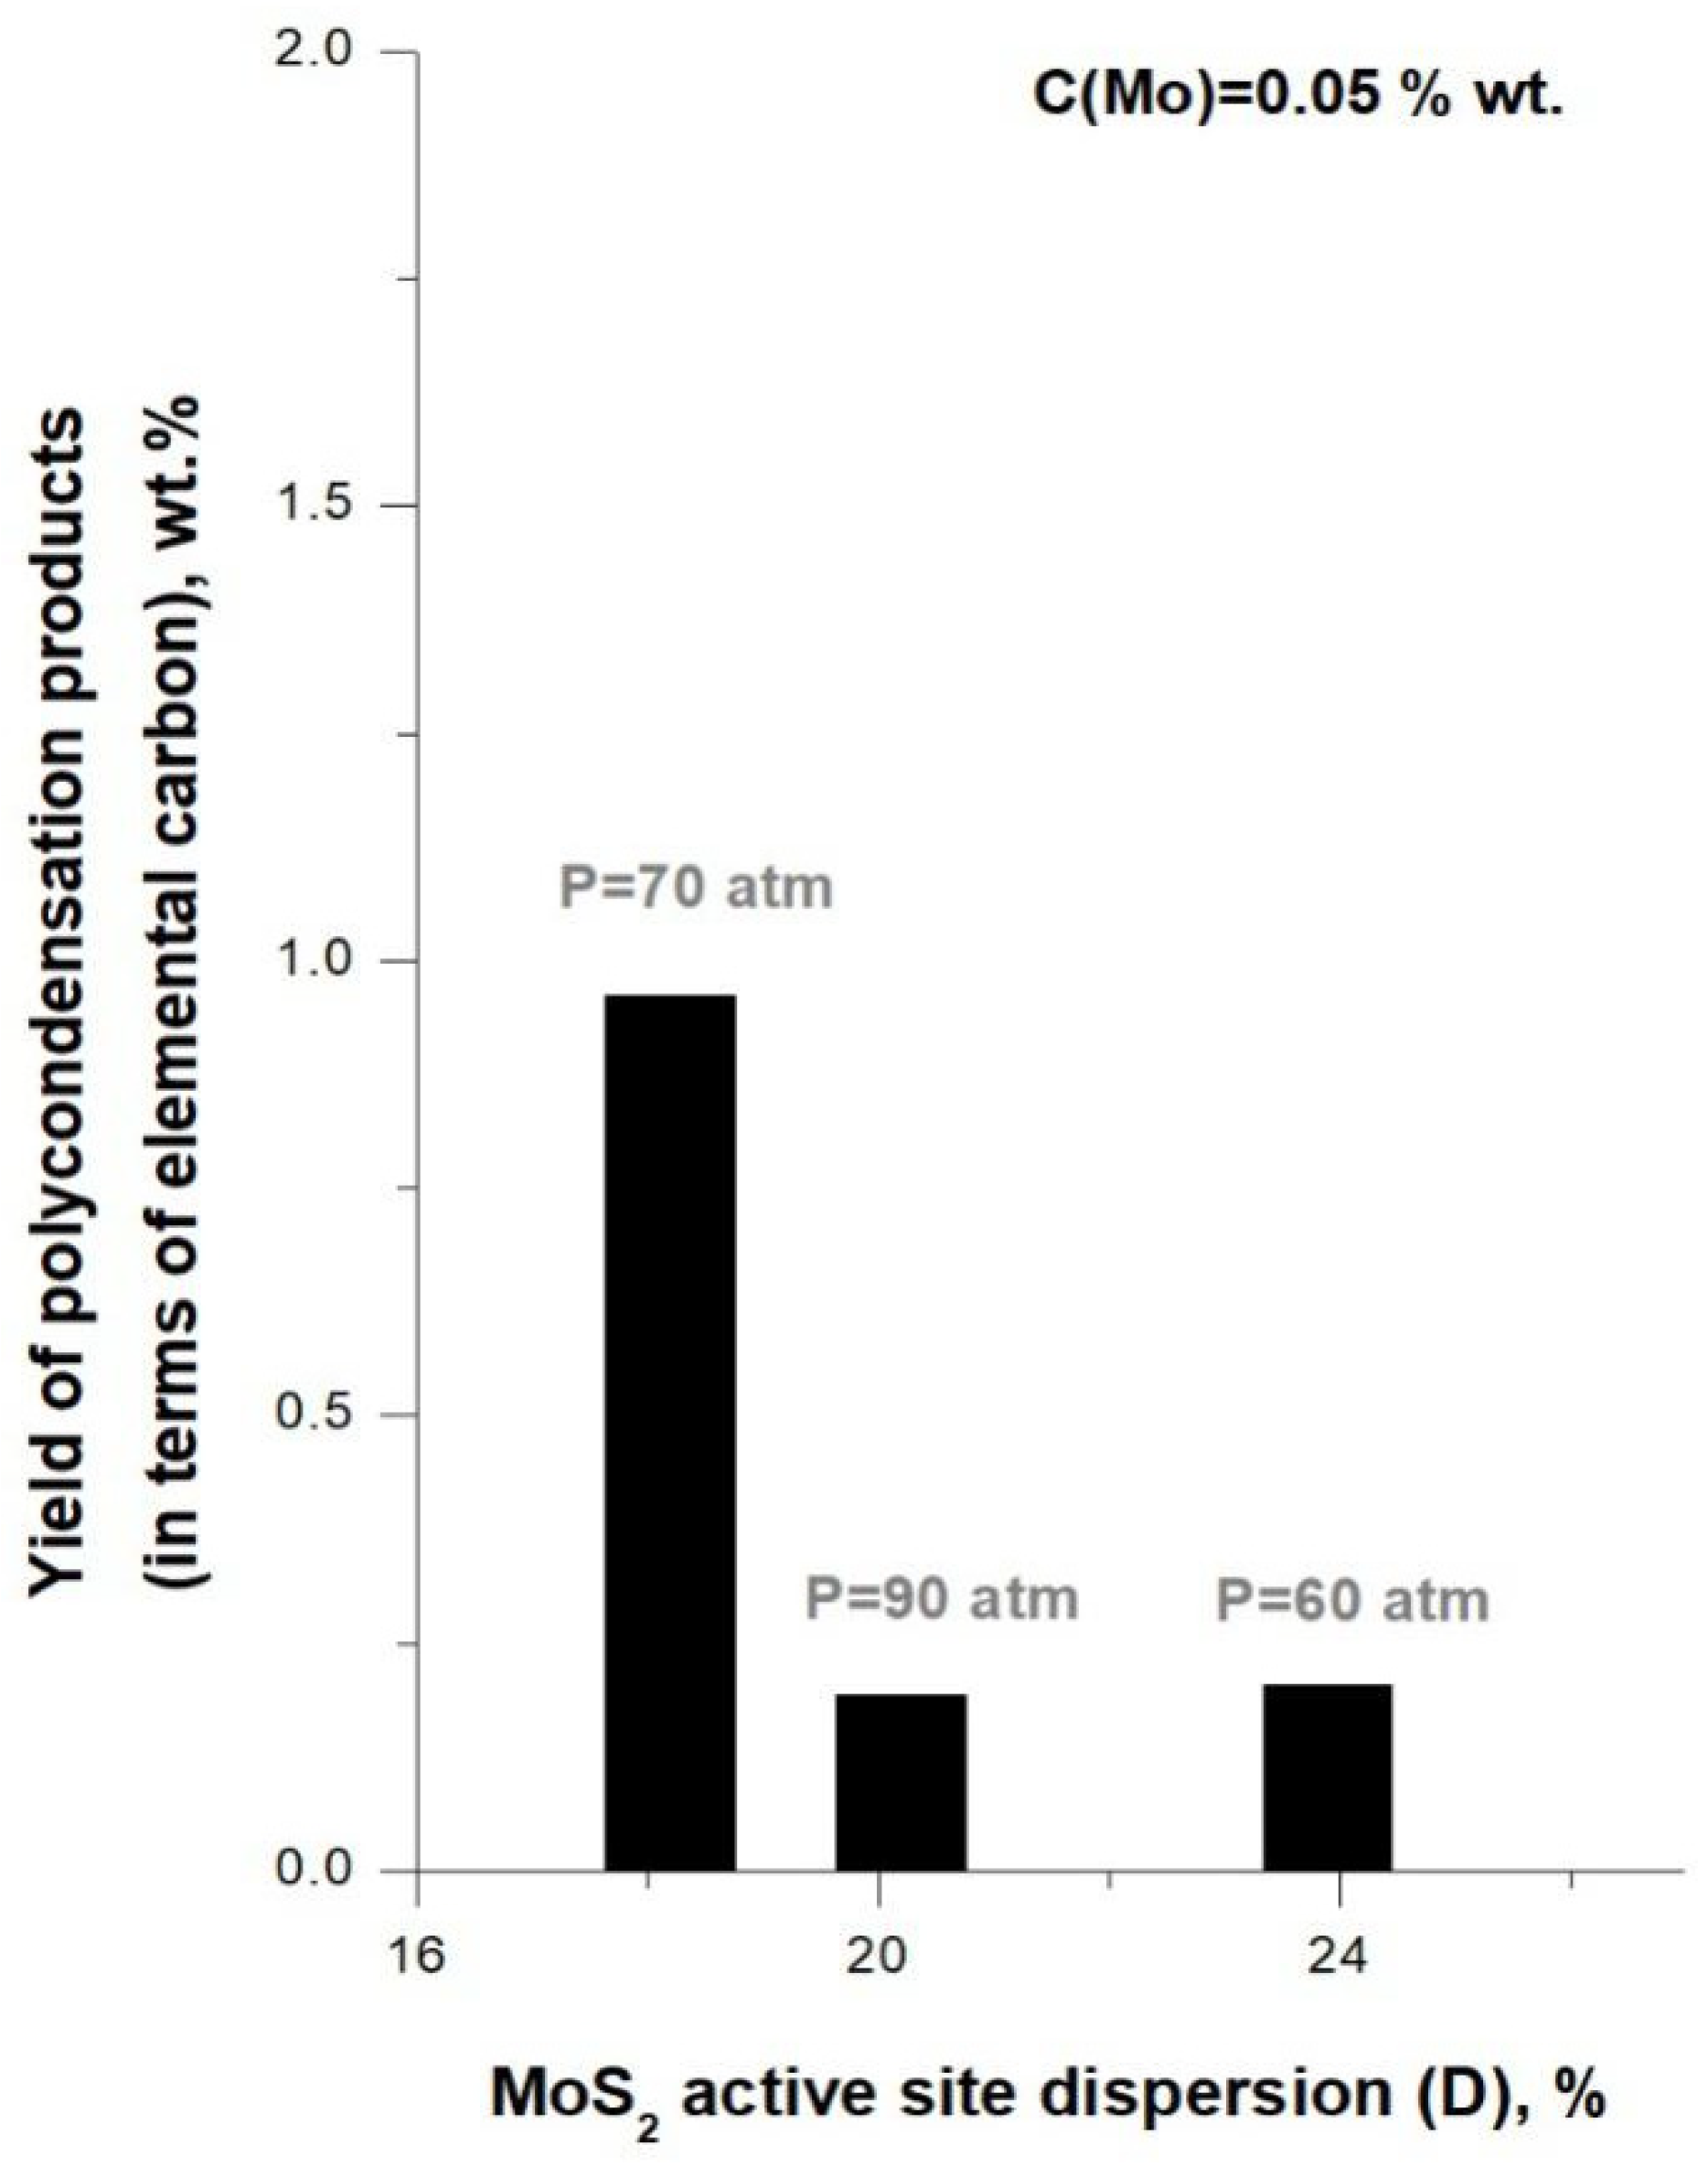
2.4. Correlations between Catalyst Active Site Dispersion and Hydroconversion Activity

An increase in precursor loading significantly affects the dispersion and morphology of aggregates and the active phase of the catalyst. As the catalyst concentration increases (tests #1–2–3), the average size of the Mo-containing aggregates decreases, as well as yield of polycondensation products. With increasing total pressure (tests #4–2–5), average size of the Mo-containing aggregates passes through a maximum (105 nm) at P = 70 atm (test #2), which correlates with change in polycondensation products yield in test #2 (Table 1 and Table 5).
According to data in Table 6, the parameters of average MoS2 cluster ( L ¯ , N ¯ ), as well as active site dispersion (D), changes with variation of precursor loading and total pressure in hydroconversion reaction zone. MoS2 active site dispersion (D) grows due to a decrease in average plate length L ¯ or stacking numbers N ¯ (Table 6; Supplementary Figures S10 and S11).
In test #1 (C(Mo) = 0.01%wt.) and test #3 (C(Mo) = 0.08%wt.), polycondensation products contained catalyst clusters that differed predominantly by plate length L ¯ and had similar number of layers ( N ¯ = 1.5 and 1.7). So, values of parameters calculated for TI solids from test #1 (C(Mo) = 0.01%wt.) and test #3 (C(Mo) = 0.08%wt.) allow to estimate the effect of L ¯ . Lowering L ¯ values is known to be associated with a decrease in number of inert basal plane sites in MoS2 cluster and an increase number of rim-edge sites, which are supposed to be active (Supplementary Table S2). According to hydroconversion results (Table 1), an increase in precursor loading from C(Mo) = 0.01% to 0.08%wt. resulted in lower impact of polycondensation reactions and lower feed conversion (Figure 3). Yield of gaseous products, yields of IBP–180 °C and 180–360 °C distillate fractions also decreased, and quality of distillate fractions (i.e., content of sulfur and unsaturated compounds) improved (Table 2 and Table 3). These observations allow guessing that MoS2 clusters with lower plate length ( L ¯ ) , i.e., higher number of accessible rim-edge sites compared to basal plane sites, possess enhanced activity in hydroconversion process.
In test #2 (C(Mo) = 0.05%wt.) and test #3 (C(Mo) = 0.08%wt.), the in-situ formed catalyst clusters differed predominantly by the number of layers ( N ¯ = 4.7   and   1.7 ), while plate length L ¯ didn’t change much and made 6.7 and 6.0 nm, respectively. So, values of parameters calculated for TI solids from test #1 (C(Mo) = 0.01%wt.) and test #3 (C(Mo) = 0.08%wt.) reflect the influence of N ¯ on hydroconversion effectivity. Changes in stacking numbers are known to effect edge/rim sites ratio in MoS2 cluster, while a number of basal plane sites stays constant (Supplementary Table S2). According to the results (Table 1 and Table 6) for test #2 and test #3, this resulted in lower 360 °C+ conversion (by ~5.9%) and slight decrease in yield of polycondensation products (by ~0.2%wt.). Yield of gaseous products, yields of IBP–180 °C, 180–360 °C, and 360–520 °C fractions also decreased, while the quality of distillate fractions improved (Table 2 and Table 3). Increase in catalyst precursor loading in tests #2 and #3 also affected the 360–520 °C fraction yield, in contrast to tests #1 and #3, where this value did not change significantly. Apparently, MoS2 clusters with higher stacking numbers N ¯ , i.e., higher edge/rim sites ratio, provide higher selectivity on 360–520 °C fraction under hydroconversion conditions (test #2).
Figure 4 represents the correlation between the yields of polycondensation products and catalyst active site dispersion (D). The values of polycondensation products yield have been recalculated on elemental carbon according to the results from Table 4 to eliminate the catalyst impact. For the data represented in Figure 4, the change in MoS2 active site dispersion was achieved by varying the catalyst precursor loading in the range of 0.01–0.08%wt. Mo. In Reference [20], while studying hydrocracking of heavy petroleum feedstock in an autoclave at T = 430 °C, P(H2) = 80 bar, t = 1 h, authors showed that coke yield can be reduced from 20.2% to 10.4% by increasing loading of precursor (Mo octoate) from 250 to 1500 ppm Mo. The authors concluded that presence of asphaltenes limited the possibility of converting heavy oil feedstock even in the presence of significant amount of dispersed nanosized MoS2. In this study, the linear dependence of the polycondensation products yield on the catalyst active site dispersion (D) (Figure 4) indicates a direct relationship between «catalyst active site dispersion—coke suppression». MoS2 acts as an inhibitor of undesired polycondensation processes rather than a catalyst for conversion towards lighter products. So, in this series of experiments, polycondensation reactions were suppressed predominantly by accessible rim-edge sites of MoS2 cluster. The effectivity of polycondensation suppression may be controlled by MoS2 morphology, i.e., MoS2 clusters with lower plate length L ¯ and higher stacking numbers N ¯ are more effective.
The conclusion is consistent with relevant studies conducted in autoclave conditions [9,16,18]. In Reference [9], concerning the hydroconversion of a vacuum residue in an autoclave at 400 °C and 9.5 MPa, the effects of MoS2 preparation methods from oil-soluble precursors (in-situ or ex-situ) on the MoS2 nanoparticle structure and catalytic activity have been studied. Activity of MoS2-based catalyst was characterized by TOF based on hydrogen consumption rate and number of Mo atoms in hexagonal MoS2 crystallites. The authors’ concluded that number of the rim sites in nano-MoS2 determine the high rate of hydrogen consumption in the process. An increase in active site dispersion of MoS2 particles achieved by reducing the size and stacking degree of the catalyst clusters, is an important tool for improving the hydrogenation functions of catalysts [11].
Results of experiments with pressure variation (tests #4–2–5) displayed nonmonotonic changes of catalyst active site dispersion (Table 6). Effect of pressure on hydroconversion effectivity can be associated both with changes in catalyst active phase characteristics and heat- and mass-transfer conditions in gas-liquid reaction medium. So, in this series of experiments, the variable parameter could also affect the reactor hydrodynamics, efficiency of contact between the reactants and catalyst and solubility of hydrogen and asphaltenes in liquid phase. However, in this study, we considered the effect of pressure on parameters of catalyst active phase, i.e., correlation between the characteristics of the catalyst synthesized in-situ at different pressures and hydroconversion effectivity, particularly, in suppressing polycondensation reactions.
According to data in Table 6 for test#4 (P = 60 atm), the in-situ formed MoS2 had relatively high value of active site dispersion (D = 23%). This means that MoS2 clusters possessed higher number of catalytically active rim-edge sites. An increase in pressure up to P = 70 atm (test #2) led to a decrease in MoS2 active site dispersion (D = 18%). The values of L ¯ and N ¯ increased resulting in increase in edge/rim sites ratio (Supplementary Table S2). According to hydroconversion results (Table 1), increase in pressure from P = 60 to P = 70 atm resulted in higher 360 °C+ conversion (by 5.4%) and significantly increased the yield of polycondensation products (by 0.9%). In addition, a decrease in gaseous product yield and an increase in yields of in IBP–180 and 180–360 °C fractions was observed. The quality of distillate fractions in terms of unsaturated compounds improved, but sulfur content increased (Table 3).
Figure 5 illustrates correlation between the ratio «360 °C+ conversion / polycondensation products yield» and MoS2 active site dispersion (D), and Figure 6 displays correlation between polycondensation products yield (recalculated on elemental carbon) with MoS2 active site dispersion (D). It can be seen that, with pressure increase from P = 60 atm to P = 70 atm (tests #4 and 2), value of the ratio «360 °C+ conversion/polycondensation products yield» decreases (Figure 5), and the content of carbon associated with polycondensation products increases (Figure 6). Thus, pressure increase in this case resulted in lowering the hydroconversion effectivity in terms of feed conversion and coke suppression, which may to be associated with decrease in MoS2 active site dispersion.
For tests #2 and #5 (P = 70 atm and 90 atm), the results (Table 6) showed that catalyst clusters changed mostly due to stacking numbers N ¯ in average MoS2 cluster, while plate lengths L ¯ , determining number of inert basal sites, did not change significantly. MoS2 active site dispersion (D) increased from 18–20%, while number of rim sites increased twice compared to test #2 (P = 70 atm) (Supplementary Table S2). According to hydroconversion results (Table 2), a slight decrease in 360 °C+ conversion (by 1.6%) and a significant decrease in yield of polycondensation products (by 0.9%wt.) were observed. The yields of gaseous and distillate products remained almost unchanged, and contents of sulfur and unsaturated compounds decreased with pressure increase (Table 2 and Table 3). According to Figure 5, the ratio «360 °C+ conversion/polycondensation products yield» significantly increased at the highest pressure (P = 90 atm), while the yield of carbon associated with the polycondensation solids decreased. Thus, in this case, pressure increase resulted in higher hydroconversion effectivity, particularly, in suppression of polycondensation reactions, which may be associated with higher MoS2 active site dispersion.
Generally, according to the data in Figure 5 and Figure 6, the «360 °C+ conversion/polycondensation products yield» ratio grows when total pressure is increased, and the yield of carbon associated with the polycondensation solids decreases according to the pressure series P = 70 < P = 60 < P = 90 (atm). The highest value of «360 °C+ conversion/polycondensation products yield» ratio and the lowest yield of polycondensation products were achieved in the hydroconversion process at total pressure of P = 90 (atm) in the presence of in-situ synthesized MoS2 with N ¯ = 2.5 ,   L ¯ = 6.0   nm and active site dispersion being D = 20%.
The dependence in Figure 6 corresponding to a series of experiments with pressure variation is nonlinear, which differs from dependence in Figure 4 corresponding to precursor loading variation series. This can be due to the complex effect of pressure on the formation of polycondensation products and catalyst particles during the hydroconversion in continuous flow reactor. Saturation and stabilization of hydrocarbon radicals resulting from cracking by active hydrogen is the main mechanism of preventing coke formation during the hydroconversion process [44,45]. Change in hydrogen solubility in the liquid phase, which depends on pressure, can affect the feed conversion and polycondensation product yield. Lower conversion of feed at P = 60 atm can be associated with higher rate of hydrogen activation-generation in the liquid phase of the reactant mixture due to higher catalyst active site dispersion and the lower impact of deep sequential thermal destruction of high molecular components of feed.

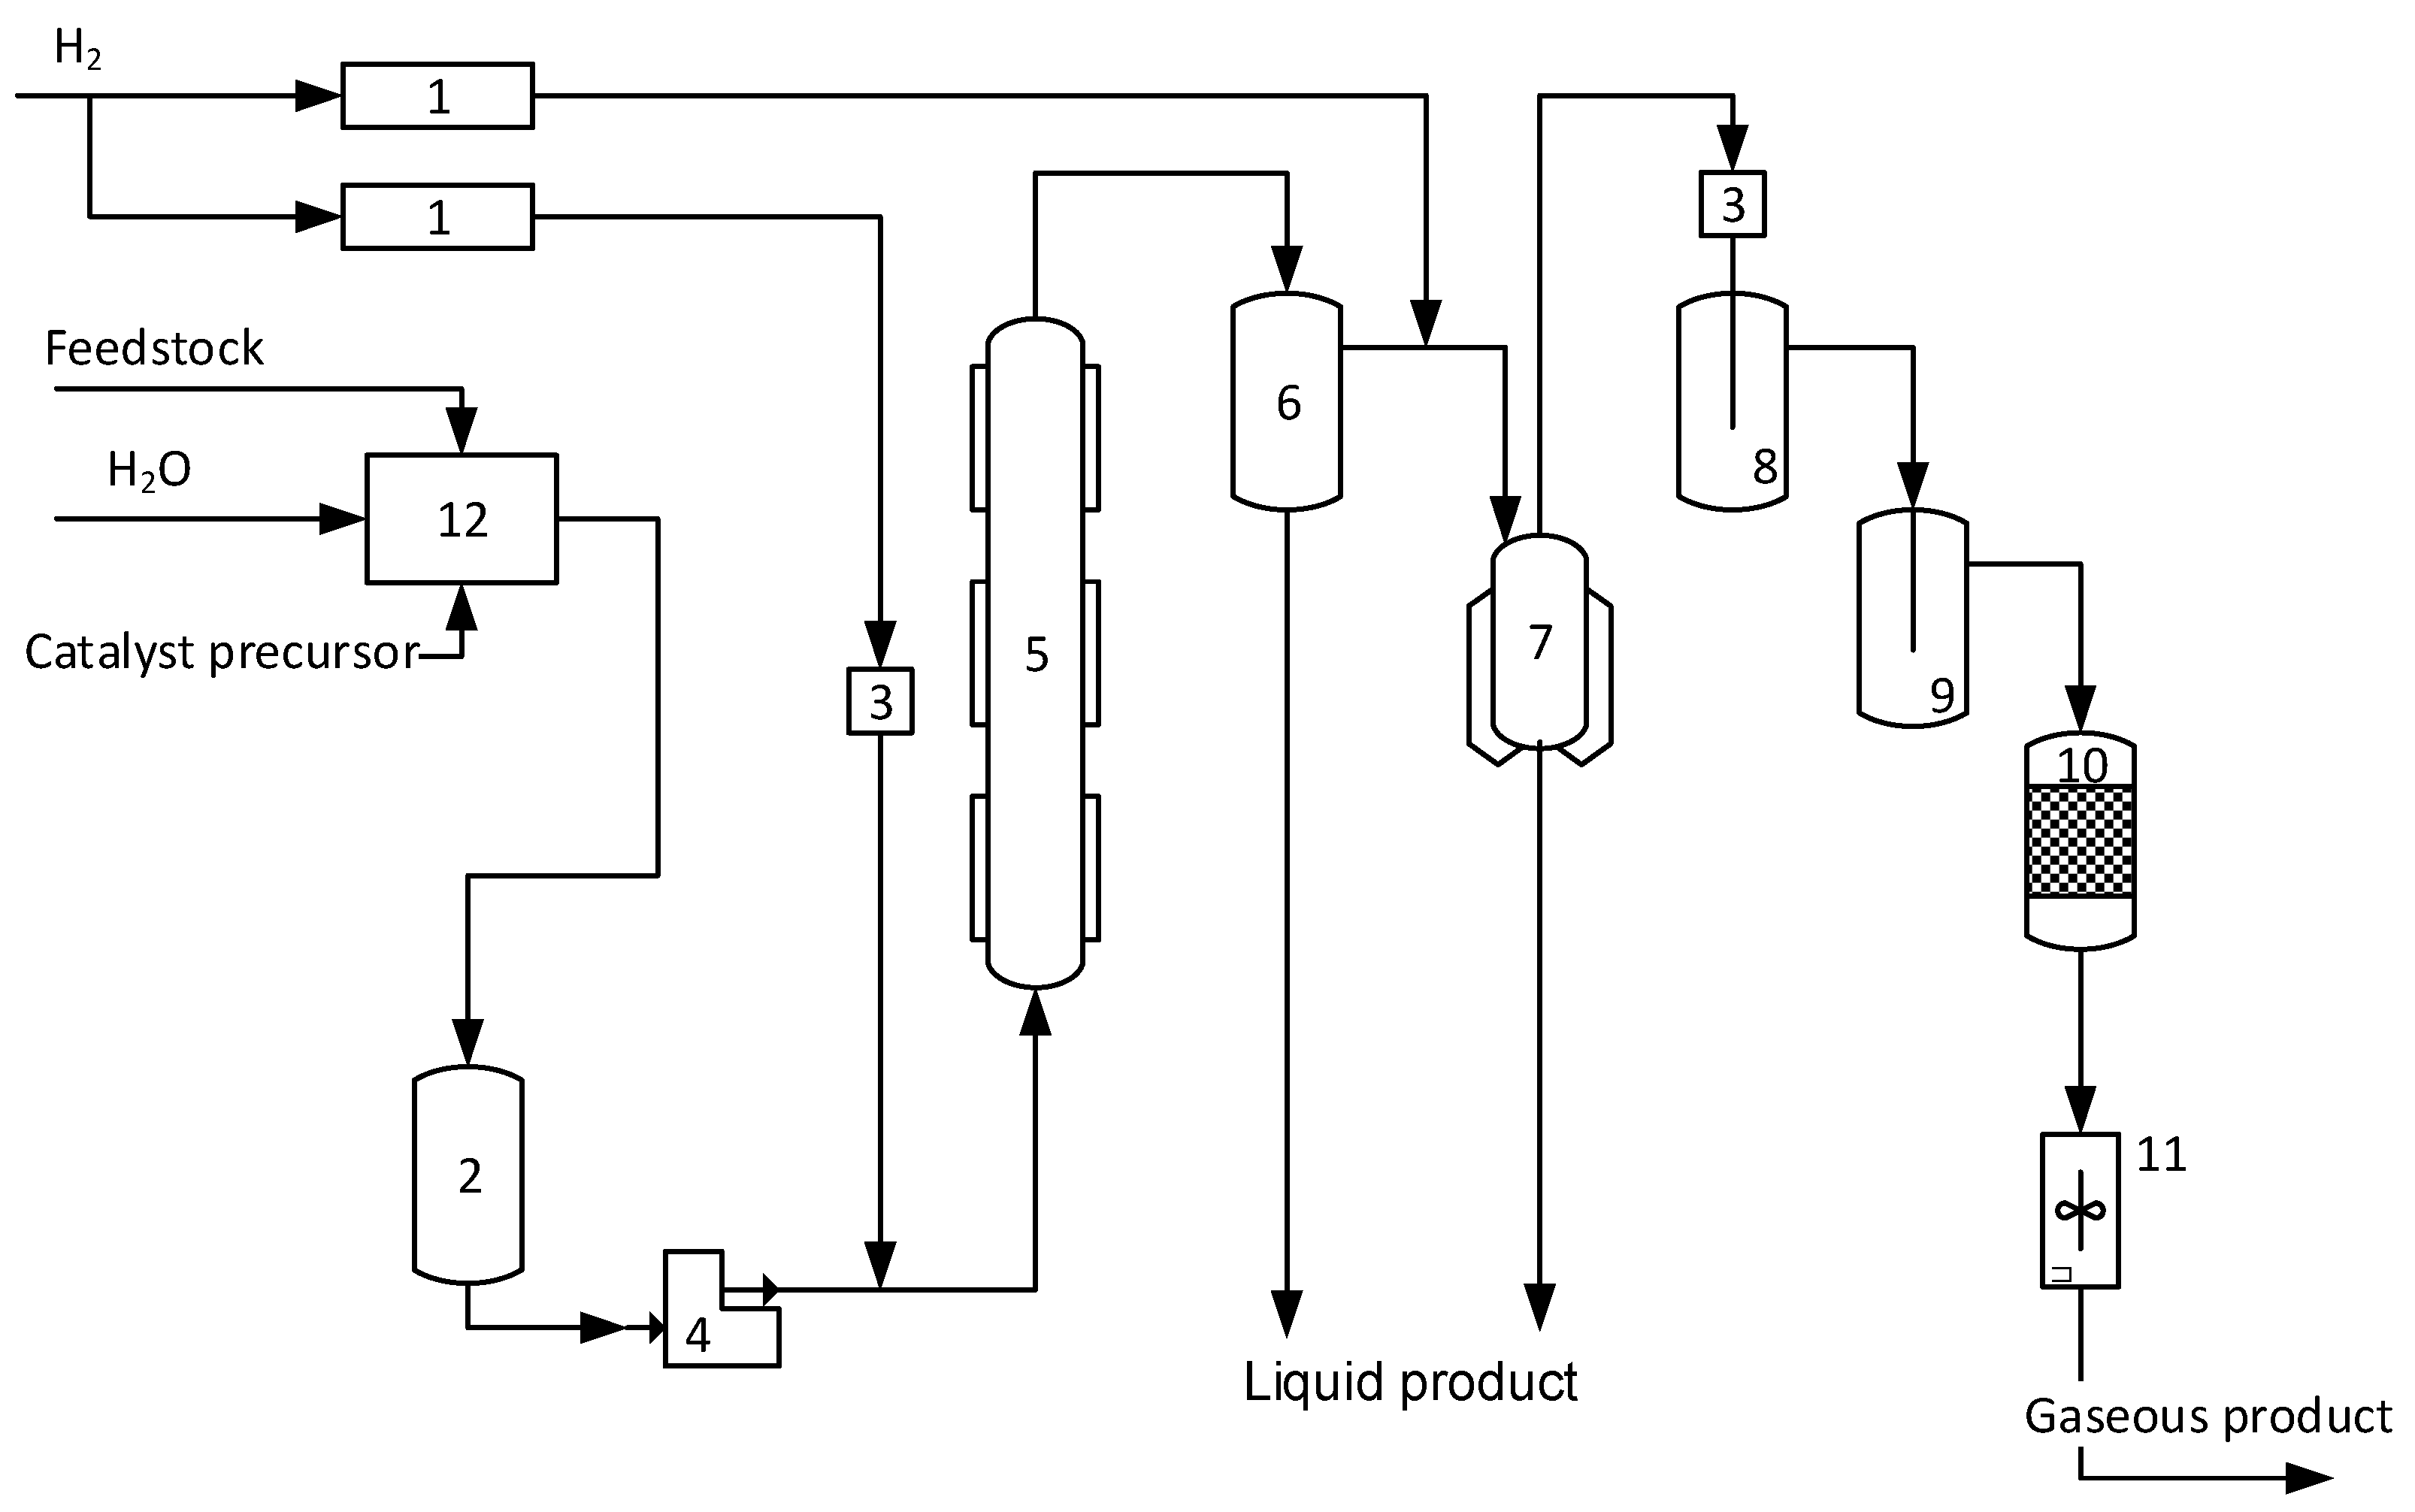
3. Methods and Materials

Hydroconversion tests were performed on a lab-scale high-pressure pilot unit with capacity of 100 mL/h per feed (Figure 7). Hydroconversion reactions were conducted in a continuous flow reactor in the presence of in-situ synthesized MoS2-based catalyst nanoparticles. The catalyst precursor was a commercial ammonium paramolybdate (NH4)6Mo7O24⋅4H2O (APM, Labtech, Moscow, Russia). Bituminous oil was taken as a feed, and the properties of the feed are reported in Table 7.
According to hydroconversion technology, the catalyst precursor is introduced into reactionary system as an aqueous phase of reverse emulsion [2,46]. Continuous phase (dispersion medium) of the emulsion is represented by the processed feedstock. The catalyst precursor loading is 0.05%wt. Mo (for feed), the water content in the raw emulsion with the catalyst precursor is 2%wt. Decomposition of the catalyst precursor and subsequent molybdenum sulfidation reactions proceed in-situ in the continuous flow reactor (Special Design Bureau, TIPS RAS, Moscow, Russia) of the pilot unit in a single stream with the processed feed. The hydrogen sulfide formed during thermal cracking of sulfur-containing feed components in a hydrogen atmosphere provides molybdenum sulfide formation [2,17].
In this study, a reverse emulsion was preliminarily prepared for feeding into the pilot unit reactor. The dispersion medium and the dispersed phase of feed emulsion were represented by bituminous oil and APM aqueous solution, respectively. The APM loading was 0.01–0.08%wt. (based on Mo). The content water introduced with aqueous solution of precursor in that emulsions was 2.0%wt.
The raw emulsion was loaded into the feed tank (2) of the pilot unit (Figure 7) and then pumped to the reactor. The feed emulsion was mixed with the hydrogen before entering the reactor at the temperature of 80 °C. Then, the feed mixture was fed to the combined heater and heated to the reaction temperature and introduced into the reaction zone. After having passed through the reactor, the products were separated via a high-pressure and low-pressure separators. After passing the separation system, the liquid hydrogenation product was collected and subjected to atmospheric vacuum distillation under laboratory conditions to determine fractional composition. Gaseous products are passed through absorbers (8, 9, 10) for removing acidic components and moisture before leaving the system through flow controller (11).
The hydroconversion test were conducted in a hydrogen medium at a temperature (T) of 450 °C, a total pressure in the reaction zone (P) of 6.0–9.0 MPa, a feed space velocity (V) of 1.0 h−1, and a hydrogen/feed ratio (H2/feed) of 1000 nL/L. The process runs in up-flow regime inside a hollow-tube reactor. The residence time makes 43 min for the feed at normal temperature and feed space velocity (V) 1.0 h−1.
Variable parameters in this study were the catalyst precursor loading (C(Mo), wt.%) and the total pressure in the reaction zone (P, atm).
The results of the study were recorded under conditions of stabilization and constancy of the products composition and amount of the catalyst.
The feed conversion degree (X, %) was determined by the conversion of the fraction boiling above 360 °C (hereinafter referred to as 360 °C+) with hydroconversion in once-through mode using the formula:
X = 100   ·   ( C 360 C + °   C 360 C + ) / C 360 C + ° ,
where C 360 C + ° is 360 °C+ content in the feed, and C 360 C + is 360 °C+ content in the reaction products.
To characterize the liquid products, the iodine numbers characterizing the content of unsaturated compounds in distillate fractions after hydroconversion were determined. The sulfur content in hydroconversion products was determined by X-ray fluorescence energy dispersive analyzer (Spectroscan-S) (Spectron Ltd., Saint Petersburg, Russia).
Yield of polycondensation product (coke) was determined as the content of toluene insoluble solid components (TI) in 520 °C + fraction of hydroconversion products. TI samples were extracted from the 520 °C + fraction by filtration. Before the subsequent analysis, the obtained TI samples were dried under vacuum and kept in dehydrated atmosphere. The as-prepared TI-samples contained almost whole molybdenum loaded into the hydroconversion process with feed emulsion. The main characteristics of catalyst particles were determined based on results of TI-samples subsequent physical and chemical analysis.
The TI metal content was determined by flame atomic absorption spectroscopy (AAnalyst 400 (PerkinElmer Inc., Waltham, MA, USA)). The samples were preliminary dissolved in mineral acids and ashed at 450 °C. The method was characterized by reproducibility (accuracy) of <5%.
TI CHNS-analysis was performed by dynamic flash combustion followed by chromatographic separation (EuroEA3000 (Eurovector S.p.A., Redavalle, Italy)). Standard deviation of the random component for measurement error in CHNS analysis for C and S is 0.3%wt., for H and N − 0.1%wt.
Catalyst particles in TI powder samples were studied by transmission electron microscopy (TEM). Linear dimension measurement for nanomaterial elements using TEM and determining the sample phase composition using the local diffraction pattern. The following measuring instruments and equipment were used: (1) transmission electron microscope JEM 2100 (JEOL Ltd., Tokyo, Japan)); (2) image capture and display: CCD camera Gatan (Gatan Inc., Pleasanton, CA, USA) with software; (3) 33 kHz ultrasonic bath. Toluene was used as a solvent. The resulting suspension was placed on a grid with an amorphous microhole carbon film. The resulting suspension was placed on a grid with an amorphous microhole carbon film using a pipette. The resulted powder particles did not form artificial agglomerates and were located evenly on the grid. The obtained TEM images were analyzed to determine the dimensions of the structural elements by manual line measurements. The total relative uncertainty of measurements did not exceed 5% for linear dimensions and did not exceed 2% for interplanar distance. The phase composition analysis was performed using the external reference method.
According to TEM results, the average size of Mo-containing aggregates, the average length of MoS2 particles ( L ¯ ), the average number of layers in MoS2 cluster ( N ¯ ), and MoS2 active sites dispersion (D) were calculated using method described in References [23,25,47] and Supplementary Table S1.
Survey XPS spectra for TI-samples were taken using X-ray photoelectron spectrometer PHI5500 VersaProbe II (Physical Electronics Inc., Chanhassen, MN, USA), at Al Kα radiation hν = 1486.6 eV, power 50 W, analyzer transmission energy (Epass) of 117.4 eV, interval—1.0 eV, area of analysis 800 × 400 μm2, beam diameter 200 μm. High resolution spectra were recorded at Epass = 23.5 eV with a step of 0.2 eV. The method of data analysis assumed the error in estimating peak relative intensity of 5% (for intense lines) and 10% (for low-intensity lines).

4. Conclusions

Bituminous oil hydroconversion in the presence of in-situ formed dispersed Mo catalyst was investigated to explore the effects of catalyst concentration and pressure on hydroconversion at T = 450 °C, P = 6.0–9.0 MPa, V = 1.0 h−1, H2/feed = 1000 nL/L, and C(Mo) = 0.01–0.08%wt in continuous flow reactor on lab-scale pilot flow unit in once-through mode. The investigation of the effects of variable parameters on characteristics of catalyst particles showed that the in-situ formed MoS2 contains nanoscaled dispersed particles, which tend to associate with polycondensation solids as a result of strong adsorption and aggregation with the reaction medium components. The composition of polycondensation products was represented by the formula MoSxCy, where x and y values lie in the range: 2.3 < x < 42, 34 < y < 1359 (molar). The size of Mo-containing aggregates in polycondensation products lied in the range of 69–143 nm. MoS2 formations observed in polycondensation products possessed morphological diversity. Moreover, the effects of variable parameters on morphological parameters (average plate length ( L ¯ ), average stacking number ( N ¯ )) and active site dispersion for catalyst active phase (MoS2) were analyzed. Increase in MoS2 active site dispersion both due to lower values of plate length L ¯ and stacking numbers N ¯ for average MoS2 cluster had a positive effect on hydroconversion effectivity, particularly, in suppression of polycondensation reactions. The highest ratio «360 °C+ conversion/polycondensation products yield» and the lowest yield of polycondensation products was achieved in hydroconversion at P = 90 (atm) with catalyst active phase parameters N ¯ = 2.5 ,   L ¯ = 6.0   nm , and MoS2 active site dispersion D = 20%. In addition, it was demonstrated that changing the catalyst dispersion by varying catalyst concentration and pressure affects the impact of polycondensation reactions through a different mechanism.

Supplementary Materials

The following are available online at https://www.mdpi.com/article/10.3390/catal11060676/s1, Figure S1: General TEM image of TI-sample (test #4) and corresponding electron-diffraction pattern, Figure S2: TEM images of openwork formations in TI-sample (test #1, C(Mo) = 0.01wt.%), Figure S3: TEM images of irregular shape particles in TI-sample (test #1, C(Mo) = 0.01wt.%), Figure S4: TEM images of TI-sample (test #3, C(Mo) = 0.08%wt.): a—general view; b—Mo sulfide formation with a layered structure; c—Mo sulfide particle with onion-like structure; d—Mo sulfide openwork formation; e—rounded formations of Mo sulfide, Figure S5: TEM images of Mo particles in TI-sample (test #2, C(Mo) = 0.05wt.%): a—monocrystalline Mo0 particle and corresponding diffraction pattern; b—polycrystalline Mo0 particle and corresponding diffraction pattern; c—ultrafine Mo particle, Figure S6: TEM images of Mo0 particles in TI-sample (test #1, C(Mo) = 0.01wt.%) and corresponding electron-diffraction patterns, Figure S7: TEM images of TI-sample after test #4 (P = 60 atm); a–e—Mo sulfide particles of different morphology; f—Mo0 polycrystalline particle and corresponding electron-diffraction pattern, Figure S8: TEM images of TI-sample after test #4 (P = 60 atm): Mo0 polycrystalline particle and corresponding electron-diffraction pattern, Figure S9: TEM images of TI-sample after test #5 (P = 90 atm): a—general view; b—spherical particle of Mo sulfide; c—Mo sulfide particle of irregular shape; d—openwork formation of Mo sulfide particles, Figure S10: Dependence of MoS2 cluster parameters on catalyst precursor loading, Figure S11: Dependence of MoS2 cluster parameters on total pressure in hydroconversion reaction zone, Figure S12: Typical XRD-pattern for Mo-containing solids (TI) extracted from hydroconversion products (XRD device: Rigaku Rotaflex RU-200 X-ray instrument, ICDD PDF-2 diffraction database), Table S1: Formulas for calculation of MoS2 cluster parameters, Table S2: Geometrical parameters of catalyst active phase (MoS2) in polycondensation products.

Author Contributions

Conceptualization, A.L.M. and K.M.K.; methodology, A.L.M. and K.M.K.; formal analysis, K.M.K., M.K.K.; investigation, K.M.K., M.K.K.; resources, K.M.K.; data curation, K.M.K.; writing—original draft preparation, A.L.M., K.M.K., M.K.K.; writing—review and editing, A.L.M., K.M.K., M.K.K.; visualization, M.K.K.; supervision, K.M.K.; project administration, K.M.K.; funding acquisition, A.L.M. and K.M.K. All authors have read and agreed to the published version of the manuscript.

Funding

This research was carried out within the State Program of TIPS RAS.

Conflicts of Interest

The authors declare no conflict of interest.

References

  1. Speight, J.G. Upgrading by Hydrocracking. In Heavy Oil Recovery and Upgrading; Gulf Professional Publishing: Houston, TX, USA, 2019; Chapter 11; pp. 467–528. [Google Scholar]
  2. Khadzhiev, S.N.; Kadiev, K.M.; Kadieva, M.K. Synthesis and properties of nanosized systems as efficient catalysts for hydroconversion of heavy petroleum feedstock. Pet. Chem. 2014, 54, 323–346. [Google Scholar] [CrossRef]
  3. Rana, M.S.; Sámano, V.; Ancheyta, J.; Diaz, J.A.I. A review of recent advances on process technologies for upgrading of heavy oils and residua. Fuel 2007, 86, 1216–1231. [Google Scholar] [CrossRef]
  4. Liu, Y.; Gao, L.; Wen, L.; Zong, B. Recent advances in heavy oil hydroprocessing technologies. Recent Pat. Chem. Eng. 2009, 2, 22–36. [Google Scholar] [CrossRef]
  5. Ancheyta, J.; Rana, M.S.; Furimsky, E. Hydroprocessing of heavy petroleum feeds: Tutorial. Catal. Today 2005, 109, 3–15. [Google Scholar] [CrossRef]
  6. Bellussi, G.; Rispoli, G.; Landoni, A.; Millini, R.; Molinari, D.; Montanari, E.; Moscotti, D.; Pollesel, P. Hydroconversion of heavy residues in slurry reactors: Developments and perspectives. J. Catal. 2013, 308, 189–200. [Google Scholar] [CrossRef]
  7. Zhang, S.; Liu, D.; Deng, W.; Que, G. A review of slurry-phase hydrocracking heavy oil technology. Energy Fuels 2007, 21, 3057–3062. [Google Scholar] [CrossRef]
  8. Rezaei, H.; Liu, X.; Ardakani, S.J.; Smith, K.J.; Bricker, M. A study of Cold Lake Vacuum Residue hydroconversion in batch and semi-batch reactors using unsupported MoS2 catalysts. Catal. Today 2010, 150, 244–254. [Google Scholar] [CrossRef]
  9. Kim, K.D.; Lee, Y.K. Active phase of dispersed MoS2 catalysts for slurry phase hydrocracking of vacuum residue. J. Catal. 2019, 369, 111–121. [Google Scholar] [CrossRef]
  10. Schacht-Hernández, P.; Portales-Martínez, B.; Laredo, G.C.; Pérez-Romo, P.; Domínguez-Esquivel, J.M. Homogeneous catalyst for in-situ hydrotreating of heavy oils. Appl. Catal. A Gen. 2019, 577, 99–106. [Google Scholar] [CrossRef]
  11. Kang, K.H.; Kim, G.T.; Park, S.; Seo, P.W.; Seo, H.; Lee, C.W. A review on the Mo-precursors for catalytic hydroconversion of heavy oil. J. Ind. Eng. Chem. 2019, 76, 1–16. [Google Scholar] [CrossRef]
  12. Kadieva, M.K.; Maximov, A.L.; Kadiev, K.M. Ex-Situ Synthesis and Study of Nanosized Mo-Containing Catalyst for Petroleum Residue Hydro-Conversion. Catalysts 2019, 9, 649. [Google Scholar] [CrossRef] [Green Version]
  13. Khadzhiev, S.N.; Kadiev, K.M.; Yampolskaya, G.P.; Kadieva, M.K. Trends in the synthesis of metal oxide nanoparticles through reverse microemulsions in hydrocarbon media. Adv. Colloid Interface Sci. 2013, 197–198, 132–145. [Google Scholar] [CrossRef]
  14. Khadzhiev, S.N.; Kadiev, K.M.; Zhigalina, O.M.; Kadieva, M.K.; Khmelenin, D.N. Structure and properties of molybdenum sulfide nanoparticles synthesized in situ in the hydroconversion process. Pet. Chem. 2015, 55, 655–662. [Google Scholar] [CrossRef]
  15. Panariti, N.; del Bianco, A.; del Piero, G.; Marchionna, M. Petroleum residue upgrading with dispersed catalysts Part 1. Catalysts activity and selectivity. Appl. Catal. A Gen. 2000, 204, 203–213. [Google Scholar] [CrossRef]
  16. Kim, S.H.; Kim, K.D.; Lee, Y.K. Effects of dispersed MoS2 catalysts and reaction conditions on slurry phase hydrocracking of vacuum residue. J. Catal. 2017, 347, 127–137. [Google Scholar] [CrossRef]
  17. Kadiev, K.M.; Khadzhiev, S.N.; Kadieva, M.K. Synthesis and use of polyfunctional catalyst nanoparticles for hydroconversion of natural bitumen. Pet. Chem. 2013, 53, 298–308. [Google Scholar] [CrossRef]
  18. Kim, S.H.; Kim, K.D.; Lee, D.; Lee, Y.K. Structure and activity of dispersed Co, Ni, or Mo sulfides for slurry phase hydrocracking of vacuum residue. J. Catal. 2018, 364, 131–140. [Google Scholar] [CrossRef]
  19. Bacaud, R. Dispersed phase catalysis: Past and future. Celebrating one century of industrial development. Fuel 2014, 117, 624–632. [Google Scholar] [CrossRef]
  20. Nguyen, N.T.; Park, S.; Jung, J.; Cho, J.; Lee, C.W.; Park, Y.K. Comparative reactivity between thermal and catalytic hydrocracking of vacuum residue: Effect of asphaltenes. J. Ind. Eng. Chem. 2018, 61, 32–38. [Google Scholar] [CrossRef]
  21. Kadiev, K.M.; Zaytseva, O.V.; Magomadov, E.E.; Chernysheva, E.A.; Oknina, N.V.; Batov, A.E.; Kadieva, M.K.; Kapustin, V.M.; Khadzhiev, S.N. Structural transformations of asphaltenes during hydroconversion of vacuum residue with recycling the hydroconversion product distillation residue. Pet. Chem. 2015, 55, 487–496. [Google Scholar] [CrossRef]
  22. Jansen, T.; Guerry, D.; Gotteland, D.; Bacaud, R.; Lacroix, M.; Ropars, M.; Lorentz, C.; Geantet, C.; Tayakout-Fayolle, M. Characterization of a continuous micro-scale pilot unit for petroleum residue hydroconversion with dispersed catalysts: Hydrodynamics and performances in once-through and recycling mode. Chem. Eng. J. 2014, 253, 493–501. [Google Scholar] [CrossRef]
  23. Daage, M.; Chianelli, R.R. Structure-Function relations in molybdenum sulfide catalysts: The rim-edge model. J. Catal. 1994, 149, 414–427. [Google Scholar] [CrossRef]
  24. Chianelli, R.R. Periodic trends transition metal sulfide catalysis: Intuition and theory. Oil Gas Sci. Technol. 2006, 61, 503–513. [Google Scholar] [CrossRef] [Green Version]
  25. Kasztelan, S.; Toulhoat, H.; Grimblot, J.; Bonnelle, J.P. A geometrical model of the active phase of hydrotreating catalysts. Appl. Catal. 1984, 13, 127–159. [Google Scholar] [CrossRef]
  26. Hensen, E.; Kooyman, P.; van der Meer, Y.; van der Kraan, A.; de Beer, V.; van Veen, J.; van Santen, R. The relation between morphology and hydrotreating activity for supported MoS2 particles. J. Catal. 2001, 199, 224–235. [Google Scholar] [CrossRef]
  27. Zheng, A.; Wang, D.; Wang, L.; Han, J.; Ma, H.; Pan, Z.; Qu, W.; Wang, C.; Tian, Z. Highly efficient MoS2 nanocatalysts for slurry-phase hydrogenation of unconventional feedstocks into fuels. Energy Fuels 2021, 35, 2590–2601. [Google Scholar] [CrossRef]
  28. Speight, J.G. Handbook of Petroleum Refining; CRC Press: Boca Raton, FL, USA, 2016. [Google Scholar]
  29. Ferreira, S.R.; Barreira, F.R.; Spinelli, L.S.; Leal, K.Z.; Seidl, P.; Lucas, E.F. Comparison between asphaltenes (sub)fractions extracted from two different asphaltic residues: Chemical characterization and phase behavior. Quimica Nova 2016, 39, 26–31. [Google Scholar] [CrossRef]
  30. Chianelli, R.R.; Siadati, M.H.; De La Rosa, M.P.; Berhault, G.; Wilcoxon, J.P.; Bearden, R.; Abrams, B.L. Catalytic properties of single layers of transition metal sulfide catalytic materials. Catal. Rev. Sci. Eng. 2006, 48, 1–41. [Google Scholar] [CrossRef]
  31. Nassar, N.N.; Hassan, A.; Pereira-Almao, P. Metal oxide nanoparticles for asphaltene adsorption and oxidation. Energy Fuels 2011, 25, 1017–1023. [Google Scholar] [CrossRef]
  32. Kadiev, K.M.; Gyul’maliev, A.M.; Kadieva, M.K.; Khadzhiev, S.N. Modeling the structure of water-in-oil inverse emulsion. Russ. J. Appl. Chem. 2018, 91, 1779–1784. [Google Scholar] [CrossRef]
  33. Kadiev, K.M.; Khadzhiev, S.N.; Kadieva, M.K.; Dogova, E.S. Ex situ synthesis of sulfided molybdenum-containing ultrafine hydroconversion catalysts. Pet. Chem. 2017, 57, 608–617. [Google Scholar] [CrossRef]
  34. Hansen, L.P.; Johnson, E.; Brorson, M.; Helveg, S. Growth mechanism for single- and multi-layer MoS2 nanocrystals. J. Phys. Chem. C 2014, 118, 22768–22773. [Google Scholar] [CrossRef]
  35. Pratt, K.C.; Sanders, J.V.; Christov, V. Morphology and activity of MoS2 on various supports: Genesis of the active phase. J. Catal. 1990, 124, 416–432. [Google Scholar] [CrossRef]
  36. Chianelli, R.R.; Ruppert, A.F.; Jose-Yacama’n, M.; Va’zquez-Zavala, A. HREM studies of layered transition metal sulfide catalytic materials. Catal. Today 1995, 23, 269–281. [Google Scholar] [CrossRef]
  37. Nguyen, T.S.; Tayakout-Fayolle, M.; Lacroix, M.; Gotteland, D.; Aouine, M.; Bacaud, R.; Afanasiev, P.; Geantet, C. Promotion effects with dispersed catalysts for residue slurry hydroconversion. Fuel 2015, 160, 50–56. [Google Scholar] [CrossRef]
  38. Afanasiev, P. Synthetic approaches to the molybdenum sulfide materials. C. R. Chimie 2008, 11, 159–182. [Google Scholar] [CrossRef]
  39. Koroteev, V.O.; Okotrub, A.V.; Bulusheva, L.G. Formation of Mo3S4 nanoparticles on the graphitic substrate. Fuller. Nanotub. Carbon Nanostruct. 2011, 19, 39–43. [Google Scholar] [CrossRef]
  40. Golub, A.S.; Zaikovskii, V.I.; Lenenko, N.D.; Danot, M.; Novikov, Y.N. Synthesis of intercalation compounds of molybdenum disulfide with nitrogen-containing organic molecules and study of their microstructure. Russ. Chem. Bull. 2004, 53, 1914–1923. [Google Scholar] [CrossRef]
  41. Joensen, S.R.P.; Frindt, R.F. Morrison Single-layer MoS2. Mater. Res. Bull. 1986, 21, 457–461. [Google Scholar] [CrossRef]
  42. Gao, H.; Tan, M.; Rong, L.; Wang, Z.; Peng, J.; Jin, X.; Chen, G.Z. Preparation of Mo nanopowders through electroreduction of solid MoS2 in molten KCl-NaCl. Phys. Chem. Chem. Phys. 2014, 16, 19514–19521. [Google Scholar] [CrossRef]
  43. Kim, B.S.; Kim, E.Y.; Jeon, H.S.; Lee, H.I.; Lee, J.C. Study on the reduction of molybdenum dioxide, by hydrogen. Mater. Trans. 2008, 49, 2147–2152. [Google Scholar] [CrossRef] [Green Version]
  44. Kadiev, K.M.; Zekel’, L.A.; Kadieva, M.K.; Khadzhiev, S.N. Formation of polycondensation products in heavy oil feedstock hydroconversion in the presence of ultrafine catalyst: Physicochemical study. Pet. Chem. 2018, 58, 519–527. [Google Scholar] [CrossRef]
  45. Del Bianco, A.; Panariti, N.; di Carlo, S.; Beltrame, P.L.; Carniti, P. New Developments in deep hydroconversion of heavy oil residues with dispersed catalysts. 2. Kinetic aspects of reaction. Energy Fuels 1994, 8, 593–597. [Google Scholar] [CrossRef]
  46. Kadiev, K.M.; Kadieva, M.K.; Zekel, L.A.; Erman, E.S.; Khadzhiev, S.N. The properties of water-in-oil emulsions of aqueous solutions of precursors for nanosized catalysts. Colloid J. 2019, 81, 90–97. [Google Scholar] [CrossRef]
  47. Tye, C.T. Studies of Exfoliated Molybdenum Disulfide Catalyst in Hydrocracking and Hydroprocessing Reactions. Ph.D. Thesis, University of British Columbia, Vancouver, BC, Canada, 2006. [Google Scholar]
Figure 1. TEM images for TI-sample from test #2 (C(Mo) = 0.05%wt.).
Catalysts 11 00676 g001
Figure 2. TEM images of nanoparticles with a layered contrast in TI-sample from test #2 (C(Mo) = 0.05wt.%).
Catalysts 11 00676 g002
Figure 3. Dependence of 360 °C+ conversion and polycondensation products yield on the catalyst precursor loading.
Catalysts 11 00676 g003
Figure 4. Correlation between the yield of polycondensation products and MoS2 active sites dispersion in precursor loading variation tests.
Catalysts 11 00676 g004
Figure 5. Dependence of the ratio «360 °C+ conversion/polycondensation products yield» on catalyst active site dispersion in pressure variation tests.
Catalysts 11 00676 g005
Figure 6. Correlation between the yield of polycondensation products and catalyst active site dispersion) in pressure variation tests.
Catalysts 11 00676 g006
Figure 7. Scheme of high-pressure flow unit (1, 11—flow controller, 2—reservoir for feed emulsion, 3, 8, 9—filter and absorbers, 4—feed pump, 5—hydroconversion reactor, 6, 7—high-pressure and low-pressure separators, 10—gas-drying adsorber, 12—emulsion preparation section).
Catalysts 11 00676 g007
Table 1. Results of bituminous oil hydroconversion in the presence of in-situ synthesized Mo-containing catalyst (catalyst precursor-ammonium paramolybdate, water content in feed emulsion −2%wt., hydroconversion conditions: T = 450 °C, H2/feed = 1000 nL/L, V = 1.0 h−1, once-through mode).
Test #Hydroconversion Conditions360 °C+ Conversion, %Polycondensation Product Yield, wt.%
C(Mo), %wt.P, atm
Non-catalytic test
007058.66.0
Precursor loading variation
10.017057.71.9
20.057047.71.2
30.087041.81.0
Pressure variation
40.056042.30.3
20.057047.71.2
50.059046.10.3
Table 2. Distribution of product in hydroconversion experiments.
Value of Variable ParameterGaseous Products,
%wt.
Liquid ProductsPolycondensation Products,
wt.%
IBP–180 °C 180–360 °C 360–520 °C 520 °C+
Feed-5.517.236.540.8-
Non-catalytic test
C(Mo) = 0, P = 70 atm3.023.535.522.29.8 *6.0
Precursor loading variation
C(Mo) = 0.01%wt.2.422.639.921.910.8 *1.9
C(Mo) = 0.05%wt.2.120.037.025.814.6 *1.2
C(Mo) = 0.08%wt.1.017.634.922.322.7 *1.0
Pressure variation
P = 60 atm2.615.936.126.118.5 *0.3
P = 70 atm2.120.037.025.814.6 *1.2
P = 90 atm2.118.737.226.215.5 *0.3
* Excluding polycondensation products.
Table 3. Properties of hydroconversion products.
Value of Variable ParameterCharacteristicIBP–180 °C180–360 °C360–520 °C
FeedS, %wt.0.651.203.53
Precursor loading variation
C(Mo) = 0.01%wt.S, %wt.1.032.703.49
Iodine number, g J2/100 g63.630.6-
C(Mo) = 0.05%wt.S, %wt.0.912.573.45
Iodine number, g J2/100 g67.735.3-
C(Mo) = 0.08%wt.S, %wt.0.842.413.48
Iodine number, g J2/100 g61.026.0-
Pressure variation
P = 60 atmS, %wt.0.902.443.59
Iodine number, g J2/100 g70.346.3-
P = 70 atmS, %wt.0.912.573.45
Iodine number, g J2/100 g67.735.3-
P = 90 atmS, %wt.0.802.413.34
Iodine number, g J2/100 g63.134.9-
Table 4. Elemental composition of TI samples (normalized) *.
Test #N, %wt.C, %wt.H, %wt.S, %wt.Mo, %wt.H/C, wt.S/Mo, MolarStoichiometry
12.0 85.3 5.2 7.0 0.50.142.0MoS42C1359
22.1 80.2 4.9 9.1 3.70.17.4MoS7,4C173
32.3 76.1 4.7 9.3 7.60.13.6MoS3,6C80
42.9 68.0 4.1 10.9 14.10.12.3MoS2,3C39
52.9 64.4 4.0 13.4 15.30.12.6MoS2,6C34
* Standard deviation for C and S is 0.3%wt., for H and N −0.1%wt.
Table 5. The characteristics of Mo-containing aggregates in polycondensation solids according to TEM study.
Test #Average Size of Aggregates *, nmMorphology
1143Rounded particles, monoslabs, multilayered stackings, openwork formations
2105
369Rounded particles, monoslabs, multilayered stackings, openwork formations, onion-like structures
482Rounded particles, monoslabs, multilayered stackings, openwork formations
598
* Relative uncertainty for linear measurements <5%.
Table 6. Geometrical parameters of catalyst active phase (MoS2) in polycondensation products from heavy oil hydroconversion process.
Test # L ¯ *, nm N ¯ D, %
111.91.510
26.74.718
36.01.720
45.01.823
56.02.520
* Relative uncertainty for linear measurements <5%.
Table 7. Properties of the bituminous oil.
Parameter UnitAnalysis MethodResult
Density (20 °C)kg/m3ASTM D 1298963
Kinematic viscosity (100 °C)mm2/sASTM D 44522.5
Sulfur content%wt.ASTM D 42943.6
Nitrogen content%wt.ASTM D 3228 0.4
Metal content
vanadium
nickel
%wt.IP 470 
0.0250
0.0031
Elemental composition
carbon
hydrogen
oxygen
%wt.ASTM D 5291 
84.4
11.1
0.5
Heptane insolubles content%wt.IP 1438.1
Coking ability%wt.ASTM D 453010.1
>520 °C fraction content%wt.ASTM D 116040.8
Publisher’s Note: MDPI stays neutral with regard to jurisdictional claims in published maps and institutional affiliations.

