Article

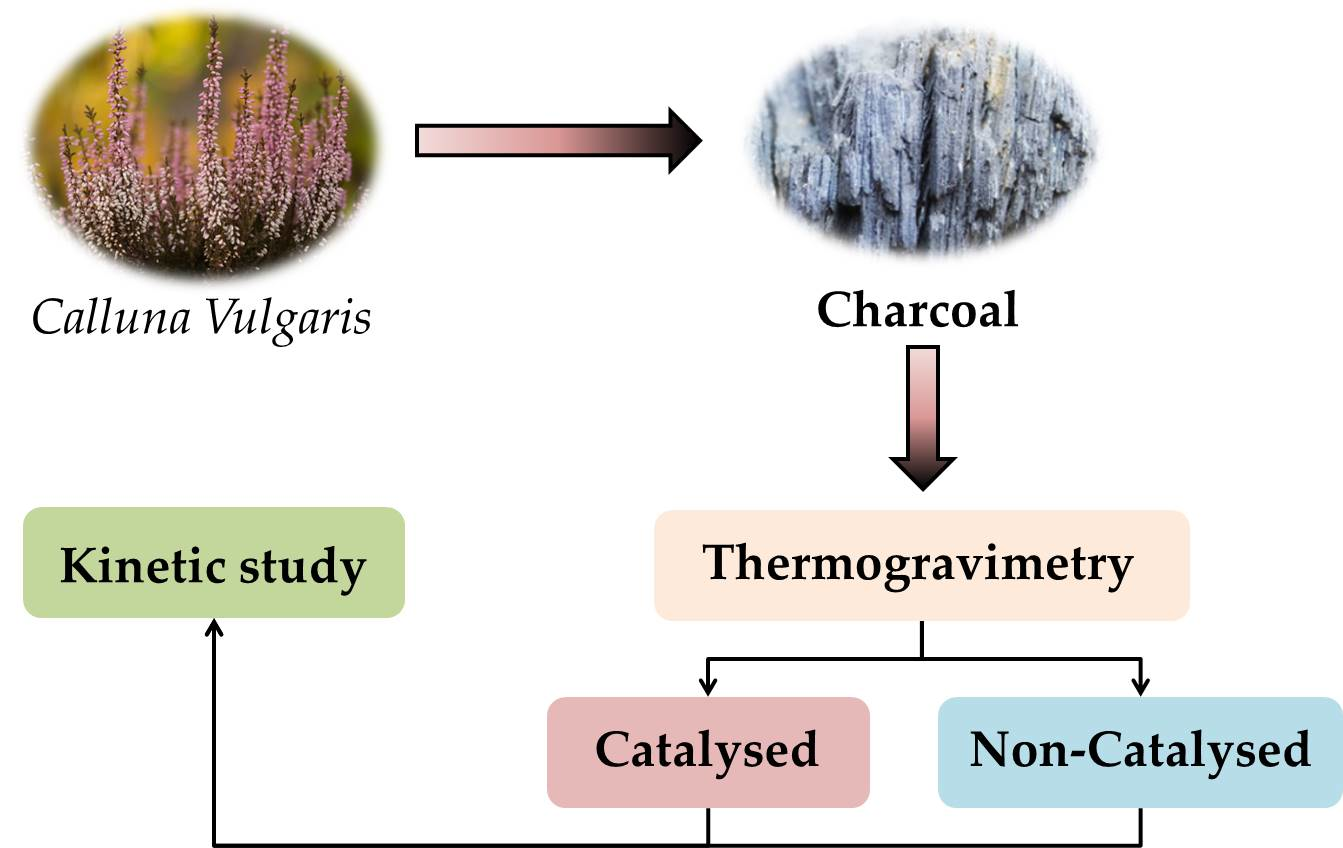
Thermogravimetry of the Steam Gasification of Calluna vulgaris: Kinetic Study

by
José María Encinar
1,
Juan Félix González
2 and
Sergio Nogales-Delgado
1,*
1
Department of Chemical Engineering and Physical-Chemistry, University of Extremadura, Avda. De Elvas s/n, 06006 Badajoz, Spain
2
Department of Applied Physics, University of Extremadura, Avda. De Elvas s/n, 06006 Badajoz, Spain
*
Author to whom correspondence should be addressed.
Catalysts 2021, 11(6), 657; https://doi.org/10.3390/catal11060657
Submission received: 23 April 2021 / Revised: 19 May 2021 / Accepted: 20 May 2021 / Published: 22 May 2021

Abstract

:
On account of the continuous decrease in oil reserves, as well as the promotion of sustainable policies, there is an increasing interest in biomass conversion processes, which imply the search for new raw materials as energy sources, like forestry and agricultural wastes. On the other hand, gasification seems to be a suitable thermal conversion process for this purpose. This work studied the thermogravimetry of the steam gasification of charcoal from heather (Calluna vulgaris) in order to determine the kinetics of the process under controlled reaction conditions. The variables studied were temperature (from 750 to 900 °C), steam partial pressure (from 0.26 to 0.82 atm), initial charcoal mass (from 50 to 106 mg), particle size (from 0.4 to 2.0 mm), N2 and steam volumetric flows (from 142 to 446 mL·min−1) and catalyst (K2CO3) concentration (from 0 to 10% w/w). The use of the shrinking core model and uniform conversion model allowed us to determine the kinetic parameters of the process. As a result, a positive influence of catalyst concentration was found up to 7.5% w/w. The kinetic study of the catalytic steam gasification showed activation energies of 99.5 and 114.8 kJ·mol−1 and order of reactions (for steam) of 1/2 and 2/3.

Graphical Abstract

1. Introduction

Due to the continuous decrease in oil reserves, as well as other concerns about the use of fossil fuels (such as air pollution), there has been an increasing interest in the search for alternative energy sources [1]. Among these energy sources, and due to its renewable nature, biomass (from wastes or natural sources) is gaining importance, supported by policies carried out by governments such as the European Union [2]. Indeed, many international agencies and agreements promote the progressive use of renewable energies [3]. This way, the evolved gases in the atmosphere are reduced, contributing to a reduction in the greenhouse effect [4].
There are several thermal conversion processes for biomass, some of which have been gaining interest recently, such as combustion, pyrolysis, and gasification [5]. Nevertheless, gasification seems to be one of the most technologically attractive ones, both at a medium and large scale. Moreover, gasification carried out in non-oxidizing conditions decreases the emission of pollutants and, as a consequence, contributes to palliate the greenhouse effect. In that case, steam gasification offers an attractive alternative for fossil-free production (biofuel and materials) and also for heat power generation [6].
Wastes from biomass are usually more reactive than mineral coal, both in the case of pyrolysis and gasification. This way, the rate of biomass gasification is from 4 to 10 times higher than in the case of lignite [7,8], as a consequence of its physical and chemical properties. Thus, the volatile content (80–90%) is twice as high as in the case of mineral coals. For biomass, the hydrogen/carbon and oxygen/carbon mole ratios are in the range of 1.3–1.5 and 0.5–0.5, respectively. These values are considerably higher than those of coals that, generally, are in the range of 0.8–0.9 and 0.1–0.3, respectively. Finally, charcoal from biomass, especially from wood, has porosity values between 40% and 50% with pore size distributions between 20 and 30 µm, compared to coals, with porosities between 2% and 18% and pore sizes around 5 Å [8]. As a consequence, the gasification of charcoals can have a good potential in the development of new energy sources and chemical products.
Regarding the optimization of the operational strategies and design of facilities for the steam gasification of biomass, many aspects should be taken into account such as size, design, operation, or control strategies, with some authors considering that the technology used for steam gasification processes is usually robust [6]. The design of the facilities where gasification processes are carried out requires previous knowledge of kinetics parameters. The kinetics of coal gasification has been assessed in numerous studies, both theoretically and experimentally. The aim of these studies is broad, including the effect of small quantities of inorganic materials on the rate of the process, the practical applications of gasification, and the development of combustion processes where the emission of carbon compounds are minimized [9]. In general, the non-catalytic gasification of coal is considered a typical gas-solid heterogeneous reaction, where the rate is proportional to the available, total surface of the solid [10]. In this process, diffusional effects usually take part, so the conditions forcontrol by the chemical reaction should be ensured. In this way, the kinetic parameters determined can be considered reliable. This fact implies the development of wide experimentation, including the study of fluid dynamic variables such as gas flow and others like initial mass and particle size [11].
The commercial development of gasification processes requires an abundant and cheap raw material. One possibility is the use of solid wastes (such as those derived from gloves, paper towels, or sawdust) [12] or agricultural and forestry wastes from industrial processes related to food crops [13,14]. Another possibility is the use of raw materials from non-food crops or directly from abundant plants that grow spontaneously in the countryside [15]. In that context, heather (Calluna vulgaris) could play an important role, as it could be used as a bioenergy crop that could be easily grown in acid or barren lands, appearing spontaneously in shrublands in Europe, North Africa, and America [16]. Thus, some studies have pointed out this possibility, as is the case for the United Kingdom, where the potential energy production across this area was 40.7 PJ·yr−1, and the potential greenhouse saving was 2061 ktonnes CO2eq·yr−1 (considering that Calluna vulgaris could be brought into production, as a substitute for coal) [17]. However, other studies carried out in the Iberian Peninsula (where heather is abundant) have pointed out that the harvesting process can play an important role, possibly reducing the yield in the biomass harvesting and increasing the loss of material that remains in the soil in certain cases [18].
Considering the above, and taking into account previous studies [11,19,20,21], a thermogravimetric study on the steam gasification of heather (Calluna vulgaris) charcoal was carried out. Heather is a very abundant plant in the Extremadura region (Spain), growing spontaneously in shrublands. The aim of this work was to determine the influence of several variables on gasification and carry out a kinetic study under conditions of control by the chemical reaction.

2. Results and Discussion

2.1. Uncatalyzed Steam Gasification of Heather. Influence of Operating Variables

As it was indicated, the operating variables selected in this experimental set were temperature, steampartial pressure, initial charcoal mass, total volumetric flow, and particle size. The aim of the study on the influence of operating variables was the selection of suitable values so that the process is controlled by the chemical reaction. The influence of each variable is explained below.

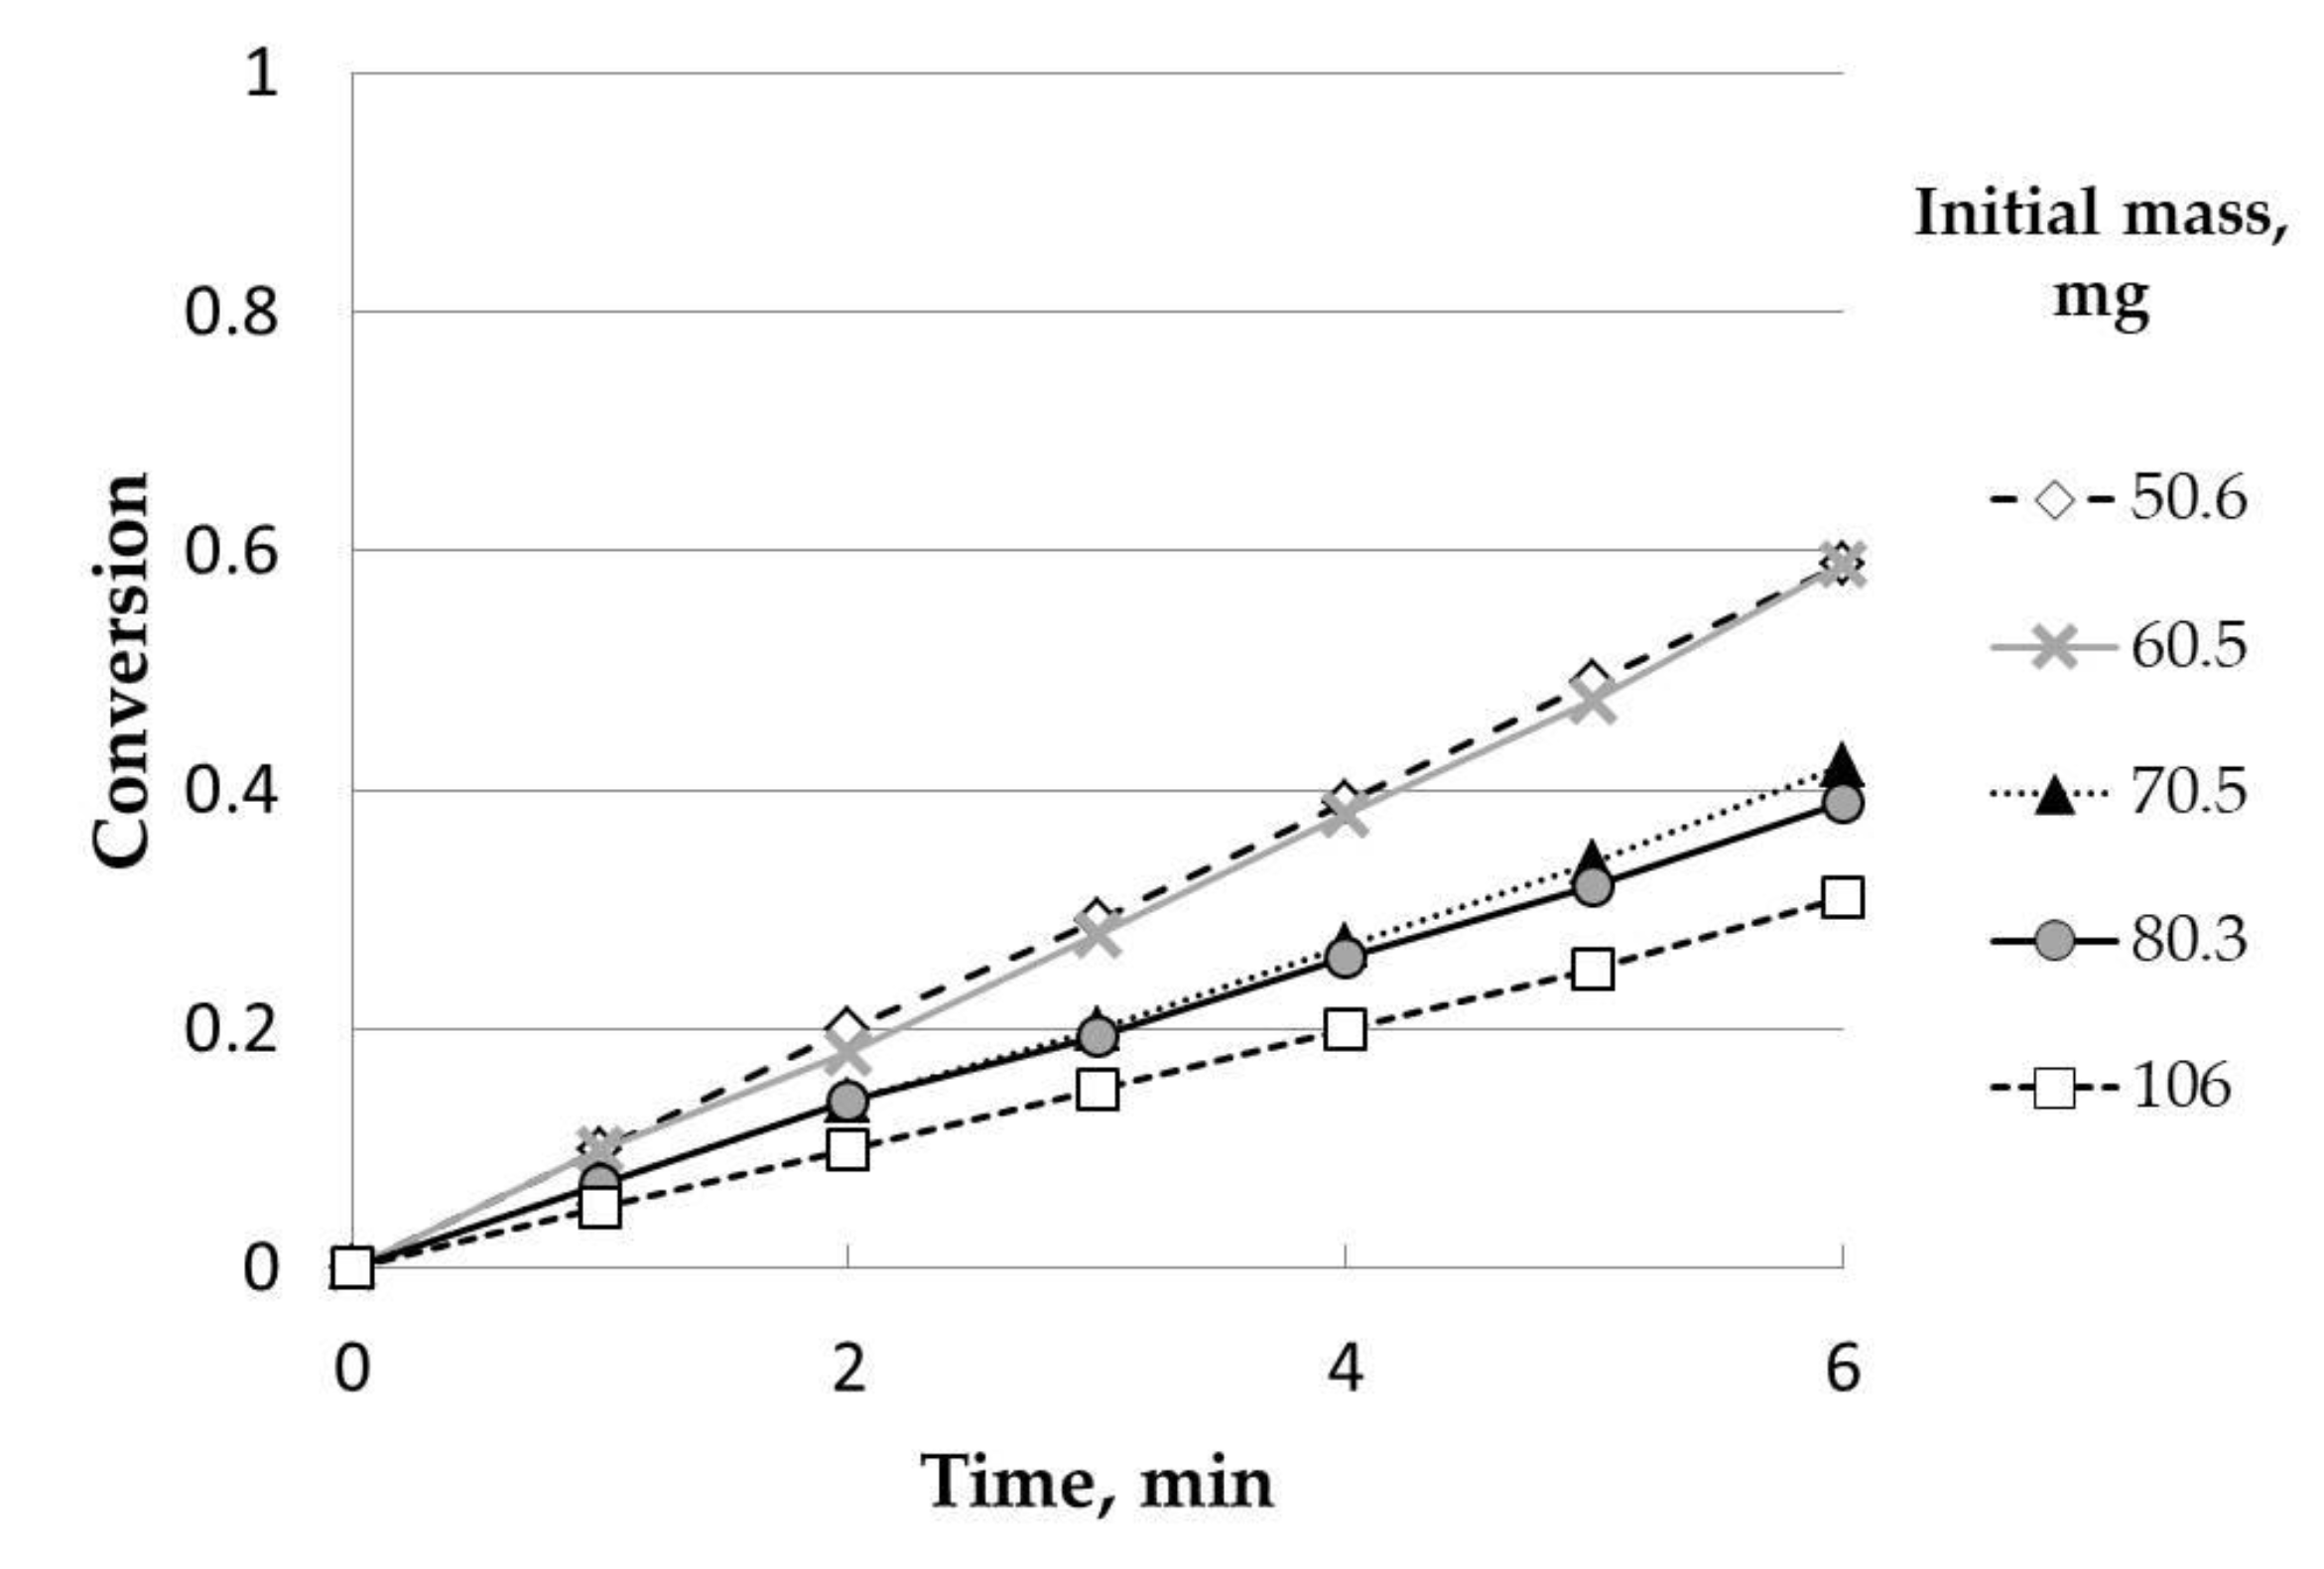
2.1.1. Influence of the Initial Charcoal Mass

Regarding the initial mass of heather charcoal, five experiments, with initial weights of 106, 80, 70, 60, and 50 mg, were carried out. Figure 1 shows the main results obtained. According to previous studies, the presence of external diffusional effects in a bed of particles coulddepend on the H/2R ratio, where H is the height of the bed and R is the bed radius [21,22]. The value from which the diffusional effects are negligible depends on many characteristics (the experimental facility used, raw material, etc.). As a consequence, it is necessary to resort to testing to determine this value, that is, an initial mass value below which these effects are negligible. In this case, as in previous studies, the radius of the bed was constant, and the increase in the mass of the sample implied an increase in height [21]. The procedure followed to determine this value consisted in calculating the conversion at different reaction times for all the experiments carried out. This way, it was observed that, for a given reaction time, conversion increased as the initial mass decreased. This trend stopped for initial mass values below 60 mg. Thus, conversion values were similar for the experiments carried out at 60 and 50 mg. As a consequence, the value chosen to carry out the rest of the experiments was around 50 mg.

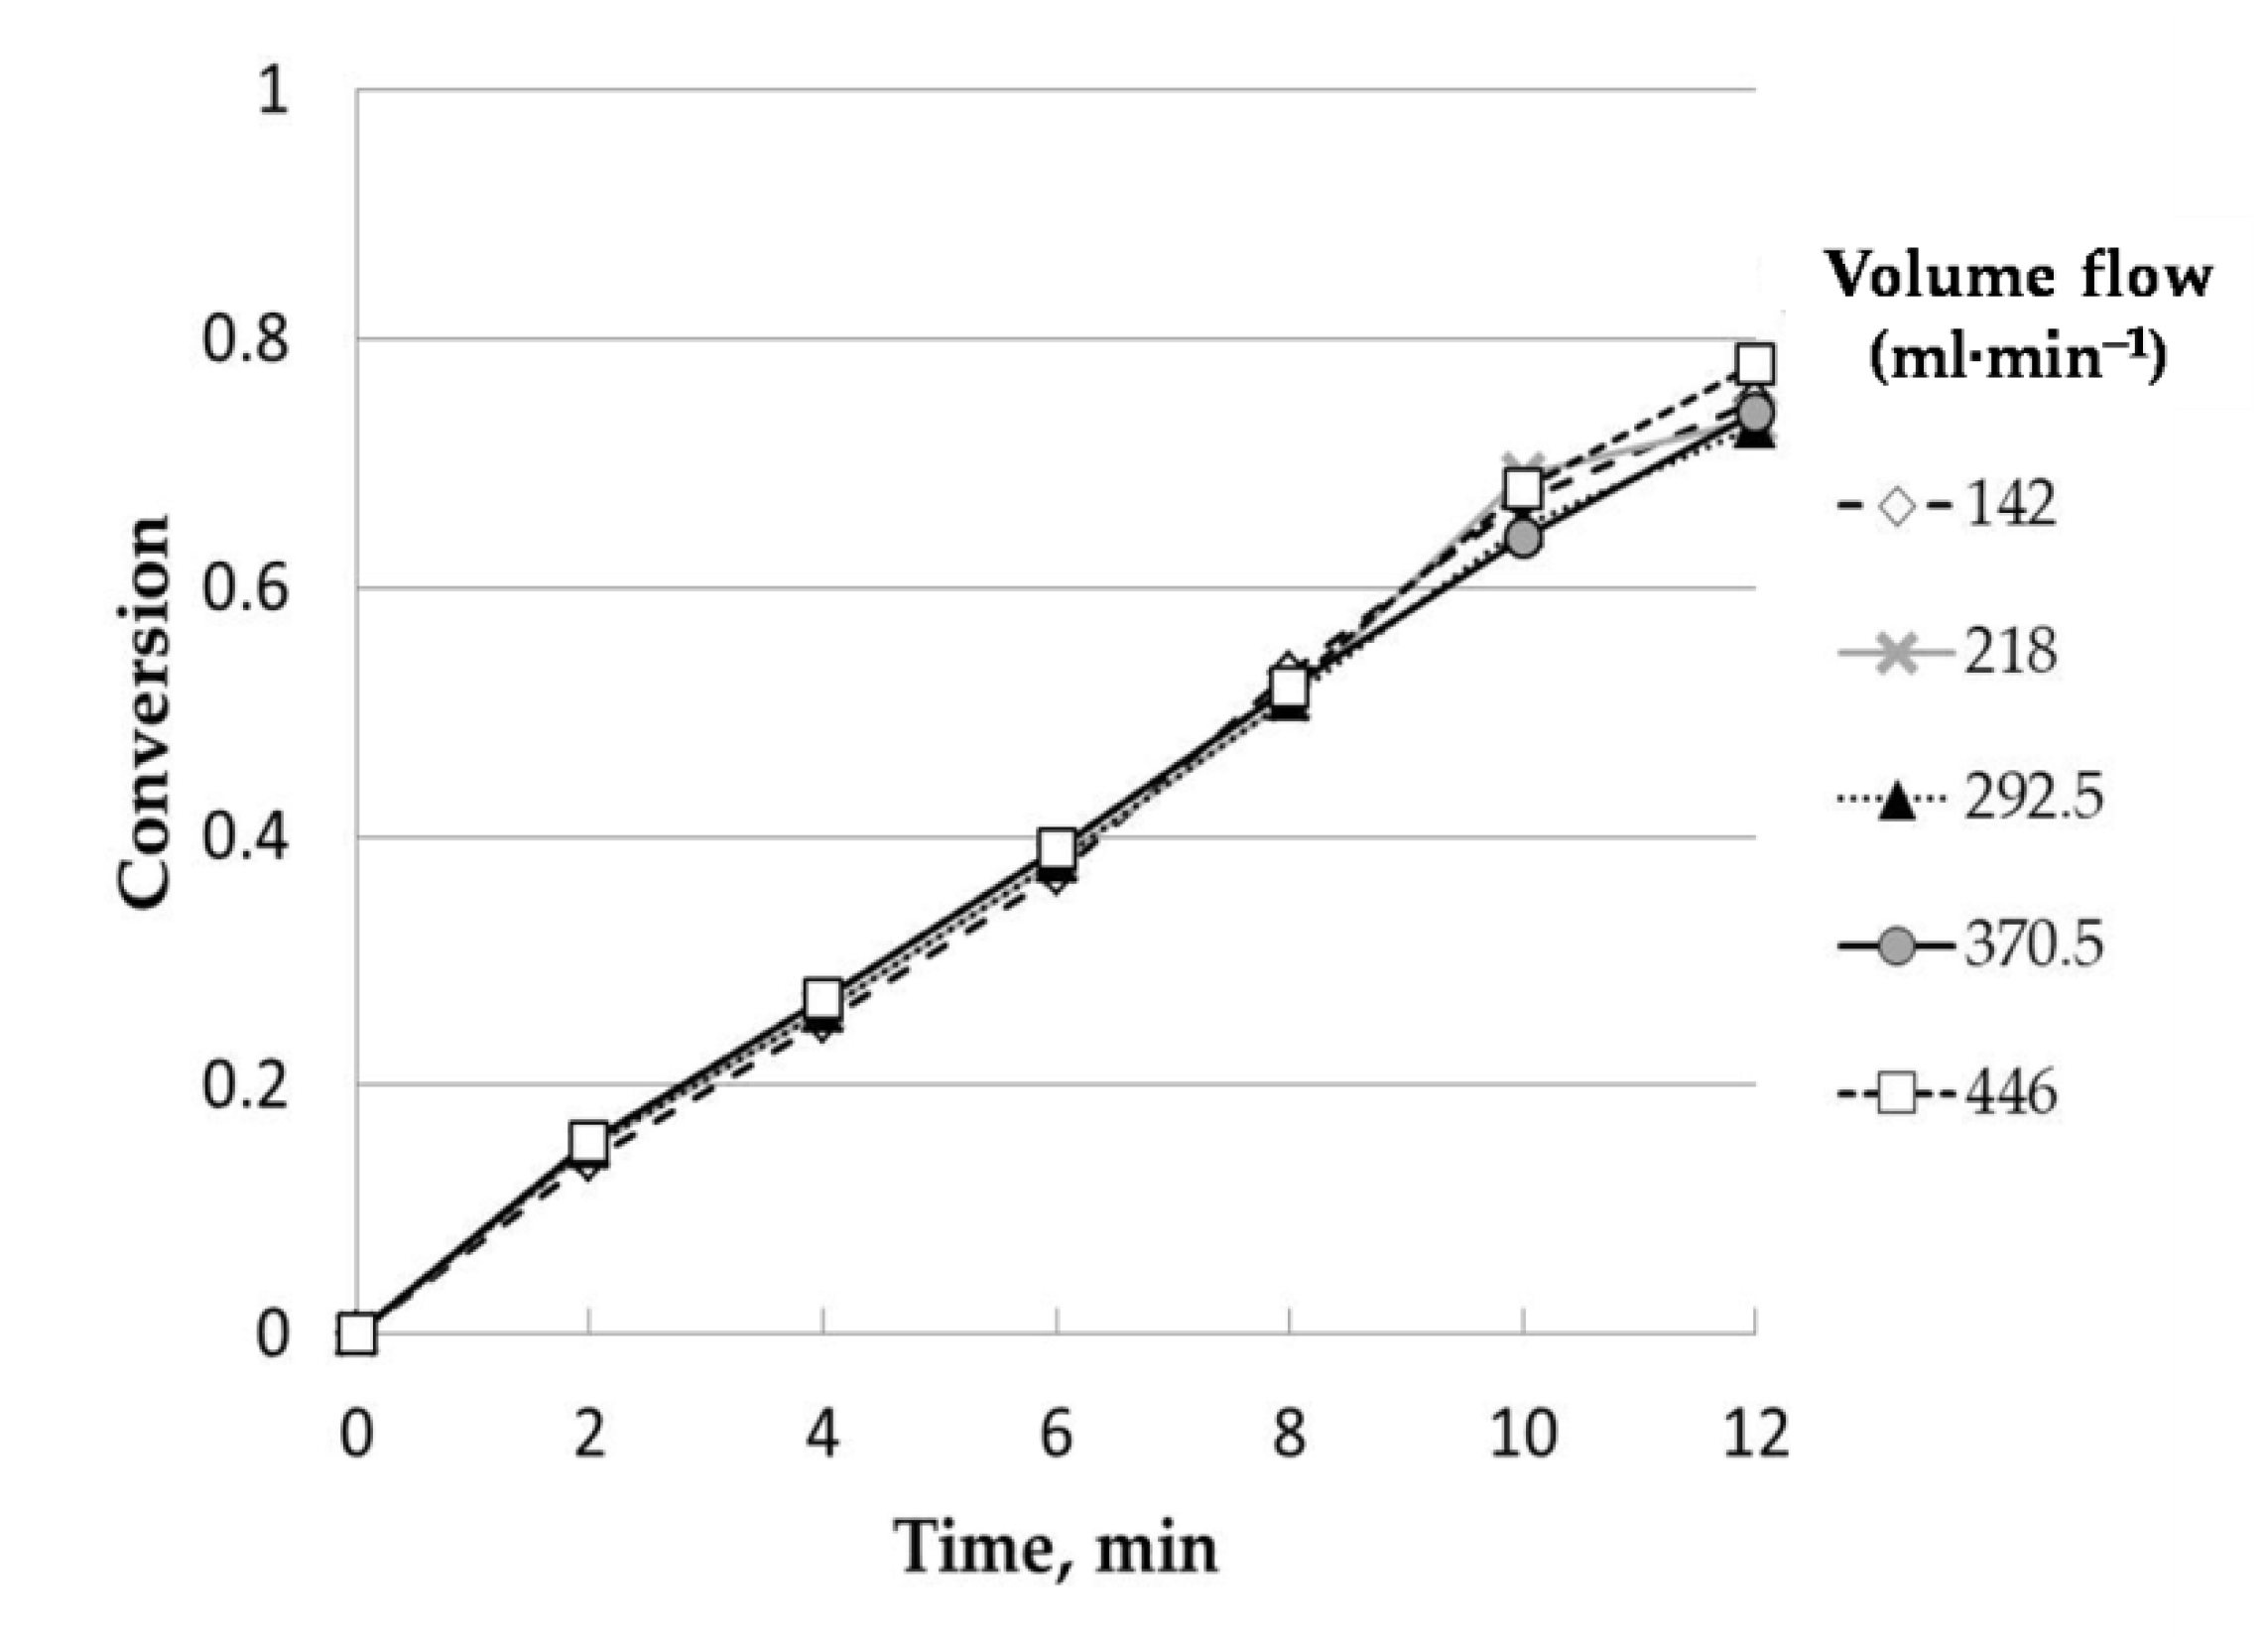
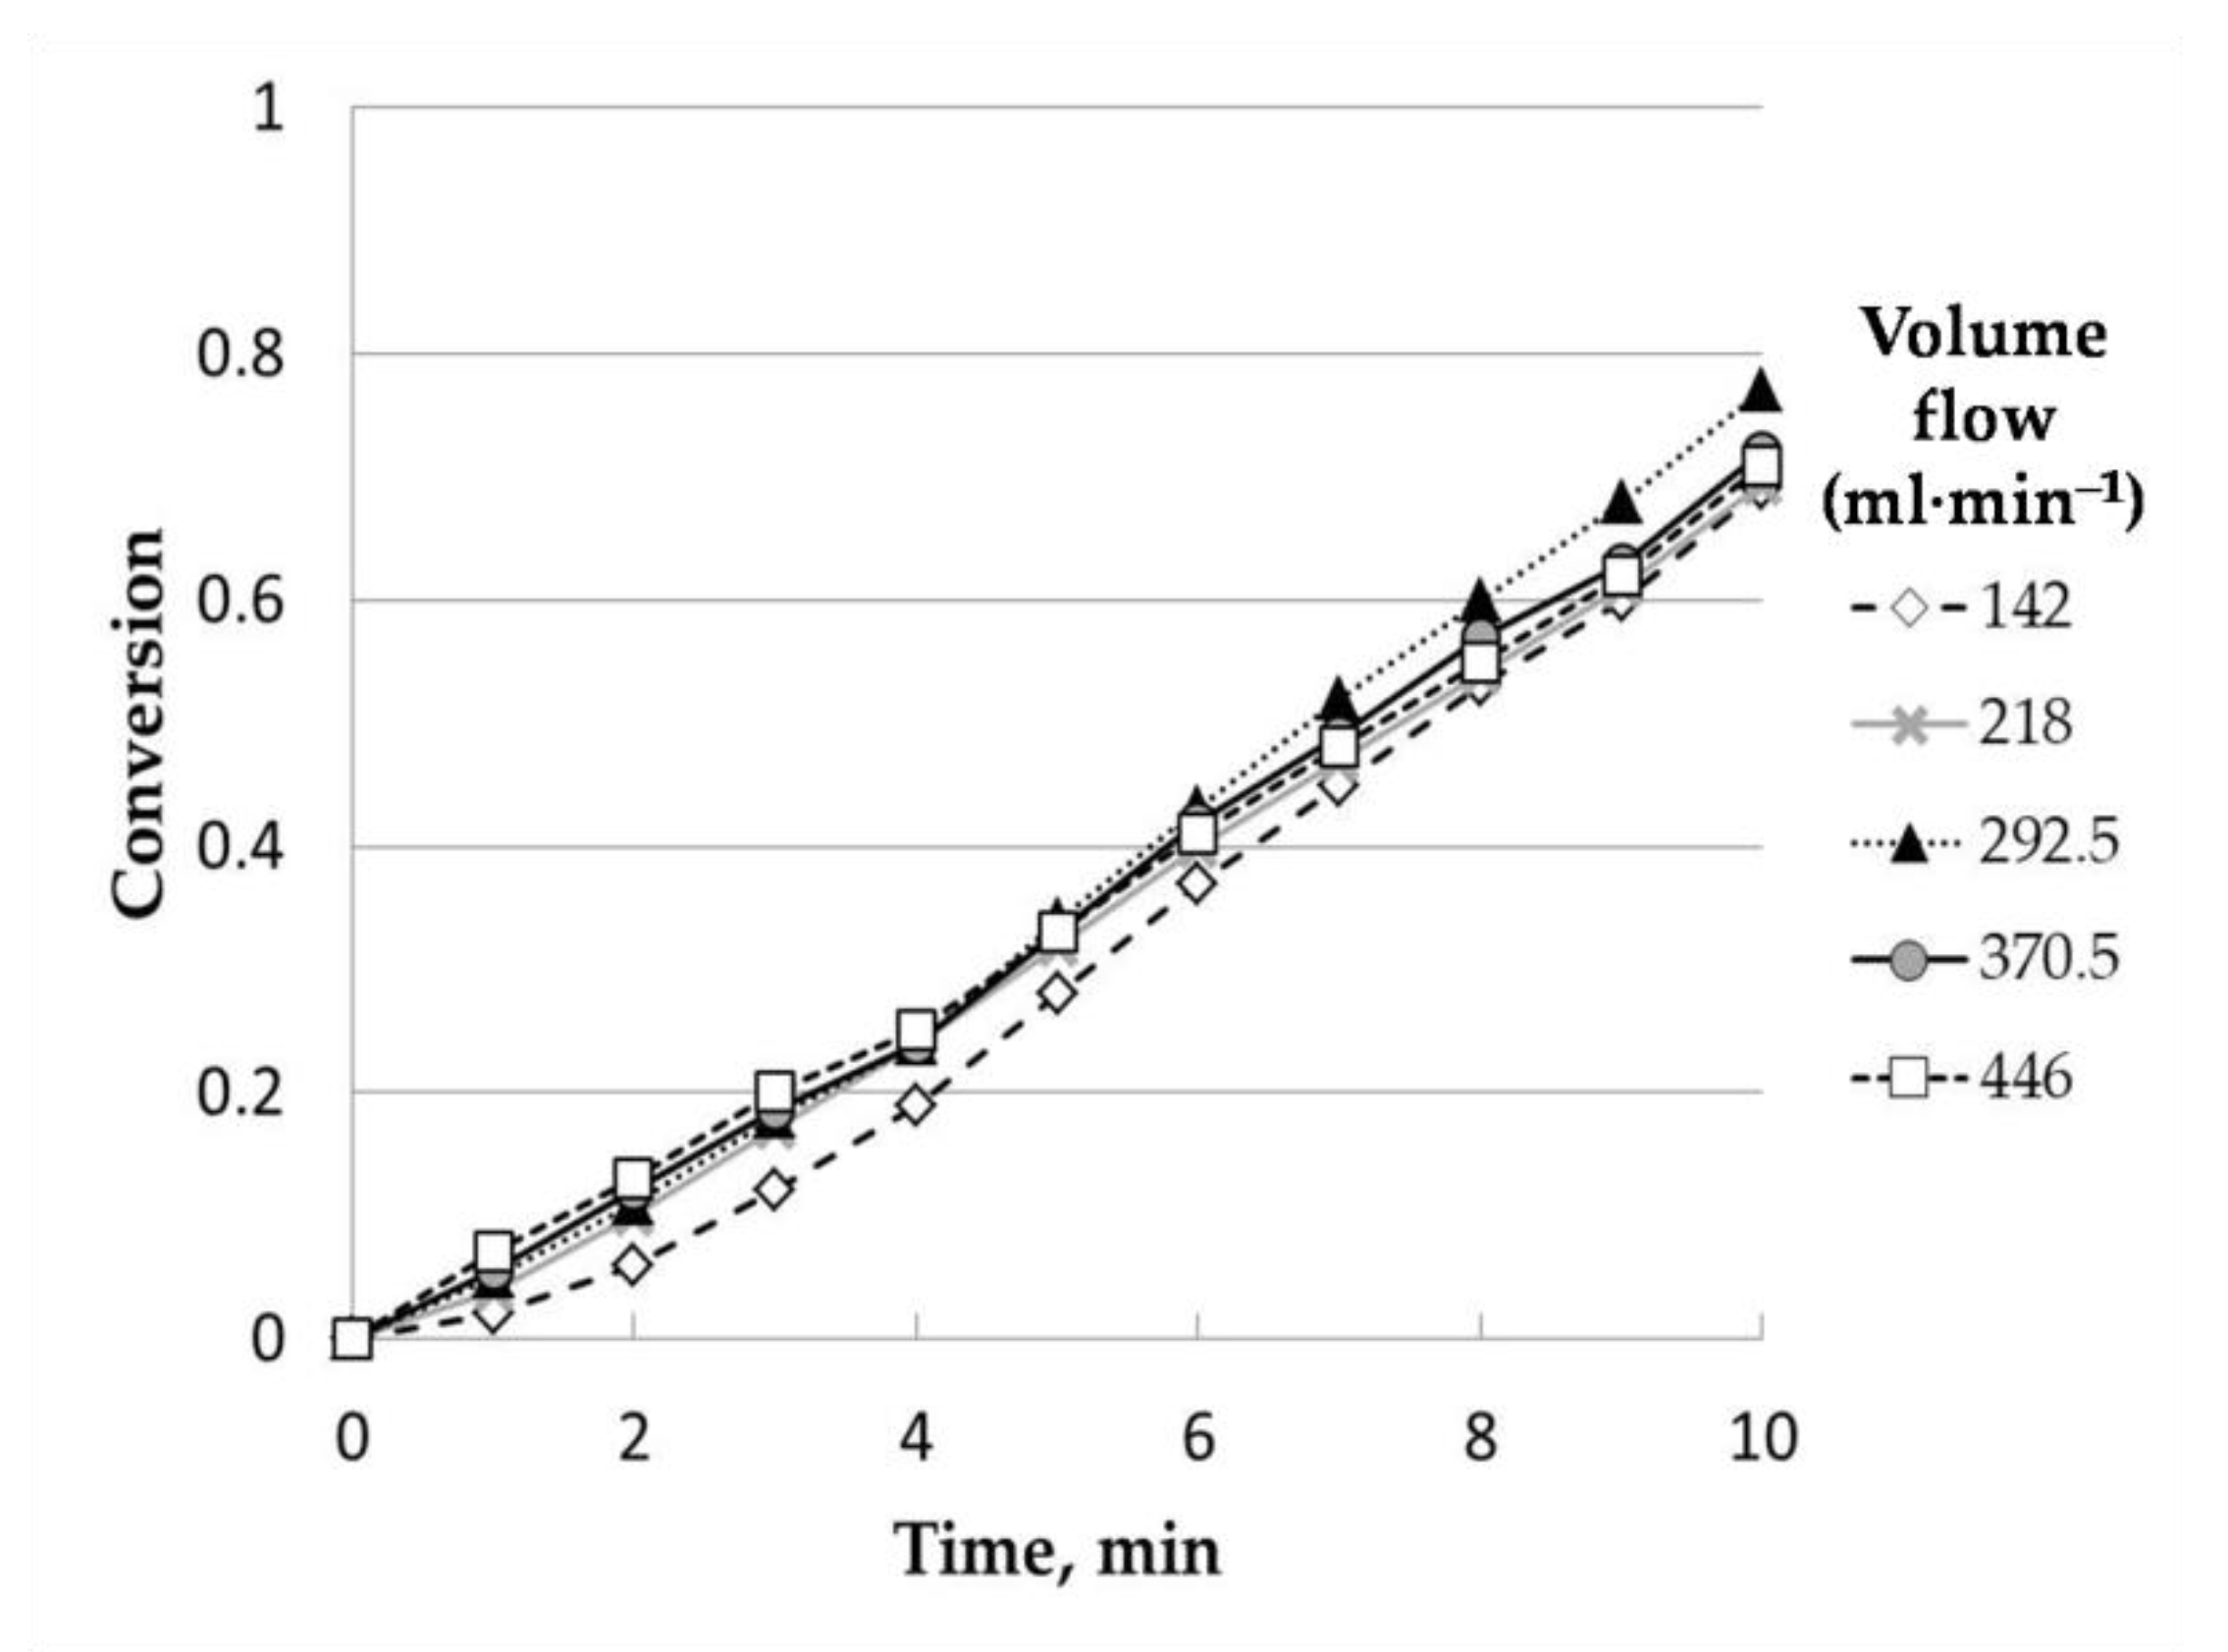
2.1.2. Influence of Volumetric Flow

Figure 2 includes the results corresponding to five experiments with different total volumetric flows (nitrogen and steam) of 142, 218, 292, 370, and 446 mL/min. For all these experiments, the steam partial pressure was kept at 0.50 atm. The total volumetric flow of the mixture of steam and nitrogen mainly affected the mass transfer coefficient through the gaseous film that surrounds the charcoal particle. The aim of this experimental set was to determine the volumetric flow from which the reaction conversion was not affected by this parameter, that is, to select a value from which the external diffusional resistance does not control the process. The results obtained were clear, and conversion did not change with the total volumetric flow.Thus, conversion was independent of the space velocity, which ensured the absence of external mass transfer. Based on this, the chosen value for this variable was 275 mL·min−1.

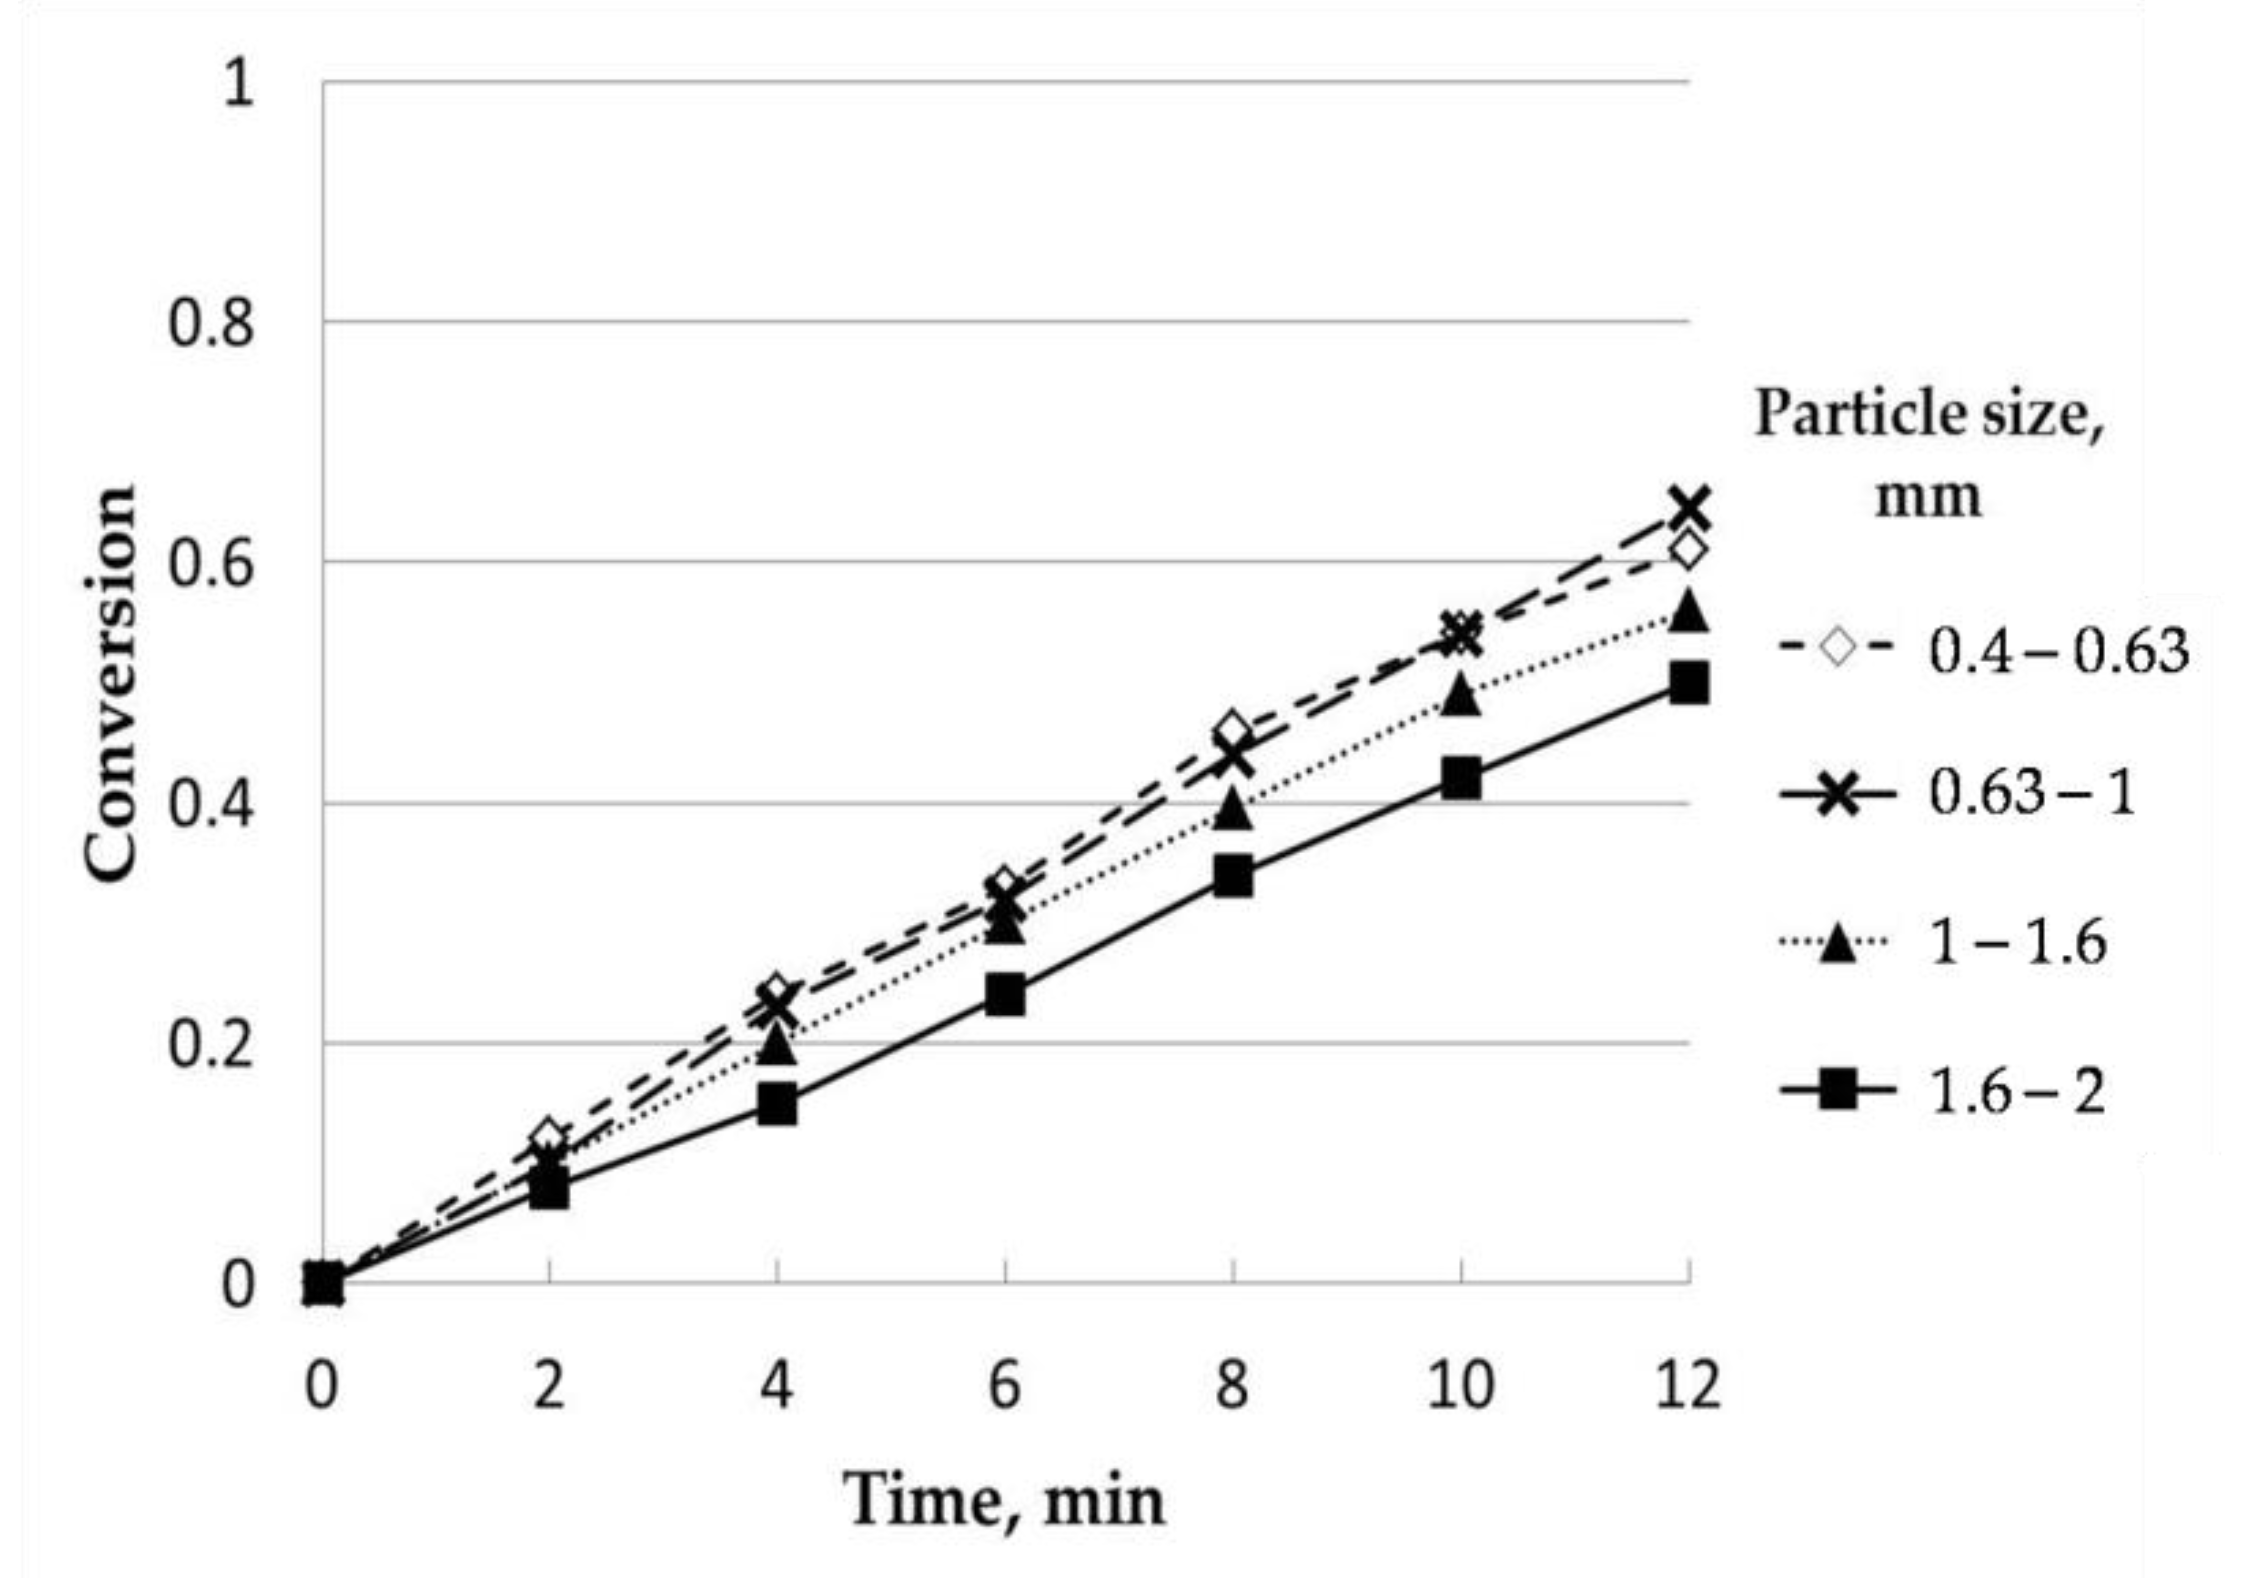
2.1.3. Influence of Particle Size

Four different particle sizes were tested, in ranges within 0.4–0.63, 0.63–1.00, 1.00–1.60, and 1.60–2.00 mm. The particle size profile was the following: 0.4–0.63 mm, 16.72%; 0.63–1.00 mm, 25.43%; 1.00–1.60 mm, 32.99%; 1.60–2.00 mm; 18.96%. The remaining percentage (5.9%) was related to particle sizes below 0.40 mm and above 2.00 mm, which were removed. The influence observed was almost negligible. Except for the experiment carried out with the highest range of particle size, conversion seemed to be independent of this variable, with similar values. Under these circumstances, the particle size selected was in the range of 0.63–1.00 mm. According to the literature, the effect of particle size on gasification rate was described as a complex process with different effects depending on the particle size range selected [23,24] due to the difference in the properties of the raw materials used. Generally, an increase in reactivity was observed as the particle size was smaller, which could be explained by the increase in the specific surface area [25]. Although this fact is also dependent on the porosity of charcoals, as there are also studies where the trend observed was the opposite, that is, with a decrease in reactivity as the particle size was smaller [26]. On the other hand, from a theoretical point of view, and according to ideal models for gas-solid reactions, the dependence between the time required for total conversion of the particle and its ratio was proportional to Rn, where n can vary from 0 to 2. In the section devoted to the kinetic study, the corresponding expressions will be commented on.
Regarding Figure 3, as particle size decreased, there was an increase in conversion, selecting 0.63–1 as the optimum parameter for the rest of the analysis.

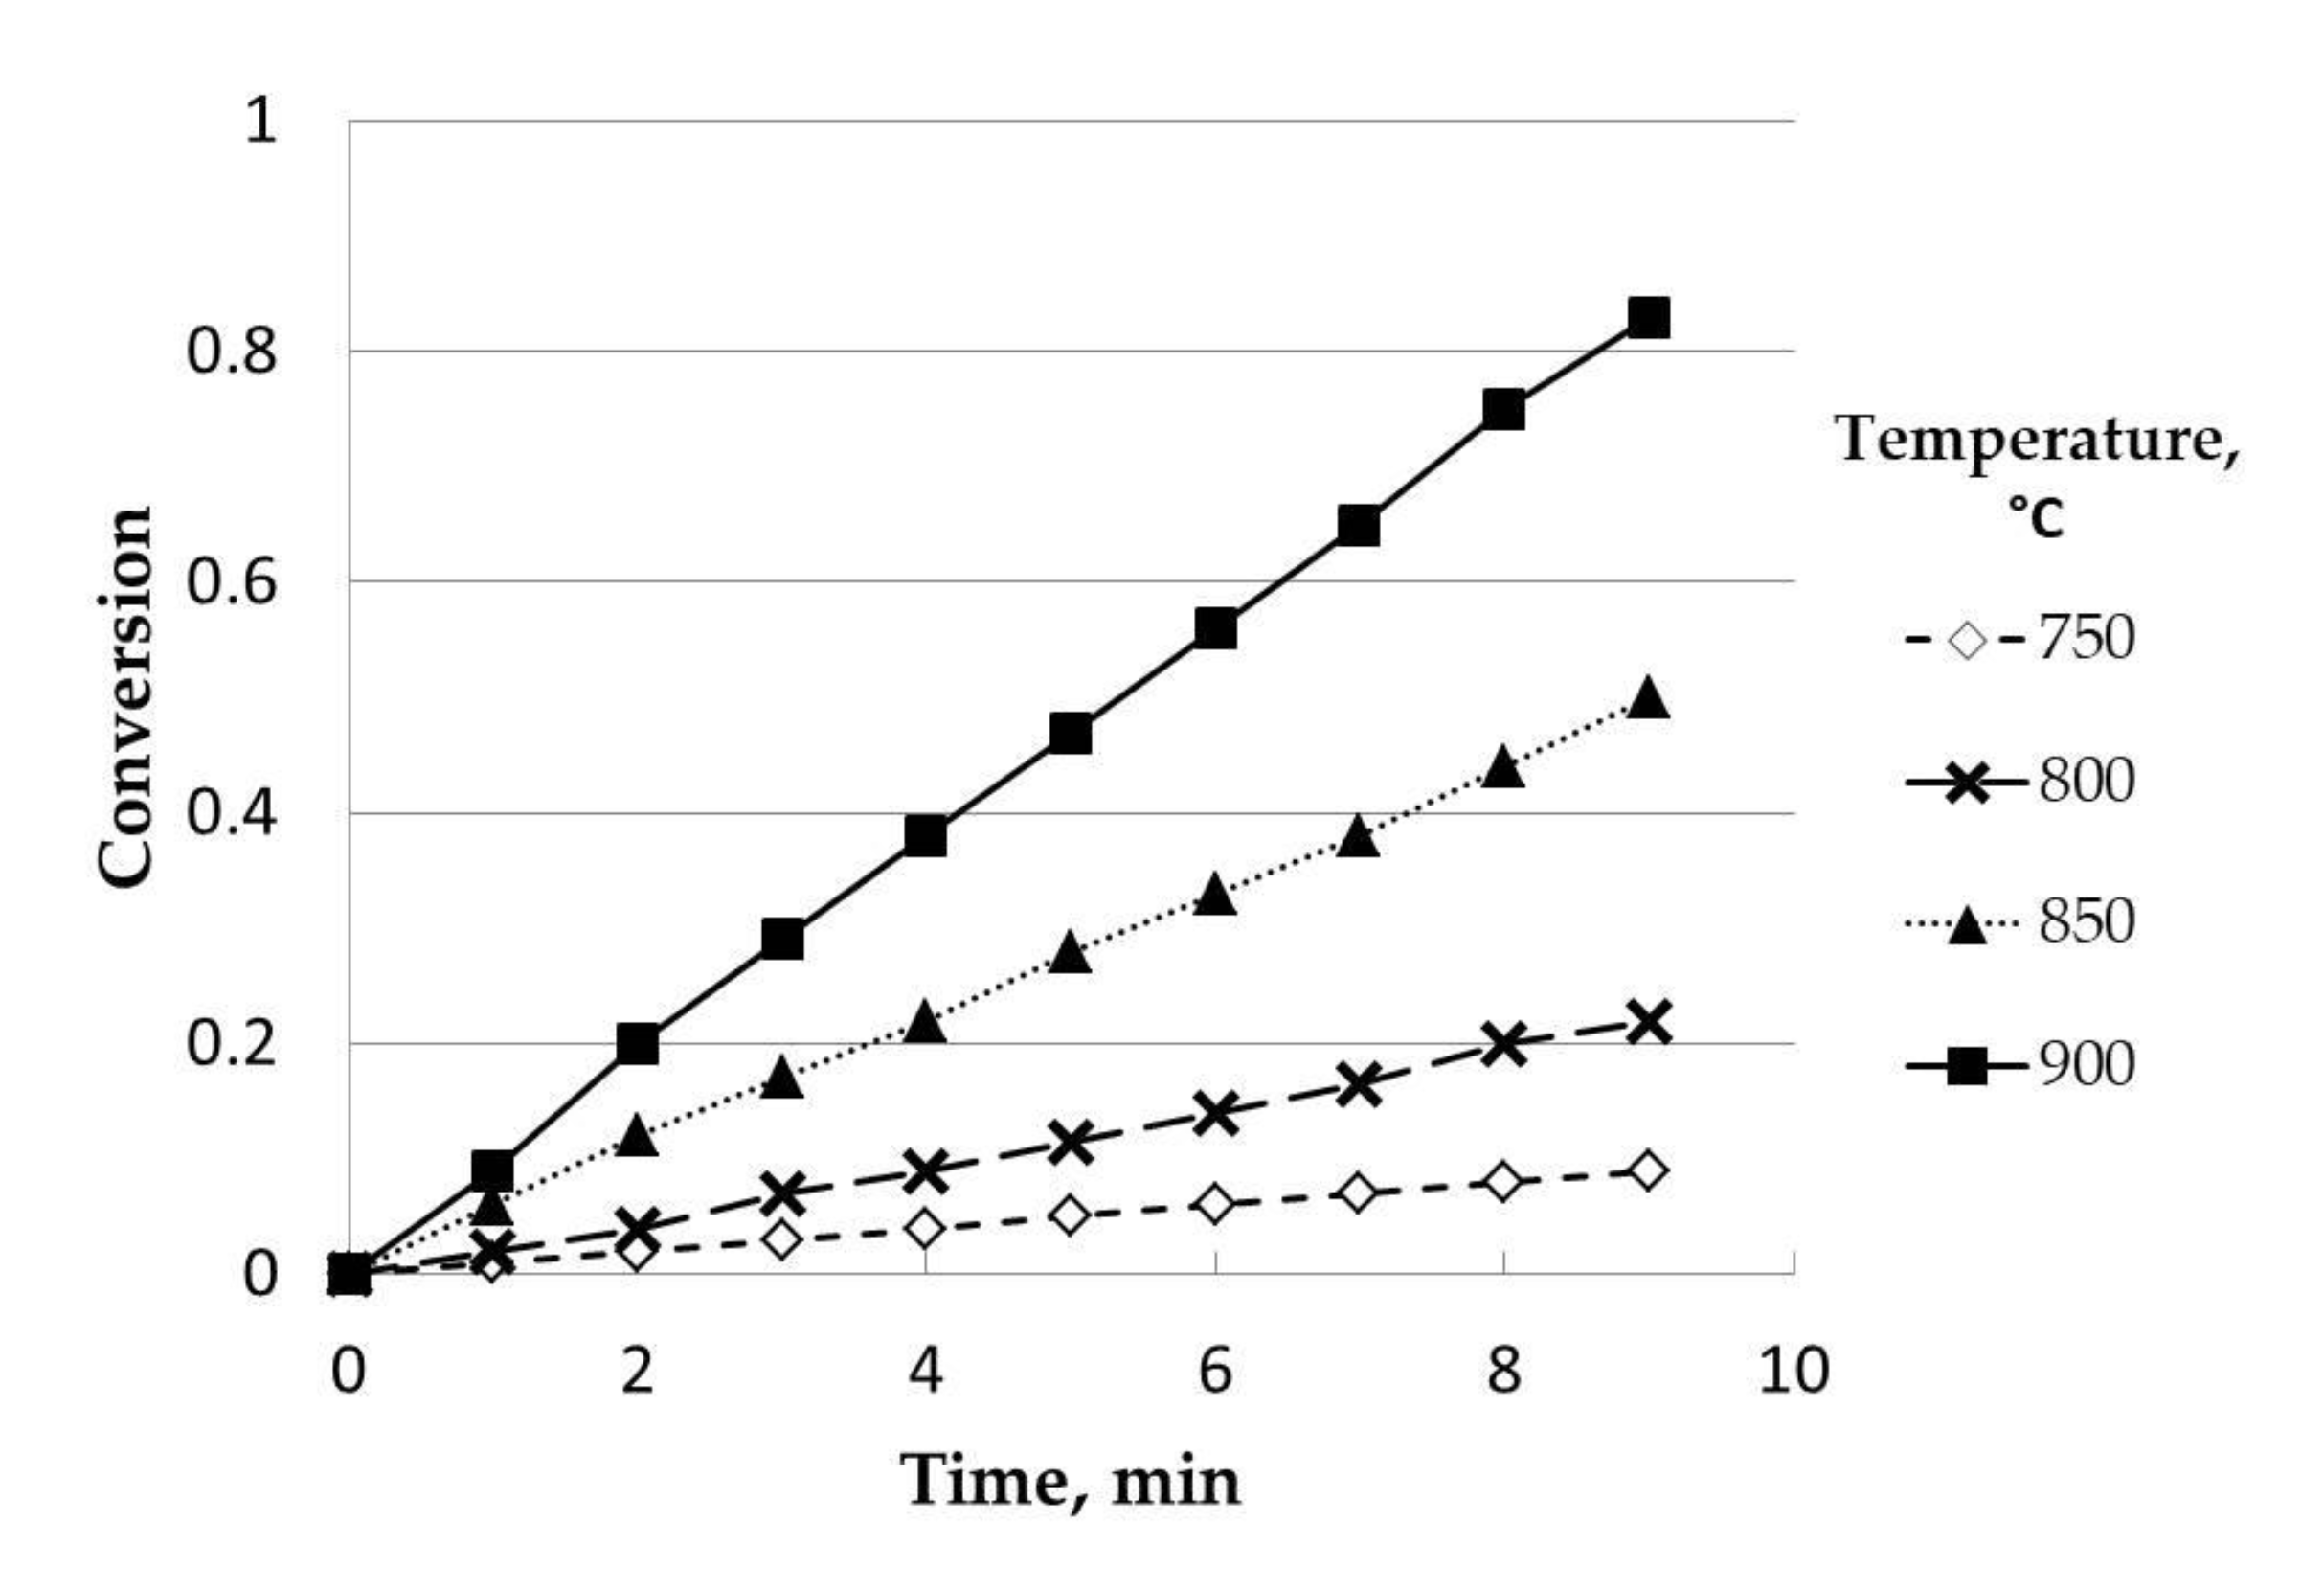
2.1.4. Influence of Temperature

Four experiments at different temperatures, 750, 800, 850, and 900 °C, were carried out. As can be seen in Figure 4, the influence of this variable was positive for all the experimental ranges studied. Thus, the conversion for a certain reaction time was higher as the temperature increased. This dependence was expected and agrees with the classical relationship between reaction rate and temperature. As other authors pointed out, the gasification rate is highly dependent on temperature, showing a higher reactivity and shorter reaction times [14].

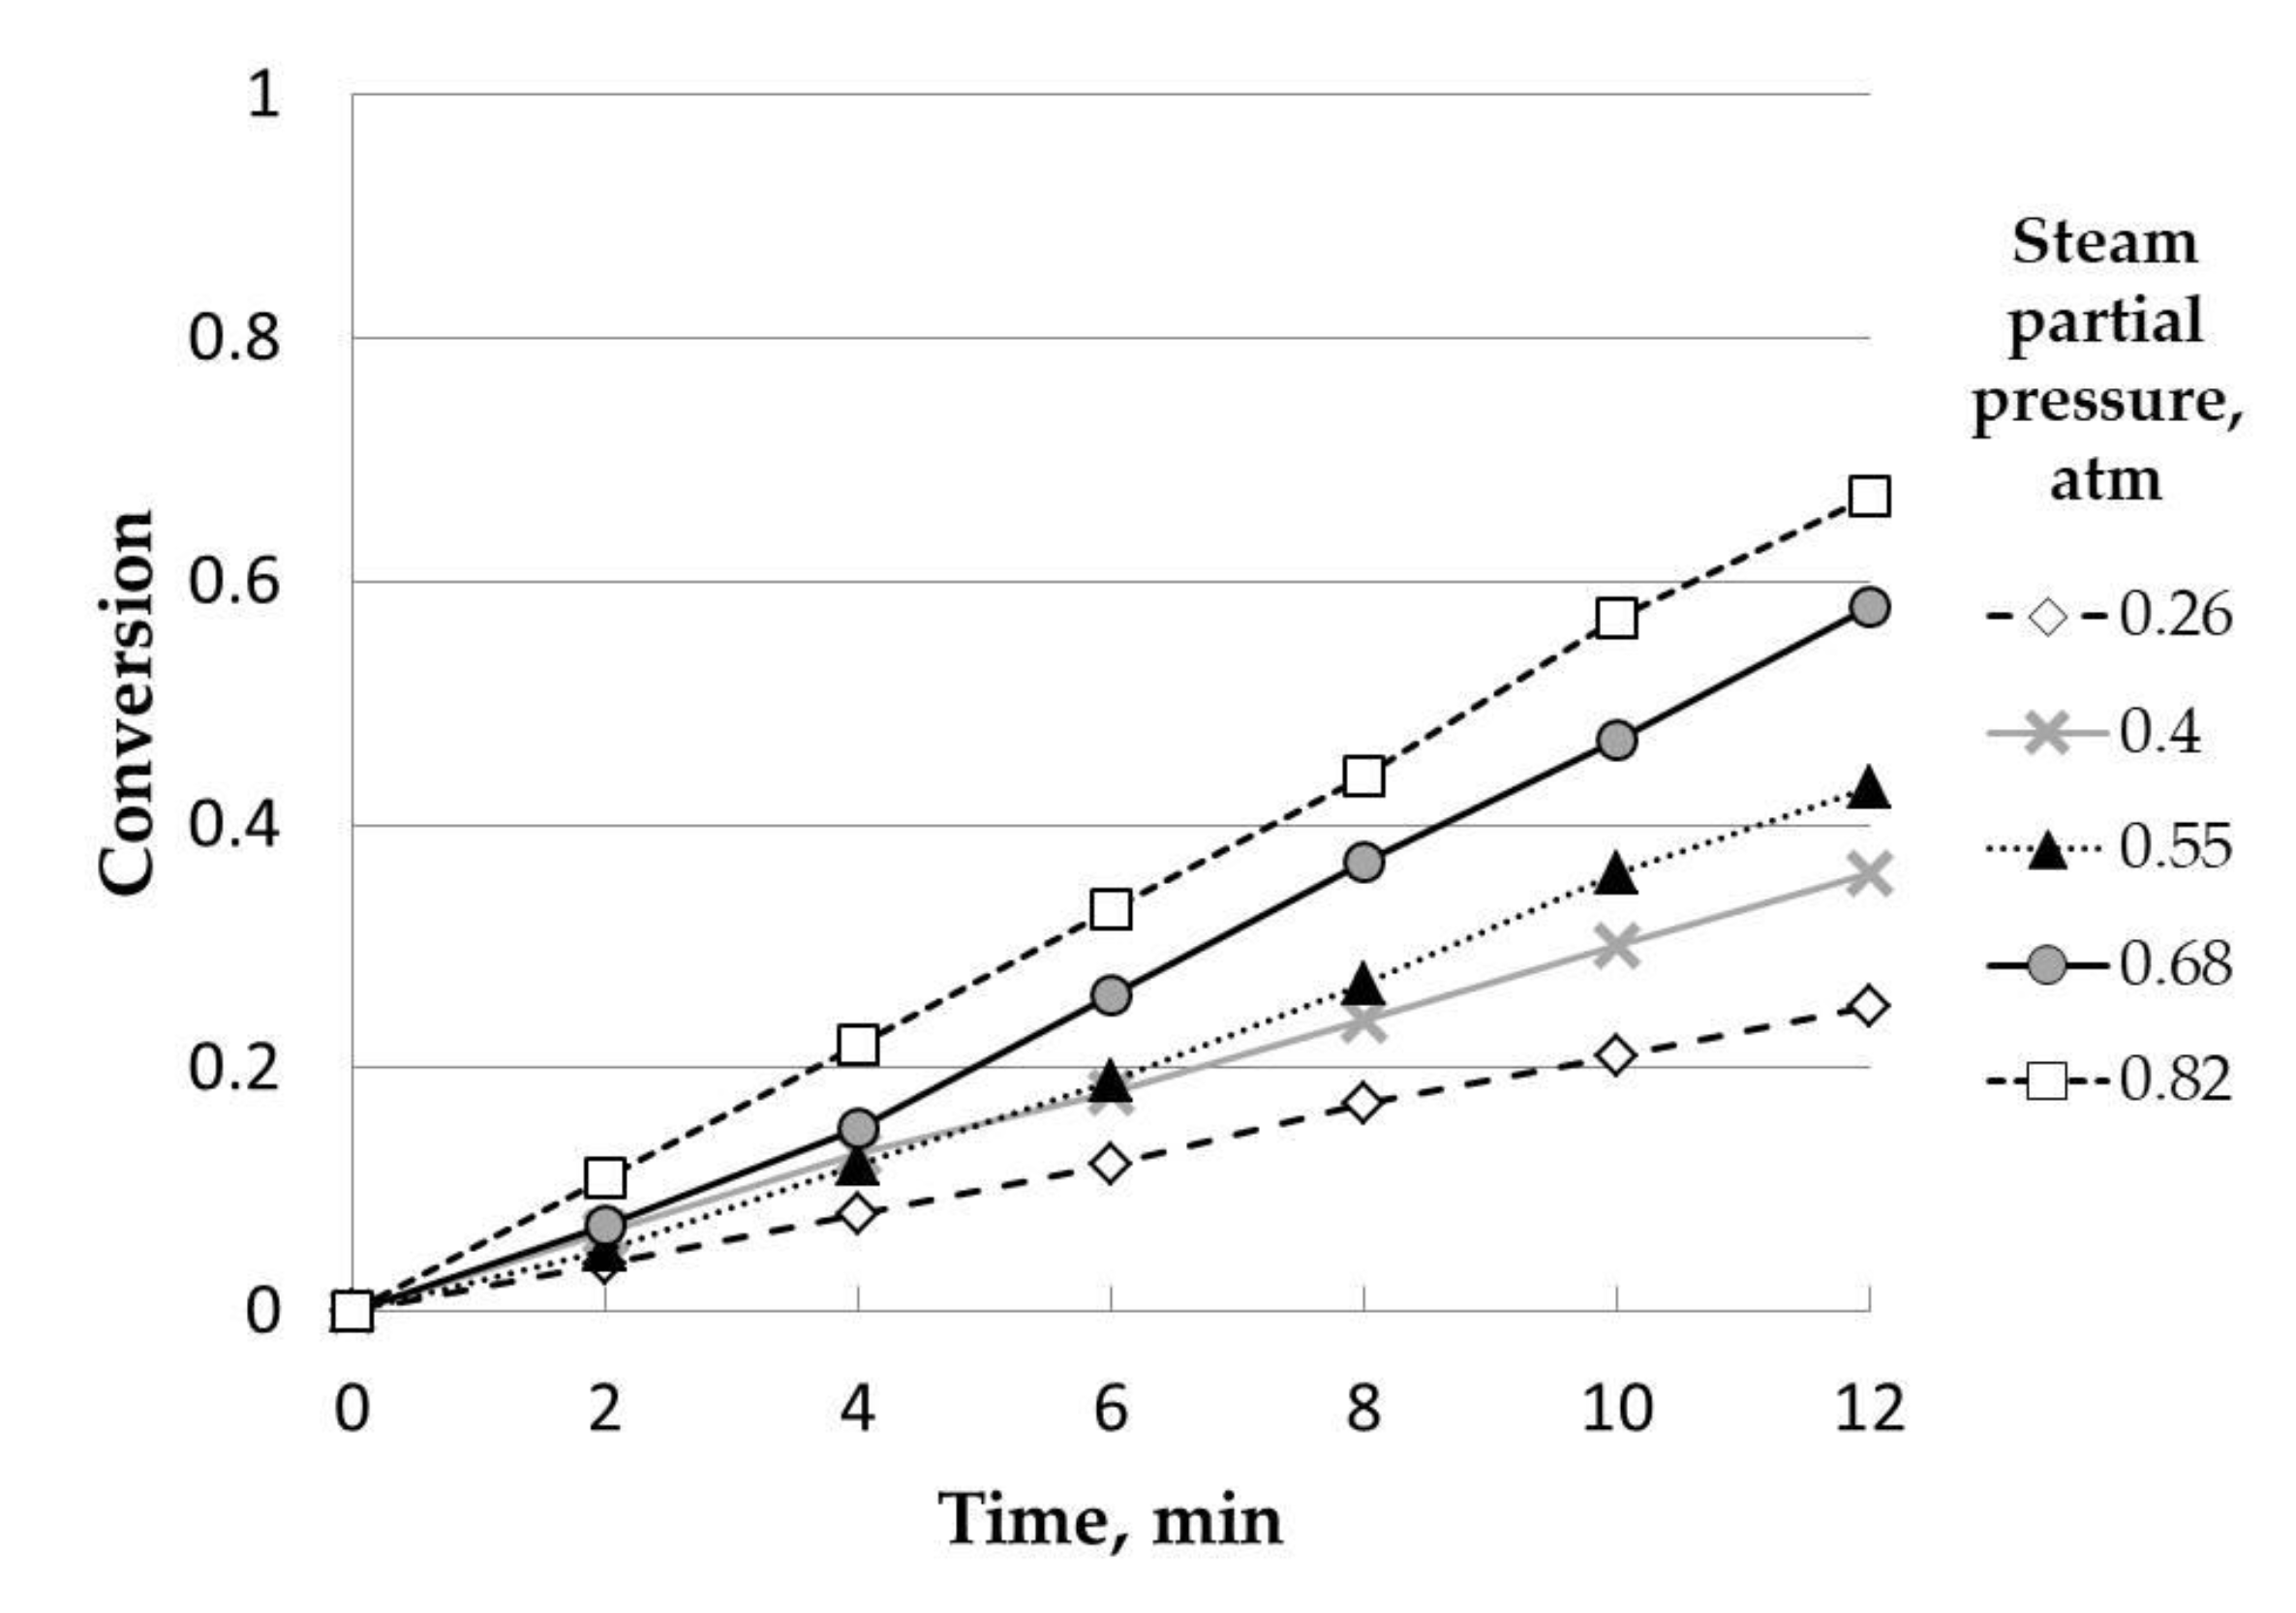
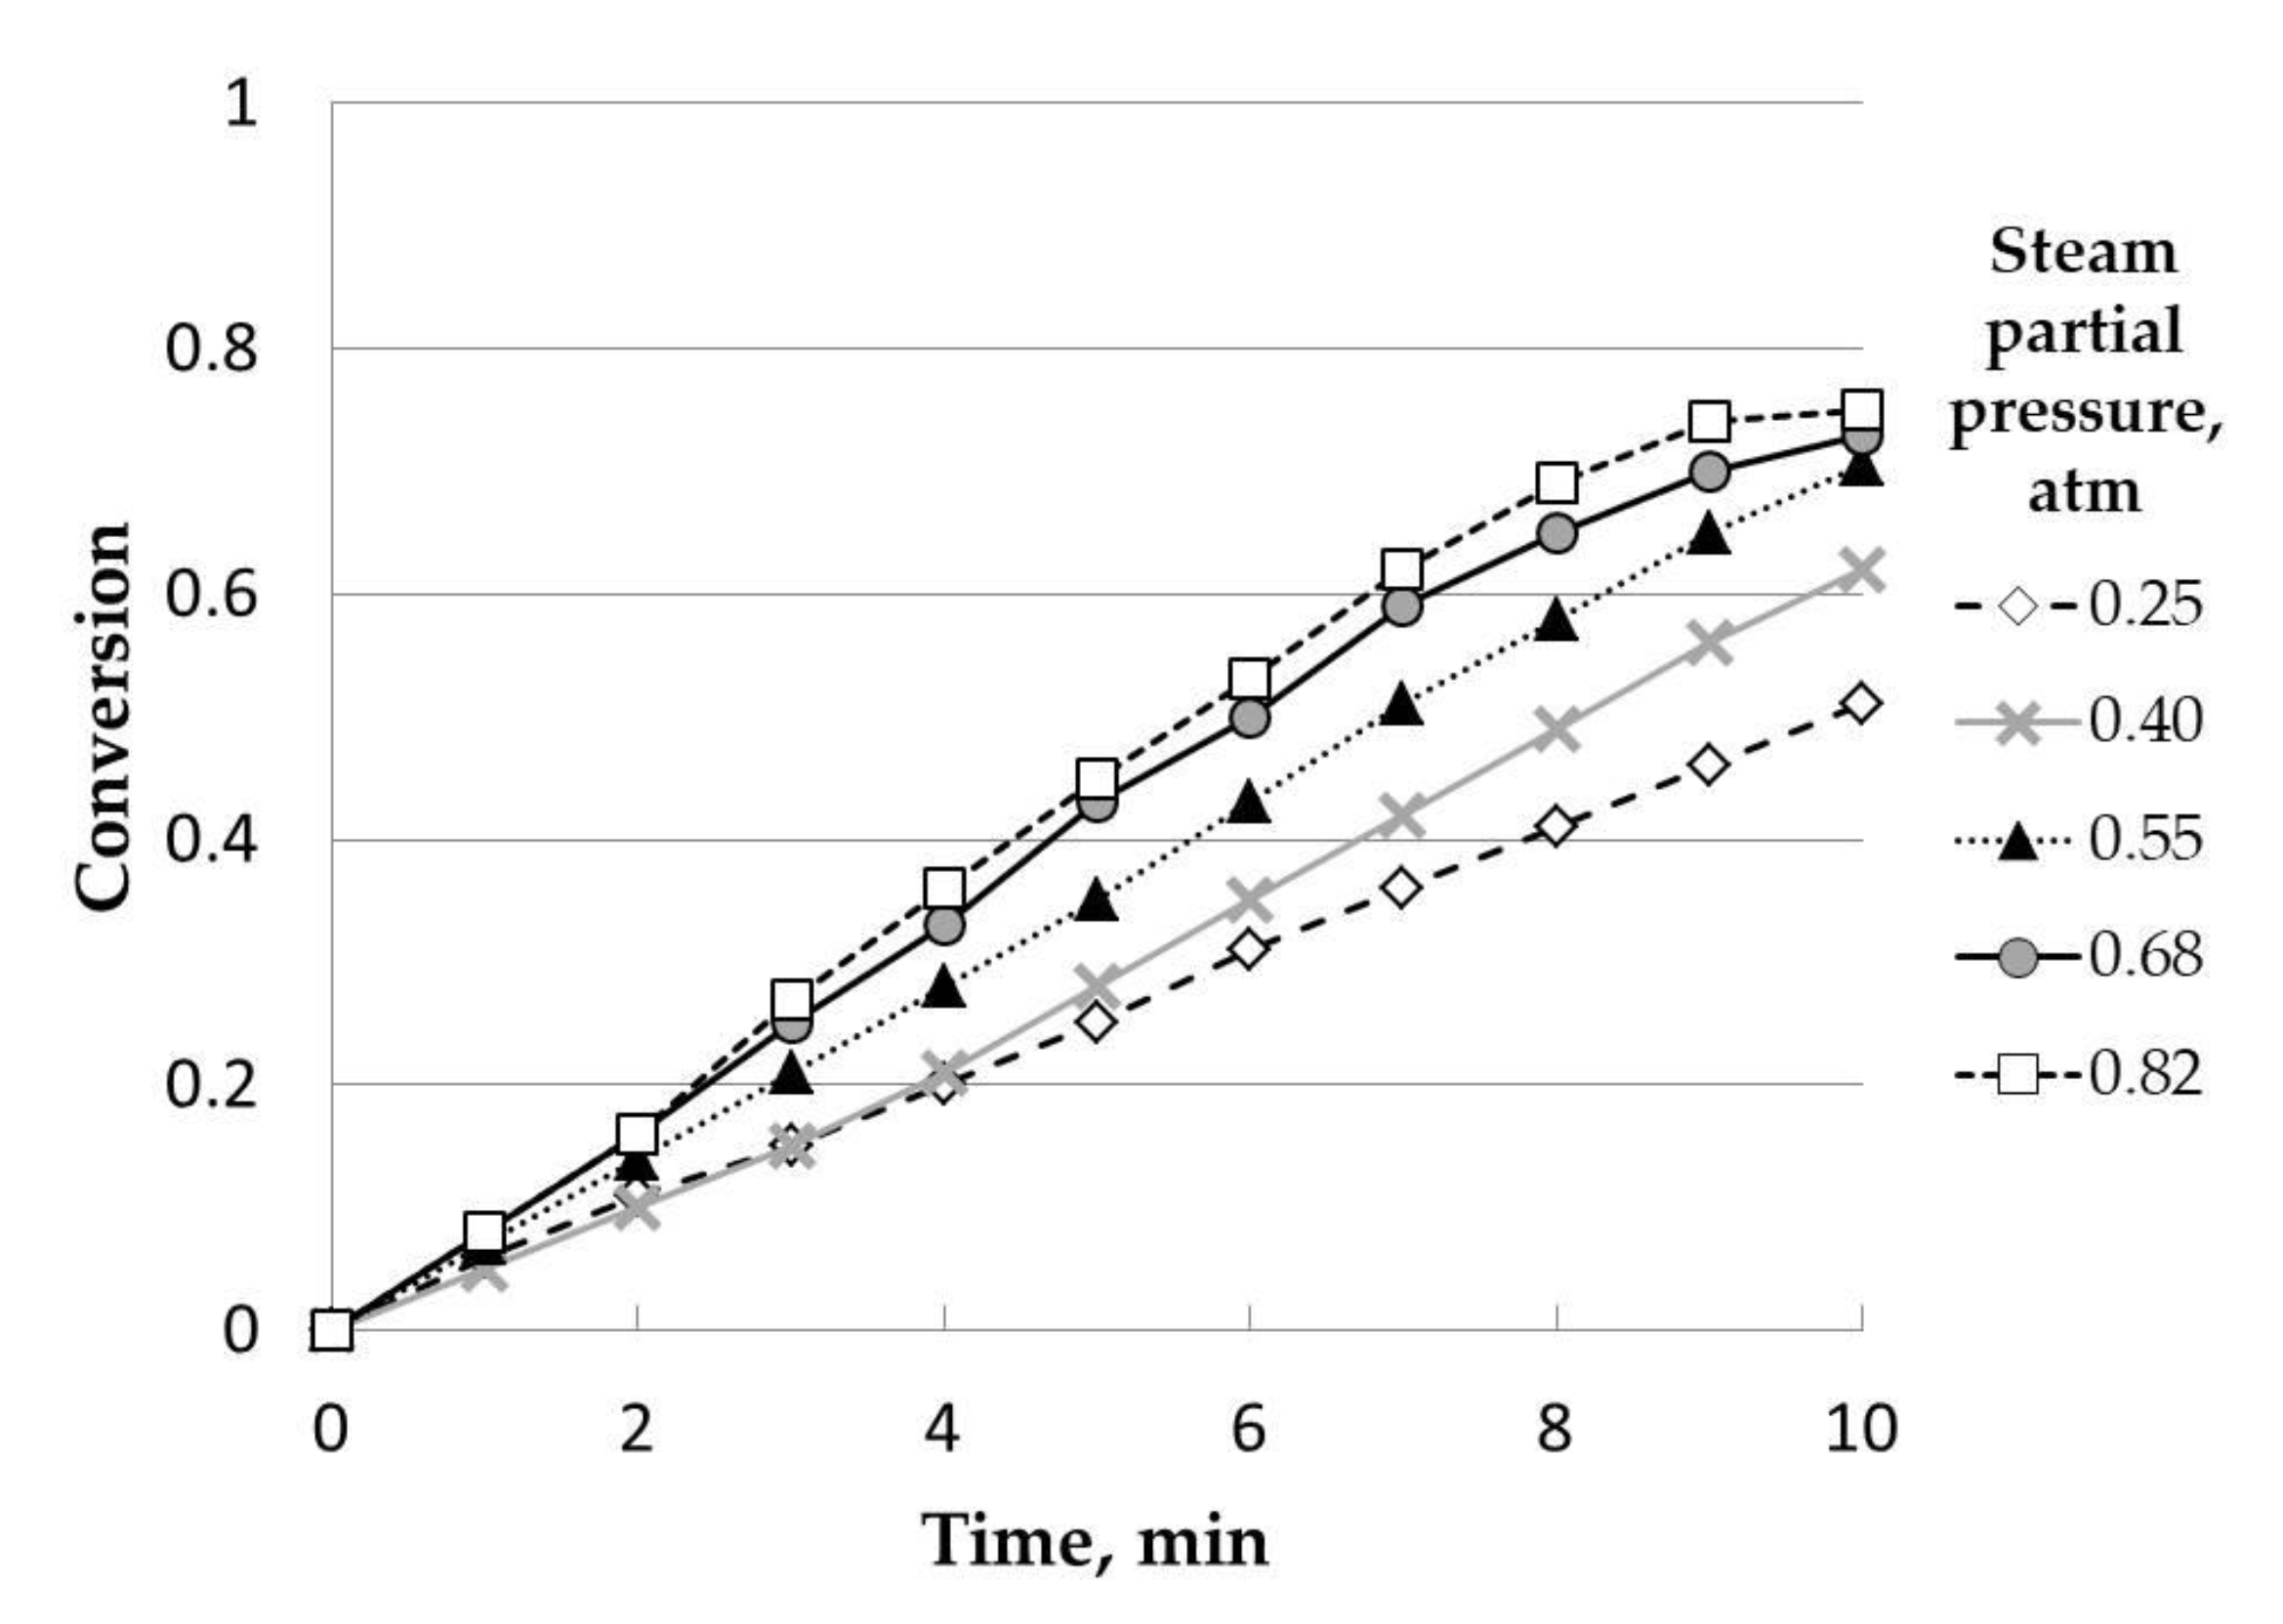
2.1.5. Influence of Steam Partial Pressure

Five experiments at different steam partial pressures (0.26, 0.40, 0.55, 0.68, and 0.82 atm) were carried out, as can be observed in Figure 5. This variable had a positive effect on all the variability range. Thus, the highest conversion values were obtained at 0.82 atm due to the increase in reaction rate when the concentration of a reagent (in this case, steam) was higher, which implies an increase in rate with concentration. This way, as pointed out by other authors, a higher steam partial pressure indicates a greater steam quantity available to react, increasing the gasification rate [14].
To sum up, Table 1 shows the general trends observed in the study of the influence of variables, as well as the selected values for further experiments.

2.2. Uncatalyzed Heather Steam Gasification. Kinetic Study of the Process

Gasification is generally considered an irreversible reaction. When it comes to solids with high ash content, it can be assumed, as a first approximation, that the particle size remains approximately constant during the process. Under these circumstances (constant particle size), two models have been conventionally used: the shrinking core model and the uniform conversion model. On the other hand, in the case of very porous solids or ones with low ash content, particle size decreasesin volume during the reaction, taking place in the shrinking particle model [27,28]. In Table 2, the linearized equations for each model (Equations (1)–(5)), showing the limiting stage and the meaning of the slope, can be observed for the expression of the slopes (where the constant terms were grouped in α, β, etc.). Only two of them are true kinetic constants, the corresponding ones to the shrinking core or shrinking particle models with the prevalence of chemical reaction (Equation (2)) and the one corresponding to the uniform conversion model with the prevalence of chemical reaction (Equation (4)). For all other cases, the parameter observed in these expressions is the mass transfer coefficient, kg, (Equations (1), (3) and (5)) or diffusivity, De, (Equation (3)).
The reaction conditions used concerning the volumetric flow, particle size, and initial mass of the samples seemed to demonstrate, as it was previously observed, the absence of external or internal diffusional limitations. These conclusions were also supported by the literature, with several authors reaching similar results [29,30]. Consequently, the only models that imply the control by the chemical reaction are the shrinking core model with the prevalence of chemical reaction (which is equivalent to the shrinking particle model with the prevalence of chemical reaction) and the uniform conversion volume with chemical reaction control. In principle, according to the results about the effect of particle size, the first of the models cited should be ruled out, as according to Equation (2), conversion depends on particle radius. Nevertheless, according to Levenspiel [27], the reaction can take place in a diffuse front, having an intermediate situation between the abovementioned methods, we decided to check both.
Once Equations (2) and (4) were plotted, the adjustment data are shown in Table 3. The results confirmed the qualitative trends previously discussed. Thus, the initial mass showed, from 60 mg, similar slope values. The volumetric flow did not show any trend, with the corresponding slopes being similar in all cases. The particle size seemed to show an influence for ranges above 0.63 and 1.00 mm, obtaining equivalent slopes for the two smallest ranges. Finally, for the results about the temperature and steam partial pressure effect, the trends observed were as expected, observing an increase in the corresponding slopes with each variable.
From the slopes obtained at different temperatures, the activation energy of the process can be calculated through the Arrhenius equation. Table 4 shows the adjustment data, as well as the activation energies obtained. As it can be observed, both models showed a good adjustment, obtaining similar activation energies. These values are typical for a chemical reaction, which verifies the control of the process by the chemical reaction.
Compared to other results found in the literature, the activation energy obtained by using these ideal models seemed to be similar for equivalent samples (chars or biochars) with high conversion (exceeding 80%), ranging from 114 to 237 kJ·mol−1 [24,31,32,33]. Other samples, like biochars derived from sawdust, plum, and olive pits, had lower activation energies depending on the operating variables (from 24 to 98 kJ·mol−1) [34].
Although in the representative equation of these ideal models, given in Table 2, the order of reaction for steam was assumed as 1, it could also consider an order of reaction “n”. This way, a graphical representation of the Napierian logarithm versus the steam partial pressure should have a slope of “n”, that is, the resulting lines should have a slope that implies the order of reaction for steam. In order to check that point, Table 5 shows the results concerning the adjustment for both models. As it can be observed, in both cases, the adjustment was acceptable, confirming the theoretical estimation as the resulting order of reaction was 1.

2.3. Catalyzed Steam Gasification of Heather. Influence of Operating Variables

As in the case of the uncatalyzed gasification of heather (see Section 2.1.), the operating variables of the process were studied, including volumetric flow, temperature, steam partial pressure, and catalyst concentration. For all the experiments, K2CO3 was selected as a catalyst, which showed a higher activity compared to Na2CO3 or Na2B4O7·10H2O [35]. Thus, these factors play an important role in steam gasification processes, and catalysts can present a lower-energy substitute route towards the development of the reaction [36].

2.3.1. Influence of Volumetric Flow

As can be seen in Figure 6, the influence of volumetric flow on conversion can be considered negligible, as all the curves represented were similar. Considering these results, the optimum volumetric flow was 275 mL·ml−1, assuming that for this value, there is no diffusional effect.

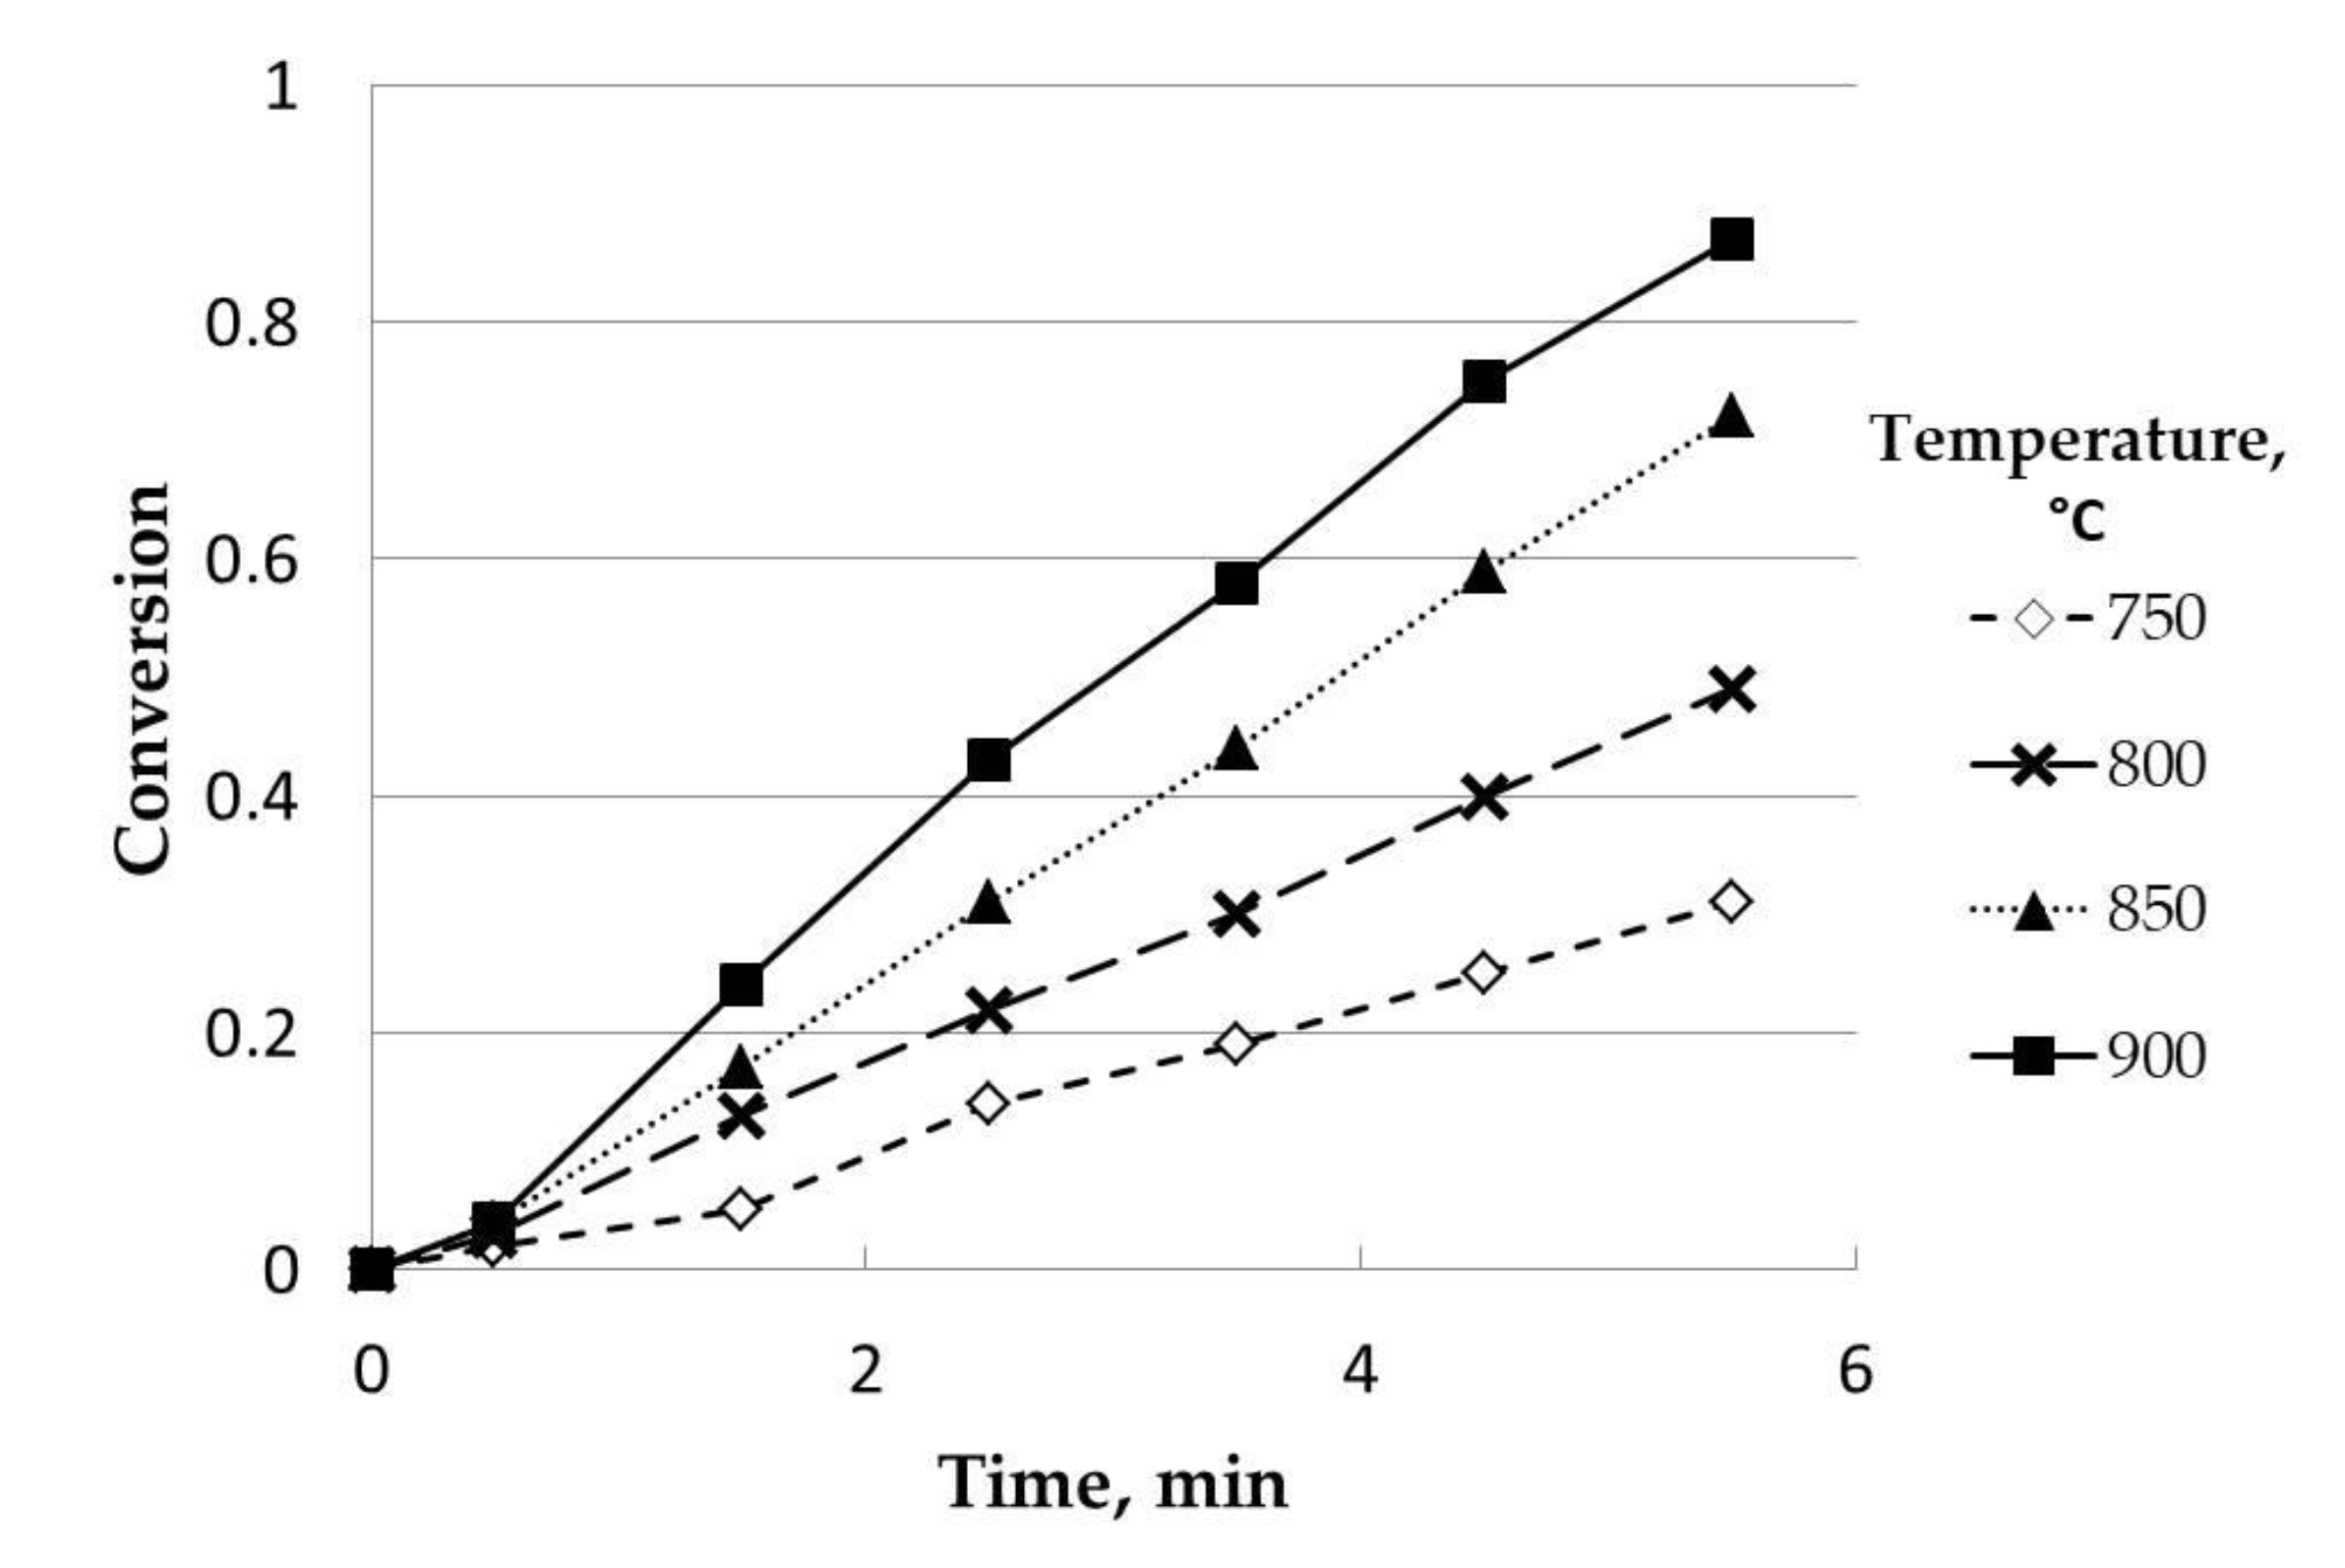
2.3.2. Influence of Temperature

Temperature showed, as expected, a clear differentiating influence, with a positive effect on conversion, as was observed in Figure 7.

2.3.3. Influence of Steam Partial Pressure

Regarding steam partial pressure (see Figure 8), this parameter also had a positive effect on conversion, although these differences were lower compared to the effect of temperature.

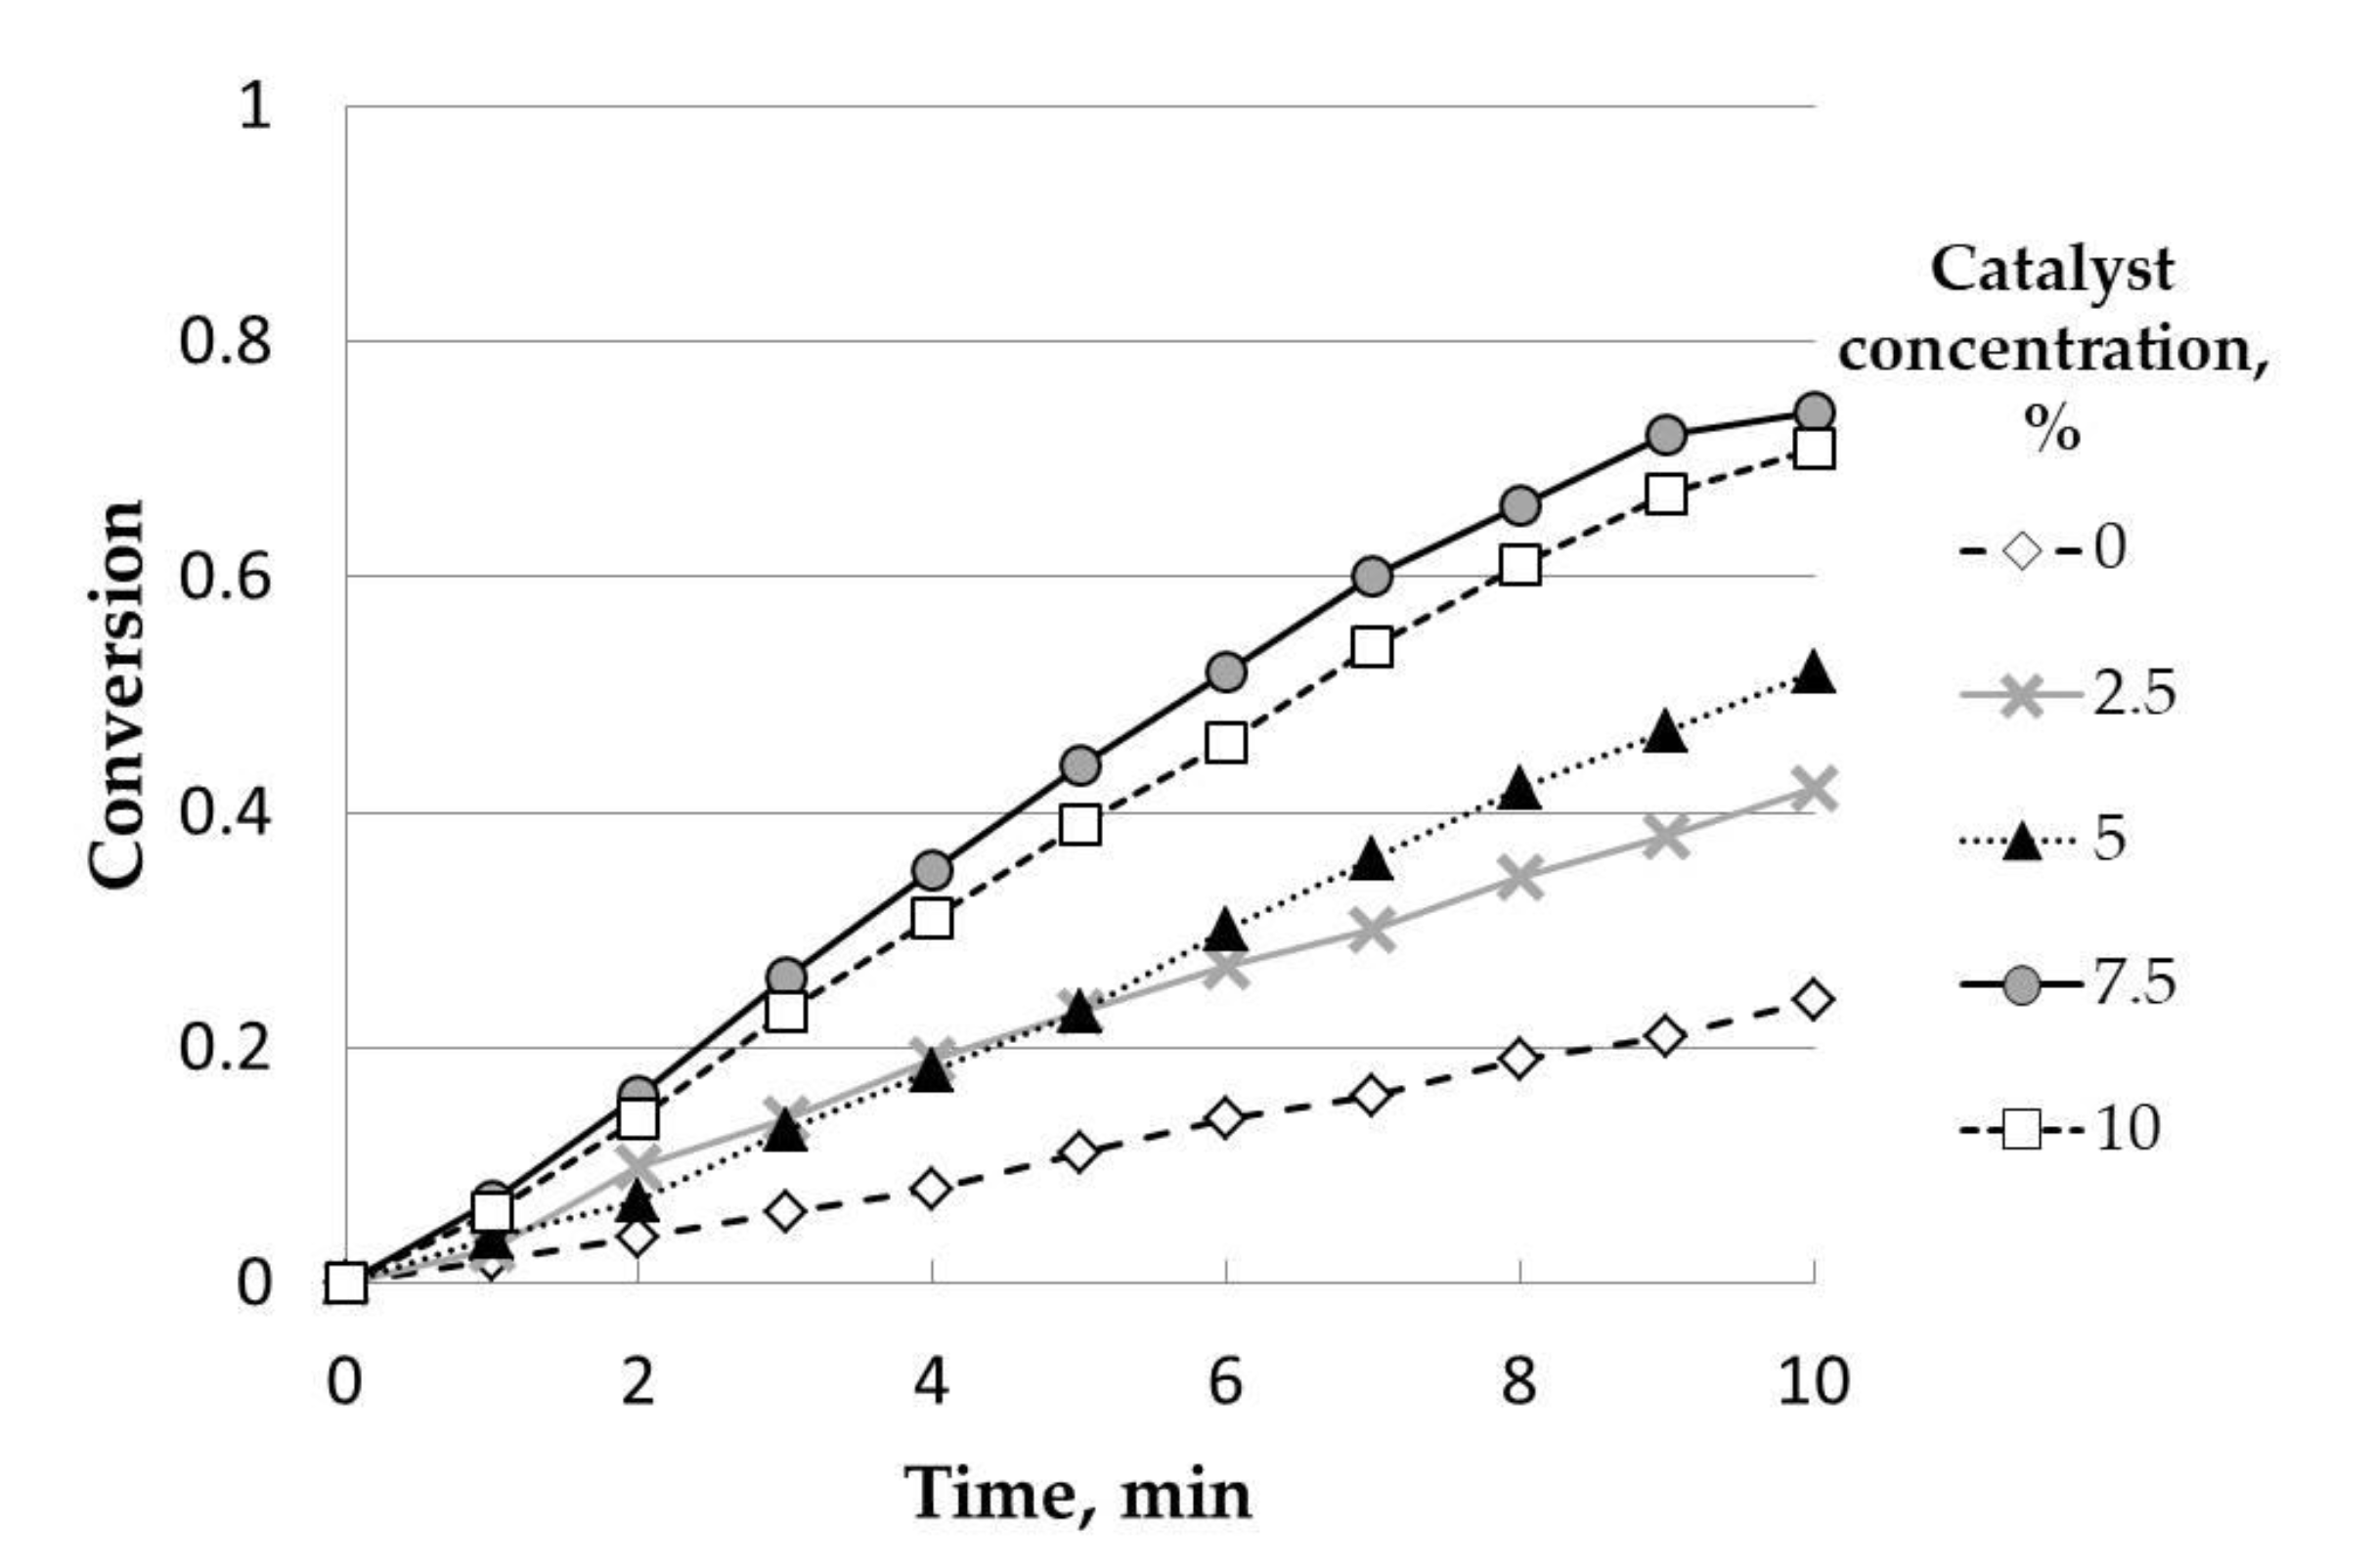
2.3.4. Influence of Catalyst Concentration

Finally, the effect of catalyst concentration was included in Figure 9. Catalyst concentration also had a positive effect on conversion, up to 7.5% w/w. Thus, there were no differences between 7.5 and 10.0% w/w. This could be due to a saturation effect. Compared to the uncatalyzed sample (0% w/w), clear differences were observed when K2CO3 was added, pointing out the high catalytic activity of this catalyst. Accordingly, 7.5% w/w was chosen as the optimum catalyst concentration for further analysis.

2.4. Catalyzed Heather Steam Gasification. Kinetic Study of the Process

In this case, the uniform conversion and shrinking core models (with chemical reaction control) were tested, as they seemed to offer the best results. Table 6 shows the adjustment data corresponding to the equations of both models for the different experimental sets.
As can be observed, the adjustment confirmed the qualitative trends commented on previously. Thus, the volumetric flow did not show any influence, as the slope values were almost equal with little differences with the average value. Temperature and steam partial pressure had a clear positive effect, and the slopes increased when these parameters were higher. In any case, as in the case of uncatalyzed steam gasification of heather, the influence of temperature was much higher. Regarding catalyst concentration, the saturation effect was observed at 7.5% w/w. If both ideal models are compared, it can be observed that the shrinking core model showed better coefficients of determination.
It is possible to determine the main kinetic parameters of the process from the values obtained in Table 6. Thus, through an adjustment of the Arrhenius equation by the method of least squares, the activation energy was calculated (see Table 7).
If these results are compared to their equivalent for uncatalyzed steam reforming (see Table 4), a considerable decrease in activation energy can be observed (catalyst addition almost halved activation energy). Moreover, the pre-exponential factors were reduced by adding K2CO3.
The reaction order for steam was carried out through the representation of the Napierian logarithm of the slopes versus the Napierian logarithm of the steam partial pressure. The resulting least-squares adjustment was included in Table 8. In this case, although there was a good adjustment with high coefficients of determination, the reaction orders were other than one, obtaining 1/2 and 2/3 for shrinking core model and uniform conversion model, respectively.

3. Materials and Methods

3.1. Apparatus and Procedure

The experimental facility used in this study was described elsewhere [37]. Basically, it consisted of a microbalance (CI Electronics Limited MK-2, Salisbury, UK) and a vertical tubular furnace with the corresponding heating and temperature control systems. The microbalance was connected, through an RS-232 interface, to a computer, which allowed data recording and temperature control thanks to a thermocouple type k, an analogical-digital converter (PC-ADDA-12, Barcelona, Spain) and a power unit. The gas supply consisted of a peristaltic pump to add water to the steam generator (with a thermostatic bath and a serpentine where water vaporized). The steam current was mixed with a nitrogen current, obtaining the desired steam partial pressure, and the resulting mixture was introduced through a cooper pipe (externally heated to avoid condensation, Serfoncal, Badajoz, Spain) in the quartz reactor (Tomas Scientific, Swedesboro, NJ, USA) of the microbalance.
All the experiments were carried out with dehydrated samples, prepared according to the following procedure: the samples were placed in a quartz porous small basket that was suspended on the microbalance beam. Once the temperature of the experiment was established, the nitrogen flow (with the desired flow value) passed to dry the sample and remove the presence of volatile matter until the weight value was constant. Once the stationary regime was reached, the experiment started by introducing steam with the pre-fixed value. Weight loss data, during gasification, were recorded every 10 s, for 60 min. These data were treated to obtain weight loss curves (TG), and, through data processing, different kinetic parameters were obtained.Conversion values were obtained as follows (see Equation (6)):
C o n v e r s i o n = ( m 0 m t ) ( m 0 m a )
where m0 is the initial mass, mt the mass at a time t, and ma the ash mass. Effect of diffusion limitation were not assumed.

3.2. Production of Heather Charcoal

As it was pointed out, the raw material used for all the experiments was heather charcoal. These charcoals were prepared through pyrolysis of heather wood, previously ground and sieved. The experimental facility for pyrolysis is described in previous research works [38]. Basically, it consisted of a vertical cylindrical reactor made of stainless steel and designed to work at atmospheric pressure and provided with all the necessary accessories for temperature recording and control, as well as gas supply and a sampling system. The temperature of pyrolysis was, in all cases, 900 °C, and the reaction time was 30 min. According to previous studies, this reaction time was enough to ensure the absence of volatile matter for the subsequent gasification experiments. The charcoal obtained was stored in a desiccator before gasification.

3.3. Effect of Pyrolysis Conditions

In order to assess the effect of the main pyrolysis conditions on heather charcoal production, the following were considered:
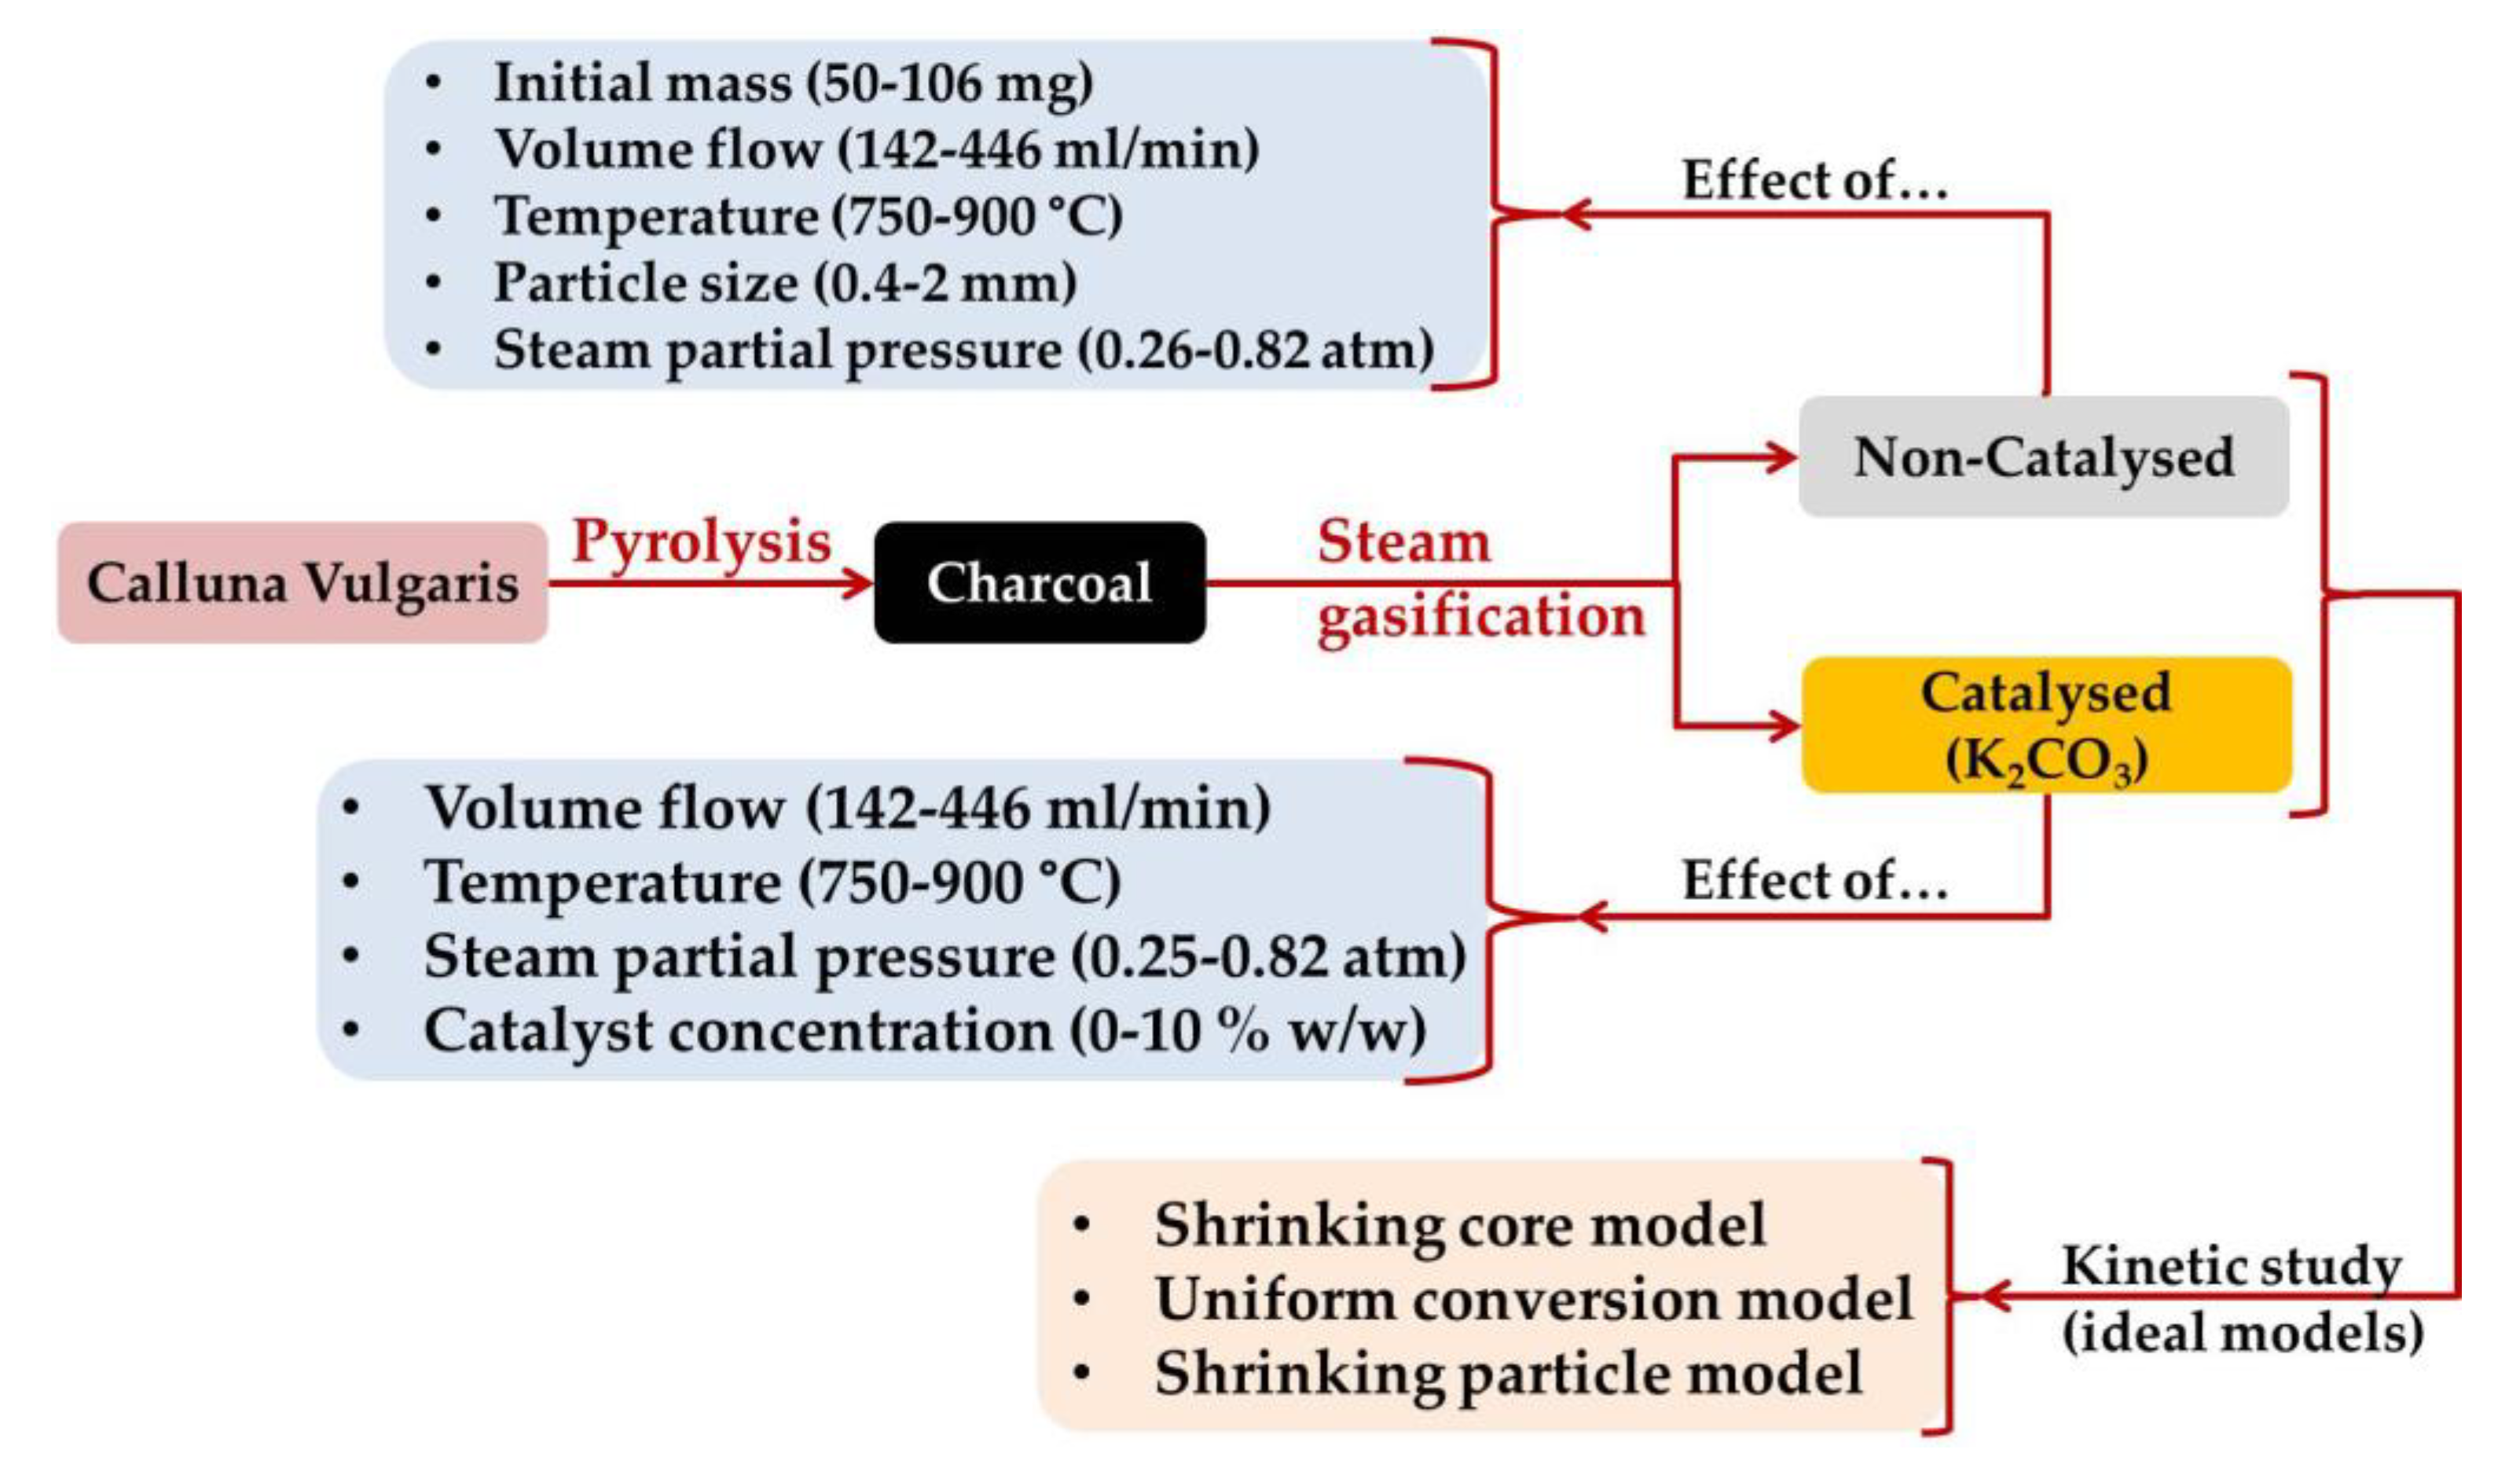
  • In the case of the uncatalyzed pyrolysis, the initial mass (50.6, 60.5, 70.5, 80.3, and 106 mg), volume flow (142, 218, 292.5, 370.5, and 446 mg), temperature (750, 800, 850, and 900 °C), particle size at different ranges (0.4–0.63, 0.63–1, 1–1.6, and 1.6–2 mm), and steam partial pressure (0.26, 0.4, 0.55, 0.68, and 0.82 atm) were considered.
  • Regarding catalyzed pyrolysis, the volume flow (142, 218, 292.5, 370.5, and 446 mg), temperature (750, 800, 850, and 900 °C), steam partial pressure (0.25, 0.4, 0.55, 0.68, and 0.82 atm) and catalyst concentration (0.25%, 0.40%, 0.55%, 0.68% and 0.82% w/w) were considered.

3.4. Kinetic Study

In order to study the kinetics of the process, three main ideal models for gas-solid reaction were considered: the shrinking core model, the uniform conversion model and/or the shrinking particle model. Thus, the adjustment to these models allowed us to obtain the activation energy and the reaction order of the process.
To sum up, the experimental design is shown in Figure 10.

4. Conclusions

The main findings of this research work were the following:
  • For the thermogravimetric study of steam gasification of heather, the operating variables to assure that the process is controlled by the chemical reaction were established. These values implied initial masses less than 60 mg, volumetric flows over 275 mL·min−1, and particle sizes lower than 1.6 mm in diameter.
  • Under these conditions, the shrinking core model and uniform conversion model were studied. Once the experimental data were adjusted to the representative equations of these models (whose verification was acceptable in all cases), activation energy values of 171.8 and 181.3 kJ/mol were obtained, respectively, with an order of reaction (for steam) of one in both cases.
  • Concerning the catalyzed steam gasification of heather (by using K2CO3), a positive influence of catalyst concentration was found up to 7.5% w/w. The kinetic study showed activation energies of 99.5 and 114.8 kJ·mol−1 and order of reactions (for steam) of 1/2 and 2/3, according to the two selected ideal models (Shrinking core model and Uniform conversion model).
  • Comparing the activation energy in both processes (catalyzed and uncatalyzed), the catalyzed steam gasification had a lower value, which is due to the typical effect of catalysts.

Author Contributions

Conceptualization, J.M.E. and J.F.G.; methodology, J.M.E. and J.F.G.; validation, J.M.E., J.F.G. and S.N.-D.; formal analysis, J.M.E. and J.F.G.; investigation, J.M.E. and J.F.G.; resources, J.M.E. and J.F.G.; data curation, S.N.-D.; writing—original draft preparation, J.M.E.; writing—review and editing, S.N.-D.; visualization, J.M.E. and S.N.-D.; supervision, J.F.G.; project administration, J.M.E. and J.F.G.; funding acquisition, J.M.E. and J.F.G. All authors have read and agreed to the published version of the manuscript.

Funding

This research was funded by JUNTA DE EXTREMADURA, grant number IPR00A077.

Acknowledgments

The authors thank the JUNTA DE EXTREMADURA for the financial support (grant number IPR00A077).

Conflicts of Interest

The authors declare no conflict of interest.

References

  1. Londoño-Pulgarin, D.; Cardona-Montoya, G.; Restrepo, J.C.; Muñoz-Leiva, F. Fossil or bioenergy? Global fuel market trends. Renew. Sustain. Energy Rev. 2021, 143, 110905. [Google Scholar] [CrossRef]
  2. Singh, A.; Christensen, T.; Panoutsou, C. Policy review for biomass value chains in the European bioeconomy. Glob. Transit. 2021, 3, 13–42. [Google Scholar] [CrossRef]
  3. Maniatis, K.; Millich, E. Energy from biomass and waste: The contribution of utility scale biomass gasification plants. Biomass Bioenergy 1998, 15, 195–200. [Google Scholar] [CrossRef]
  4. Franco, C.; Pinto, F.; Gulyurtlu, I.; Cabrita, I. The study of reactions influencing the biomass steam gasification process☆. Fuel 2003, 82, 835–842. [Google Scholar] [CrossRef]
  5. Lewandowski, W.M.; Ryms, M.; Kosakowski, W. Thermal biomass conversion: A review. Processes 2020, 8, 516. [Google Scholar] [CrossRef]
  6. Larsson, A.; Kuba, M.; BerdugoVilches, T.; Seemann, M.; Hofbauer, H.; Thunman, H. Steam gasification of biomass–Typical gas quality and operational strategies derived from industrial-scale plants. Fuel Process. Technol. 2021, 212, 106609. [Google Scholar] [CrossRef]
  7. Dong, Y.; Borgwardt, R.H. Biomass reactivity in gasification by the hynol process. Energy Fuels 1998, 12, 479–484. [Google Scholar] [CrossRef]
  8. Rensfelt, E.; Blomkvist, G.; Eastrom, C.; Engstrom, S.; Esperas, B.G.; Liinanki, L. Basic Gasification Studies for Development of Biomass Medium-Btu Gasification Processes. Energy Biomass Wastes 1978, 3, 14–18. [Google Scholar]
  9. Neeft, J.P.A.; Makkee, M.; Moulijn, J.A. Catalytic oxidation of carbon black—I. Activity of catalysts and classification of oxidation profiles. Fuel 1998, 77, 111–119. [Google Scholar] [CrossRef]
  10. Lizzio, A.A.; Jiang, H.; Radovic, L.R. On the kinetics of carbon (Char) gasification: Reconciling models with experiments. Carbon 1990, 28, 7–19. [Google Scholar] [CrossRef]
  11. Encinar, J.M.; González, J.F.; Rodríguez, J.J.; Ramiro, M.J. Catalysed and uncatalysed steam gasification of eucalyptus char: Influence of variables and kinetic study. Fuel 2001, 80, 2025–2036. [Google Scholar] [CrossRef]
  12. Wu, P.K.; Chen, M.Q.; Wang, H.W.; Wei, S.H.; Zhong, X.B. Steam gasification characteristics of char pellets of typical technical solid wastes. Thermochim. Acta 2021, 699, 178907. [Google Scholar] [CrossRef]
  13. Pütün, A.E.; Koçkar, Ö.M.; Yorgun, S.; Gerçel, H.F.; Andresen, J.; Snape, C.E.; Pütün, E. Fixed-bed pyrolysis and hydropyrolysis of sunflower bagasse: Product yields and compositions. Fuel Process. Technol. 1996, 46, 49–62. [Google Scholar] [CrossRef]
  14. Romero Millán, L.M.; Sierra Vargas, F.E.; Nzihou, A. Steam gasification behavior of tropical agrowaste: A new modeling approach based on the inorganic composition. Fuel 2019, 235, 45–53. [Google Scholar] [CrossRef] [Green Version]
  15. Benjelloun-Mlayah, B.; De Lopez, S.; Delmas, M. Oil and paper pulp from Cynara cardunculus: Preliminary results. Ind. Crops Prod. 1997, 6, 233–236. [Google Scholar] [CrossRef]
  16. MITECO Brecina. Available online: https://www.miteco.gob.es/fr/red-parques-nacionales/nuestros-parques/picos-europa/visita-virtual/flora/Brecina.html (accessed on 19 April 2021).
  17. Worrall, F.; Clay, G.D. The potential use of heather, calluna vulgaris, as a bioenergy crop. Biomass Bioenergy 2014, 64, 140–151. [Google Scholar] [CrossRef] [Green Version]
  18. González-González, B.D.; Sixto, H.; Alberdi, I.; Esteban, L.; Guerrero, S.; Pasalodos, M.; Vázquez, A.; Cañellas, I. Estimation of shrub biomass availability along two geographical transects in the Iberian Peninsula for energy purposes. Biomass Bioenergy 2017, 105, 211–218. [Google Scholar] [CrossRef]
  19. Encinar, J.; González, J.; González, J. Steam gasification of Cynara cardunculus L.: Influence of variables. Fuel Process. Technol. 2002, 75, 27–43. [Google Scholar] [CrossRef]
  20. González, J.F.; Ramiro, A.; Sabio, E.; Encinar, J.M.; González, C.M. Hydrogasification of Almond Shell Chars. Influence of Operating Variables and Kinetic Study. Ind. Eng. Chem. Res. 2002, 41, 3557–3565. [Google Scholar] [CrossRef]
  21. Encinar, J.M.; González, J.F.; Nogales-Delgado, S. Catalyzed Steam Gasification of Cistus Ladanifer Biochar. Catalysts 2020, 10, 1430. [Google Scholar] [CrossRef]
  22. Schmal, M.; Monteiro, J.L.F.; Castellan, J.L. Kinetics of coal gasification. Ind. Eng. Chem. Process. Des. Dev. 1982, 21, 256–266. [Google Scholar] [CrossRef]
  23. Standish, N.; Tanjung, A.F.A. Gasification of single wood charcoal particles in CO2. Fuel 1988, 67, 666–672. [Google Scholar] [CrossRef]
  24. Le, C.D.; Kolaczkowski, S.T. Steam gasification of a refuse derived char: Reactivity and kinetics. Chem. Eng. Res. Des. 2015, 102, 389–398. [Google Scholar] [CrossRef] [Green Version]
  25. Pande, A.R. Catalytic gasification of active charcoal by carbon dioxide: Influence of type of catalyst and carbon particle size. Fuel 1992, 71, 1299–1302. [Google Scholar] [CrossRef]
  26. Revankar, V.V.S.; Gokarn, A.N.; Doraiswamy, L.K. Studies in Catalytic Steam Gasification of Petroleum Coke with Special Reference to the Effect of Particle Size. Ind. Eng. Chem. Res. 1987, 26, 1018–1025. [Google Scholar] [CrossRef]
  27. Levenspiel, O. Chemical Reaction Engineering, 2nd ed.; John Wiley & Sons: New York, NY, USA, 1973; Volume 19, ISBN 978-0-471-25424-9. [Google Scholar]
  28. Shufen, L.; Ruizheng, S. Kinetic studies of a lignite char pressurized gasification with CO2, H2 and steam. Fuel 1994, 73, 413–416. [Google Scholar] [CrossRef]
  29. Liou, T.H.; Chang, F.W. Kinetics of Carbothermal Reduction and Nitridation of Silicon Dioxide/Carbon Mixture. Ind. Eng. Chem. Res. 1995, 34, 118–127. [Google Scholar] [CrossRef]
  30. Liou, T.H.; Chang, F.W. The nitridation kinetics of pyrolyzed rice husk. Ind. Eng. Chem. Res. 1996, 35, 3375–3383. [Google Scholar] [CrossRef]
  31. Di Blasi, C. Combustion and gasification rates of lignocellulosic chars. Prog. Energy Combust. Sci. 2009, 35, 121–140. [Google Scholar] [CrossRef]
  32. Ferreira, S.D.; Lazzarotto, I.P.; Junges, J.; Manera, C.; Godinho, M.; Osório, E. Steam gasification of biochar derived from elephant grass pyrolysis in a screw reactor. Energy Convers. Manag. 2017, 153, 163–174. [Google Scholar] [CrossRef]
  33. Preciado-Hernandez, J.; Zhang, J.; Jones, I.; Zhu, M.; Zhang, Z.; Zhang, D. An experimental study of gasification kinetics during steam activation of a spent tyre pyrolysis char. J. Environ. Chem. Eng. 2021, 9, 105306. [Google Scholar] [CrossRef]
  34. Fernandez, A.; Soria, J.; Rodriguez, R.; Baeyens, J.; Mazza, G. Macro-TGA steam-assisted gasification of lignocellulosic wastes. J. Environ. Manag. 2019, 233, 626–635. [Google Scholar] [CrossRef] [PubMed]
  35. Shahbaz, M.; yusup, S.; Inayat, A.; Patrick, D.O.; Ammar, M. The influence of catalysts in biomass steam gasification and catalytic potential of coal bottom ash in biomass steam gasification: A review. Renew. Sustain. Energy Rev. 2017, 73, 468–476. [Google Scholar] [CrossRef]
  36. Singh Siwal, S.; Zhang, Q.; Sun, C.; Thakur, S.; Kumar Gupta, V.; Kumar Thakur, V. Energy production from steam gasification processes and parameters that contemplate in biomass gasifier—A review. Bioresour. Technol. 2020, 297, 122481. [Google Scholar] [CrossRef]
  37. Encinar, J.M.; Beltrán, F.J.; Ramiro, A.; González, J.F.; Bernalte, A. Combustion kinetics of agricultural wastes. J. Chem. Technol. Biotechnol. 1995, 64, 181–187. [Google Scholar] [CrossRef]
  38. Encinar, J.M.; Beltrán, F.J.; Ramiro, A.; González, J.F. Catalyzed Pyrolysis of Grape and Olive Bagasse. Influence of Catalyst Type and Chemical Treatment. Ind. Eng. Chem. Res. 1997, 36, 4176–4183. [Google Scholar] [CrossRef]
Figure 1. Influence of the initial mass (uncatalyzed). Temperature, 900 °C; steam partial pressure, 0.82 atm; nitrogen partial pressure, 0.18 atm; particle size range: 0.63–1 mm.
Catalysts 11 00657 g001
Figure 2. Influence of volume flow (uncatalyzed). Temperature, 850 °C;particle size range: 0.63–1mm.
Catalysts 11 00657 g002
Figure 3. Influence of particle size (uncatalyzed). Temperature, 850 °C; steam partial pressure, 0.82 atm; nitrogen partial pressure, 0.18 atm.
Catalysts 11 00657 g003
Figure 4. Influence of temperature (uncatalyzed). Initial mass, 50 mg; steam partial pressure, 0.82 atm; nitrogen partial pressure, 0.18 atm; particle size range: 0.63–1 mm.
Catalysts 11 00657 g004
Figure 5. Influence of steam partial pressure (uncatalyzed). Temperature, 850 °C;particle size range: 0.63–1 mm.
Catalysts 11 00657 g005
Figure 6. Influence of volume flow (catalyzed). Initial mass, 50 mg; temperature, 800 °C; (K2CO3), 7.5% w/w; particle size range: 0.63–1 mm.
Catalysts 11 00657 g006
Figure 7. Influence of temperature (catalyzed). Initial mass, 50 mg; steam partial pressure, 0.82 atm; (K2CO3), 7.5% w/w; particle size range: 0.63–1 mm.
Catalysts 11 00657 g007
Figure 8. Influence of steam partial pressure (catalyzed). Initial mass, 50 mg; temperature, 800 °C; (K2CO3), 7.5% w/w; particle size range: 0.63–1 mm.
Catalysts 11 00657 g008
Figure 9. Influence of catalyst concentration (K2CO3). Initial mass, 50 mg; temperature, 800 °C; steam partial pressure, 0.82 atm; particle size range: 0.63–1 mm.
Catalysts 11 00657 g009
Figure 10. Experimental design.
Catalysts 11 00657 g010
Table 1. Influence of operating variables and selected values.
VariableRangeInfluence
Mo, mg50.6–106.0Null under 60 mg
Qv, mL/min142–446Null
Ø, mm0.4–2.0Null under 1.6 mm
T, °C750–900Positive
PH2O, atm0.25–0.82Positive
Selected values: Mo = 50 mg, Qv = 275 mL/min, Ø= 0.63–1.0 mm
Table 2. Ideal models of reaction. Kinetic equations for gas-solid reactions.
ModelEquation Slope
Shrinking core model. Prevalence of gaseous diffusion. X = t τ (1) 1 τ = 3 b k g C A g ρ B R = α k g
Shrinking core model. Prevalence of chemical reaction. 1 ( 1 X ) 1 3 = t τ (2) 1 τ = b k s C A g ρ B R = β k s
Shrinking core model. Prevalence of diffusion in ashes. 1 3 ( 1 X ) 2 3 + 2 ( 1 X ) = t τ (3) 1 τ = 6 b D e C A g ρ B R 2 = γ k g
Uniform conversion model. Prevalence of chemical reaction. ln ( 1 X ) = k v P A n t (4) k v P A n = δ k v
Shrinking particle model (leaching). Prevalence of chemical reaction. 1 ( 1 X ) 1 3 = t τ (2) 1 τ = b k s C A g ρ B R = β k s
Shrinking particle model (leaching). Prevalence of gaseous diffusion *. 1 ( 1 X ) 2 3 = t τ (5) 1 τ = 2 b k g C A g ρ B R = φ k g
* Assuming Stokes regime (kg variable with particle size).
Table 3. Verification of the ideal models of gas-solid reaction implying control of the chemical reaction.
VariableUniform Conversion ModelShrinking Core Model
SlopeInterceptR2SlopeInterceptR2
M0, mgInitial Mass
1060.0634−0.01330.9940.0199−0.00320.996
80.30.0844−0.01970.9930.0259−0.00440.996
70.50.0930−0.02530.9900.0284−0.00580.995
60.50.1409−0.04510.9820.0411−0.00890.991
50.60.1405−0.04310.9860.0410−0.00840.994
Q, mL/minVolumetric Flow
1420.1256−0.13220.9580.0333−0.02430.980
2180.1277−0.12690.9620.0337−0.02220.983
292.50.1195−0.10050.9690.0319−0.01600.988
3700.1220−0.10910.9640.0324−0.01790.986
4460.1238−0.12270.9530.0328−0.02130.980
Diam., mmParticle Size
0.4–0.630.0801−0.03270.9960.0230−0.00400.998
0.63–1.00.0833−0.05280.9840.0237−0.00920.994
1.0–1.60.0699−0.03510.9910.0204−0.00600.997
1.6–2.00.0613−0.04980.9780.0182−0.01180.987
T, °CTemperature
7500.00990.00051.0000.00320.00021.000
8000.0269−0.01120.9940.0086−0.00320.995
8500.0833−0.05280.9840.0237−0.00920.994
9000.1405−0.04310.9860.0410−0.00840.994
PH2O, atmSteam Partial Pressure
0.820.0833−0.05280.9840.0237−0.00920.994
0.680.0678−0.06050.9760.0199−0.01430.986
0.550.0482−0.03810.9860.0147−0.00980.991
0.400.0390−0.00670.9980.0120−0.00051.000
0.250.0231−0.00650.9980.0074−0.00150.999
Table 4. Ideal models for gas-solid reaction. Least-squares adjustment for the Arrhenius equation. Activation energy determination.
ModelSlopeZero InterceptR2Ae, kJ/mol
Shrinking core and shrinking particle models. Prevalence of chemical reaction. (Equation (2))−20,75914.60.992171.8
Uniform conversion model. Prevalence of chemical reaction. (Equation (4))−21,90716.830.988181.3
Table 5. Ideal models for gas-solid reaction. Verification of the order of reaction for steam.
ModelSlopeZero InterceptR2Reaction Order
Shrinking core and shrinking particle models. Prevalence of chemical reaction. (Equation (2))1.002−3.5510.9901
Uniform conversion model. Prevalence of chemical reaction. (Equation (4))1.094−2.2900.9891
Table 6. Verification of the ideal models of gas-solid reaction implying control of the chemical reaction (catalytic gasification).
VariableUniform Conversion ModelShrinking Core Model
SlopeInterceptR2SlopeInterceptR2
Q, mL/minVolumetric Flow
1420.1125−0.13710.9500.0319−0.03360.969
2180.1119−0.09770.9750.0316−0.02120.988
292.50.1350−0.15080.9460.0369−0.03290.970
370.50.1140−0.09770.9710.0320−0.02060.986
4460.1135−0.08960.9650.0318−0.01780.983
T, °CTemperature
7500.0673−0.01570.9900.0212−0.00430.991
8000.1474−0.09160.9900.0394−0.01330.997
8500.2298−0.10200.9550.0632−0.02130.977
9000.3964−0.22920.9190.0958−0.03940.969
(Cat), %Catalyst concentration
00.0269−0.01120.9940.0086−0.00320.995
2.50.0554−0.01140.9980.0169−0.00140.999
50.0755−0.06520.9780.0225−0.01640.986
7.50.1474−0.09160.9900.0394−0.01330.997
100.1309−0.09430.9870.0359−0.01720.995
PH2O, atmSteam partial Pressure
0.820.1474−0.09160.9900.0394−0.01330.997
0.680.1379−0.08800.9870.0373−0.01370.995
0.550.1210−0.09470.9740.0336−0.01830.989
0.400.0991−0.08760.9730.0285−0.02020.985
0.250.0726−0.03560.9900.0216−0.00720.996
Table 7. Ideal models for gas-solid reaction. Least-squares adjustment for the Arrhenius equation. Activation energy determination (catalytic gasification).
ModelSlopeZero InterceptR2Ae, kJ/mol
Shrinking core model. Prevalence of chemical reaction. (Equation (2))−12,0277.930.99799.5
Uniform conversion model. Prevalence of chemical reaction. (Equation (4))−13,87510.920.992114.8
Table 8. Ideal models for gas-solid reaction. Verification of the order of reaction for steam (catalytic gasification).
ModelSlopeZero InterceptR2Reaction Order
Shrinking core model. Prevalence of chemical reaction. (Equation (2))0.53−3.10.991/2
Uniform conversion model. Prevalence of chemical reaction. (Equation (4))0.63−1.760.992/3
Publisher’s Note: MDPI stays neutral with regard to jurisdictional claims in published maps and institutional affiliations.

