Abstract
The presented study investigated the effects of temperature (350–650 °C) and gas environment (pure Ar versus a H2O/H2 partial pressure ratio (PH2O/PH2) of 5) on the extent of sintering and oxidation of Al2O3-supported Ni0 nanoparticles (≈4 nm). We note that a PH2O/PH2 of 5 corresponds to a simulated CO conversion of 94% during methanation. Sintering and oxidation were studied using in situ magnetometry, while ex situ TEM analyses confirmed the particle sizes before and after the magnetometry-based experiments. It was found that increasing the temperature from 350 to 650 °C in Ar at atmospheric pressure causes a negligible change to the average size and degree of reduction (DOR) of the starting Ni0 nanoparticles. However, studying the same temperature window under hydrothermal conditions at 10 bar causes significant particle growth (≈9 nm) and the development of a bimodal distribution. Furthermore, the presence of steam decreases the DOR of Ni0 from 86.2% after initial activation to 22.2% due to oxidation. In summary, this study reports on the expected sintering and oxidation of Ni-based catalysts under high CO conversion conditions at elevated temperatures during methanation. Importantly, we were able to demonstrate how magnetometry-based analyses can provide similar size information (and changes thereof) as those observed with TEM but with the added advantage that this information can be obtained in situ.
1. Introduction
Oil is currently the main source of fuels and chemicals worldwide; however, due to the depleting oil reserves, there is great research effort focused on the development of new, sustainable, and environmentally friendly fuel sources and/or processes. Natural gas (mainly methane) is a possible fuel source due to its combustion efficiency, clean nature, and high calorific value [1]. Synthetic/substitute natural gas (SNG) can be produced from biomass [2], coal gasification to syngas (i.e., a mixture of carbon monoxide (CO) and hydrogen (H2)) [3], coke oven gas [4], as well as carbon dioxide (CO2) and carbon monoxide (CO) methanation [1,5]. The latter process is a key step in the production of natural gas, and it can be carried out over noble metals (e.g., palladium (Pd), iridium (Ir), platinum (Pt), and ruthenium (Ru)) [6,7,8] and base metals (e.g., nickel (Ni), iron (Fe), cobalt (Co), and molybdenum (Mo)) [6,7,9,10]. Due to the economic infeasibility of an industrial application of noble metal-based catalysts in the CO methanation process, extensive research is focused on the use of Ni-based catalysts due to their high activity, selectivity, and affordability [1,11,12]. However, since CO methanation is a highly exothermic reaction (see Equation (1))—resulting in the formation of hotspots along the catalyst bed—the formation of carbonaceous material (i.e., coke), particle growth (i.e., sintering) and oxidation of the Ni particles becomes more facile [1].
Sintering is a structural modification of the active surface leading to the loss of active sites [13]. Two main sintering mechanisms are proposed in the literature: (i) atomic migration, where atoms detach from one crystallite, and thereafter, migrate and attach to another crystallite, and (ii) crystallite migration, where whole crystallites migrate over the support and coalesce [14,15]. These two mechanisms are temperature dependent, where sintering via atomic migration can be expected to take place when the process temperature reaches the so-called Hüttig temperature (THüttig (K) = 0.3·(Tmetal melting (K)), while sintering via crystallite migration can be expected at the so-called Tamman temperature (TTamman (K) = 0.5·Tmetal melting (K)). It is important to note that the calculation of THüttig and TTamman is normally based on the melting point of the bulk metal; however, a decrease in the melting point is expected when the crystallite size of the metal decreases, which is predicted by the Gibbs–Thomson correlation [16]. Therefore, the sintering of relatively small crystallites can be expected to take place below the THüttig and TTamman calculated for bulk metals. This catalyst deactivation mechanism is thought to be the main route for the loss of activity over Ni-based catalysts during CO methanation [17,18,19]. The reaction is typically carried out in the temperature range of 250–700 °C [20], and due to this wide operating range, which covers both the THüttig and TTamman for Ni, it is important to determine the effect of temperature on the sintering of the catalyst nanoparticles. CO methanation over Ni-based catalysts is operated above 250 °C, since below 230 °C, Ni-carbonyl species are formed and can be transferred from one particle to another, which also contributes to the sintering process [21]. Therefore, different approaches are taken to prevent or limit the sintering of Ni crystallites during this catalytic process. These approaches include strengthening the nanoparticle–support interaction via the use of suitable supports and promoters [10,12], and the confinement of the Ni crystallites in the pores of a mesoporous support, which consequently limits the migration of the crystallites on the support [1,11,22].
Regarding Ni oxidation as a deactivation mechanism, the equivalent oxidation potential has to be reached in the presence of a mixture of an oxidising (e.g., H2O) and reducing agent (e.g., H2) in order for the oxidation of Ni particles to occur. This effect is dependent on the crystallite size and the nature of the nanoparticle–support interaction [14,23,24,25]. van Steen et al. [26] determined the thermodynamic threshold for the oxidation of Co nanoparticles as a function of the Co crystallite domain size, morphology, starting crystal phase, and importantly, the H2O/H2 partial pressure ratio (PH2O/PH2), which represents conversion. The results from their calculations clearly demonstrated the ease at which the oxidation of small Co crystallites occurs, while the larger Co crystallites only oxidise at high PH2O/PH2. Sehested et al. [27] studied the influence of different steam reforming reaction parameters (i.e., time, atmosphere, and temperature), as well as catalyst composition (i.e., Ni–support interaction and dopants) on the sintering of Ni particles. Their results showed that high PH2O/PH2 result in a faster Ni sintering rate, which is attributed to the formation of a Ni-(OH)x species. The authors also reported the formation of nickel aluminate (NiAl2O4) and nickel oxide (NiO) at high temperatures and PH2O/PH2. Champon et al. [28] showed that an increase in the H2O/H2 ratio results in increased sintering of Ni, which was successfully modelled by a generalised power-law expression.
Claeys et al. [15,29,30] studied the sintering of Co-based Fischer–Tropsch (FT) catalysts under industrially relevant conditions using an in-house developed in situ magnetometer. One of the studies [15] demonstrated that the sintering of Co particles takes place when the reaction environment consists of high CO and H2O partial pressures, and that the particle growth occurs due to the migration of Co sub-carbonyl species over the hydroxylated support. Another study from the group [30] showed irreversible deactivation of a Co-based catalyst under high H2O partial pressures due to oxidation and sintering of the oxidised Co particles via migration and coalescence. Since the use of the in situ magnetometer allows for studying catalysts under industrially relevant reaction conditions, we opted to investigate the effect of a simulated CO methanation reaction environment (i.e., PH2O/PH2) on the sintering and oxidation of Al2O3-supported Ni nanoparticles. The experiments were conducted under (i) different temperatures (350, 450, 550, and 650 °C) and (ii) different gas environments (pure Ar, and a PH2O/PH2 of 5). The chosen PH2O/PH2 of 5 corresponds to a CO conversion level of 94% during methanation. It should be noted that these conversion levels in CO hydrogenation are only attainable at the two lower temperatures (350 and 450 °C) applied in this study as the reaction is thermodynamically limited. Nonetheless, the same hydrothermal conditions were applied at the two high reaction temperatures where maximum theoretical conversions are 90% (550 °C) and 75% (650 °C), respectively. The Ni crystallite size distribution (and changes thereof) is determined via the Langevin method for superparamagnetic materials, as well as transmission electron microscopy (TEM) analysis.
2. Results and Discussion
2.1. Ex Situ PXRD and TEM
The Ni-loaded Al2O3 support obtained after drying at 100 °C was analysed using PXRD; however, the obtained diffraction pattern (in Figure S1) shows no reflexes from NiO or NiAl2O4. The only reflexes observed are those from the Al2O3 support. This could be a result of the low-targeted Ni loading of 4 wt% and/or the amorphous nature of the Ni-based phases caused by the low-temperature drying. As described in Section 3.1, the dried impregnated support was reduced in hydrogen at 500 °C, and thereafter, it was exposed to different temperatures (350, 450, 550, and 650 °C) and different gas environments (pure Ar at atmospheric pressure, and a PH2O/PH2 of 5 at 10 bar). Then, ex situ TEM analysis was performed on the (passivated) reduced and spent samples obtained after the tests conducted in the in situ magnetometer at 650 °C in an Ar and a H2O/H2 atmosphere, respectively.
Figure 1 shows the TEM images acquired, Figure 2 shows the derived number-based size distributions, and Table 1 summarises the number-based average particle sizes (and associated standard deviations). Figure 1a indicates that the reduced sample has relatively small Ni particles, which is also confirmed by the average size of 2.7 ± 1.1 nm (Table 1). After exposing the reduced catalyst to different temperatures in an Ar atmosphere, it can be observed that the particles show no significant growth (Figure 2b) and as a result, they exhibit an average size of 4.0 ± 1.1 nm, which is similar to the size obtained for the reduced catalyst. The sintering resistance of the Ni particles during this experiment may be a result of the stabilising effect from the Al2O3 support through the existence of strong nanoparticle–support interactions [31]. However, after exposing the freshly reduced catalyst to a steam/hydrogen atmosphere, significant particle growth is observed (Figure 2c), up to an average crystallite size of 18.9 ± 15.3 nm. Furthermore, the wide size distribution of this spent sample shows the presence of a few particles that are in the range of 20–70 nm. This particle growth can be attributed to the combination of the high H2O concentration and the high reaction temperatures reached, which has also been reported for other metal-based catalysts [32].
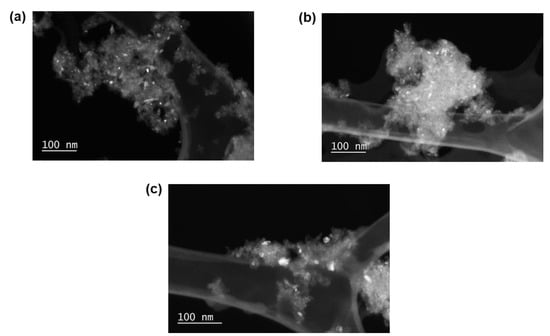
Figure 1.
Hollow cone dark field TEM images of the Ni/Al2O3 catalyst acquired after (a) reduction at 500 °C, as well as after exposure to (b) Ar at atmospheric pressure, and to the (c) hydrothermal condition (PH2O/PH2 of 5) at 10 bar at 650 °C.
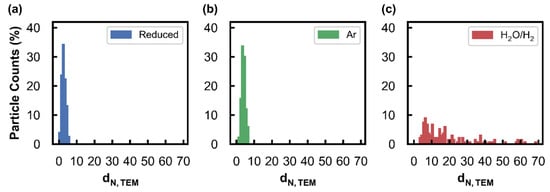
Figure 2.
Number-based size distributions derived from the acquired TEM images of the Ni/Al2O3 catalyst after (a) reduction at 500 °C, as well as after exposure to (b) Ar at atmospheric pressure, and to the (c) hydrothermal condition (PH2O/PH2 of 5) at 10 bar at 650 °C.

Table 1.
Summary of the number-based average particle sizes and standard deviations derived from TEM analysis.
2.2. In Situ Magnetometry
2.2.1. Degree of Reduction
The stability of the Al2O3-supported Ni catalyst prepared was studied by exposing it to a range of reactor temperatures and two different gas environments: (i) pure Ar, and (ii) a mixture of H2O/H2. A magnetisation versus applied field measurement (M-H measurement) was carried out at 150 °C (below the Curie temperature of Ni0 of 358 °C [33]) after exposure of the catalyst to each temperature for 1 h. This M-H measurement was used to determine the degree of reduction (DOR, Equation (2)), particle size distribution, and the average particle size of the catalyst. Figure 3a shows the change in the sample magnetisation as a function of the applied magnetic field in an Ar environment after exposure to reactor temperatures ranging from 350 to 650 °C. These results show that the sample magnetisation did not change after exposure to 350, 450, and 550 °C. There is a slight decrease in the magnetisation observed after exposure to 650 °C, which is due to a misalignment of the reactor during this measurement and not due to any phase changes occurring in the sample, since Ar would not oxidise the catalyst. The results presented in Figure 3b, which were obtained after the tests in the H2O/H2 environment, show a decrease in the magnetisation with an increase in the treatment temperature. As detailed in Section 3.3, a loss in magnetisation corresponds to a phase change of the ferromagnetic metallic Ni to a non-ferromagnetic phase, such as NiO and/or NiAl2O4. Therefore, the results in Figure 3b show the detection of oxidation using the magnetometer, which can further be quantified and expressed as a (change in the) degree of reduction (DOR), based on a calibration of the magnetometer with a known mass of metallic Ni (see calibration in curve in Figure S2). Table 2 shows the DOR of the sample after exposure to the different temperatures under both gas environments.
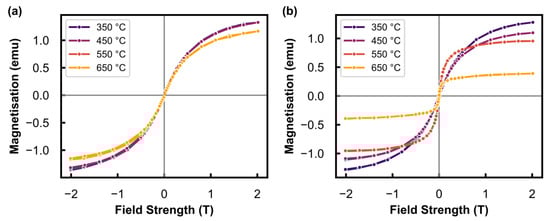
Figure 3.
Full M-H measurement results measured at 150 °C after exposure to different temperatures under (a) Ar at atmospheric pressure, and the (b) hydrothermal condition (PH2O/PH2 of 5) at 10 bar.
Table 2.
Degree of reduction after each tested temperature under different gas environments.
The DOR decreases from 80.8 to 22.2% after the tests at 350 and 650 °C, respectively, in the H2O/H2 environment, while the DOR remained relatively constant between 350 °C (86.2%) and 550 °C (82.8%) during the tests conducted in Ar. The lower DOR at 650 °C in Ar (70.7%) was due to the misalignment of the sample as previously mentioned. Oxidation in the Ar environment was not expected; however, the addition of steam can lead to the oxidation of Ni0 to NiO, or to NiAl2O4 by reacting with the Al2O3 support. The oxidation to NiAl2O4 is thermodynamically more feasible than the oxidation to NiO at lower PH2O/PH2 for bulk materials (Figure S3); however, the oxidation of metals is a size-dependent phenomenon due to the decreased coordination of surface atoms [26,34]. This results in a lower PH2O/PH2 threshold for the oxidation of smaller nanoparticles when compared with the corresponding bulk material. Metallic Ni is the only ferromagnetic material in this study that is detectable with the magnetometer, and there is a possibility of both oxidation mechanisms occurring under the H2O/H2 environment. Therefore, the loss in magnetisation of the sample with increasing temperature can be attributed to either of the two oxidation mechanisms. However, the nature of the oxide phase(s) formed cannot be confirmed with the current in situ technique.
The oxidation of Ni under simulated reaction conditions has been observed in other studies, particularly at very high PH2O/PH2 (i.e., at ratios greater than 20) [27]. In the current study, significant oxidation is identified using a magnetometry-based technique at a relatively low PH2O/PH2 of 5. The observation of oxidation at low PH2O/PH2 is possible due to the small starting metallic Ni particles (2.7 ± 1.1 nm) [23,26], while oxidation at higher PH2O/PH2 in a previous study was detected for larger starting particles (14.2 nm) using XRD [27]. We note that the particles used in the present work are very small for detection using XRD, and this is in addition to the low Ni loading on the Al2O3 support. However, the ability to still study the oxidation and sintering of such small Ni particles demonstrates the higher sensitivity of the in situ magnetometer when compared with XRD [35].
2.2.2. Magnetometry-Based Size Analysis
To obtain size information from the results in Figure 3, the normalised magnetisation (M/Ms) can be calculated and analysed (see Figure 4). The remnant magnetisation at an applied field of 0 T (i.e., in the absence of an external magnetic field) is shown in Figure 5. This has been used to calculate γ (see Equation (3) [36]), which is the weight fraction of non-superparamagnetic particles (that are ferromagnetic and thermally blocked) with a size greater than the critical size (Dc) of 20 nm at room temperature for the superparamagnetic behaviour of metallic Ni [37]. However, since the M-H measurements were recorded at 150 °C, the critical size is estimated as ≈23 nm according to the dependence of [38]. These results can be found in Table 3. The value varies between 1.8 and 3.4 wt% after exposure of the reduced catalyst to different temperatures under Ar, indicating no significant nanoparticle growth above the critical size of metallic Ni. However, the sample tested in the presence of steam does show a significant increase in from 2.2 wt% after 550 °C to 8.4 wt% after exposure to 650 °C, which is indicative of sintering and substantial particle growth above the critical size. The low values calculated for all tests (which are less than 10 wt%) make these results suitable for analysis using the Langevin equation (see Equation (4) [36]), as the sample after each tested condition predominantly consisted of superparamagnetic material [36,39].
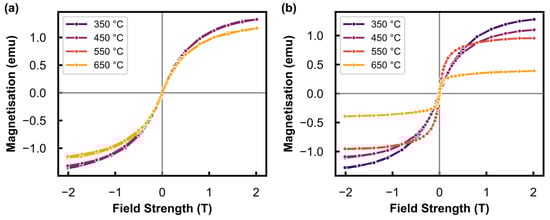
Figure 4.
Normalised magnetisation (M/Ms) as a function of the applied magnetic field measured at 150 °C after exposure to different temperatures under (a) Ar at atmospheric pressure, and the (b) hydrothermal condition (PH2O/PH2 of 5) at 10 bar.
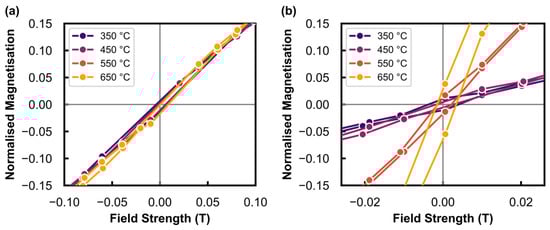
Figure 5.
Magnified region of the normalised magnetisation plots in Figure 4 to display the remnant magnetisation around 0 T measured at 150 °C after exposure to different temperatures under (a) Ar at atmospheric pressure, and the (b) hydrothermal condition (PH2O/PH2 of 5) at 10 bar.
Table 3.
Calculated values after each tested temperature under the different gas environments.
The application of the Langevin method for obtaining size information through a linear combination of Langevin curves as a function of size is described in Section 3.3. The M-H curves for the tests carried out in Ar (Figure 4a) show little (or no) change in shape, which qualitatively indicates no significant changes to the size of the metallic Ni particles. However, the change in the shape of the M-H curves in Figure 4b after exposure to elevated temperatures provides an indication of the size changes occurring during the hydrothermal tests (PH2O/PH2 of 5). A depiction of the effect of size on the Langevin curve can be found in Figure S4. The linear combination of these Langevin curves for different crystallite sizes was used to derive full volume-based size distributions after each tested temperature under the two gas environments.
2.2.3. Methods Used with the Langevin Equation
Volume-based size distributions were determined using three different methods based on the Langevin equation, viz., the lognormal, bimodal, and least squares method. A summary of the residual sum of squares obtained from this analysis for all three methods has been presented in Figure 6a, and an example of the determined size distributions using each method for the test performed at 550 °C in the H2O/H2 environment can be found in Figure 6b. The results for the other temperatures tested under the H2O/H2 environment can be found in Figure S5. The results for the lognormal and bimodal fits show the probability distribution shapes as expected, since the method used generates lognormal size distributions with a known mean and standard deviation. The best lognormal and bimodal fits that describe the experimental data with the lowest residuals were identified. The least squares method differs from the lognormal and bimodal methods in that any size distribution (i.e., a distribution not generated by a lognormal function) is possible. The least squares fit shows similar results to the bimodal method, with two peaks occurring in similar size regions (see Figure 6b). The residuals that were calculated for these three methods show that the best fits to the experiments were obtained using the least squares method at all temperatures (see Figure 6a). Therefore, the least squares method was used in further comparisons of the size distributions for the other tested temperatures under the different gas environments.
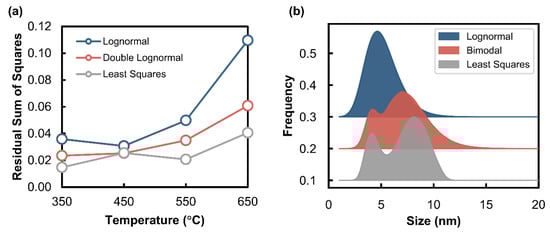
Figure 6.
(a) Comparison of the residual sum of squares for the three Langevin-based methods applied for each temperature tested under the hydrothermal condition (PH2O/PH2 of 5) at 10 bar. (b) Example of volume-based size distributions derived from the linear combination fitting of Langevin curves to the experimental data obtained under the hydrothermal condition at 550 °C.
2.2.4. Derivation of Size Distributions from Magnetometry Data
Figure 7 shows the volume-based size distributions that were determined from the magnetometry data in Figure 4 by applying the Langevin method (the fits from this method can be found in Figures S6 and S7). These distributions show the stability of the nanoparticles under the Ar gas environment in the temperature range studied. More specifically, the volume-based average size varied between 4.1 and 4.2 nm (see Table 4), with only a slight broadening of the distributions observed at 550 and 650 °C (Figure 7a). In the H2O/H2 environment, the results show an increase in the average size with increasing temperature, from 4.2 to 9.3 nm (Table 4), as well as a broadening and development of a bimodal distribution (Figure 7b). The increased sintering in the presence of steam can be attributed to the possible formation of Ni(OH)x surface species, which facilitate the mobility of Ni nanoparticles [19,40,41]. In previous studies, it has been reported that the operating conditions, such as temperature, may cause the catalyst to sinter, with an increase in the sintering rate at elevated temperatures (650–800 °C) [41,42,43,44]. It is believed that atom migration is dominant at higher temperatures, while particle migration dominates at lower temperatures. In situ TEM studies have provided insights into the sintering of supported nickel catalysts through the observation of both mechanisms occurring at various temperatures. These studies have shown that catalyst properties such as interparticle separation, initial particle size, pore structure, and support heterogeneity affect the mechanism by which sintering occurs [40,45,46,47]. The size distributions presented in Figure 7b may suggest that particle migration and coalescence is dominant, especially since the position of the lower size bimodal peak at 550 and 650 °C shows a minimal change. This indicates that the smaller metallic Ni nanoparticles present in the sample do not decrease significantly in size, which would be characteristic of atom migration [48,49]. As previously mentioned, the in situ magnetometer can only study the physicochemical changes of the metallic Ni present in the sample, which is the active phase in the application of interest. According to thermodynamics, smaller nanoparticles in the system may be more susceptible to oxidation [26]. Therefore, due to the occurrence of oxidation in the reactor, a large percentage of smaller nanoparticles may be unaccounted for in the size distributions in Figure 7b, particularly after the test at 650 °C under the hydrothermal condition (see DOR data in Table 2).
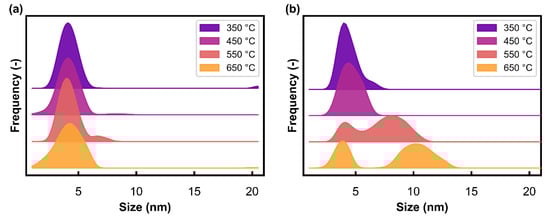
Figure 7.
Volume-based size distributions derived from the magnetometry data in Figure 4 (via the Langevin method) as a function of temperature under (a) Ar at atmospheric pressure, and the (b) hydrothermal condition (PH2O/PH2 of 5) at 10 bar.
Table 4.
Volume-based average sizes calculated from the magnetometry data (via the Langevin method) for each temperature tested under the different gas environments.
2.2.5. Comparison of the Size Analysis from the TEM and Magnetometry Studies
The volume-based size distributions derived from the magnetometry data (via the Langevin method) can be compared with those derived from ex situ TEM analysis, as shown in Figure 8. It should be highlighted that the size distributions emanating from the Langevin method are volume-based, whereas the particle counts (in Figure 2) from the TEM analysis are number-based. However, the TEM-derived number-based size distributions have been converted to volume-based distributions to allow for a comparison with the magnetometry-derived ones (see Figure 8). The size distributions from the magnetometry studies have been scaled according to the calculated DOR (see Table 2) to account for the volume of metallic Ni in the sample measured using the magnetometer relative to the volume of sample detectable using TEM (i.e., metallic and oxidised Ni). Table 5 gives a summary of the volume-based average sizes from the two characterisation techniques.
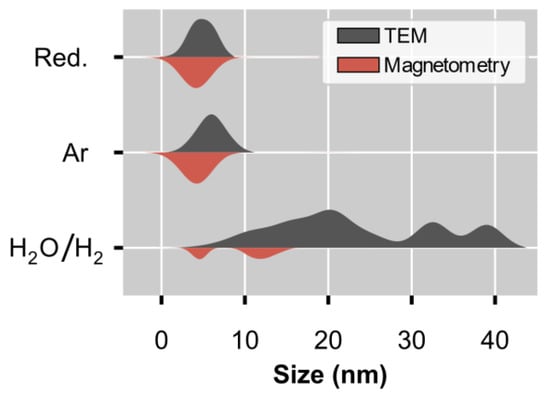
Figure 8.
Comparison of the volume-based size distributions derived using the data from ex situ TEM and in situ magnetometry. The size distributions from the TEM analysis are normalised to the modal size for each spent sample. The results for these same distributions, but normalised to the total volume, can be found in Figure S8. The distributions from the magnetometry-based measurements have been scaled using the DOR to allow for an accurate comparison with the TEM distributions.
Table 5.
Summary of the volume-based average particle sizes and standard deviations from the TEM and magnetometry studies.
The comparison in Figure 8 and Table 5 shows a strong agreement between the volume-based size distributions and the corresponding average sizes for the samples obtained after the tests conducted in Ar. The size distributions derived for the tests performed in the H2O/H2 environment differ between the two characterisation techniques, with a much larger average size of 49.7 nm calculated from TEM, compared with the size of 9.3 nm obtained from the magnetometry-based analysis (see Table 5). These differences can be explained by the fact that the Langevin method only includes superparamagnetic particles, which exist up to a certain critical size, and it excludes metallic Ni particles larger than this size and those that have oxidised (due to the presence of steam). The critical size of Ni at 150 °C, which is the temperature where the M-H measurements were conducted, is estimated to be 37.9 nm, as mentioned previously. The existence of a critical size provides an upper limit for any size measurements determined using the Langevin method. This is not the case for the TEM analysis; hence, it is expected that the volume-based average size from magnetometry would be lower than the TEM-derived average size since metallic Ni, NiO, and NiAl2O4 particles are potentially detectable using TEM independent of size. However, we were unable to distinguish the three mentioned Ni-based phases using TEM, and therefore, the size distributions in Figure 2 and Figure 8 may include particles from all three phases.
Nonetheless, it is important to note that both characterisation techniques confirm the occurrence of sintering in the H2O/H2 environment at elevated temperatures. In the case of the magnetometer, the size changes occurring in the sample were studied in situ under industrially relevant temperatures, pressures, and gas environments (e.g., a H2O-H2 mixture), and they revealed the development of a bimodal distribution for metallic Ni.
3. Materials and Methods
3.1. Catalyst Preparation
An alumina-supported nickel catalyst was prepared via incipient wetness impregnation [50]. The bare support (γ-Al2O3, PURALOX SCCa 5–150, SBET = 162 m2/g, VBJH pore = 0.47 cm3/g, dBJH pore = 11.5 nm, SASOL Germany) was pre-treated via calcination at 600 °C in a Nabertherm furnace for 2 h (heating rate: 10 °C/min) prior to the impregnation. Nickel(II) nitrate hexahydrate (Ni(NO3)2.6H2O, >97% purity, Sigma-Aldrich South Africa) was used to prepare the impregnation solution (0.2 g Ni(NO3)2.6H2O per mL of deionised water). A single impregnation was performed, and an Ni loading of 4 wt% was targeted. After the impregnation, the Ni-loaded support was dried at 120 °C for 24 h in a Memmert oven.
3.2. Ex Situ Catalyst Characterisation
Powder X-ray diffraction (PXRD) was performed in a Bruker D8 Advance Laboratory X-ray diffractometer operated at 35 kV and 40 mA, which was equipped with a cobalt source (λKα1 = 1.78897 Å) and a position-sensitive detector (VANTEC, Bruker AXS). The optics of the diffractometer were set to parallel beam geometry. A 2θ range of 20–130° was chosen as the measurement window. A step size of 0.01° and a time per step of 0.4 s was used, giving a total scan time of 1 h 14 min.
Transmission electron microscopy (TEM) was performed using a JEOL JEM-2100 (LaB6) microscope operated at an accelerating voltage of 200 kV in TEM mode. Hollow cone diffractive (HCD) imaging was done using a hardware implemented beam deflector system. The images were generated with a beam tilt of approximately 5.9 mrad using an objective aperture centred around the midpoint of the Ni(111) and NiO(012) diffraction peaks. This enabled a hollow cone dark field image to be created by preferentially using diffracted electrons originating from Ni and NiO phases. The regions with Ni and/or NiO that strongly diffract in this direction will appear brighter in the generated image. The observed particles in the acquired images were measured using the freeware ImageJ 1.15a [51]. Based on counting between 120 and 200 particles, the number- and volume-based size distributions, average sizes, and standard deviations were determined using the approach and equations in the book chapter by Bergeret and Gallezot (also see Equations (S1)–(S4)) [52].
3.3. Magnetism and Magnetometry
Magnetometry-based measurements were carried out using an in situ magnetometer [32,53,54] developed by the University of Cape Town and SASOL, South Africa. The magnetometer is capable of operating at temperatures up to 900 °C and pressures of 50 bar. A ½ inch stainless steel fixed bed reactor is placed at an air gap of 48 mm between two pole caps of the electromagnet (Bruker Analytik GmbH), which reaches a maximum field strength of 2 T under current-control mode. Magnetisation measurements can be taken under reaction conditions allowing for the determination of particle size and chemical phase changes occurring in samples with ferromagnetic material. In this study, only metallic Ni is detectable using the magnetometer since it is ferromagnetic, having a high mass-specific magnetisation (55.1 emu/g at 27 °C [55]) and a relatively high Curie temperature (358 °C [33]). The low mass-specific magnetisation of NiO (0.097 emu/g at 27 °C [56]) makes it undetectable in the magnetometer. This implies that the degree of reduction (DOR) can only be based on the magnetisation of the metallic Ni in the sample. The DOR can be calculated (Equation (2)) using the sample magnetisation, the loaded mass of unreduced Ni, and the instrument calibration based on a known mass of Ni (see Figure S2).
is the measured sample magnetisation of the sample (in emu) at a given temperature, is the expected magnetisation of metallic Ni determined from the calibration curve at the same temperature, is the targeted loading of Ni in the sample (4 wt%), is the mass of unreduced sample (1.5 g) loaded in the reactor, and is the known mass of calibration sample (0.1 g).
Magnetisation measurements (M) taken as a function of the applied magnetic field (H), i.e., an M-H measurement, allows for the hysteresis behaviour of ferromagnetic materials to be studied. In these measurements, the saturation magnetisation can be measured at high field strengths, where the magnetic dipole moments within the magnetic domains of the material are in the direction of the applied field. Upon removal of the magnetic field, these ferromagnetic materials retain a portion of their magnetisation (i.e., remnant magnetisation ()), thus displaying hysteresis behaviour in the field loop. Below a certain critical size (which is ≈20 nm for metallic Ni at room temperature [37]), these materials no longer display remnant magnetisation in the absence of a magnetic field, thus displaying superparamagnetic behaviour. It should be noted that the critical size for superparamagnetism is temperature dependent, and while the critical size of Ni is not known at higher temperatures, it is thought that its dependence on temperature can be described according to [38]. The weight fraction of non-superparamagnetic particles (that are ferromagnetic and thermally blocked) having a size larger than the critical size—represented by the symbol γ—can be calculated from the saturation magnetisation () and the remnant magnetisation (Mr), as seen in Equation (3). The superparamagnetic behaviour of Ni nanoparticles can be described by the Langevin equation (Equation (4)) [36], from which size distributions can be determined by performing a linear combination of Langevin curves that approximate the experimental M-H results [34]. This technique allows for full volume-based size distributions below the critical size of metallic Ni to be obtained under reaction conditions. Samples with a γ value less than 10% are deemed to have a suitably high percentage of superparamagnetic material for analysis using the Langevin method.
In Equation (4), is the magnetisation of the sample, is the saturation magnetisation of the sample at high field strength, is the material density, is the mass-specific saturation magnetisation, is the Boltzmann constant, is the external magnetic field strength, is the absolute temperature, and is the volume-based particle size.
The experimental results required for this size analysis were obtained by recording the magnetisation as a function of the field strength from −2 T to +2 T and back to −2 T, with 65 measurements being taken over this range in 38 min. This measurement is referred to as an M-H measurement, as also mentioned above. Three approaches were taken in determining the size distribution that best fit the experimental M-H measurements. The first method involved calculating experimental Langevin curves from a range of lognormal size distributions with varying mean and standard deviation values. The fit with the lowest residual sum of squares to the experimental data was identified as the best fit. The second method involved a similar approach; however, the generated distributions comprised of two lognormal distributions and the best fit was identified as before. The third method was by performing least squares minimisation of the problem in Equation (5) subject to the constraints that all frequencies in the distribution are positive (Equation (6)). This minimisation problem was solved using a sequential quadratic programming (SQP) [57] algorithm implemented in SciPy [58]. In Equations (5) and (6), is the volume fraction of the nanoparticles of size and is the Langevin equation evaluated at a size of .
3.3.1. In Situ Reduction Studies in a Hydrogen Atmosphere
First, 1.5 g of the Ni-loaded support was activated in situ before performing the thermally induced sintering and oxidation studies at different temperatures (350, 450, 550 and 650 °C) and gas environments (i.e., in a flow of Ar, and a flow of PH2O/PH2 = 5, respectively). The sample was reduced at atmospheric pressure by flowing 50 mL(NTP)/min/gcat of H2 while heating the reactor from room temperature to 500 °C (heating rate: 5 °C/min), and then keeping this final temperature for 12 h. The Curie temperature of metallic Ni is 358 °C [33], and above this temperature, Ni will not display any magnetisation; i.e., it will become paramagnetic. To obtain a meaningful M-H measurement, this had to be taken at a temperature well below the Curie temperature. Therefore, the sample was cooled to 150 °C (cooling rate: 10 °C/min) under an Ar flow (100 mL(NTP)/min), which served as the reference temperature for taking M-H measurements in all subsequent tests (see Section 3.3.2 and Section 3.3.3). Upon reaching 150 °C, a full M-H measurement (38 min) was performed by taking 65 magnetisation readings from −2 to +2 T and then back to −2 T.
For the purpose of characterising the reduced catalyst ex situ, the reactor was cooled to room temperature, and then, carbon dioxide was flowed over the sample for 1 h to passivate the metallic Ni nanoparticles.
3.3.2. In Situ Sintering Studies in an Inert Atmosphere
The effects of elevated temperature on crystallite growth were investigated by exposing the reduced catalyst to different temperatures, i.e., 350, 450, 550, and 650 °C. These tests were conducted at atmospheric pressure in an inert environment (Ar flow: 100 mL(NTP)/min). After reduction, the reactor was cooled to 350 °C (cooling rate: 10 °C/min), which was held for 1 h. Thereafter, the reactor was cooled down from 350 to 150 °C (cooling rate: 10 °C/min) before taking an M-H measurement. The reactor was heated again from 150 to 400 °C (heating rate: 5 °C/min) and then to 450 °C (heating rate: 1 °C/min), which was kept constant for 1 h before decreasing the temperature back to 150 °C in order to record an M-H measurement. The remaining tests at 550 and 650 °C were also conducted in a similar manner as described above.
After the final test at 650 °C, the reactor was cooled to room temperature in Ar (100 mL(NTP)/min). Then, carbon dioxide was flowed through the reactor for 1 h to passivate the metallic Ni for further ex situ characterisation.
3.3.3. In Situ Sintering and Oxidation Studies in a Steam/Hydrogen Atmosphere
The effect of water vapour on crystallite growth and oxidation of the reduced catalyst was investigated by co-feeding steam and hydrogen into the reactor at 350, 450, 550, and 650 °C. The reactor was pressurised to 10 bar by flowing 100 mL(NTP)/min of Ar. Thereafter, the reactor was bypassed by allowing Ar to flow through a stainless steel SiC-filled 150 mL vaporising vessel (heated to 180 °C). The gas was switched from Ar to H2 (25 mL(NTP)/min); then, an HPLC pump was used to flow 0.10 mL/min of deionised liquid water to the vaporising vessel, to allow for a steam/hydrogen partial pressure ratio (PH2O/PH2) of 5. Then, the gas flow was reverted to the reactor to begin the experimental condition. A PH2O/PH2 of 5 corresponds to a CO conversion to CH4 of 94% (see Equation (7)); therefore, this experimental condition simulates the effects of water vapour at the high conversions associated with the methanation process, despite the thermodynamic infeasibility at high temperatures (550 and 650 °C).
is the steam/hydrogen partial pressure ratio and is the fractional conversion of CO to CH4 (i.e., 0 ≤ < 1), assuming the chemical reaction in Equation (7).
The reactor was cooled from 500 to 350 °C after reduction (cooling rate: 10 °C/min). At 350 °C, the gaseous H2O/H2 mixture flowed through the reactor for 1 h. Thereafter, the flowing gas was changed to Ar (100 mL(NTP)/min), the vaporising vessel was bypassed, and then the reactor was cooled to 150 °C (cooling rate: 10 °C/min). The liquid water from the HPLC pump was diverted away from the vaporising vessel to the purge. The system was depressurised to atmospheric pressure and the Ar was flowed for an additional 30 min at 150 °C to ensure that all H2O and H2 have been purged before taking M-H measurements. This process was repeated for the subsequent tests at 450, 550, and 650 °C.
The spent catalyst sample was passivated by flowing CO2 through the reactor for 1 h at room temperature and atmospheric pressure, prior to unloading, in preparation for further ex situ characterisation.
4. Summary and Conclusions
Nickel-based catalysts are widely used for the hydrogenation of CO to CH4 due to their relatively low cost as well as high activity and selectivity towards CH4. However, these catalysts can experience different deactivation mechanisms during methanation, with sintering and oxidation being among the well-known ones. Therefore, our current work has investigated the extent of sintering and oxidation of reduced Al2O3-supported Ni nanoparticles using in situ magnetometry under simulated CO methanation conditions, involving different temperatures and gas environments. Since metallic Ni is ferromagnetic, changes to its chemical and/or physical characteristics under reaction conditions could be monitored using magnetometry.
We have shown that increasing the temperature from 350 to 650 °C (every 100 °C) under an Ar flow at atmospheric pressure does not cause significant changes to the average size and DOR of the starting metallic Ni particles. The minimal (or absence of) sintering may be due to the presence of the Al2O3 support and consequently, the existence of strong nanoparticle–support interactions. The chemical phase stability of the metallic Ni can be attributed to the inertness of Ar. When the gas environment is changed from Ar to hydrothermal conditions (PH2O/PH2 of 5) at 10 bar, and the temperature is increased from 350 to 650 °C, the metallic Ni particles gradually oxidise (i.e., lose their relative magnetisation), which causes a decrease in the DOR from 86.2 to 22.2%. The oxidation of the metallic phase (to possibly NiO and/or NiAl2O4) is attributed to the presence of H2O, which is a relatively strong oxidising agent. Furthermore, co-feeding steam and hydrogen caused a significant growth in the average size of the un-oxidised metallic particles from 4.2 to 9.3 nm (based on magnetometry) as well as the development of a bimodal distribution. This sintering behaviour can be attributed to the possible formation of Ni(OH)x surface species, resulting in particle migration. Sintering in the presence of steam has also been observed for other metallic particles (e.g., Co [15,38]). Ex situ TEM analysis of the spent catalysts also confirmed the sintering of the Ni-based particles after the hydrothermal treatment showing an increase in the volume-based average size of 3.8 to 49.7 nm.
Thus, we have confirmed the sintering and oxidation of Ni catalysts under hydrothermal conditions using magnetometry-based in situ characterisation. We have also shown that magnetometry-based analyses can be used to obtain size information (i.e., volume-based size distributions and average sizes of superparamagnetic particles) that is analogous to the size information from TEM analyses, in that they both confirm the occurrence of sintering. More importantly, the magnetometry-based studies could be conducted in situ, i.e., without removal of the catalyst from the reactor.
Supplementary Materials
The following are available online at https://www.mdpi.com/article/10.3390/catal11050636/s1, Figure S1: Ex situ PXRD pattern of the bare and Ni-loaded Al2O3 support (radiation source: Co Kα1 = 1.78897 Å), Table S1: ICDD PDF-2 entries of all chemical/crystal phases relevant to the current study, Figure S2: Calibration curve for the magnetometer based on 0.1 g of unreduced and unsupported NiO, Figure S3: Thermodynamics of the oxidation of metallic Ni to NiO and NiAl2O4 showing the partial pressure ratio of steam to hydrogen equilibrium position as a function of temperature, Figure S4: Langevin equation evaluated at sizes ranging from 1 nm to 10 nm, Figure S5: Comparison of size distributions determined by lognormal, bimodal and least squares methods for Langevin analysis of measurements taken under H2O environment at (a) 350 °C, (b) 450 °C, (c) 550 °C and (d) 650 °C, Figure S6: Calculated (-) and experimentally measured (o) Langevin curves for catalyst tested in Ar environment at (a) 350 °C, (b) 450 °C, (c) 550 °C and (d) 650 °C, Figure S7: Calculated (-) and experimentally measured (o) Langevin curves for catalyst tested in H2O environment at (a) 350 °C, (b) 450 °C, (c) 550 °C and (d) 650 °C. Figure S8: Comparison of the volume-based size distributions derived using the data from ex situ TEM and in situ magnetometry, with the size distributions normalised to their respective areas.
Author Contributions
Conceptualisation: M.C.; Formal analysis: D.d.O., T.M.N., M.I.F. and N.F.; Investigation: M.M. and R.H.; Supervision: M.C.; Writing—original draft: D.d.O., T.M.N., and M.I.F.; Writing—review and editing: N.F., M.C. All authors have read and agreed to the published version of the manuscript.
Funding
The authors would like to acknowledge the financial support from DSI-NRF Centre of Excellence in Catalysis (c*change–grant number: UID43195) and SASOL (South Africa).
Data Availability Statement
The data presented in this study are available on request from the corresponding author.
Acknowledgments
The authors would like to thank Jaco Olivier (from the Centre for HRTEM at the Nelson Mandela University) for carrying out the hollow cone dark field TEM imaging.
Conflicts of Interest
The authors declare no conflict of interest.
References
- Han, Y.; Quan, Y.; Hao, P.; Zhao, J.; Ren, J. Highly anti-sintering and anti-coking ordered mesoporous silica carbide supported nickel catalyst for high temperature CO methanation. Fuel 2019, 257, 116006. [Google Scholar] [CrossRef]
- Kiendl, I.; Klemm, M.; Clemens, A.; Herrman, A. Dilute gas methanation of synthesis gas from biomass gasification. Fuel 2014, 123, 211–217. [Google Scholar] [CrossRef]
- Kopyscinski, J.; Seemann, M.C.; Moergeli, R.; Biollaz, S.M.A.; Schildhauer, T.J. Synthetic natural gas from wood: Reactions of ethylene in fluidised bed methanation. Appl. Catal. A Gen. 2013, 462–463, 150–156. [Google Scholar] [CrossRef]
- Razzaq, R.; Li, C.; Zhang, S. Coke oven gas: Availability, properties, purification, and utilization in China. Fuel 2013, 113, 287–299. [Google Scholar] [CrossRef]
- Gong, D.; Li, S.; Guo, S.; Tang, H.; Wang, H.; Liu, Y. Lanthanum and cerium co-modified Ni/SiO2 catalyst for CO methanation from syngas. Appl. Surf. Sci. 2018, 434, 351–364. [Google Scholar] [CrossRef]
- Gao, J.; Liu, Q.; Gu, F.; Liu, B.; Zhong, Z.; Su, F. Recent advances in methanation catalysts for the production of synthetic natural gas. Rsc Adv. 2015, 5, 22759–22776. [Google Scholar] [CrossRef]
- Vannice, M.A. The catalytic synthesis of hydrocarbons from H2CO mixtures over the group VIII metals: I. The specific activities and product distributions of supported metals. J. Catal. 1975, 37, 449–461. [Google Scholar] [CrossRef]
- Foppa, L.; Iannuzzi, M.; Copéret, C.; Comas-Vives, A. CO methanation on ruthenium flat and stepped surfaces: Key role of H-transfers and entropy revealed by ab initio molecular dynamics. J. Catal. 2019, 371, 270–275. [Google Scholar] [CrossRef]
- Zhang, Y.; Yang, H.; Liu, Q.; Bian, B. MoOx-Doped Ordered Mesoporous Ni/Al2O3 Catalyst for CO Methanation. Energy Technol. 2020, 8, 2000165. [Google Scholar] [CrossRef]
- Ren, J.; Li, H.; Jin, Y.; Zhu, J.; Liu, S.; Lin, J.; Li, Z. Silica/titania composite-supported Ni catalysts for CO methanation: Effects of Ti species on the activity, anti-sintering, and anti-coking properties. Appl. Catal. B Environ. 2017, 201, 561–572. [Google Scholar] [CrossRef]
- Wang, C.; Zhai, P.; Zhang, Z.; Zhou, Y.; Zhang, J.; Zhang, H.; Shi, Z.; Han, R.P.S.; Huang, F.; Ma, D. Nickel catalyst stabilization via graphene encapsulation for enhanced methanation reaction. J. Catal. 2016, 334, 42–51. [Google Scholar] [CrossRef]
- Qin, Z.; Ren, J.; Miao, M.; Li, Z.; Lin, J.; Xie, K. The catalytic methanation of coke oven gas over Ni-Ce/Al2O3 catalysts prepared by microwave heating: Effect of amorphous NiO formation. Appl. Catal. B Environ. 2015, 164, 18–30. [Google Scholar] [CrossRef]
- Forzatti, P.; Lietti, L. Catalyst deactivation. Catal. Today 1999, 52, 165–181. [Google Scholar] [CrossRef]
- Moulijn, J.A.; van Diepen, A.E.; Kapteijn, F. Catalyst deactivation: Is it predictable?: What to do? Appl. Catal. A Gen. 2001, 212, 3–16. [Google Scholar] [CrossRef]
- Claeys, M.; Dry, M.E.; van Steen, E.; van Berge, P.J.; Booyens, S.; Crous, R.; van Helden, P.; Labuschagne, J.; Moodley, D.J.; Saib, A.M. Impact of Process Conditions on the Sintering Behavior of an Alumina-Supported Cobalt Fischer–Tropsch Catalyst Studied with an in Situ Magnetometer. Acs Catal. 2015, 5, 841–852. [Google Scholar] [CrossRef]
- Thomson, W. On the equilibrium of vapour at a curved surface of liquid. Lond. Edinb. Dublin Philos. Mag. J. Sci. 1871, 42, 448–452. [Google Scholar] [CrossRef]
- Liu, Q.; Gu, F.; Zhong, Z.; Xu, G.; Su, F. Anti-sintering ZrO2-modified Ni/α-Al2O3 catalyst for CO methanation. Rsc Adv. 2016, 6, 20979–20986. [Google Scholar] [CrossRef]
- Lucchini, M.A.; Testino, A.; Kambolis, A.; Proff, C.; Ludwig, C. Sintering and coking resistant core–shell microporous silica–nickel nanoparticles for CO methanation: Towards advanced catalysts production. Appl. Catal. B Environ. 2016, 182, 94–101. [Google Scholar] [CrossRef]
- Sehested, J. Four challenges for nickel steam-reforming catalysts. Catal. Today 2006, 111, 103–110. [Google Scholar] [CrossRef]
- Rönsch, S.; Schneider, J.; Matthischke, S.; Schlüter, M.; Götz, M.; Lefebvre, J.; Prabhakaran, P.; Bajohr, S. Review on methanation—From fundamentals to current projects. Fuel 2016, 166, 276–296. [Google Scholar] [CrossRef]
- Agnelli, M.; Swaan, H.M.; Marquez-Alvarez, C.; Martin, G.A.; Mirodatos, C. CO Hydrogenation on a Nickel Catalyst: II. A Mechanistic Study by Transient Kinetics and Infrared Spectroscopy. J. Catal. 1998, 175, 117–128. [Google Scholar] [CrossRef]
- Wang, X.; Liu, Q.; Jiang, J.; Jin, G.; Li, H.; Gu, F.; Xu, G.; Zhong, Z.; Su, F. SiO2-stabilized Ni/t-ZrO2 catalysts with ordered mesopores: One-pot synthesis and their superior catalytic performance in CO methanation. Catal. Sci. Technol. 2016, 6, 3529–3543. [Google Scholar] [CrossRef]
- Rostrup-Nielsen, J.R. Catalytic steam reforming. In Catalysis: Science and Technology, 1st ed.; Anderson, J.R., Boudart, M., Eds.; Springer: Berlin, Heidelberg, 1984; pp. 1–117. [Google Scholar]
- Perego, C.; Villa, P. Catalyst preparation methods. Catal. Today 1997, 34, 281–305. [Google Scholar] [CrossRef]
- Reuel, R.C.; Bartholomew, C.H. Effects of support and dispersion on the CO hydrogenation activity/selectivity properties of cobalt. J. Catal. 1984, 85, 78–88. [Google Scholar] [CrossRef]
- van Steen, E.; Claeys, M.; Dry, M.E.; van de Loosdrecht, J.; Viljoen, E.L.; Visagie, J.L. Stability of nanocrystals: Thermodynamic analysis of oxidation and re-reduction of cobalt in water/hydrogen mixtures. J. Phys. Chem. B 2005, 109, 3575–3577. [Google Scholar] [CrossRef]
- Sehested, J.; Gelten, J.A.; Helveg, S. Sintering of nickel catalysts: Effects of time, atmosphere, temperature, nickel-carrier interactions, and dopants. Appl. Catal. A Gen. 2006, 309, 237–246. [Google Scholar] [CrossRef]
- Champon, I.; Bengaouer, A.; Chaise, A.; Thomas, S.; Roger, A.-C. Modelling the Sintering of Nickel Particles Supported on γ-Alumina under Hydrothermal Conditions. Catalysts 2020, 10, 1477. [Google Scholar] [CrossRef]
- Wolf, M.; Fischer, N.; Claeys, M. Water-induced deactivation of cobalt-based Fischer–Tropsch catalysts. Nat. Catal. 2020, 3, 962–965. [Google Scholar] [CrossRef]
- Wolf, M.; Fischer, N.; Claeys, M. Capturing the interconnectivity of water-induced oxidation and sintering of cobalt nanoparticles during the Fischer-Tropsch synthesis in situ. J. Catal. 2019, 374, 199–207. [Google Scholar] [CrossRef]
- Argyle, M.D.; Bartholomew, C.H. Heterogeneous Catalyst Deactivation and Regeneration: A Review. Catalysts 2015, 5, 145–269. [Google Scholar] [CrossRef]
- Fischer, N.; Claeys, M. In situ characterization of Fischer–Tropsch catalysts: A review. J. Phys. D Appl. Phys. 2020, 53, 293001. [Google Scholar] [CrossRef]
- Knacke, O.; Kubaschewski, O.; Hesselmann, K. Thermochemical Properties of Inorganic Substances, 2nd ed.; Springer: Berlin, Germany, 1991. [Google Scholar]
- Wolf, M.; Kotze, H.; Fischer, N.; Claeys, M. Size dependent stability of cobalt nanoparticles on silica under high conversion Fischer-Tropsch environment. Faraday Discuss. 2017, 197, 243–268. [Google Scholar] [CrossRef]
- Nyathi, T.M.; Fischer, N.; York, A.P.E.; Morgan, D.J.; Hutchings, G.J.; Gibson, E.K.; Wells, P.P.; Catlow, C.R.A.; Claeys, M. Impact of Nanoparticle–Support Interactions in Co3O4/Al2O3 Catalysts for the Preferential Oxidation of Carbon Monoxide. Acs Catal. 2019, 9, 7166–7178. [Google Scholar] [CrossRef] [PubMed]
- Dalmon, J. Magnetic measurements and catalysis. In Catalyst Characterization: Physical Techniques for Solid Materials, 1st ed.; Imelik, B., Vedrine, J.C., Eds.; Springer: New York, NY, USA, 1994; pp. 585–607. [Google Scholar]
- Ishizaki, T.; Yatsugi, K.; Akedo, K. Effect of Particle Size on the Magnetic Properties of Ni Nanoparticles Synthesized with Trioctylphosphine as the Capping Agent. Nanomaterials 2016, 6, 172. [Google Scholar] [CrossRef]
- Moodley, D.; Claeys, M.; van Steen, E.; van Helden, P.; Kistamurthy, D.; Weststrate, K.-J.; Niemantsverdriet, H.; Saib, A.; Erasmus, W.; van de Loosdrecht, J. Sintering of cobalt during FTS: Insights from industrial and model systems. Catal. Today 2020, 342, 59–70. [Google Scholar] [CrossRef]
- Wolf, M.; Gibson, E.K.; Olivier, E.J.; Neethling, J.H.; Catlow, C.R.A.; Fischer, N.; Claeys, M. Water-Induced Formation of Cobalt-Support Compounds under Simulated High Conversion Fischer–Tropsch Environment. Acs Catal. 2019, 9, 4902–4918. [Google Scholar] [CrossRef]
- Sehested, J.; Larsen, N.W.; Falsig, H.; Hinnemann, B. Sintering of nickel steam reforming catalysts: Effective mass diffusion constant for Ni-OH at nickel surfaces. Catal. Today 2014, 228, 22–31. [Google Scholar] [CrossRef]
- Sehested, J. Sintering of nickel steam-reforming catalysts: Effects of temperature and steam and hydrogen pressures. J. Catal. 2004, 223, 432–443. [Google Scholar] [CrossRef]
- Rasmussen, F.B.; Sehested, J.; Teunissen, H.T.; Molenbroek, A.M.; Clausen, B.S. Sintering of Ni/Al2O3 catalysts studied by anomalous small angle X-ray scattering. Appl. Catal. A Gen. 2004, 267, 165–173. [Google Scholar] [CrossRef]
- Sehested, J. Sintering of nickel steam-reforming catalysts. J. Catal. 2003, 217, 417–426. [Google Scholar] [CrossRef]
- Bartholomew, C.H.; Sorensen, W.L. Sintering kinetics of silica-and alumina-supported nickel in hydrogen atmosphere. J. Catal. 1983, 81, 131–141. [Google Scholar] [CrossRef]
- Prieto, G.; Zečević, J.; Friedrich, H.; de Jong, K.P.; de Jongh, P.E. Towards stable catalysts by controlling collective properties of supported metal nanoparticles. Nat. Mater. 2013, 12, 34–39. [Google Scholar] [CrossRef] [PubMed]
- Challa, S.R.; Delariva, A.T.; Hansen, T.W.; Helveg, S.; Sehested, J.; Hansen, P.L.; Garzon, F.; Datye, A.K. Relating rates of catalyst sintering to the disappearance of individual nanoparticles during Ostwald ripening. J. Am. Chem. Soc. 2011, 133, 20672–20675. [Google Scholar] [CrossRef] [PubMed]
- DeLaRiva, A.T.; Hansen, T.W.; Challa, S.R.; Datye, A.K. In situ transmission electron microscopy of catalyst sintering. J. Catal. 2013, 308, 291–305. [Google Scholar] [CrossRef]
- Bellare, A.; Dadyburjor, D.B.; Kelley, M.J. Evolution of bimodal distributions in the sintering of model supported metal catalysts. J. Catal. 1989, 117, 78–90. [Google Scholar] [CrossRef]
- Kolb, M.; Agnelli, M.; Mirodatos, C. Kinetics of Bimodal Grain Size Distribution of a Ni Catalyst During Hydrogenation of CO. In Studies in Surface Science and Catalysis; Guczi, L., Solymosi, F., TÉTÉNyi, P., Eds.; Elsevier B.V.: Amsterdam, The Netherlands, 1993; Volume 75, pp. 2833–2836. [Google Scholar]
- Bartholomew, C.H.; Pannell, R.B. The stoichiometry of hydrogen and carbon monoxide chemisorption on alumina- and silica-supported nickel. J. Catal. 1980, 65, 390–401. [Google Scholar] [CrossRef]
- Schneider, C.A.; Rasband, W.S.; Eliceiri, K.W. NIH Image to ImageJ: 25 years of image analysis. Nat. Methods 2012, 9, 671–675. [Google Scholar] [CrossRef]
- Bergeret, G.; Gallezot, P. Particle Size and Dispersion Measurements. In Handbook of Heterogeneous Catalysis; Ertl, G., Knözinger, H., Schüth, F., Weitkamp, J., Eds.; Wiley-VCH Verlag GmbH & Co. KGaA: Weinheim, Germany, 2008; pp. 738–765. [Google Scholar]
- Claeys, M.C.M.; van Steen, E.W.J.; Visagie, J.L.; van de Loosdrecht, J. Magnetometer. U.S. Patent 8773118B2, 8 July 2014. [Google Scholar]
- Fischer, N.; Clapham, B.; Feltes, T.; van Steen, E.; Claeys, M. Size-Dependent Phase Transformation of Catalytically Active Nanoparticles Captured In Situ. Angew. Chem. Int. Ed. 2014, 53, 1342–1345. [Google Scholar] [CrossRef] [PubMed]
- Crangle, J.; Goodman, G.M.; Sucksmith, W. The magnetization of pure iron and nickel. Proc. R. Soc. Lond. A Math. Phys. Sci. 1971, 321, 477–491. [Google Scholar] [CrossRef]
- Shahzad, F.; Nadeem, K.; Weber, J.; Krenn, H.; Knoll, P. Magnetic behavior of NiO nanoparticles determined by SQUID magnetometry. Mater. Res. Express 2017, 4, 086102. [Google Scholar] [CrossRef]
- Kraft, D. A Software Package for Sequential Quadratic Programming; DLR German Aerospace Center-Institute for Flight Mechanics: Koln, Germany, 1988. [Google Scholar]
- Virtanen, P.; Gommers, R.; Oliphant, T.E.; Haberland, M.; Reddy, T.; Cournapeau, D.; Burovski, E.; Peterson, P.; Weckesser, W.; Bright, J. SciPy 1.0: Fundamental algorithms for scientific computing in Python. Nat. Methods 2020, 17, 261–272. [Google Scholar] [CrossRef] [PubMed]
Publisher’s Note: MDPI stays neutral with regard to jurisdictional claims in published maps and institutional affiliations. |
© 2021 by the authors. Licensee MDPI, Basel, Switzerland. This article is an open access article distributed under the terms and conditions of the Creative Commons Attribution (CC BY) license (https://creativecommons.org/licenses/by/4.0/).