Article

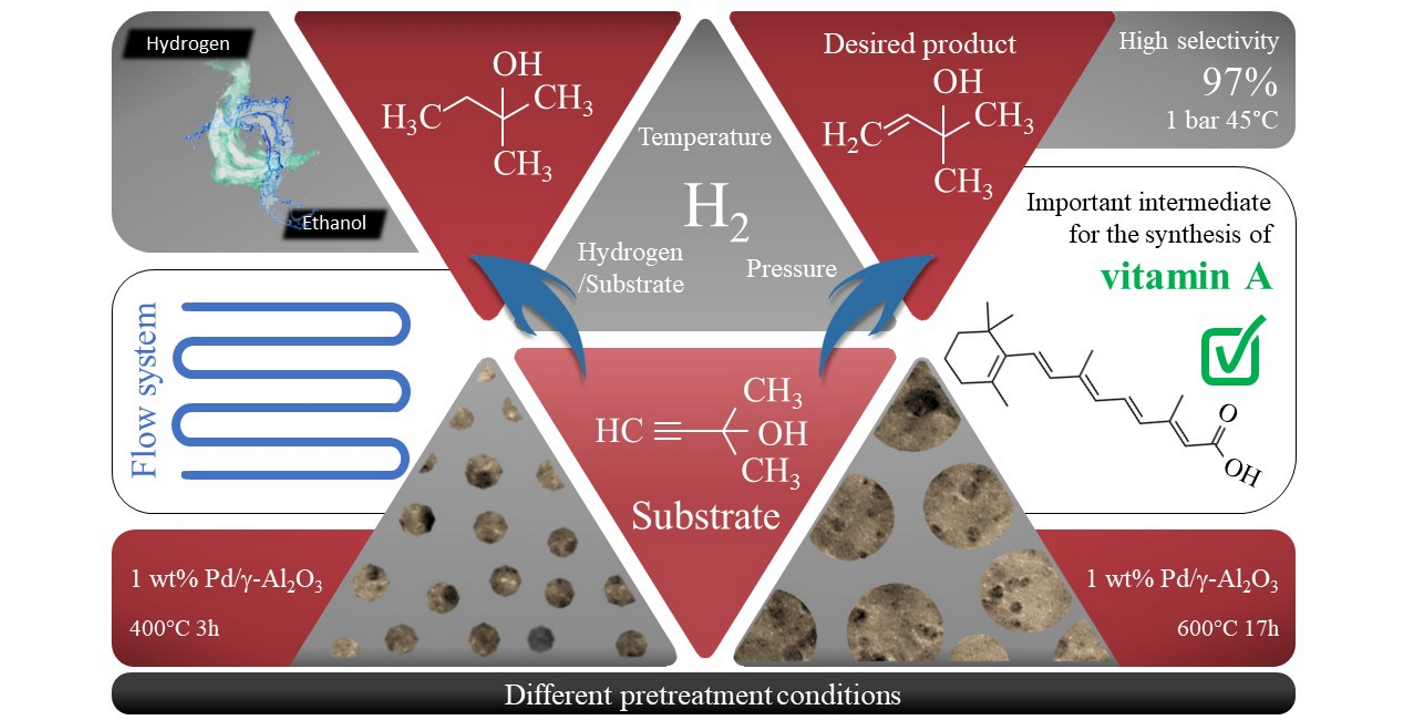
Continuous 2-Methyl-3-butyn-2-ol Selective Hydrogenation on Pd/γ-Al2O3 as a Green Pathway of Vitamin A Precursor Synthesis

by
Antonio J. Fernández-Ropero
1,
Bartosz Zawadzki
1,
Emil Kowalewski
1,
Izabela S. Pieta
1,
Mirosław Krawczyk
1,
Krzysztof Matus
2,
Dmytro Lisovytskiy
1 and
Anna Śrębowata
1,*
1
Institute of Physical Chemistry, Polish Academy of Sciences, ul. Kasprzaka 44/52, 01-224 Warsaw, Poland
2
Materials Research Laboratory, Silesian University of Technology, Konarskiego 18A, 44-100 Gliwice, Poland
*
Author to whom correspondence should be addressed.
Catalysts 2021, 11(4), 501; https://doi.org/10.3390/catal11040501
Submission received: 29 January 2021 / Revised: 12 April 2021 / Accepted: 12 April 2021 / Published: 15 April 2021

Abstract

:
In this work, the effect of pretreatment conditions (10% H2/Ar flow rate 25 mL/min and 400 °C, 3 h or 600 °C, 17 h) on the catalytic performance of 1 wt.% Pd/γ-Al2O3 has been evaluated for hydrogenation of 2-methyl-3-butyn-2-ol in continuous-flow mode. Two palladium catalysts have been tested under different conditions of pressure and temperature and characterized using various physicochemical techniques. The catalytic performance of red(400 °C)-Pd/γ-Al2O3 and red(600 °C)-Pd/γ-Al2O3 are affected by the coexistence of several related factors like the competition between PdH and PdCx formation during the reaction, structure sensitivity, hydrogen spillover to the alumina support and presence or absence of Pd–Al species. High-temperature reduction leads to formation of Pd–Al species in addition to pure Pd. The Pd–Al species which reveal unique electronic properties by decreasing the Pdδ− surface concentration via electron transfer from Pd to Al, leading to a weaker Pd–Alkyl bonding, additionally assisted by the hydrogen spillover, are the sites of improved semi-hydrogenation of 2-methyl-3-butyn-2-ol towards 2-methyl-3-buten-2-ol (97%)—an important intermediate for vitamin A synthesis.

Graphical Abstract

1. Introduction

Many chemical conversions in the pharmaceutical industry involve stoichiometric amounts of reagents and, thus, generate large amounts of waste [1]. However, implementation of catalytic methods (especially in the continuous-flow mode) in this highly competitive industry increases the process efficiency, improves energy efficiency and recyclability, reduces costs and improves sustainability. The continuous method allows fine-tuning of the contact time between intermediates and the active catalytic phase, which may result in high selectivity without using additives or a purification step, and turns into a decrease of the E-factor (kg of generated waste/kg of product) [2,3]. In consequence, the pharmaceutical industry’s application of continuous-flow practices is considered one of the most strategic fields of innovation towards greener manufacturing methods, and complies with twelve principles of green chemistry [2,4].
One of the desired products in the pharmaceutical industry is 2-methyl-3-buten-2-ol (MBE) which is obtained by means of partial reduction of 2-methyl-3-butyn-2-ol (MBY) (Scheme 1).
MBE is an important intermediate for the industrial synthesis of vitamins A (Scheme S1) [6] and E and are present in a large variety of perfumes as aroma compounds [7].
The current manufacturing processes in batch set-ups of this alcohol avoids the complete hydrogenation by using, for instance, Lindlar-type catalyst containing Pd (5 wt.%) and Pb (2–3 wt.%) deposited on CaCO3 [8]. However, lead toxicity entails an environmental concern that should not be ignored [9] and the addition of additives to enhance the selectivity results in additional costs due to the necessary separation processes [7]. While it is true that other Pb-free Pd-based catalysts are being used in the synthesis of MBE with yields of 95–97%, they suffer from high catalyst deactivation due to degradation of the support or sintering of the metal particles [10].
Hydrogenation of MBY has been investigated in continuous flow, with a good yield, both in gas and liquid conditions [5,11,12,13,14,15,16]. Most of these studies have been carried out using Pd-based catalysts, where the metal particles were supported on a large variety of materials. Yields of 89% and 92% were reached in capillary microreactors using bimetallic Pd25Zn75 [11] and pure Pd nanoparticles [12] both supported on TiO2 and using methanol as the solvent. Non-negligible values were obtained by Kundra et al., in a 3D printed catalytic static mixer. In a solution of 30% isopropanol and 70% water, with colloidal palladium on titanium silicate as a catalyst [13], 96% conversion and 91% alkene selectivity were achieved at a moderate pressure of 4 bars and a relatively high temperature of 100 °C. On the other hand, in the same study, the performance was much lower when using Lindlar catalyst. MBE selectivity over 90% was shown in Al2O3-coated metallic monolithic reactors featuring hybrid hexadecyl(2-hydroxyethyl)dimethyl ammonium dihydrogenphosphate HHDMA-modified Pd nanoparticles during a three-phase continuous-flow MBY hydrogenation in relatively low pressure and temperature ranges (1–8 bar, 30–90 °C) [15]. Promising results were also obtained for the isolated Pd atoms confined into the six-fold cavities of mpg-C3N4, in similar conditions. This single-site Pd catalyst showed higher activity than conventional heterogeneous catalysts and >90% of the selectivity toward MBE [16].
Furthermore, Pd supported on MgO, CeO2, ZnO and Al2O3 and bimetallic Pd–Zn supported on Al2O3 were investigated for gas-phase 2-methyl-3-butyn-2-ol hydrogenation [5]. Pd/ZnO and Pd–Zn/Al2O3 exhibited improved selectivity (c.a. 90%) as compared to the other catalysts. The enhancement was explained by the modification of electronic properties of Pd by electron transfer from Pd to Zn and formation of Pd–Zn alloy that blocks unselective active sites.
The latter reveals the importance of metal-support interaction and the pretreatment method. Higher activity of Pd–Zn/Al2O3 as compared to Pd/ZnO while maintaining high selectivity to MBE was explained by the effect of hydrogen spillover in the case of alumina supported catalyst [5]. Moreover, Pd/Al2O3 catalytic performance for the alkane isomerization strongly depends on the pretreatment conditions [17,18,19,20]. To the best of our knowledge, although Pd/Al2O3 has been commonly studied in the MBY hydrogenation in flow mode [5,15] and in batch systems [21], the influence of this phenomenon has not been yet investigated in the three-phase continuous-flow MBY hydrogenation.
Based on the literature data, the increasing the reduction temperature from 300 °C to 600 °C generates a considerable increase in the overall catalytic activity, and, in particular, a significant enhancement of the isomerization selectivity, up to ~90%, in the hydroconversion of C6 alkanes [18,19,20].
Therefore, we were wondering how the pretreatment conditions affect the catalytic performance of 1 wt.% Pd/γ-Al2O3 in the continuous hydrogenation of 2-methyl-3-butyn-2-ol. Consequently, the present article shows the results of MBE synthesis as the effect of the continuous partial hydrogenation of MBY in ethanol solution for two Pd/γ-Al2O3 catalysts reduced in H2/Ar flow under different procedures: 3 h at 400 °C (marked as red(400 °C)-Pd/γ-Al2O3) and 17 h at 600 °C (marked as red(600 °C)-Pd/γ-Al2O3). Different performances for both samples are discussed in the context of varying functional structures formed after preheating treatment. Reaction parameters, such as temperature and pressure, were also evaluated. The highly reduced catalyst displayed remarkable selectivity values near room temperature and favourable low-pressure stability during a green pathway of MBE synthesis.

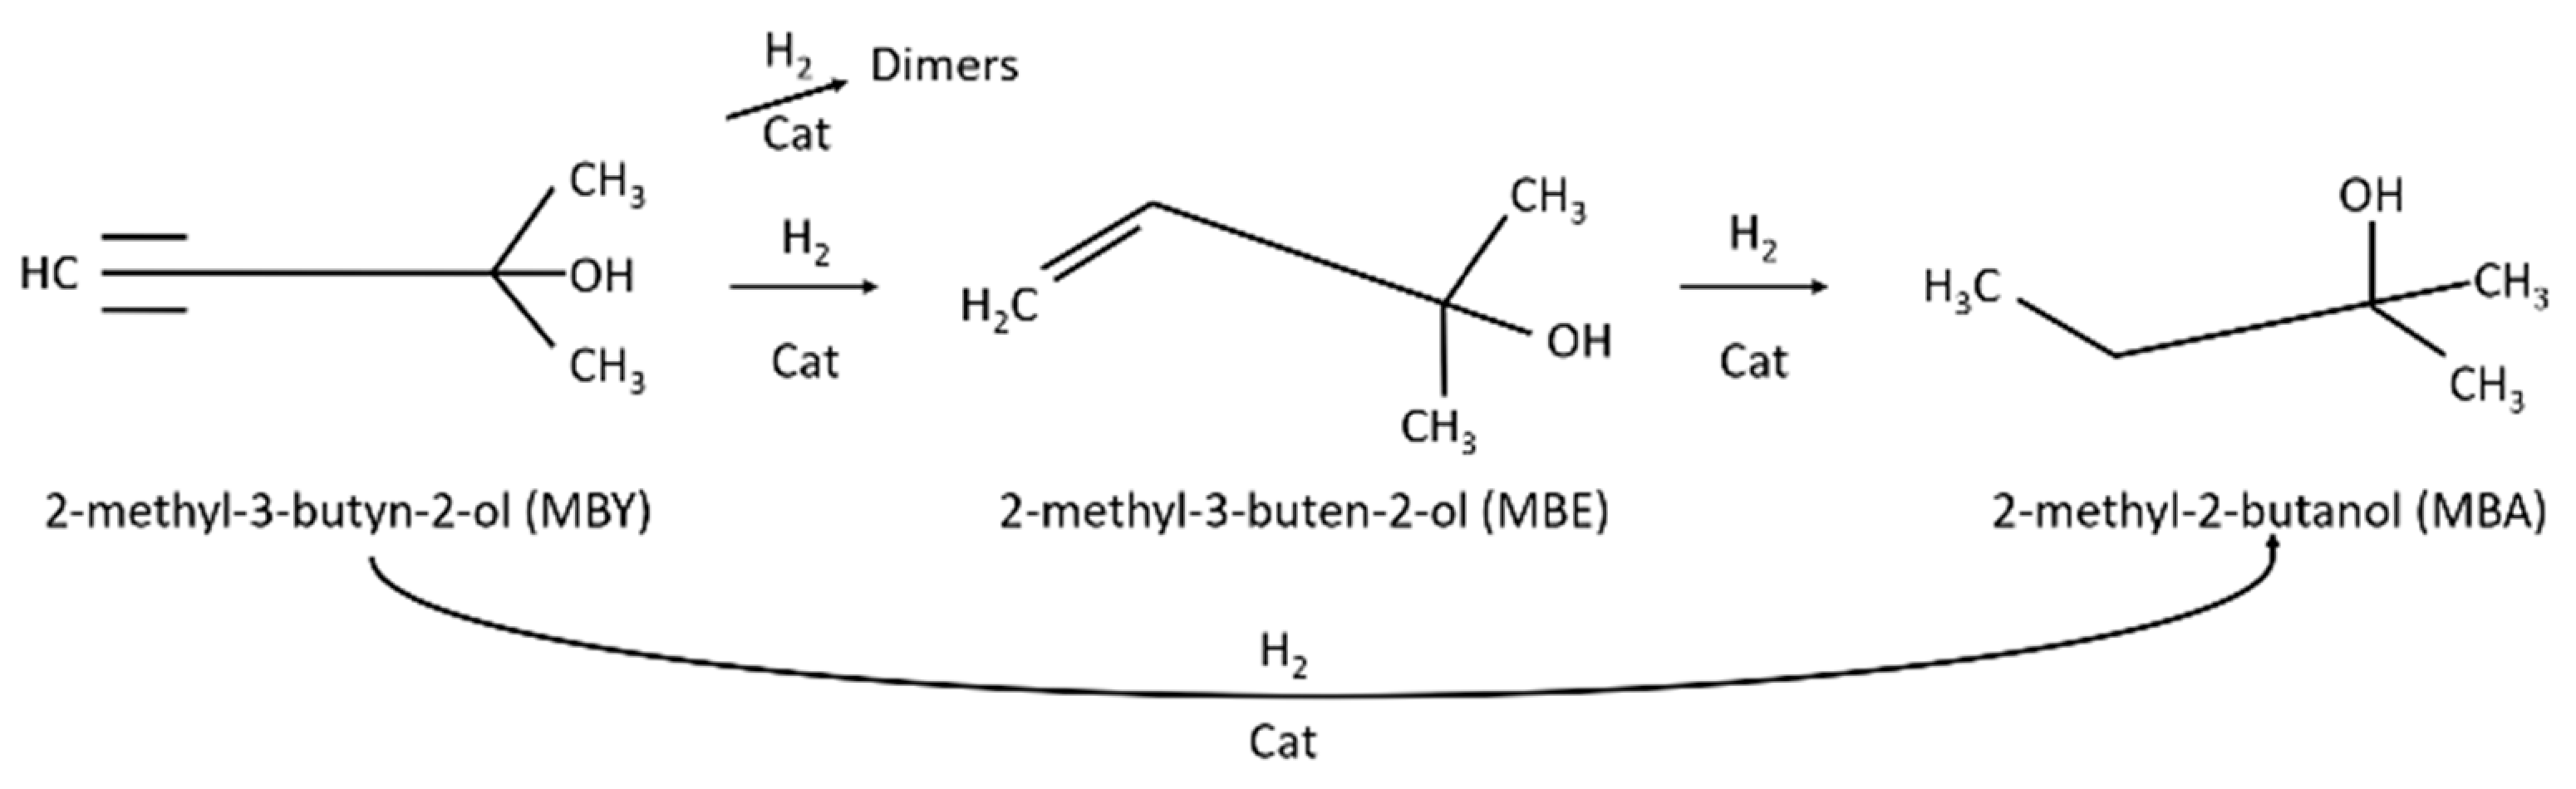
2. Results and Discussion

2.1. Characterization Results

Two palladium catalysts (red(400 °C)-Pd/γ-Al2O3 and red(600 °C)-Pd/γ-Al2O3) were thoroughly characterised using different physicochemical methods to diagnose the impact of reduction conditions on their morphology.

2.1.1. Physisorption and Chemisorption Results

Nitrogen physisorption experiments were performed to examine the textural properties of the support and the changes after Pd precursor impregnation and calcination. The results of nitrogen adsorption–desorption can be seen in Table 1.
Both materials have similar pore volume, and they have only mesopores in the structure. The slightly higher surface area corresponds to the calcined support with palladium, which probably affects the alumina structure stabilization (Table 1). In consequence, it led to more available space for nitrogen adsorption.
Pd dispersion and particle size in the reduced samples were determined by chemisorption (Table 2). The metal dispersion is higher for catalyst reduced at 400 °C, concluding that the higher reduction temperature led to Pd nanoparticle sintering.

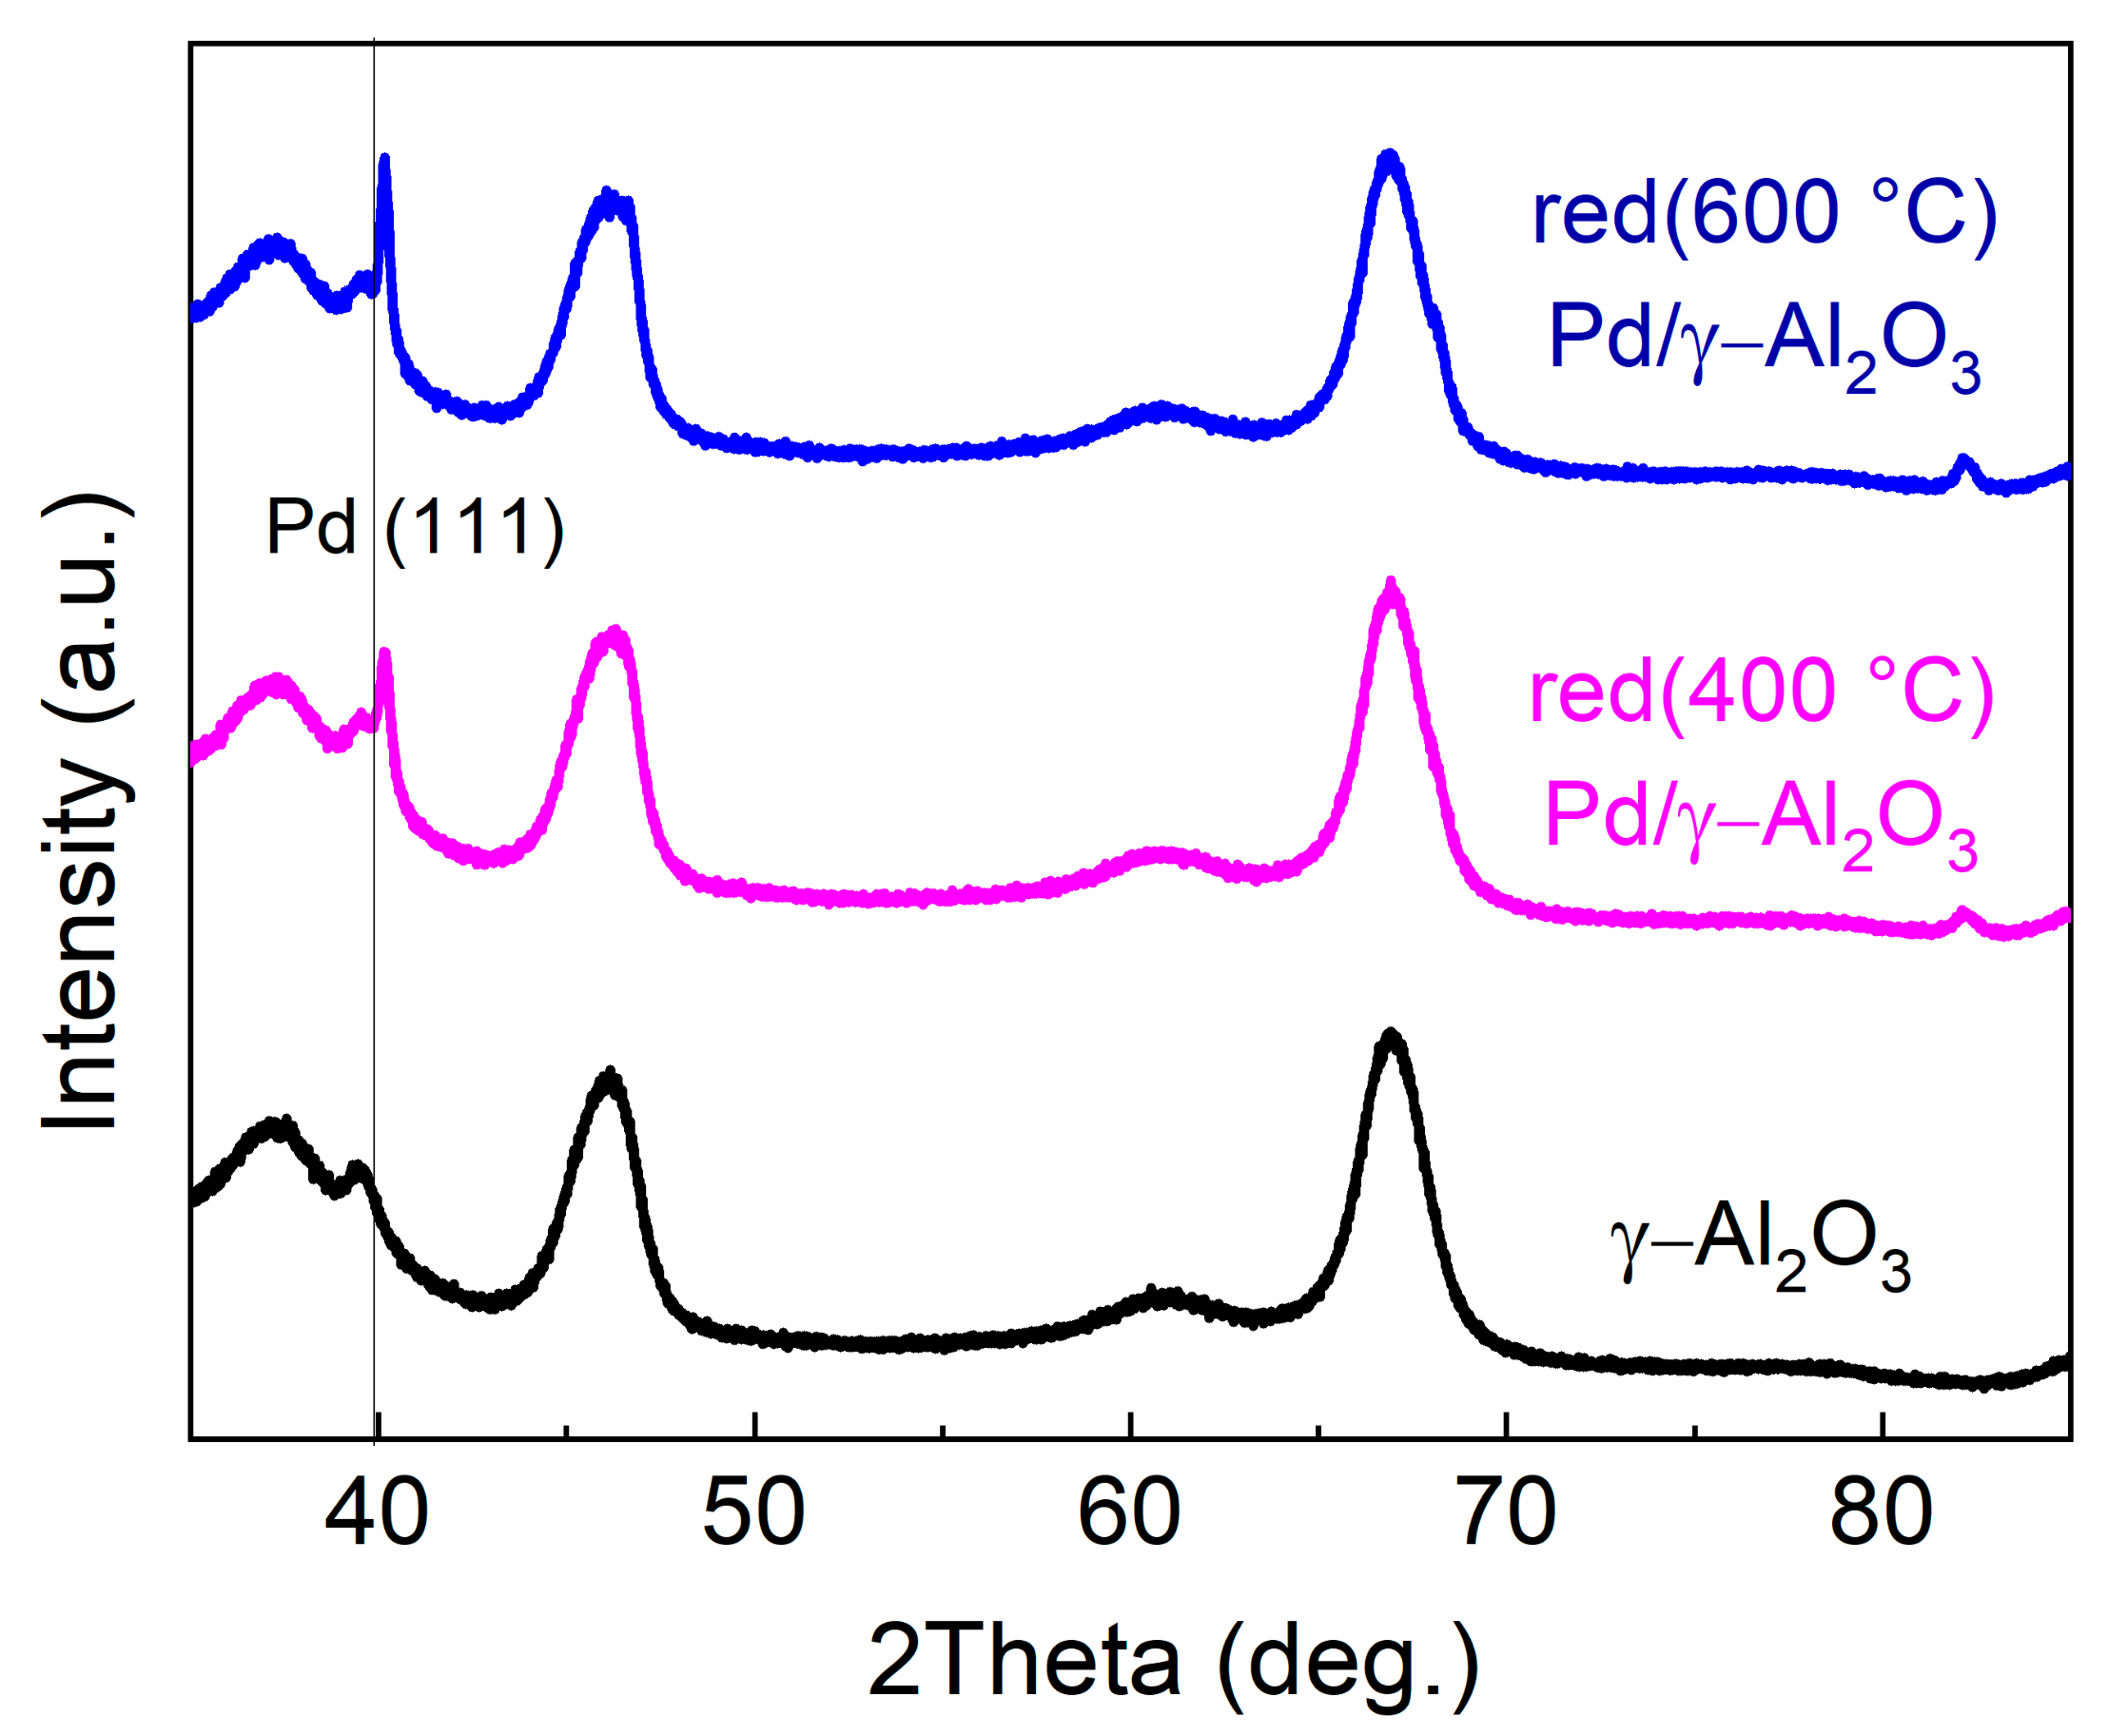
2.1.2. X-ray Diffraction Results

Figure 1 shows the X-ray diffraction (XRD) patterns for the support and the palladium catalysts. Palladium is clearly detected in the analysed catalysts. The palladium particle size was estimated as 25 nm for red(400 °C)-Pd/γ-Al2O3 and 30 nm for red 600 °C)-Pd/γ-Al2O3. Higher crystallinity of palladium should result in a sharper peak for the sample after the longer reduction time at higher temperature [22]. Additionally, for red(600 °C)-Pd/γ-Al2O3, Pd4Al3 and Pd–Al alloy formation could be expected, as it was reported for 10 wt.% Pd/γ-Al2O3 reduced at high temperature [23]. However, the small Pd loading (1 wt.% Pd) makes the formation of Pd–Al species not as invisible in this case as for 10 wt.% Pd/γ-Al2O3 (Figure 1). Independent of the reduction conditions, the characteristic reflection peak for Pd (1 1 1) appears with a maximum at ~40.15° in both catalysts. The difference in positions of the peaks 1 1 1 maximum between red(400 °C)-Pd/γ-Al2O3 and red(600 °C)-Pd/γ-Al2O3 is not spectacular (approximately 0.02°). In addition, peaks from the metallic phase are overlapped with the very wide peaks from the support. Nevertheless, there is a noticeable difference with the position of peak 1 1 1 in both Pd catalysts compared to 39.92° for pure Pd [24,25]. The shift of peak 1 1 1 from the position proper for pure Pd towards larger angles suggests the formation of a phase with a smaller lattice cell parameter (e.g., PdAl alloy) for both catalysts in agreement with earlier studies and Vegard’s law [23,26,27,28].

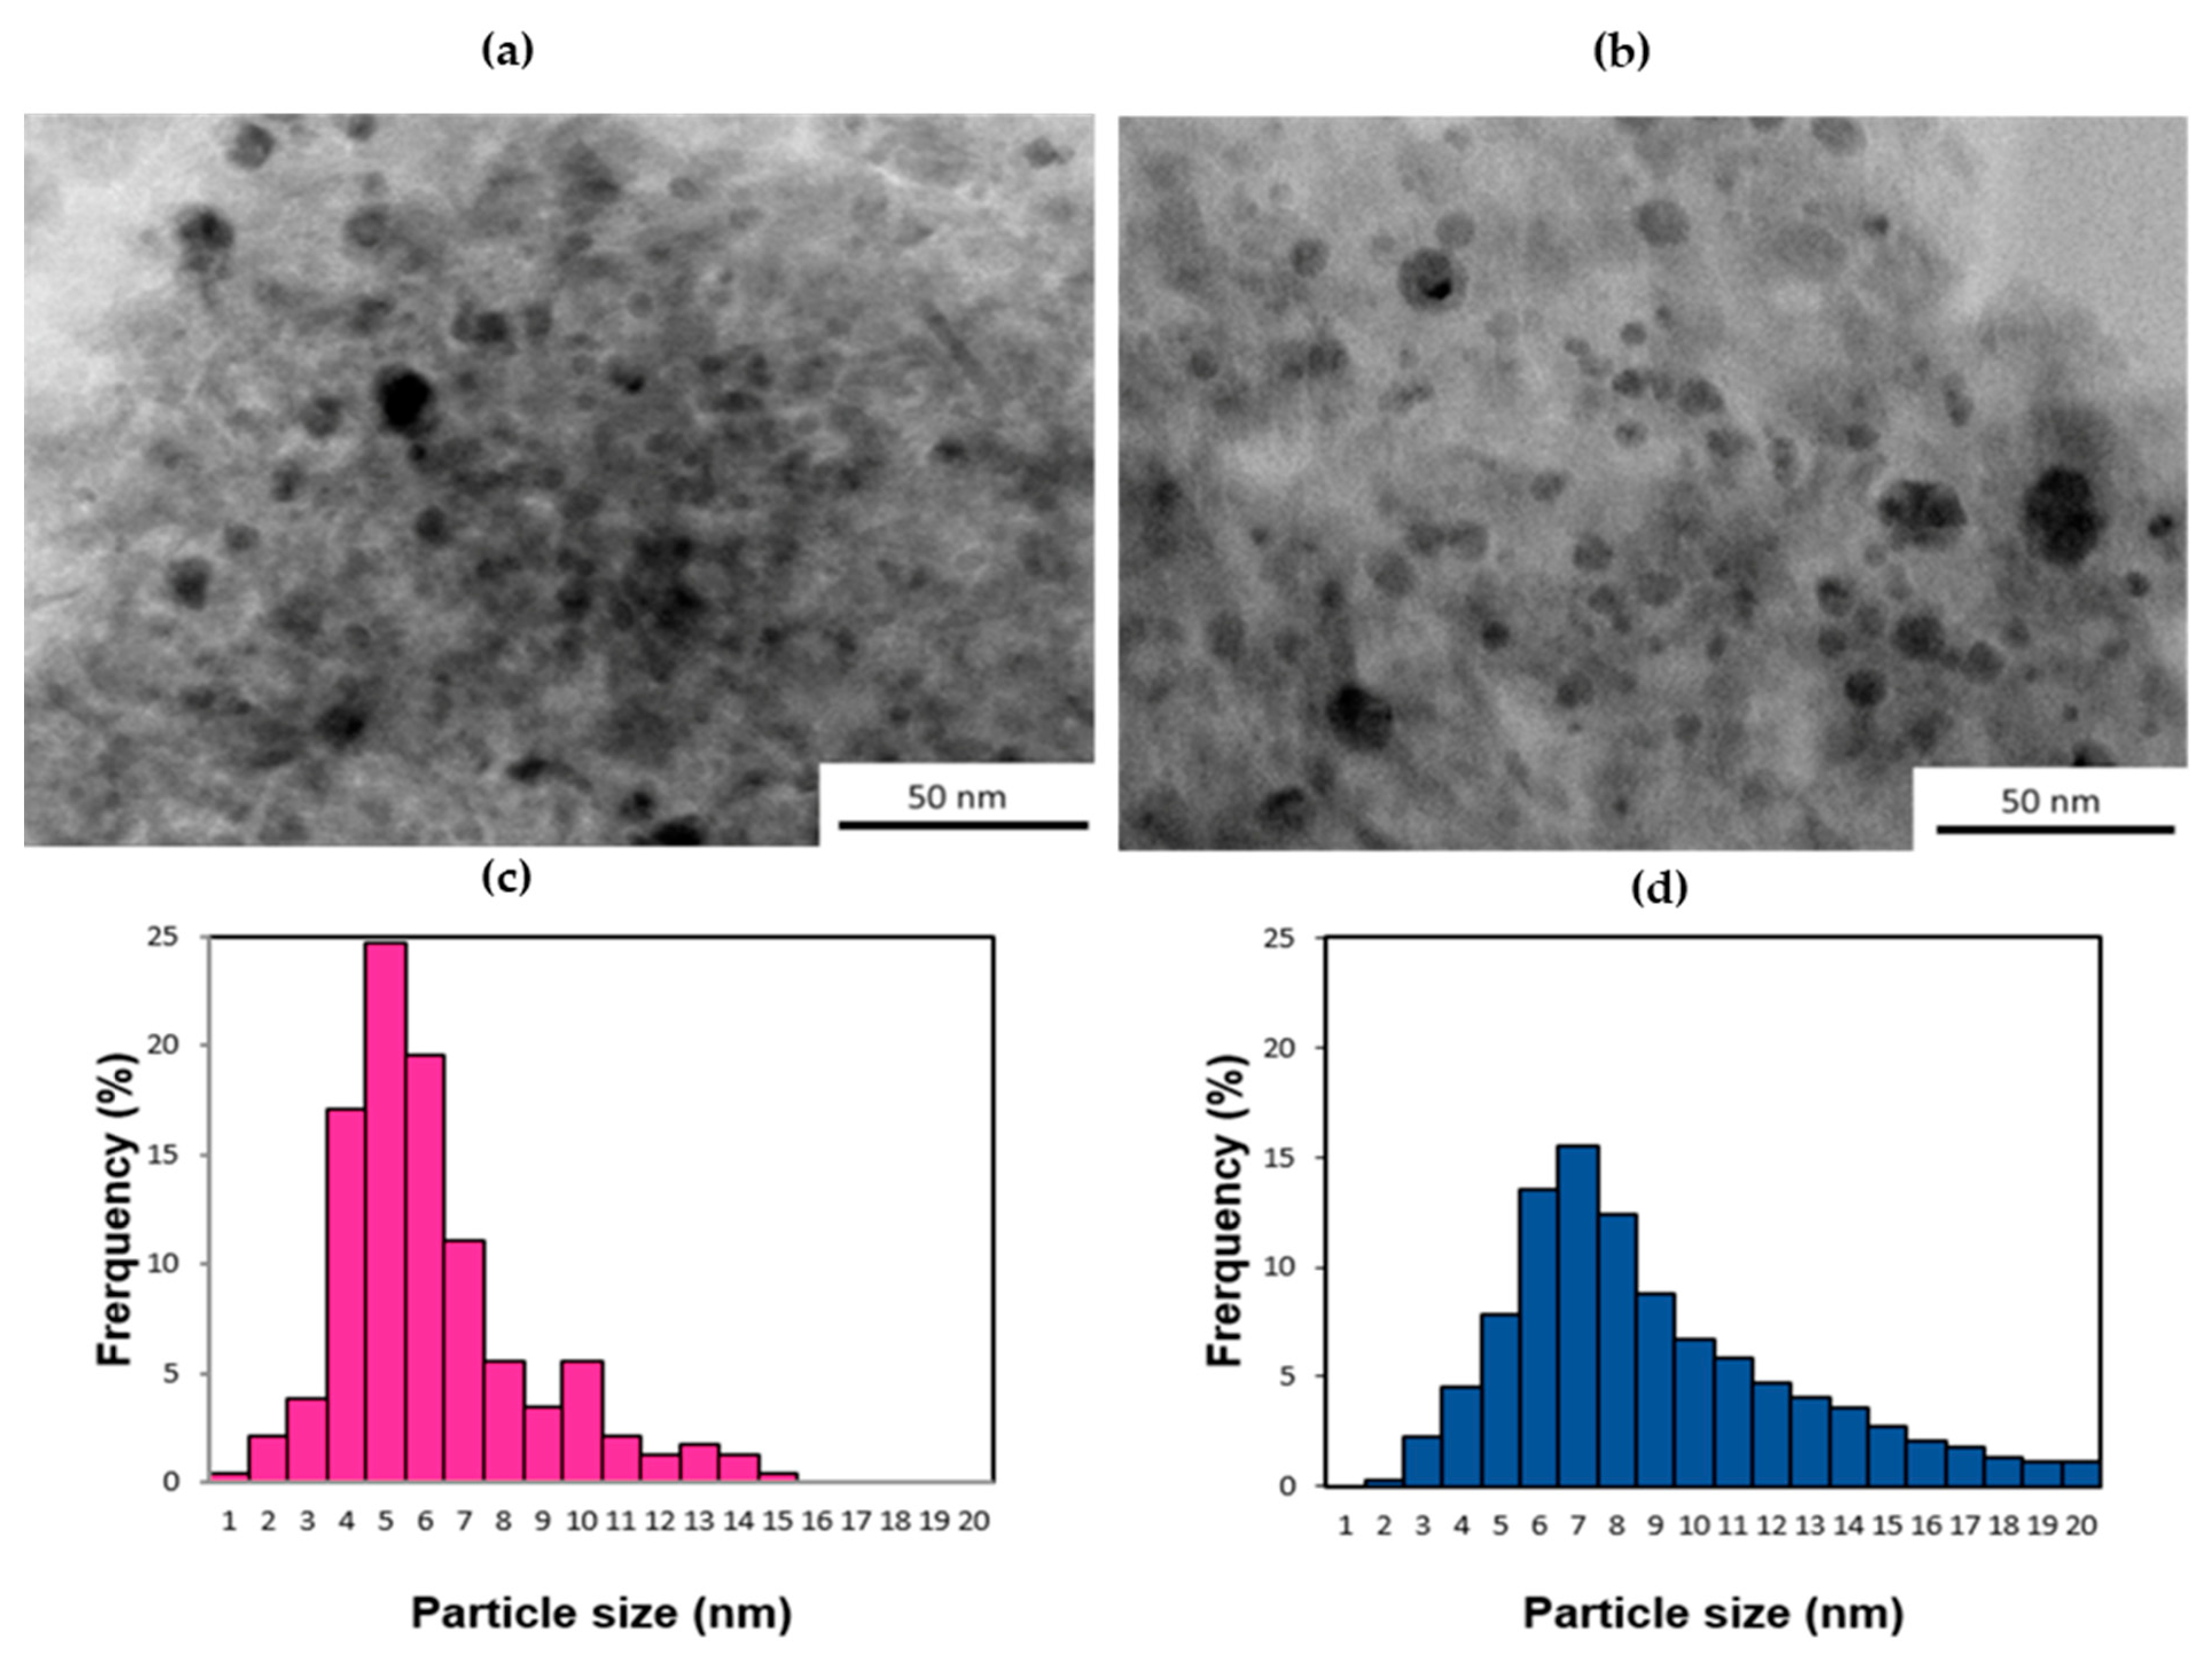
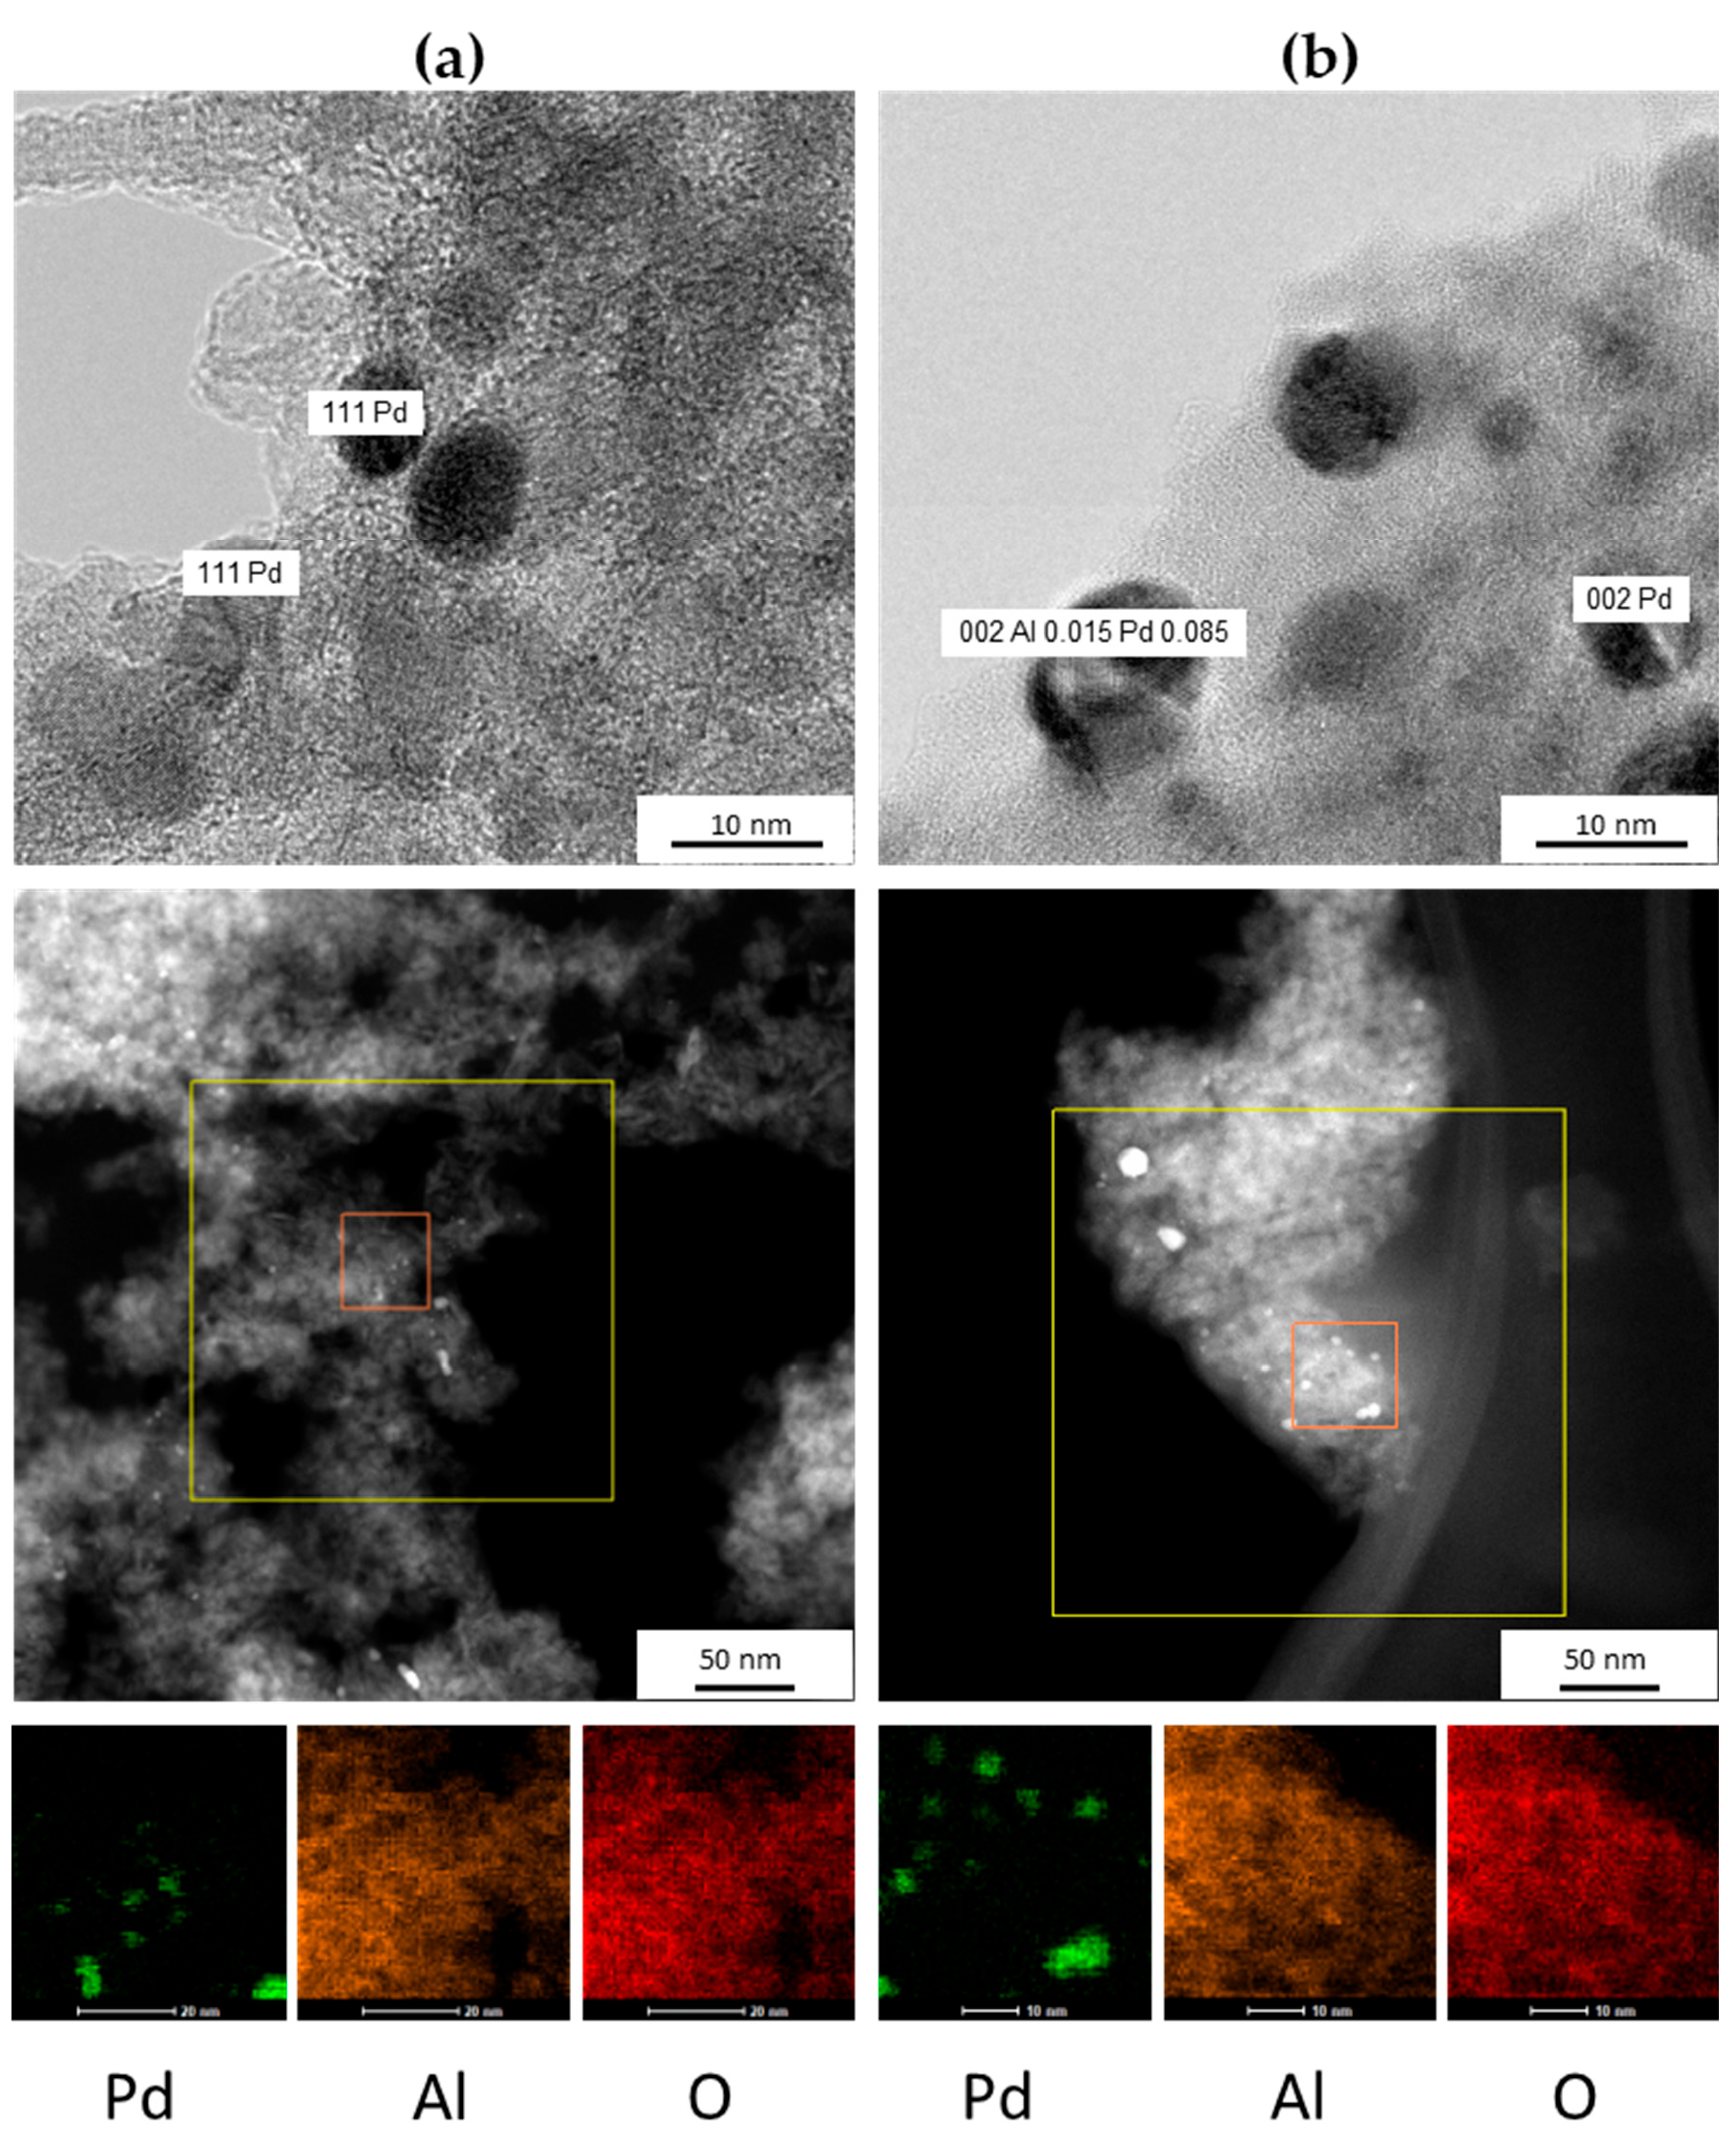
2.1.3. Transmission Electron Microscopy Results

The morphology and the composition of 1 wt.% palladium-loaded catalysts were also characterised using transmission electron microscopy (TEM). Figure 2a–d shows TEM images and palladium nanoparticle size distribution for red(400 °C)-Pd/γ-Al2O3 and red(600 °C)-Pd/γ-Al2O3.
The presented histograms (Figure 2c,d) show a relatively uniform distribution of metallic nanoparticles. The shape of all particles is spherical. The average particle size of the catalyst reduced at a lower temperature are in the range of 6 nm with similar amounts of small (1–5 nm) and bigger particles (>5 nm). On the other hand, a broad range of particle sizes is contemplated for the Pd loaded γ-alumina catalyst reduced at a higher temperature. The average particle size for red(600 °C)-Pd/γ-Al2O3 is around 9 nm with evident domination of bigger (>5 nm) Pd particles.
The particle size determined by TEM follows the same trend as CO chemisorption (Table 2) and estimation by XRD (Figure 1), with smaller particle sizes for red(400 °C)-Pd/γ-Al2O3 and bigger for red(600 °C)-Pd/γ-Al2O3. However, a disagreement between these values emerges from different estimation methods. For example, CO chemisorption determines real amounts of the active sites for reagent sorption and TEM allows for identification of both accessible and inaccessible particles.
Additionally, Figure 3, Figures S1 and S2 show scanning transmission electron microscopy (STEM), high-resolution transmission electron microscopy (HRTEM images), elemental mapping and energy dispersive X-ray spectroscopy (EDS) analysis for both catalysts. Based on these results, it was possible to determine if the nanocrystals were pure Pd or Pd–Al species in the case of red(600 °C)-Pd/γ-Al2O3 catalysts.
Elemental mapping shows detectable differences between the intensity of aluminum and oxygen in red(400 °C)-Pd/γ-Al2O3 and in red(600 °C)-Pd/γ-Al2O3, which could indicate aluminum and oxygen depletion of the γ-Al2O3 in the case of a highly reduced catalyst. Careful EDS analysis (Figures S3–S5) has shown, in the case of red(400 °C)-Pd/γ-Al2O3, that the O:Al ratio in atomic % is 2:1 independently on the analysed area (Figures S3 and S4). On the other hand, red(600 °C)-Pd/γ-Al2O3 showed the O:Al ratio of 1.25:1 or even 1:1. This phenomenon revels a deficiency of oxygen in the support and could suggest that a part of Al atoms interacts with Pd. HRTEM measurements provided evident confirmation of our suppositions. Figure 3b and Figure S2 show formation of Al0.15Pd0.85 phase in addition to pure Pd for red(600 °C)-Pd/γ-Al2O3, as opposed to red(400 °C)-Pd/γ-Al2O3 (Figure 3a and Figure S1).

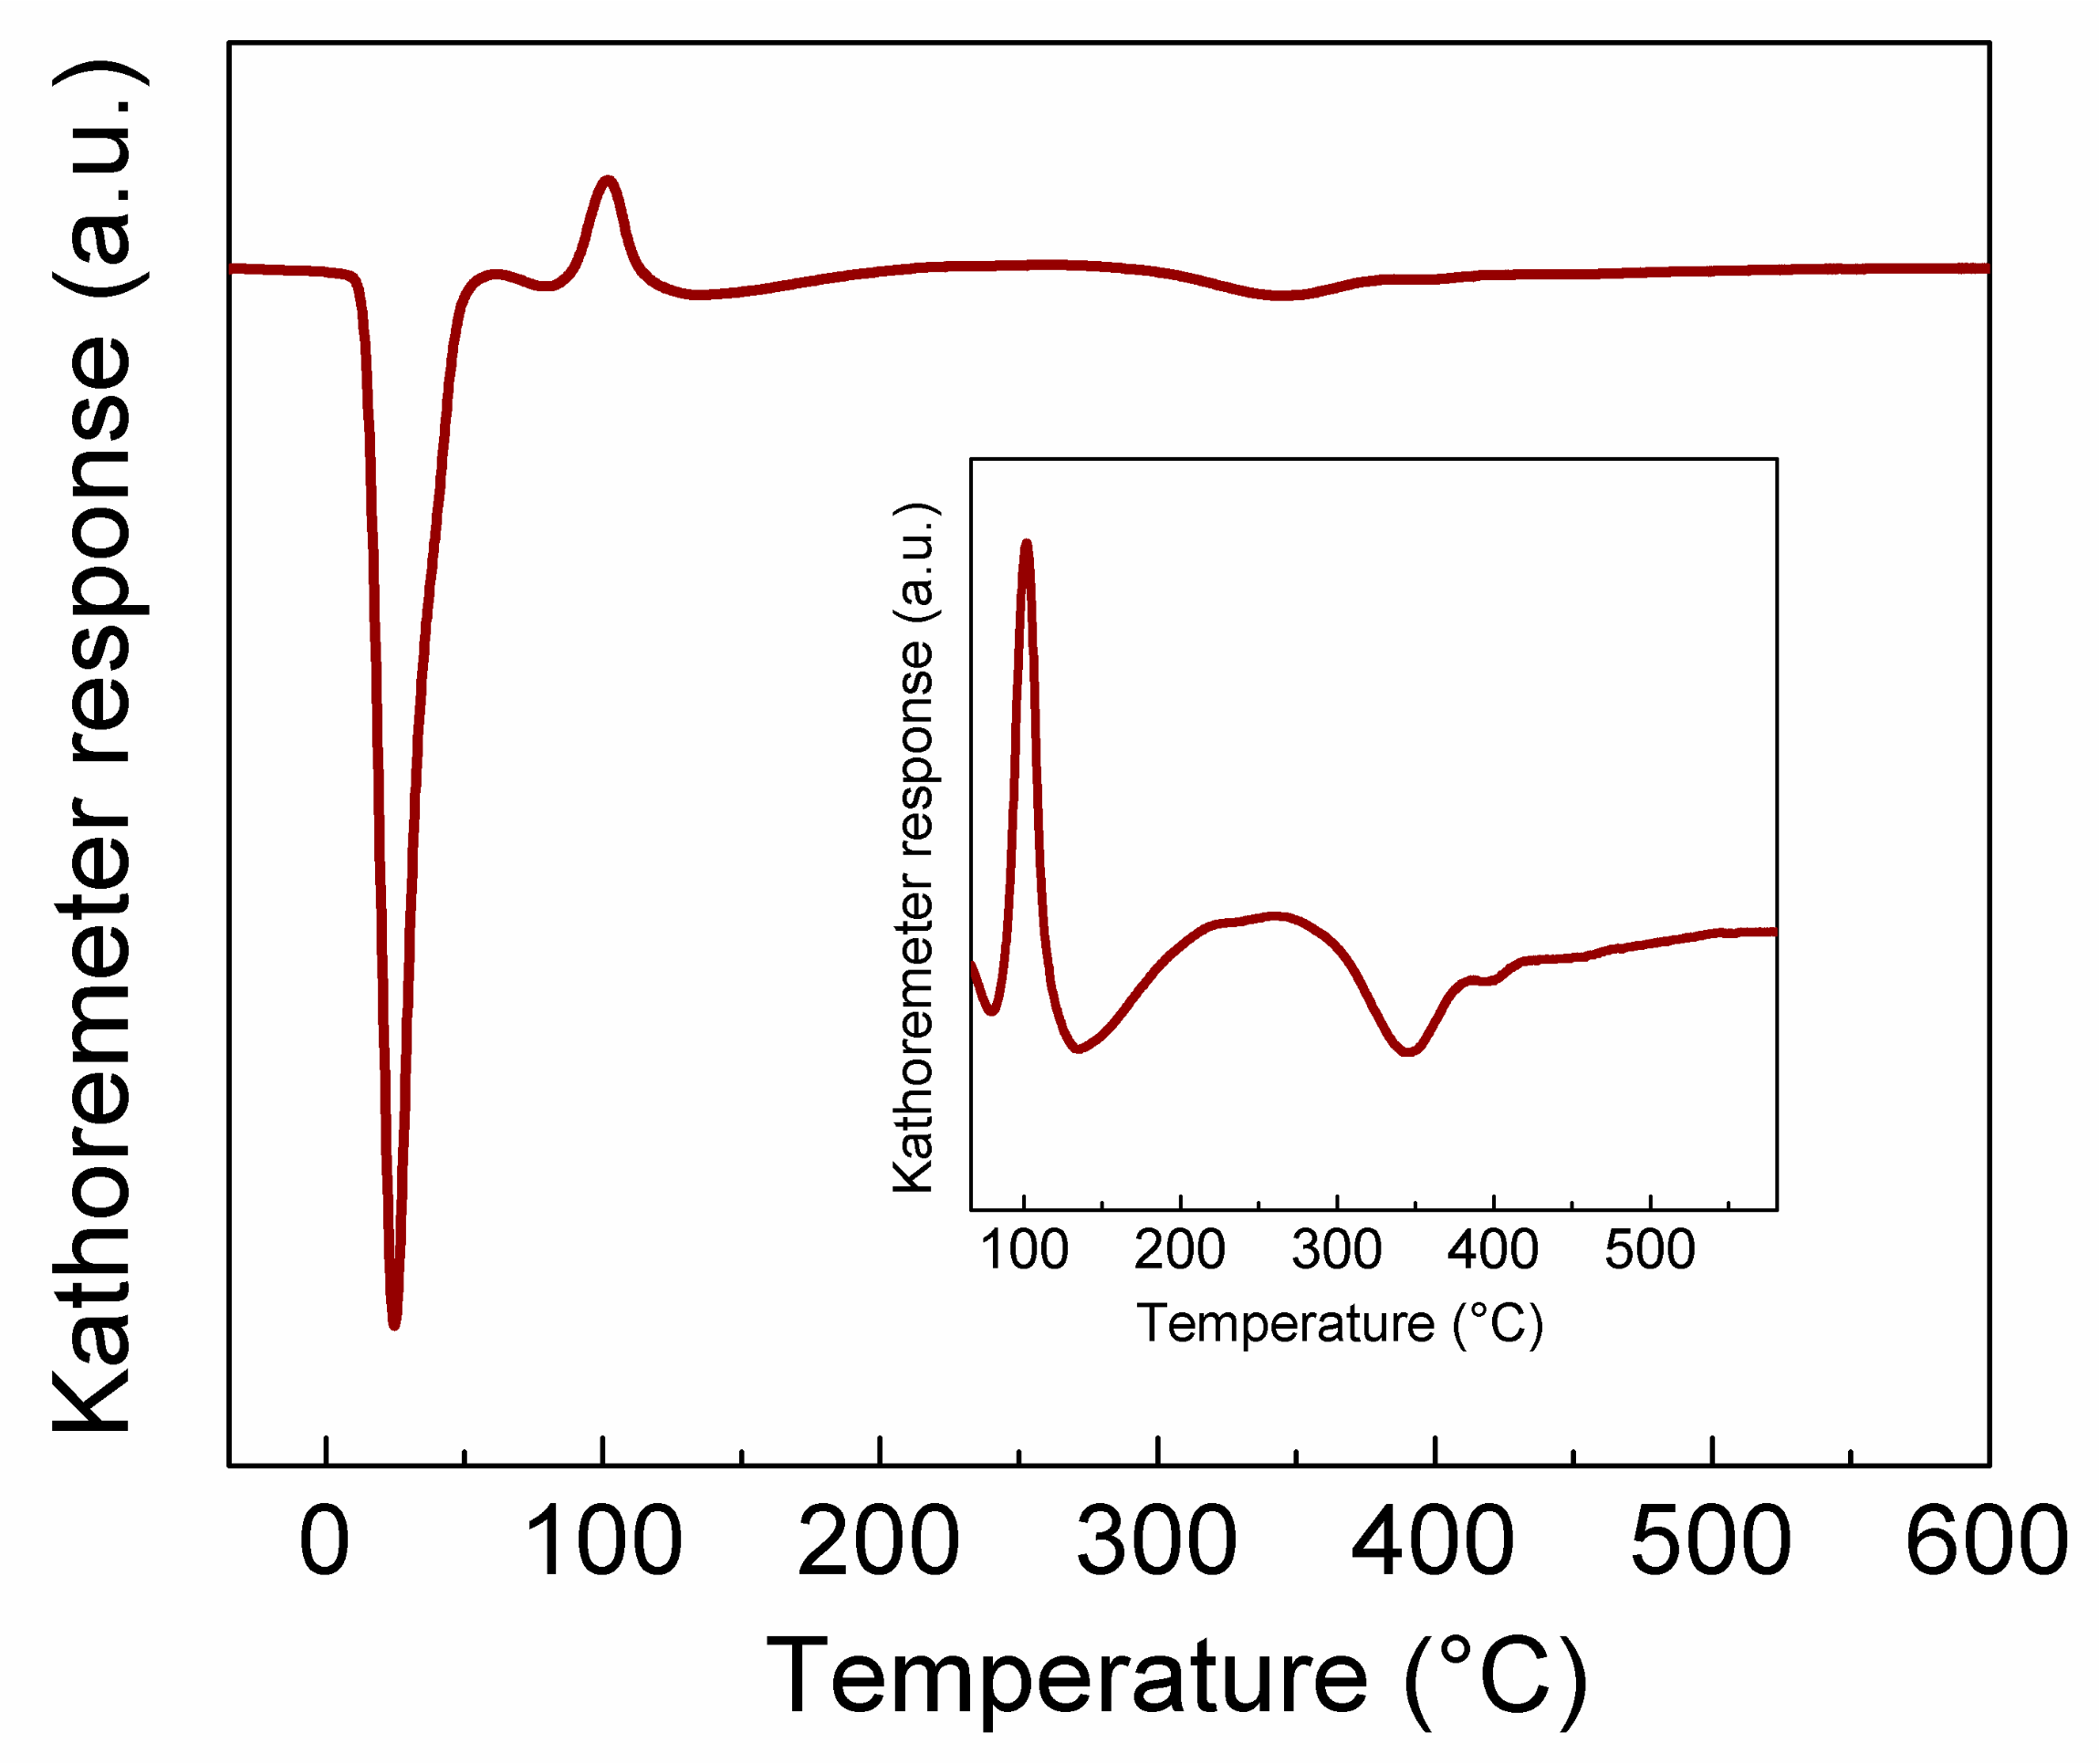
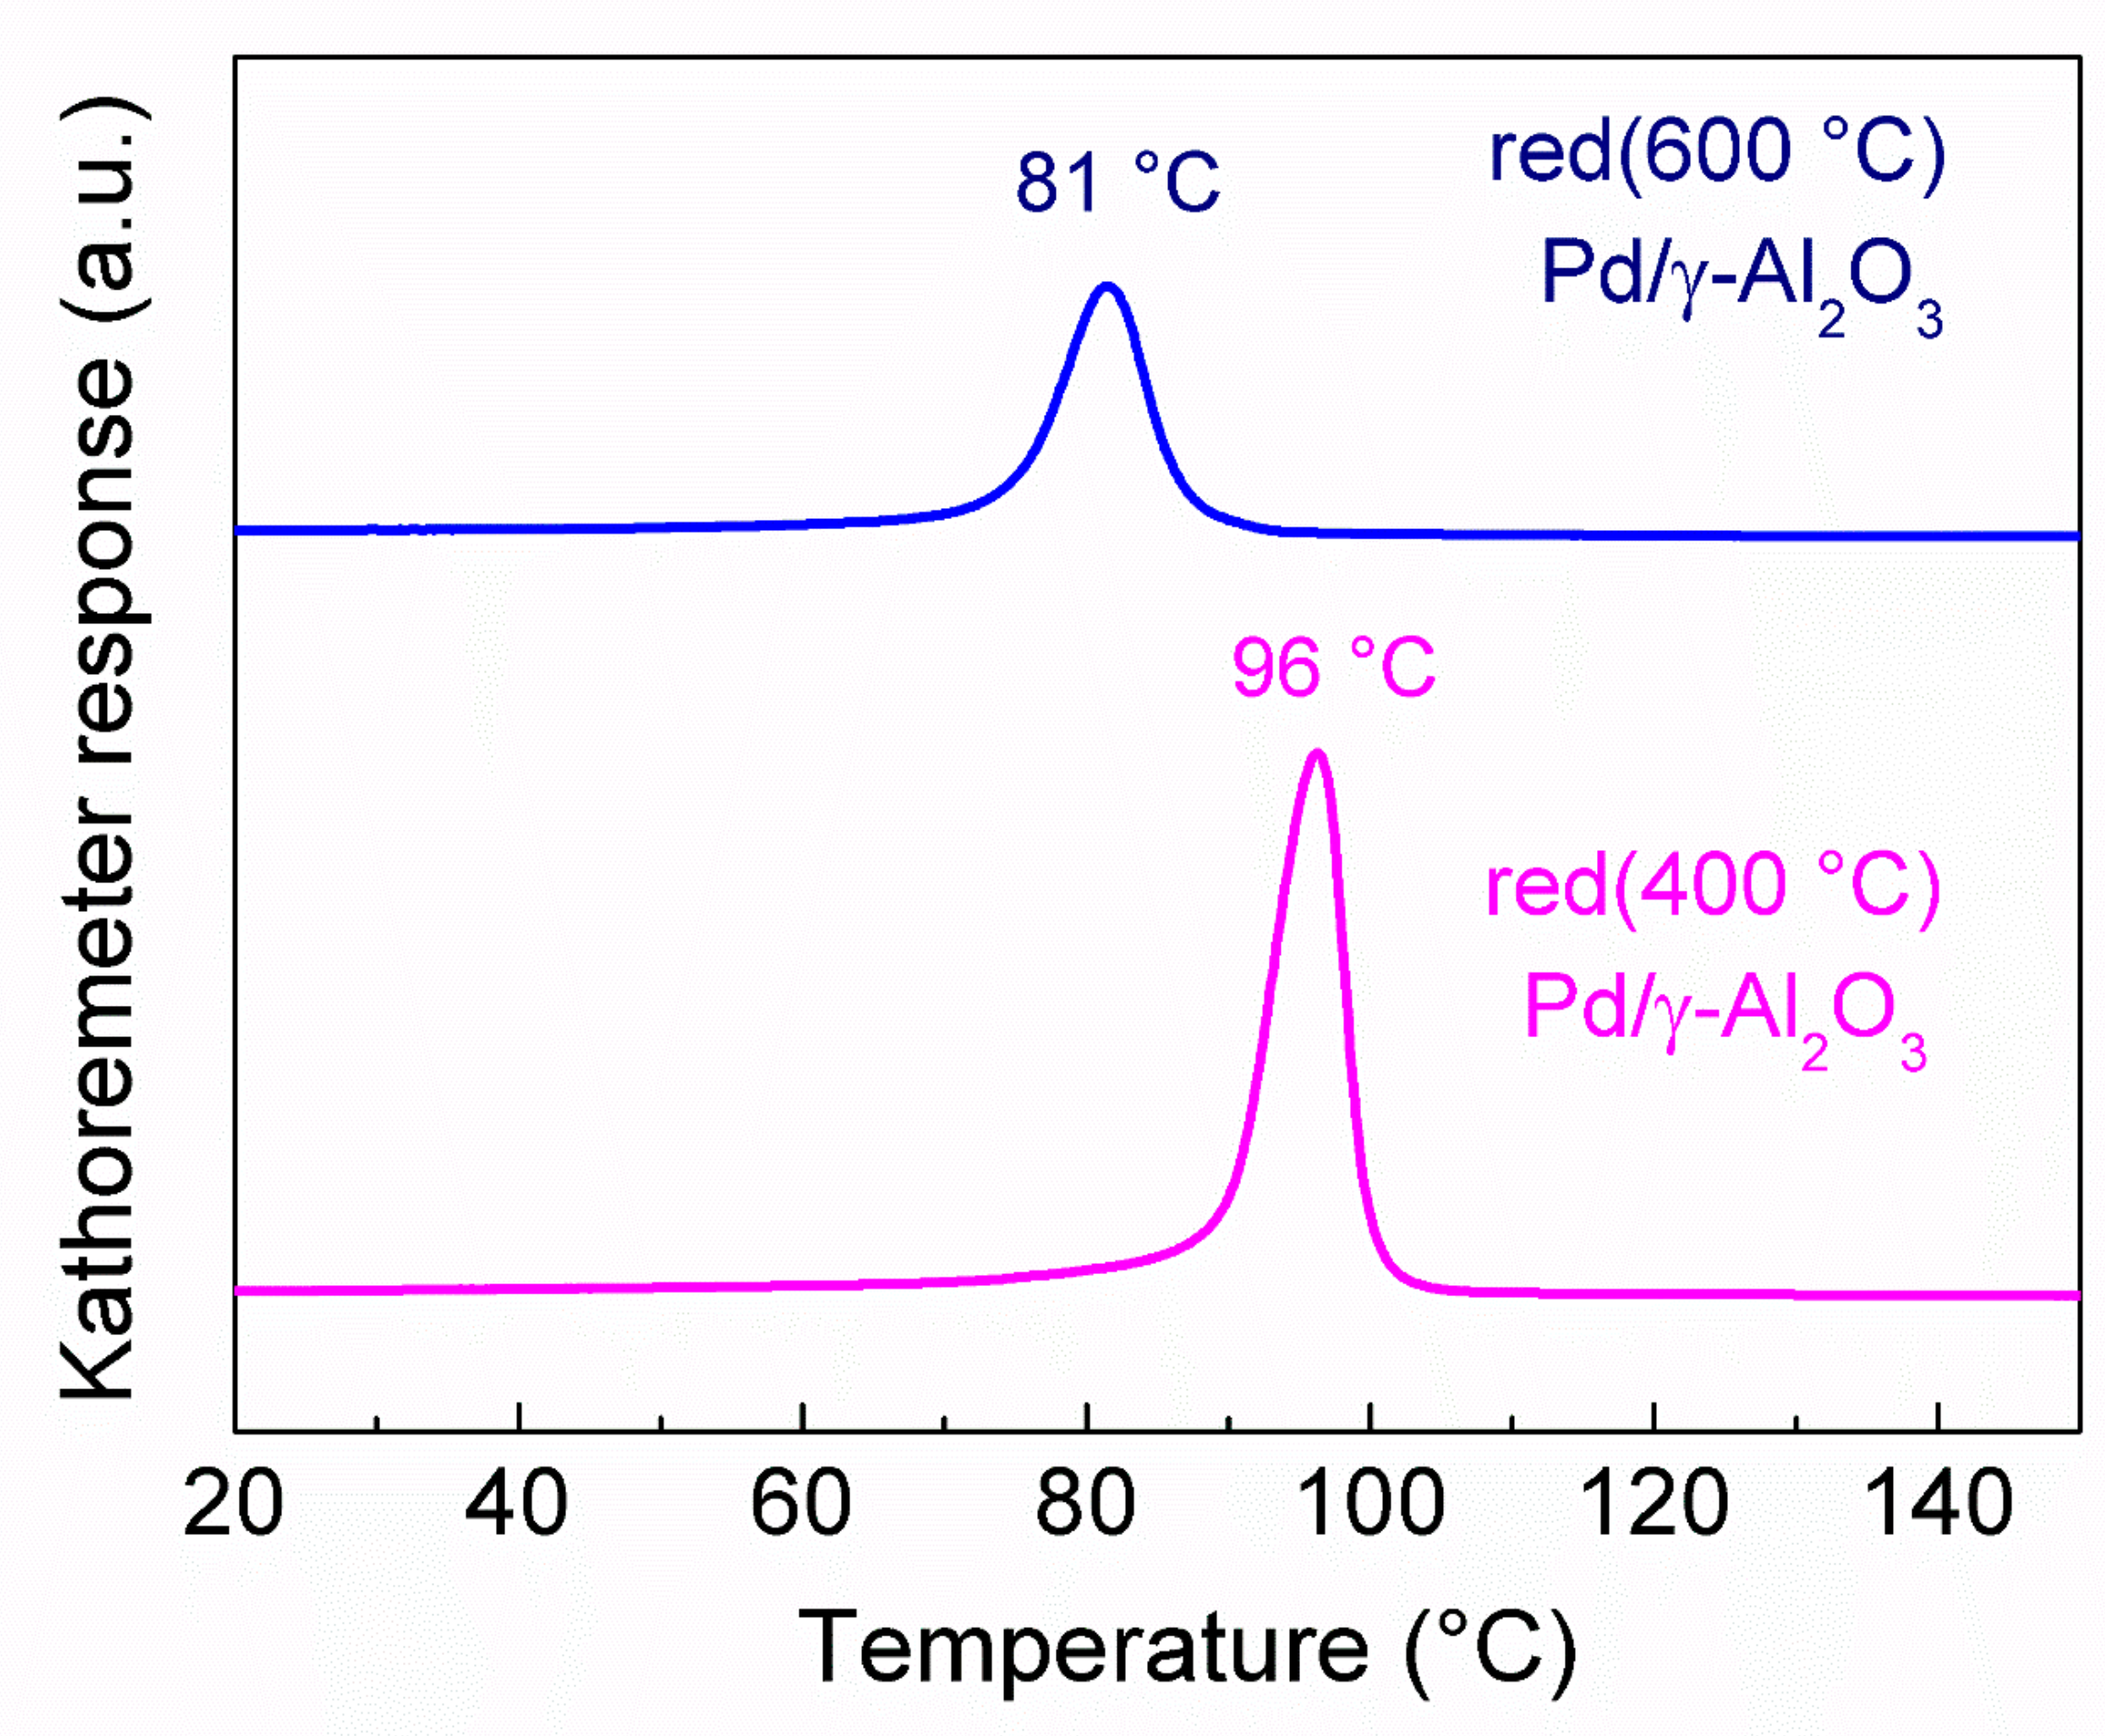
2.1.4. Temperature Programmed Studies Results

The temperature-programmed reduction of calcined 1 wt.% Pd/γ-Al2O3 catalyst carried out in the temperature range from −20 to 600 °C showed three main temperature-programmed reduction (TPR) peaks (Figure 4). In accordance with literature data [29,30], one huge peak evident at room temperature is ascribed to reduction of large PdO crystallites. with the second one, at ~130 °C, is associated with the reduction of small PdO particles, and the third one, a small double peak, at ~340 °C and above, with the reduction of small Pd species interacting with alumina (Figure 4 inset). Additionally, the two first TPR peaks were distorted by a peak associated with decomposition of palladium hydride phase (positive peak ~100 °C).
Based on TPR results, the low-temperature reduction conditions were estimated. Three hours of the reduction at 400 °C seems enough to transform Pd2+ to metallic form.
The results of temperature-programmed hydride decomposition (TPHD) are shown in Figure 5. Absence of multiple and shape-distorted TPHD peaks suggests a narrow particle size distribution. However, the TPHD maximum appearing at a higher temperature corresponds to the sample with lower particle size (red(400 °C)-Pd/γ-Al2O3), contrary to expectations [31]. Similarly, the temperature of palladium hydride formation was ~4 °C lower for red(600 °C)-Pd/γ-Al2O3 than for red(400 °C)-Pd/γ-Al2O3, 42.1 and 46.2 °C, respectively. Additionally, this shift in hydride decomposition peak is accompanied by a decrease in the amount of released hydrogen (Figure 5), manifested as the H/Pd = 0.37 for red(400 °C)-Pd/γ-Al2O3 and H/Pd = 0.32 for red(600 °C)-Pd/γ-Al2O3. Our TPHD results are in line with Baker et al. [32], who showed that high-temperature reduction of Pd/Al2O3 leads to a decrease in adsorbed hydrogen. This phenomenon could indicate that some amount of Al can interact with palladium in the Pd catalyst reduced at higher temperature. In accordance with earlier studies [17,23], high temperature reduction of alumina supported palladium catalyst leads to formation of Pd–Al intermetallic compounds [23], or even Pd–Al alloys as indicated by Radlik et al. [17]. On the other hand, there are two possible reasons for TPHD maximum shift to a lower temperature in red(600 °C)-Pd/γ-Al2O3. Presence of Pd–Al species could increase the enthalpy of hydride formation, thus, the heat of hydride formation decreases, as observed for Pd–Ru materials. On the other hand, higher Pd nanoparticles could be sensitive for Pd–Al alloy formation that would block the Pd β-hydride formation, like it was observed for Pd–Au alloys [33,34]. Consequently, only smaller Pd particles would be sensitive to decomposition of the hydride phase, and hence a lower temperature of TPHD maximum would be observed (Figure 5).

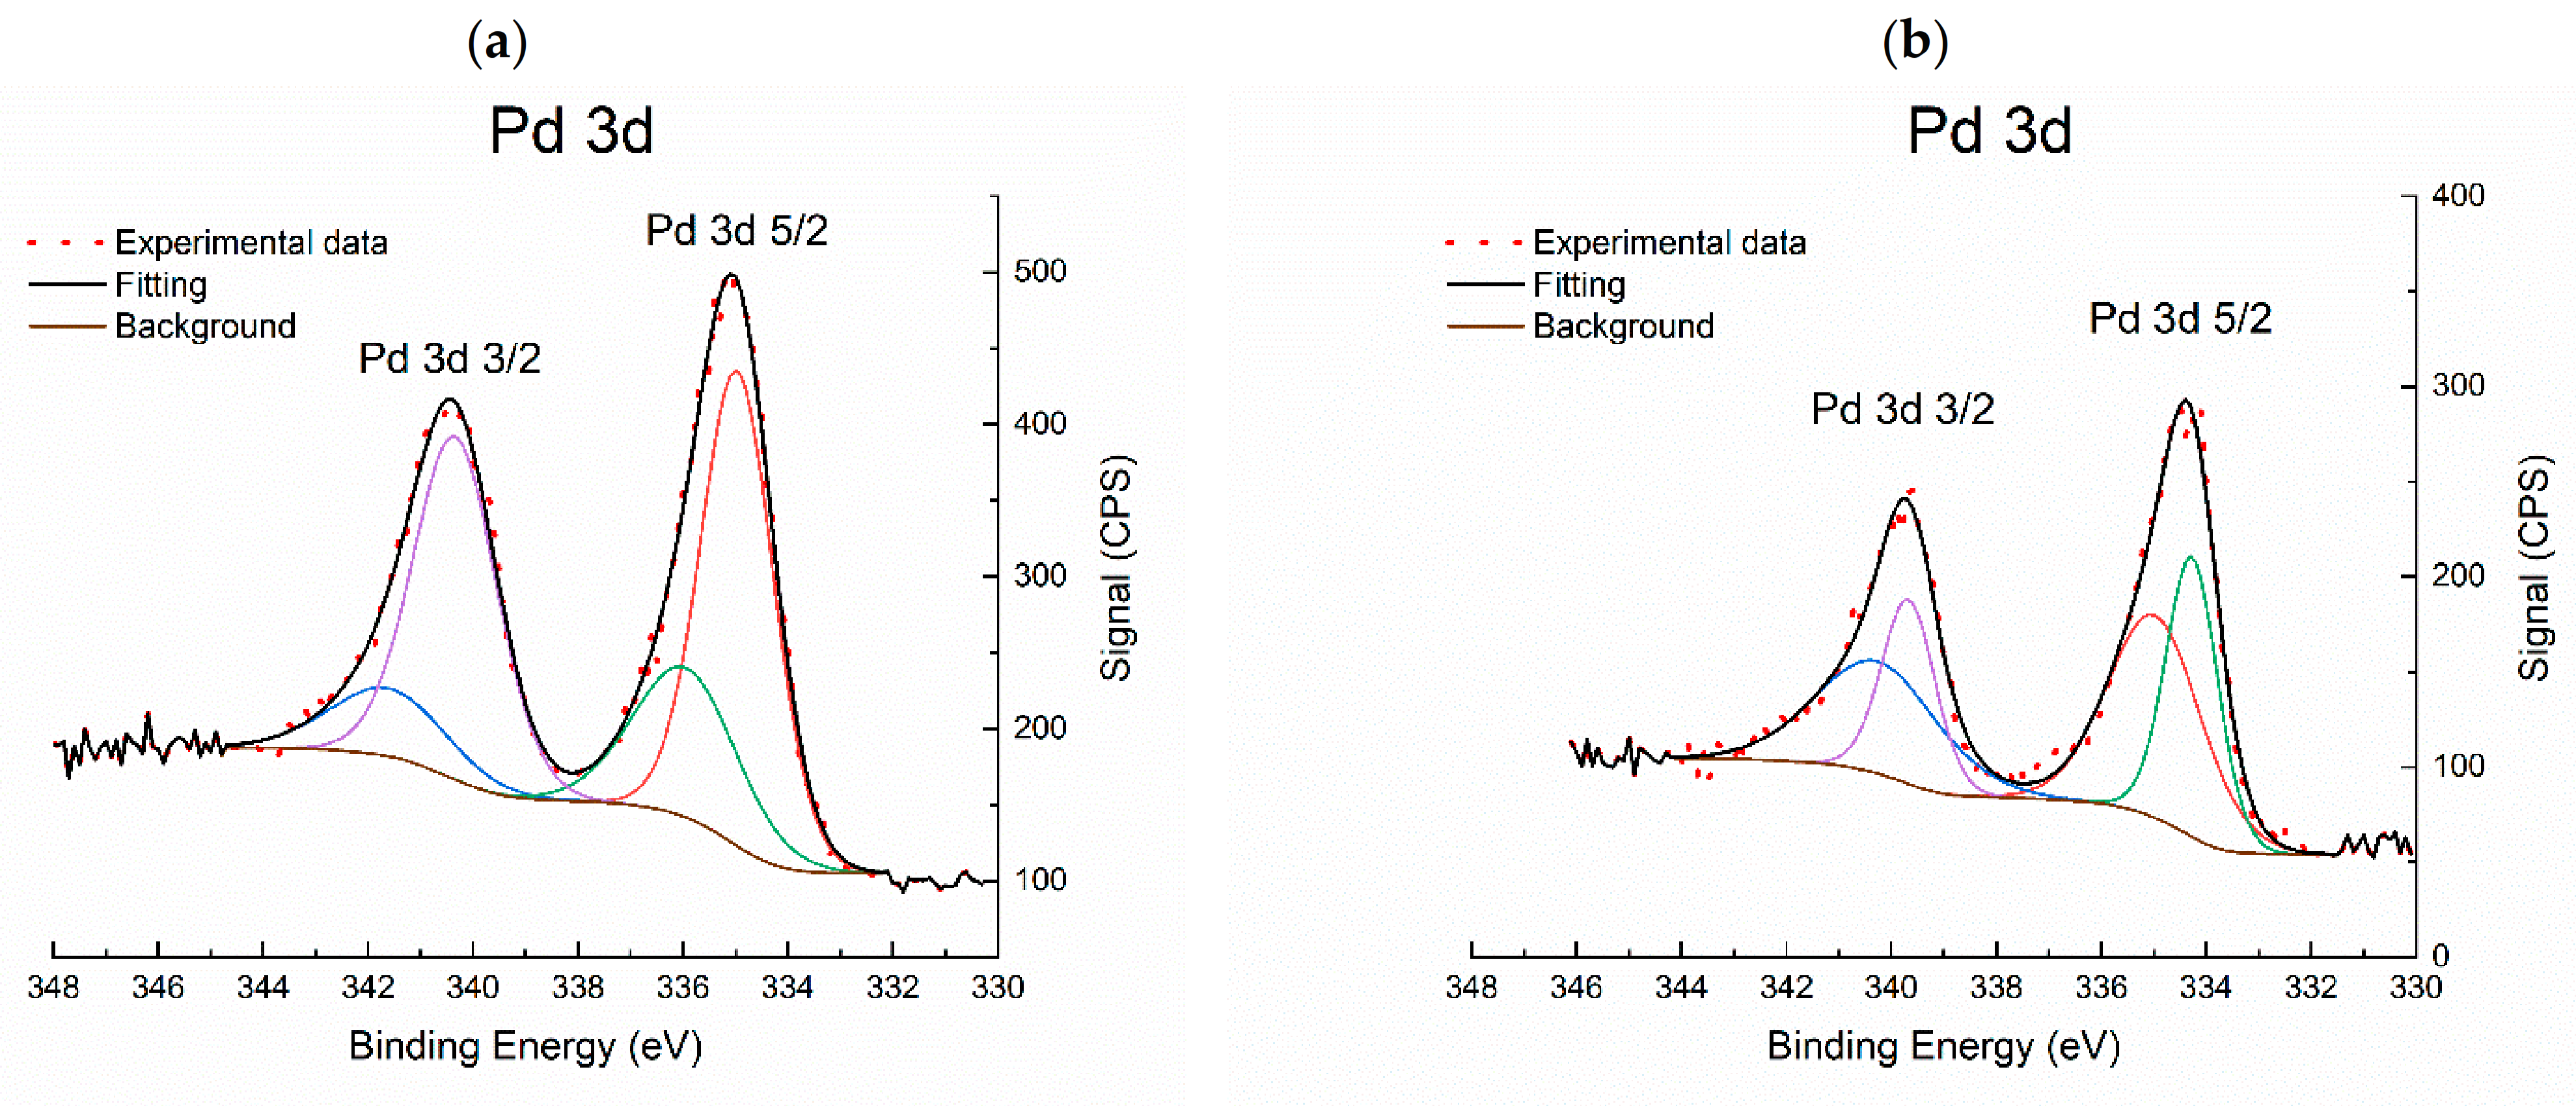
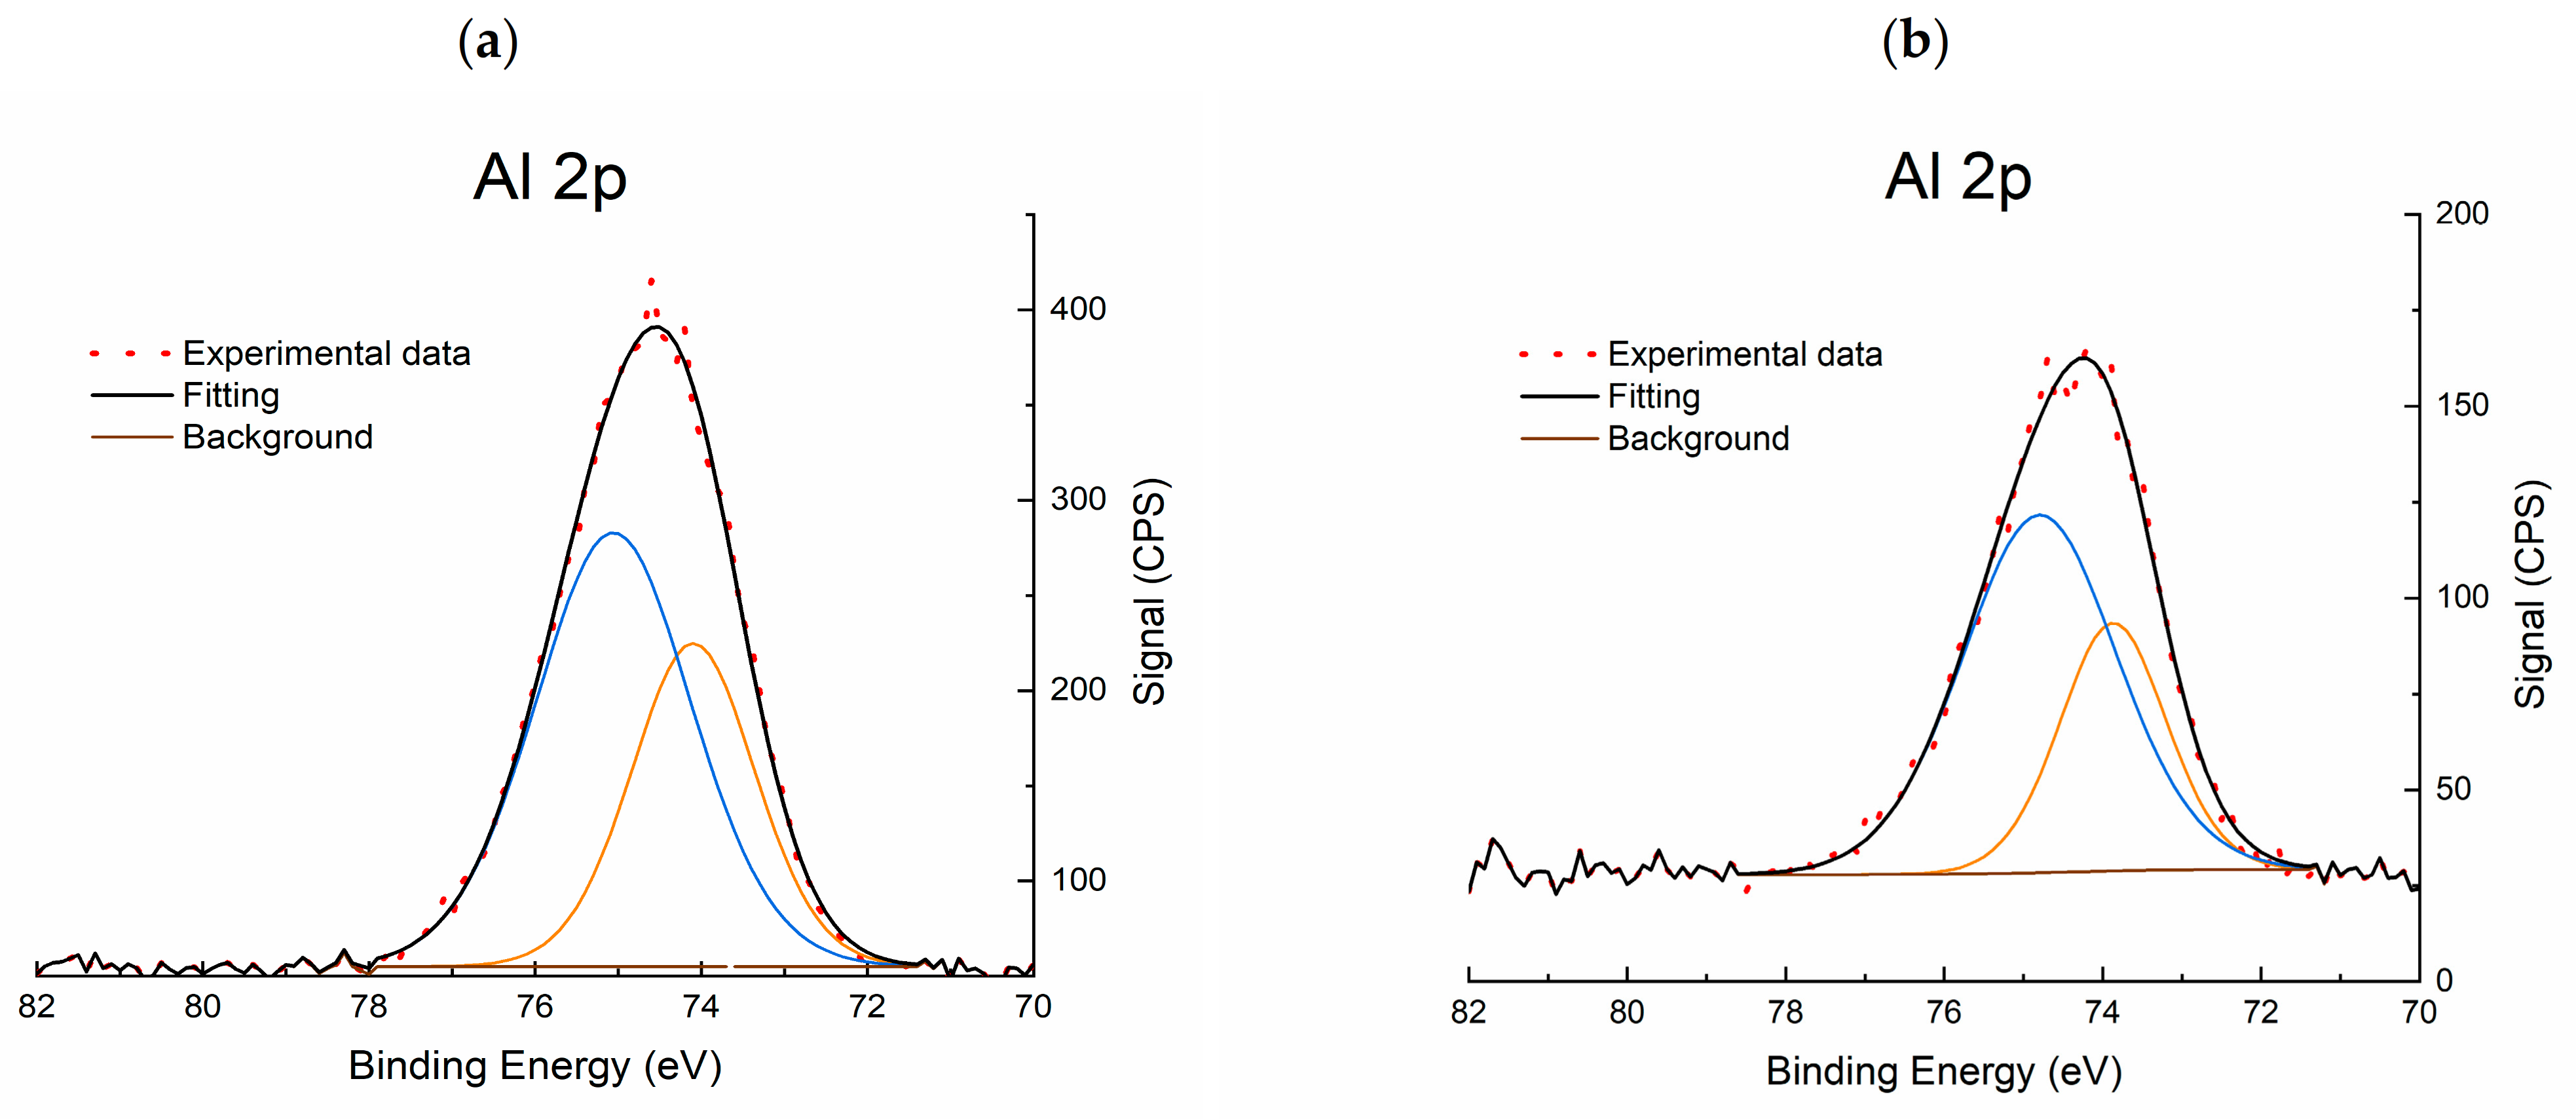
2.1.5. X-ray Photoelectron Spectroscopy (XPS)

Identification of Pd and Al metals’ chemical state was based on Pd 3d, Al 2p and valence band (not shown here) photoelectrons (bearing in mind that Al 2p photoelectrons’ analysis depth is larger than that of Pd 3d photoelectrons)—Figure 6 and Figure 7. And the chemical state of oxygen and carbon was based on O 1s + Pd 3p3/2 and C 1s photoelectron signals (Figures S6–S9). The investigation and the interpretation of the XPS results were based in accordance with the literature data and XPS electronic databases [35,36,37].
Photoelectron signals Pd 3p3/2 and Al 2s were also included in the quantitative surface analysis for both catalysts. The surface of red(400 °C)-Pd/γ-Al2O3 contains Pd-5.7, Al-61.7, O-16.6 and C-16.0, and the surface of red(600 °C)-Pd/γ-Al2O3 contains Pd-4.5, Al-42.4, O-30.1 and C-23.0 estimated in at. %. It was found that high-temperature reduction caused a significant (almost 20% at.) loss of aluminum on the surface with a simultaneous increase (over 13% at.) of oxygen concentration. Deconvolution of the Pd 3d photoelectron signal indicates the presence of two palladium states: Pd (0) and Pd (2+) in both catalysts. However, the characteristic changes of metal–metal (MMI) and/or metal–support (MSI) (Pd–Al and/or Pd–AlOx) interactions were not found for red(400 °C)-Pd/γ-Al2O3 (Figure 6a). On the other hand, for red 600 °C)-Pd/γ-Al2O3, a new state with lower characteristic binding energy was detected for the Pd 3d5/2-Pd 3d3/2 photoelectron doublet. The binding energy was 0.6–0.7 eV lower than that of the metal Pd–Pd bond energy and was related to the strong electron interaction of palladium with the support (SMSI): Pd–AlOx (Figure 6b and Figure 7). The second Pd 3d5/2-Pd 3d3/2 photoelectron doublet with a characteristic binding energy of 335–340.3 eV, identified in the case of highly reduced catalyst, is the result of the presence of metallic Pd on the surface.
In addition, XPS studies were performed for both catalysts directly after in-situ reduction. It allowed us to observe the transformation of the surface during in situ H2 reduction processes and to compare the chemical nature and environment of palladium, and aluminum in the samples after being air exposed (ex-situ red) and after in-situ H2-reduction. Comparison of the surface composition for the catalysts after ex-situ and in-situ activation showed significant differences only for red(600 °C)-Pd/γ-Al2O3 (Table 3). In-situ H2-reduction showed no characteristic changes of MMI and/or MSI in the obtained XPS spectra. Moreover, quantitative analysis showed (partially oxidised) an Al-enriched surface with a simultaneous decrease in the content of oxygen, as compared to the ex-situ reduced red(600 °C)-Pd/γ-Al2O3 sample and could suggest partial reversibility of Pd–Al species formation, as it was reported earlier [23]. As a consequence of the observed surface composition change, the palladium’s hydrogenolytic capacity may be reduced. The slight change of XPS surface composition for red(400 °C)-Pd/γ-Al2O3 by exposure to air could confirm the negligible influence of air on surface composition, opposite to red(600 °C)-Pd/γ-Al2O3.

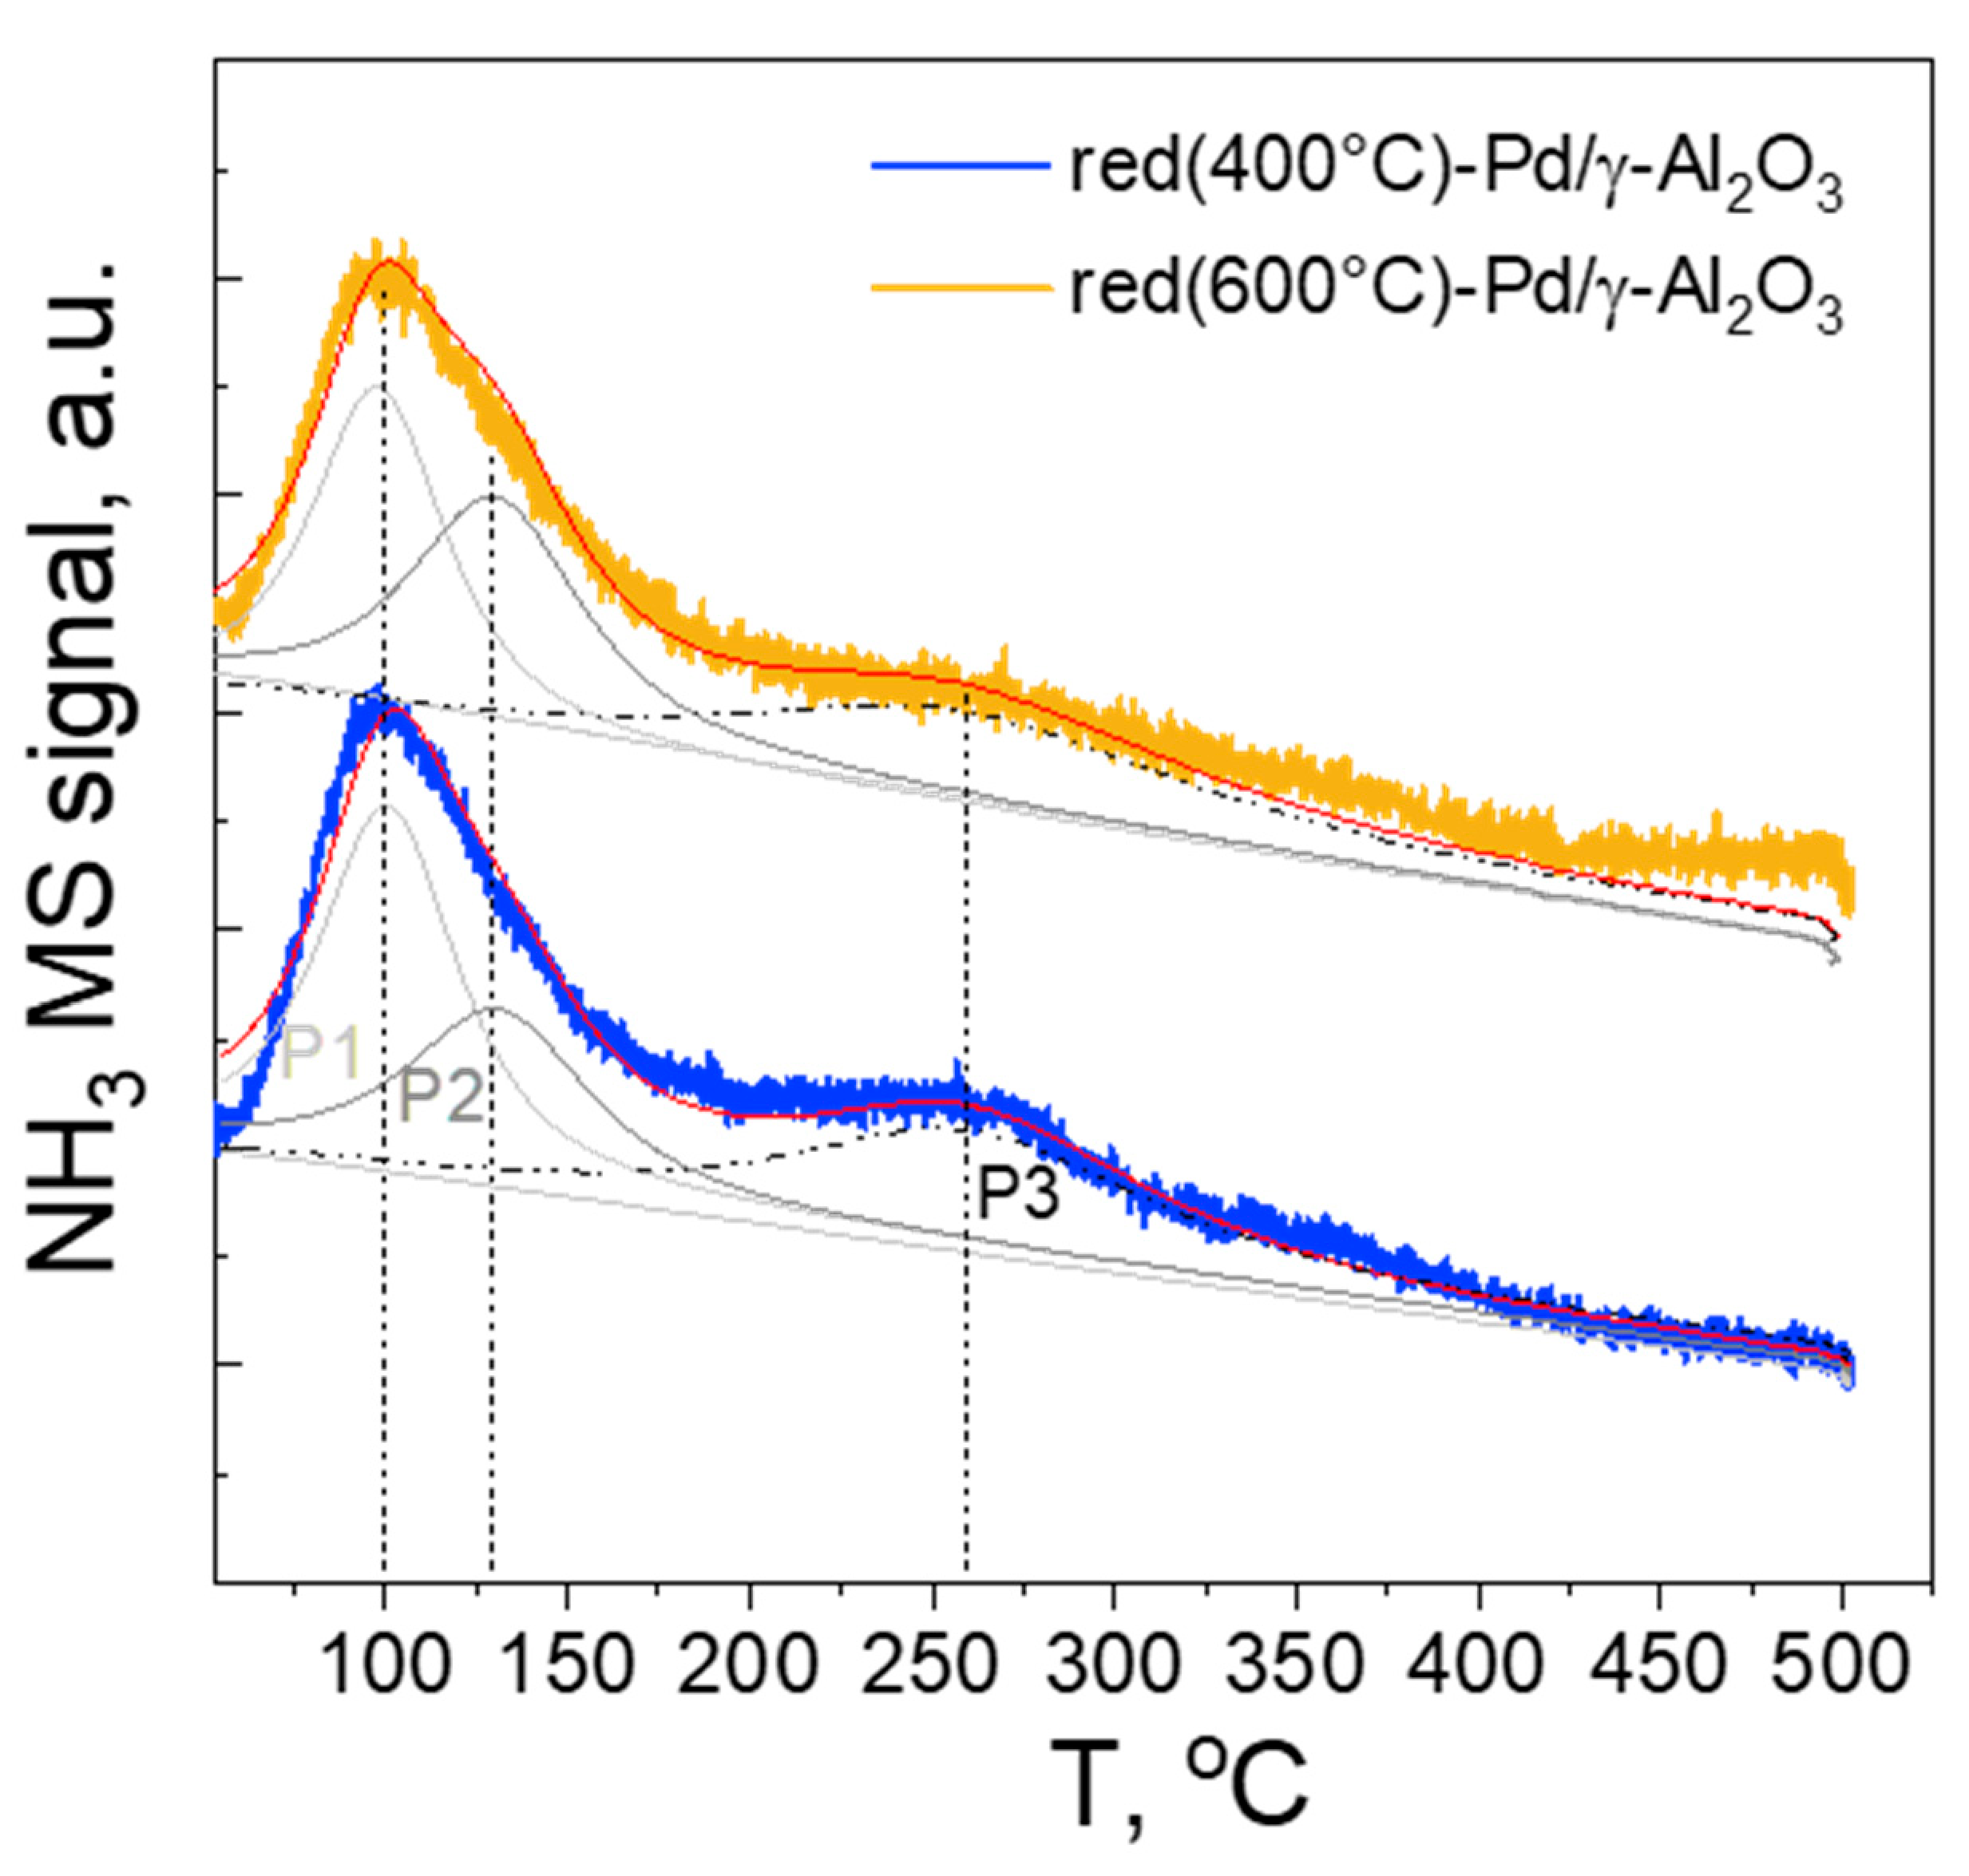
2.1.6. NH3 Temperature-Programmed Desorption (NH3-TPD)

The NH3-TPD profiles (Figure 8) of the samples show two desorption maxima in accordance with previous studies [38,39,40].
The NH3 desorption peaks can be classified into three types of acid sites, characterised by different acidic strength, namely: (i) weak—with NH3 desorption maxima at 50–200 °C, (ii) medium—with NH3 desorption maxima at 200–400 °C and (iii) strong—with NH3 desorption maxima above 400 °C. The performed deconvolution suggests the presence of three types of species with different acidity (P1, P2 and P3 Figure 8). They can be assigned to weak acid sites, characterised by desorption maxima P1 assigned to physisorbed NH3 and/or NH3 adsorbed on weak Lewis acid sites. P2 and P3 suggest the presence of both medium and strong acid sites, which can be associated with NH3 absorbed on strong Lewis acid sites and Brønsted acid sites. For both red(400 °C)-Pd/γ-Al2O3 and C-red(600 °C)-Pd/γ-Al2O3 samples, the desorption maxima are not shifted, however, the reduction treatment of catalysts influenced the site population with a given strength. For the red(400 °C)-Pd/γ-Al2O3, the P1:P2:P3 ratio is 1:0.62:0.53, while for red(600 °C)-Pd/γ-Al2O3 1:0.85:0.67, suggesting an increase in the number of sites with medium/strong acid strength with increase of temperature treatment. Moreover, for red(600 °C)-Pd/γ-Al2O3 catalyst, the total amount of acidic sites decreases by ca. 11% along with high reduction temperature, which is consistent with the previous reports [41]. However, the differences between the amounts and strength of acid sites in both catalysts seem to be too small to be the cause of differences in their catalytic performance.

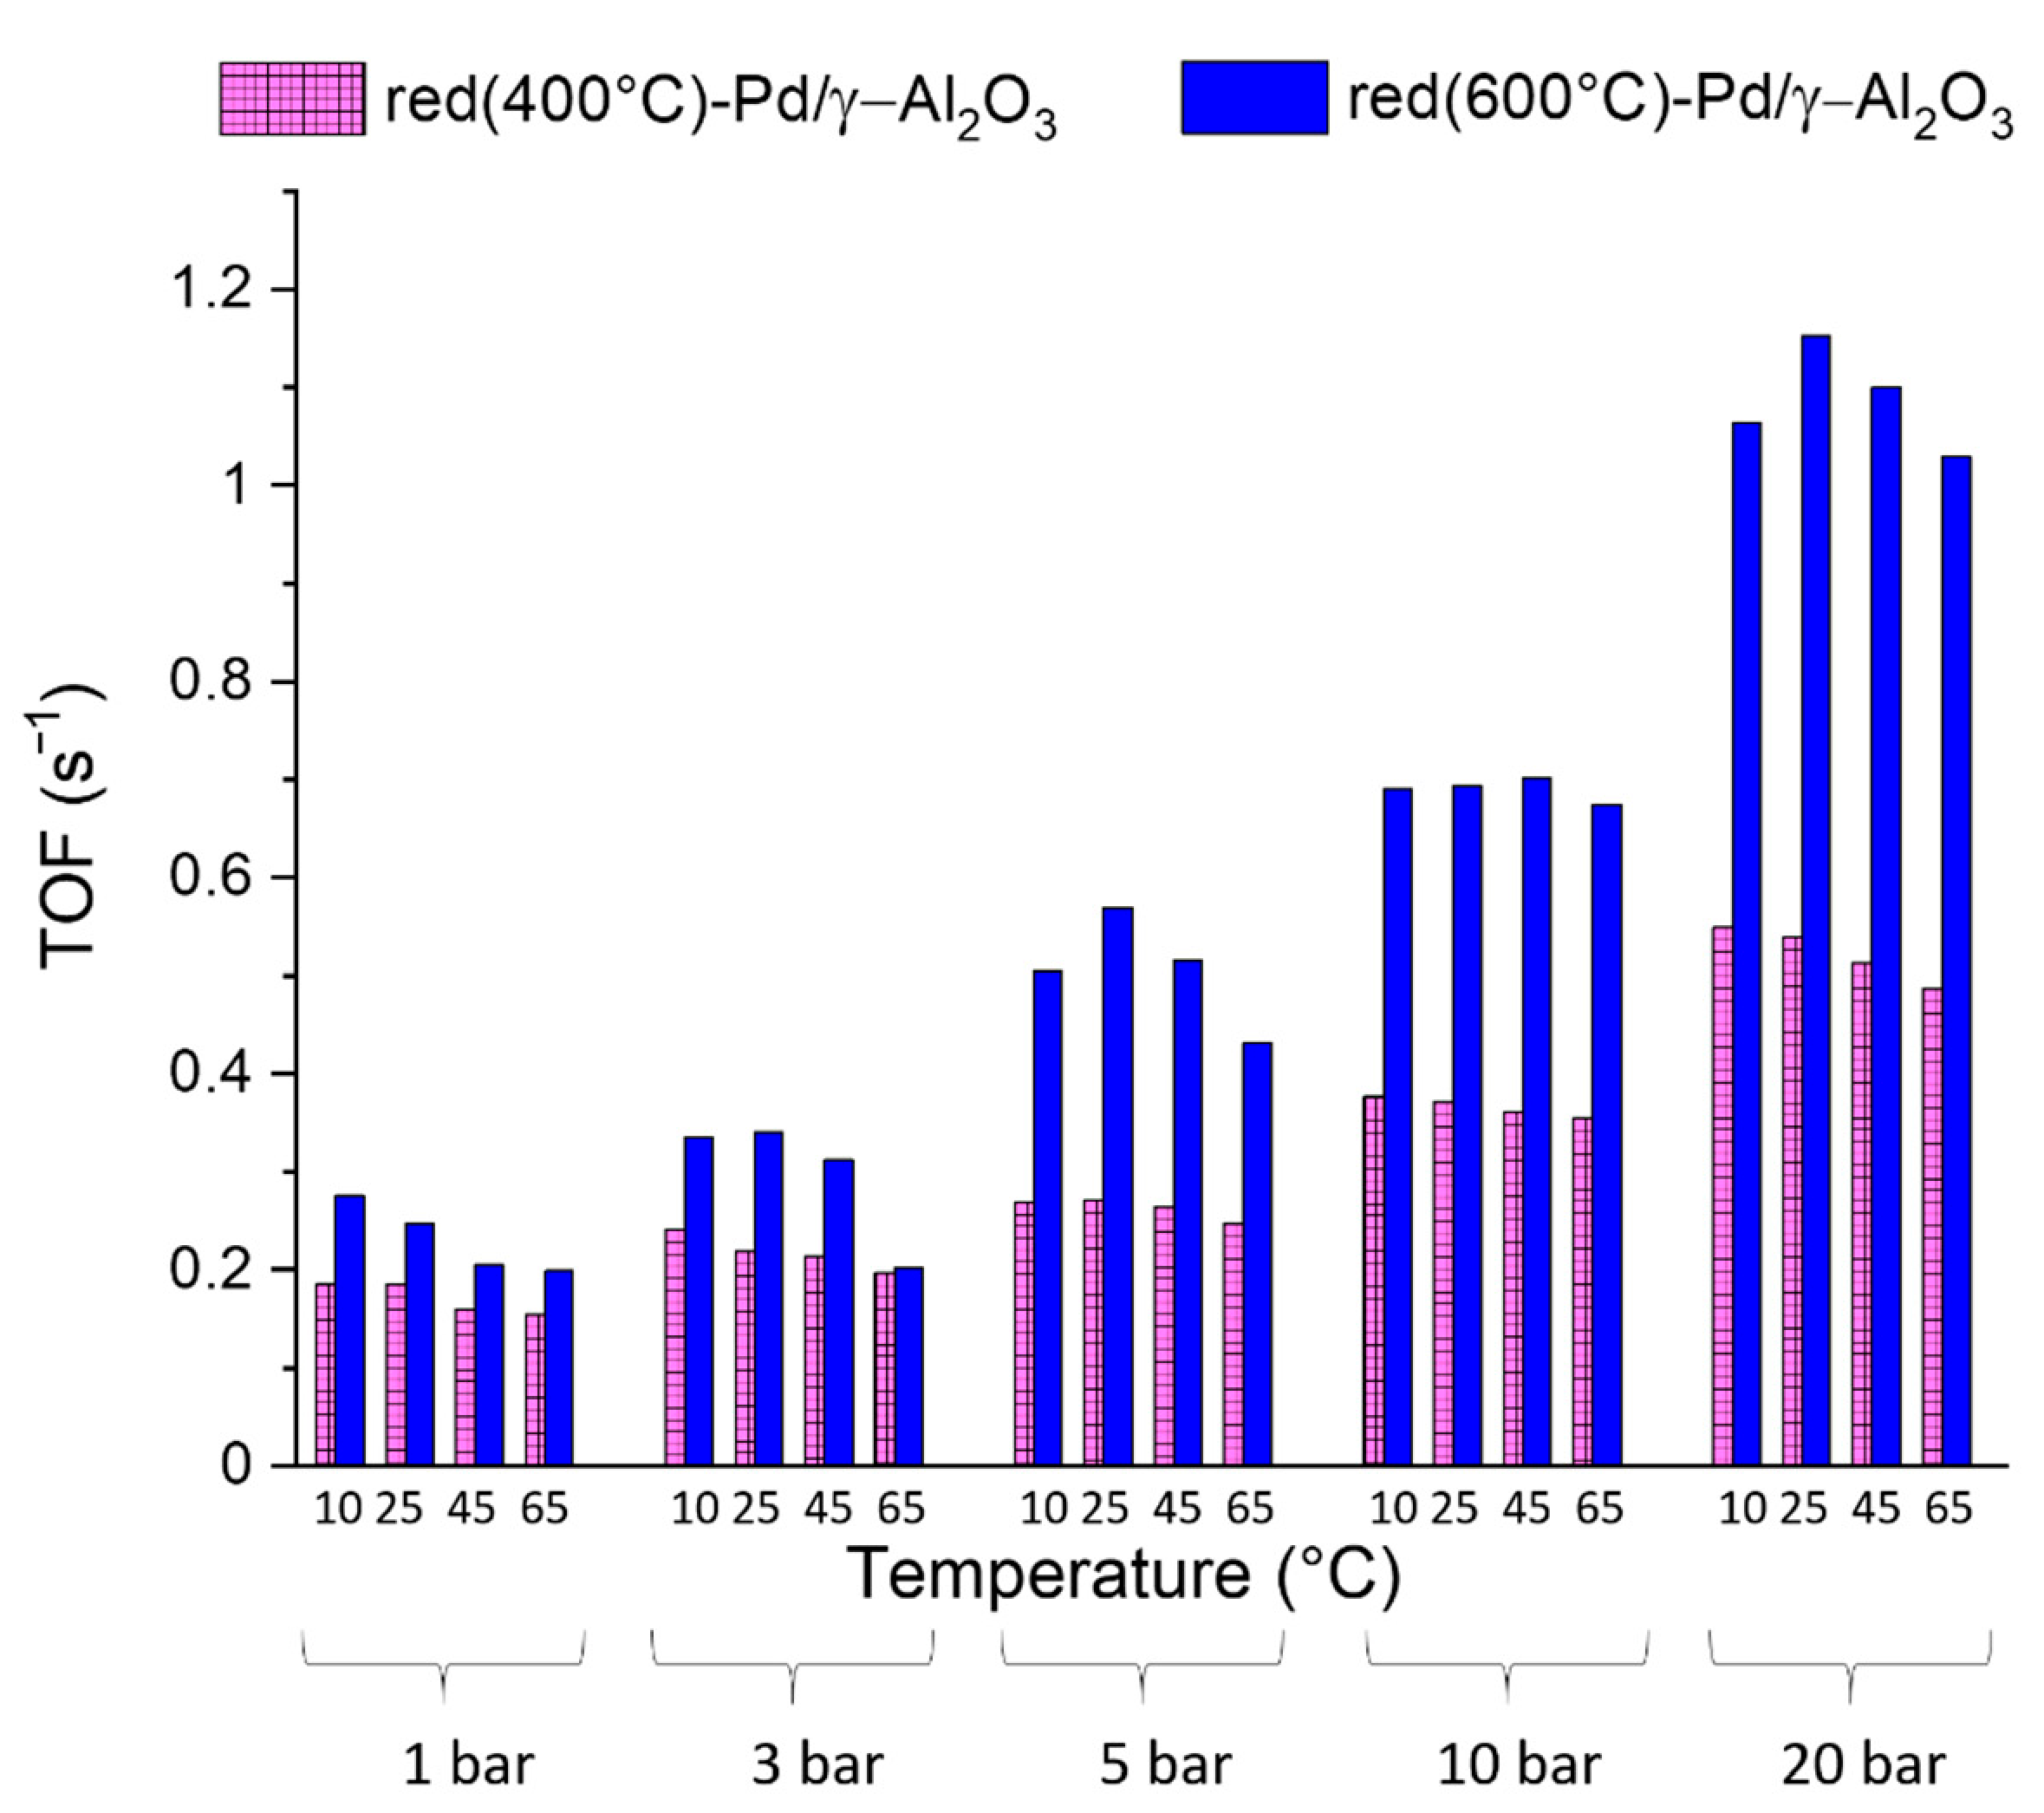
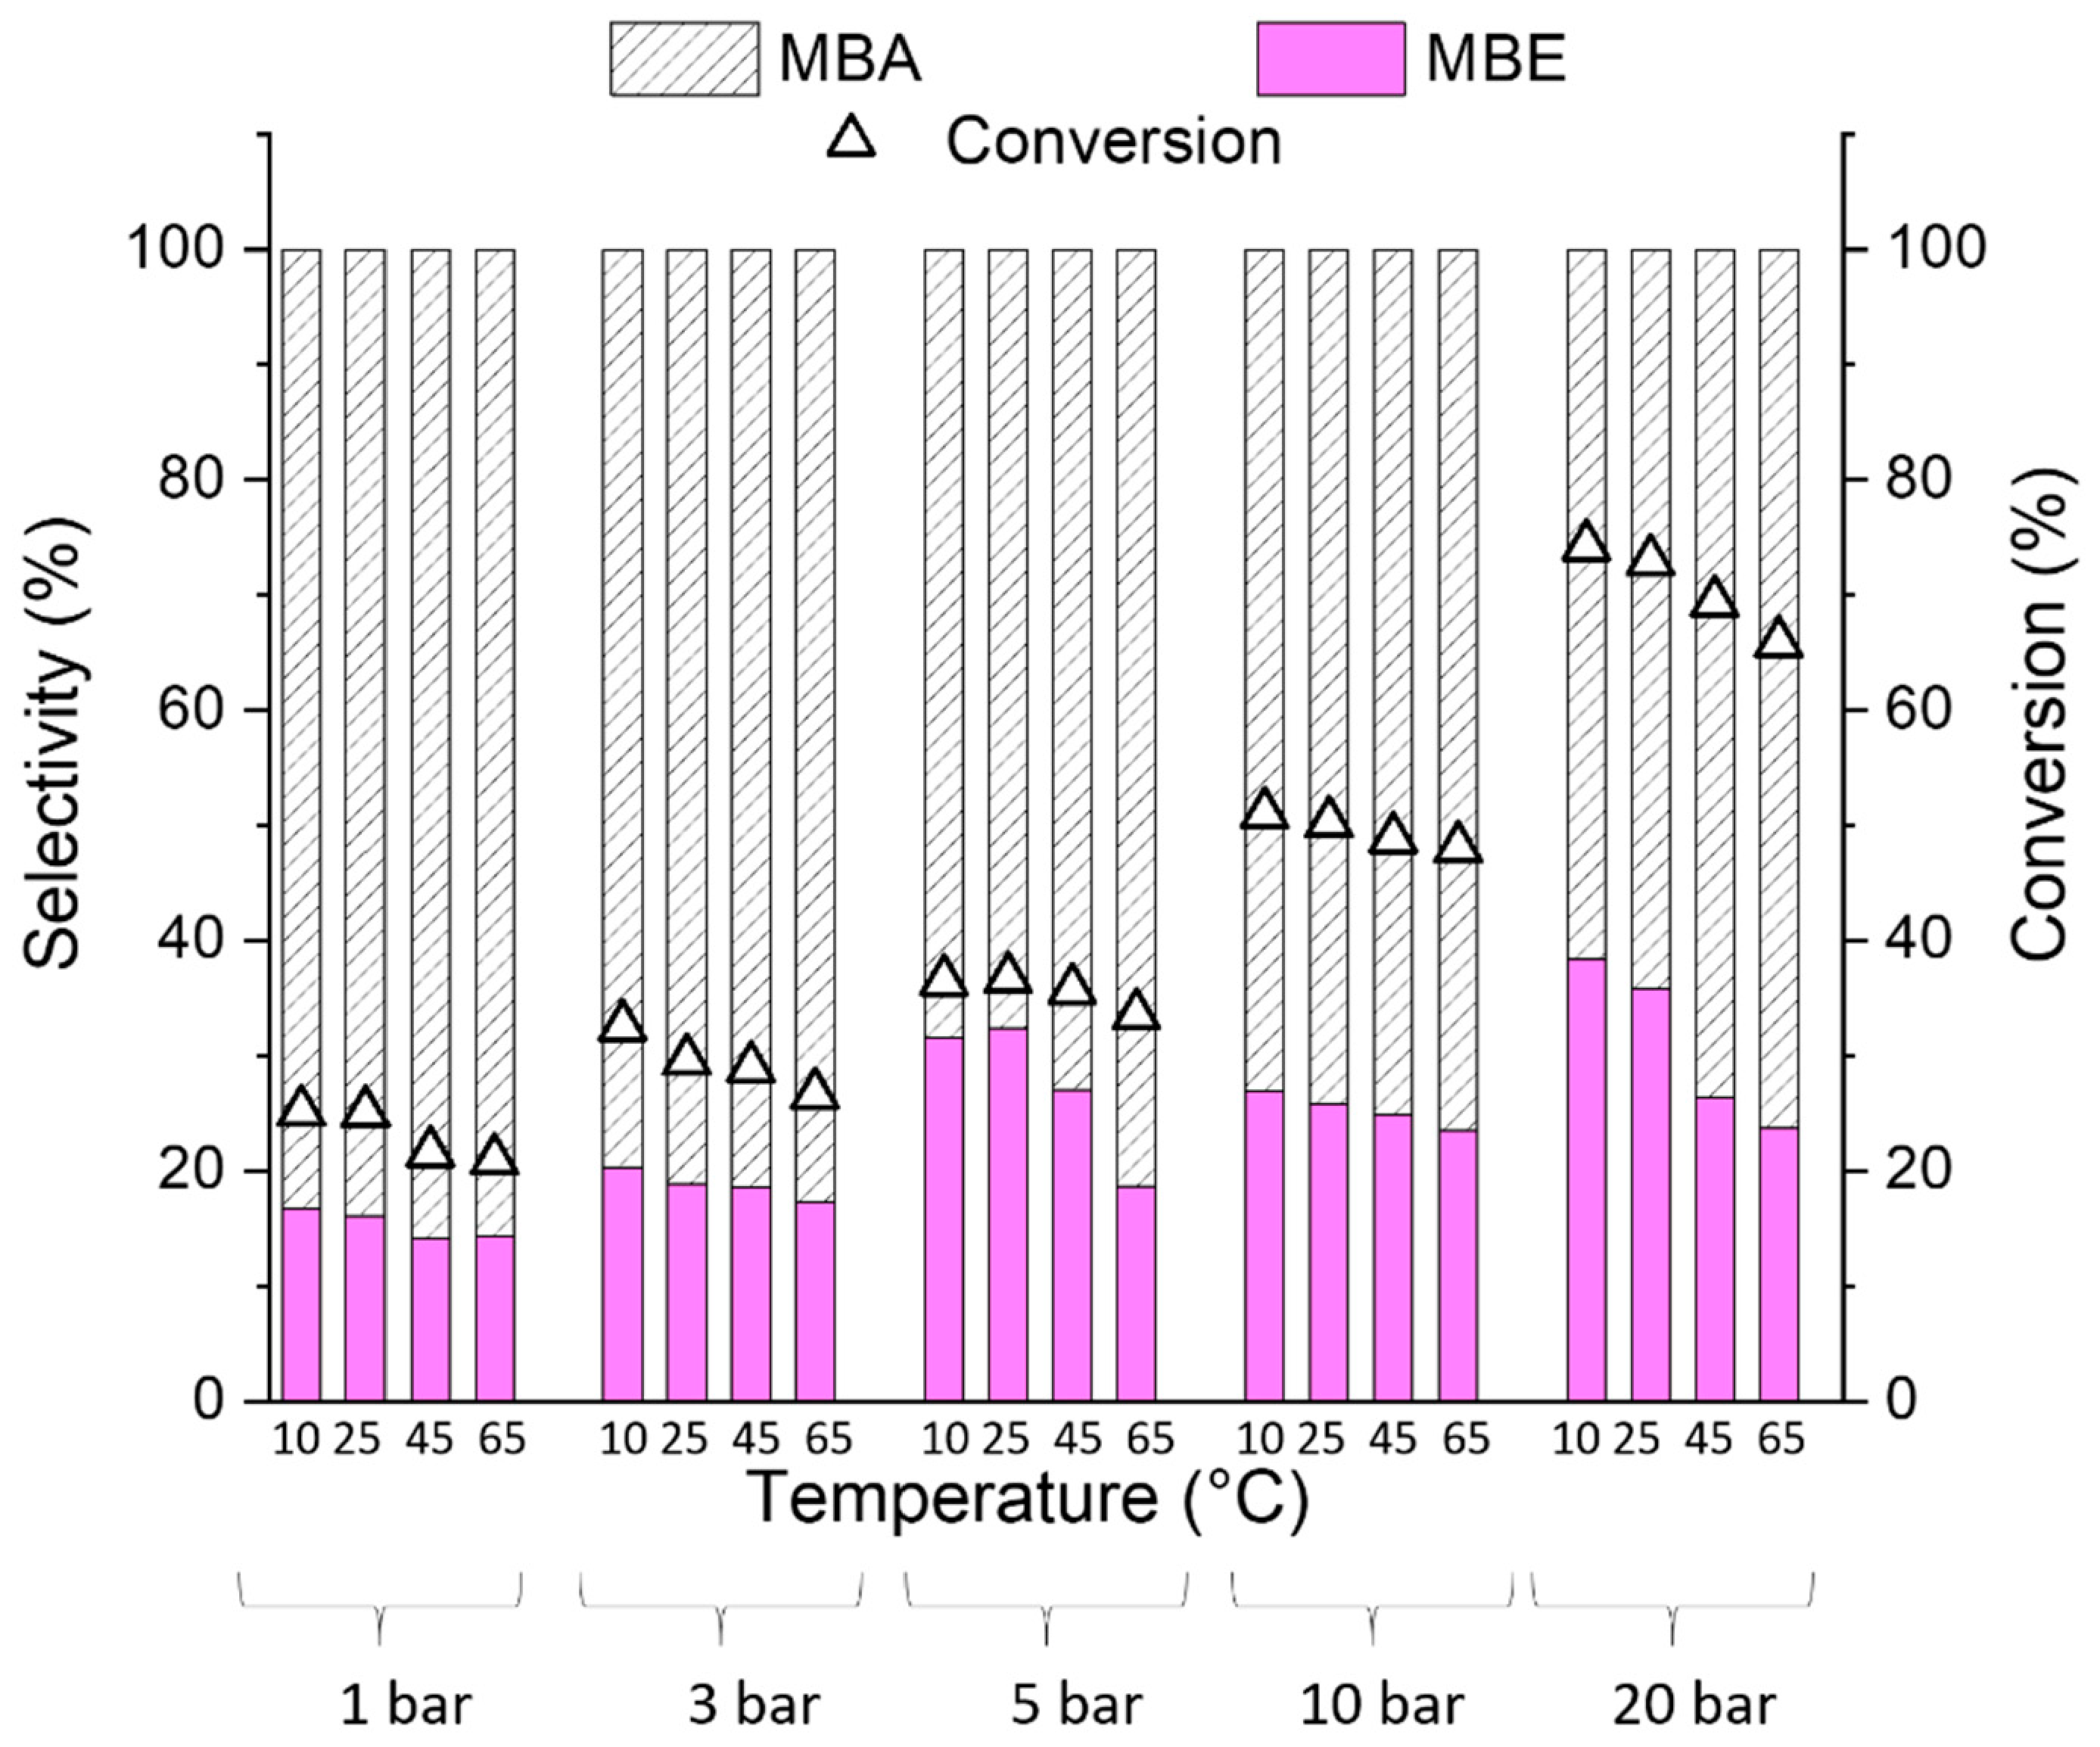
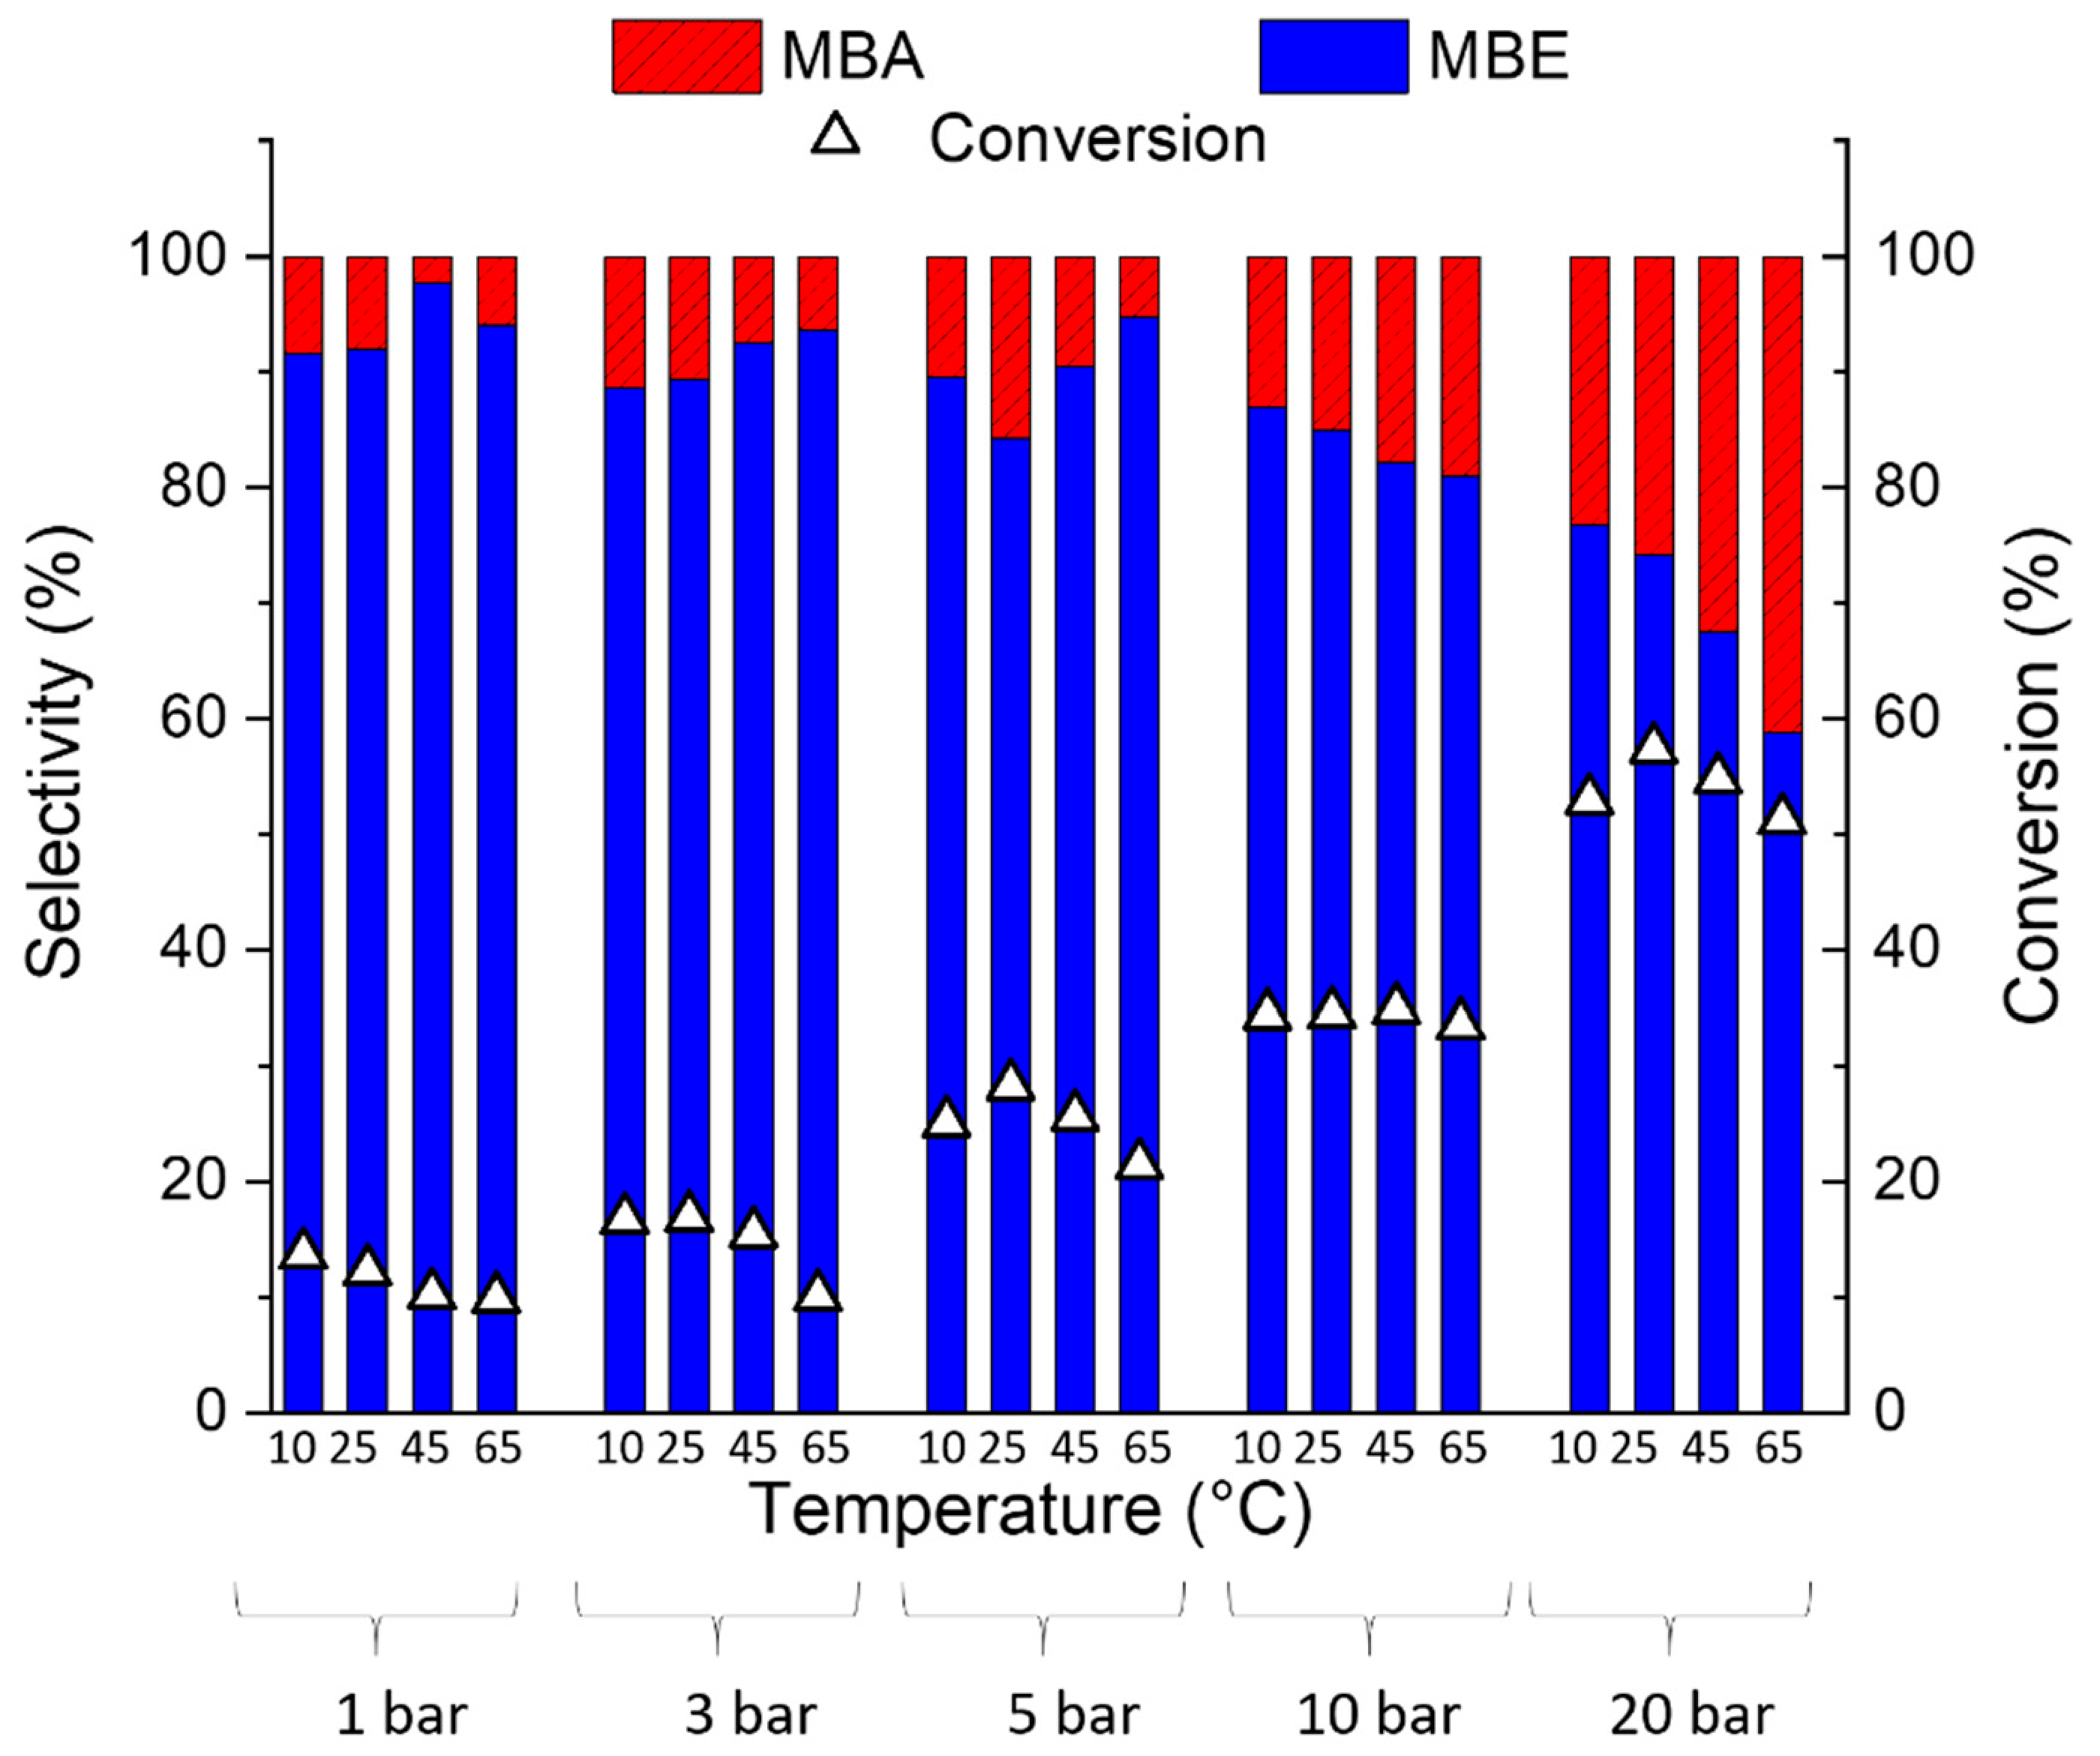
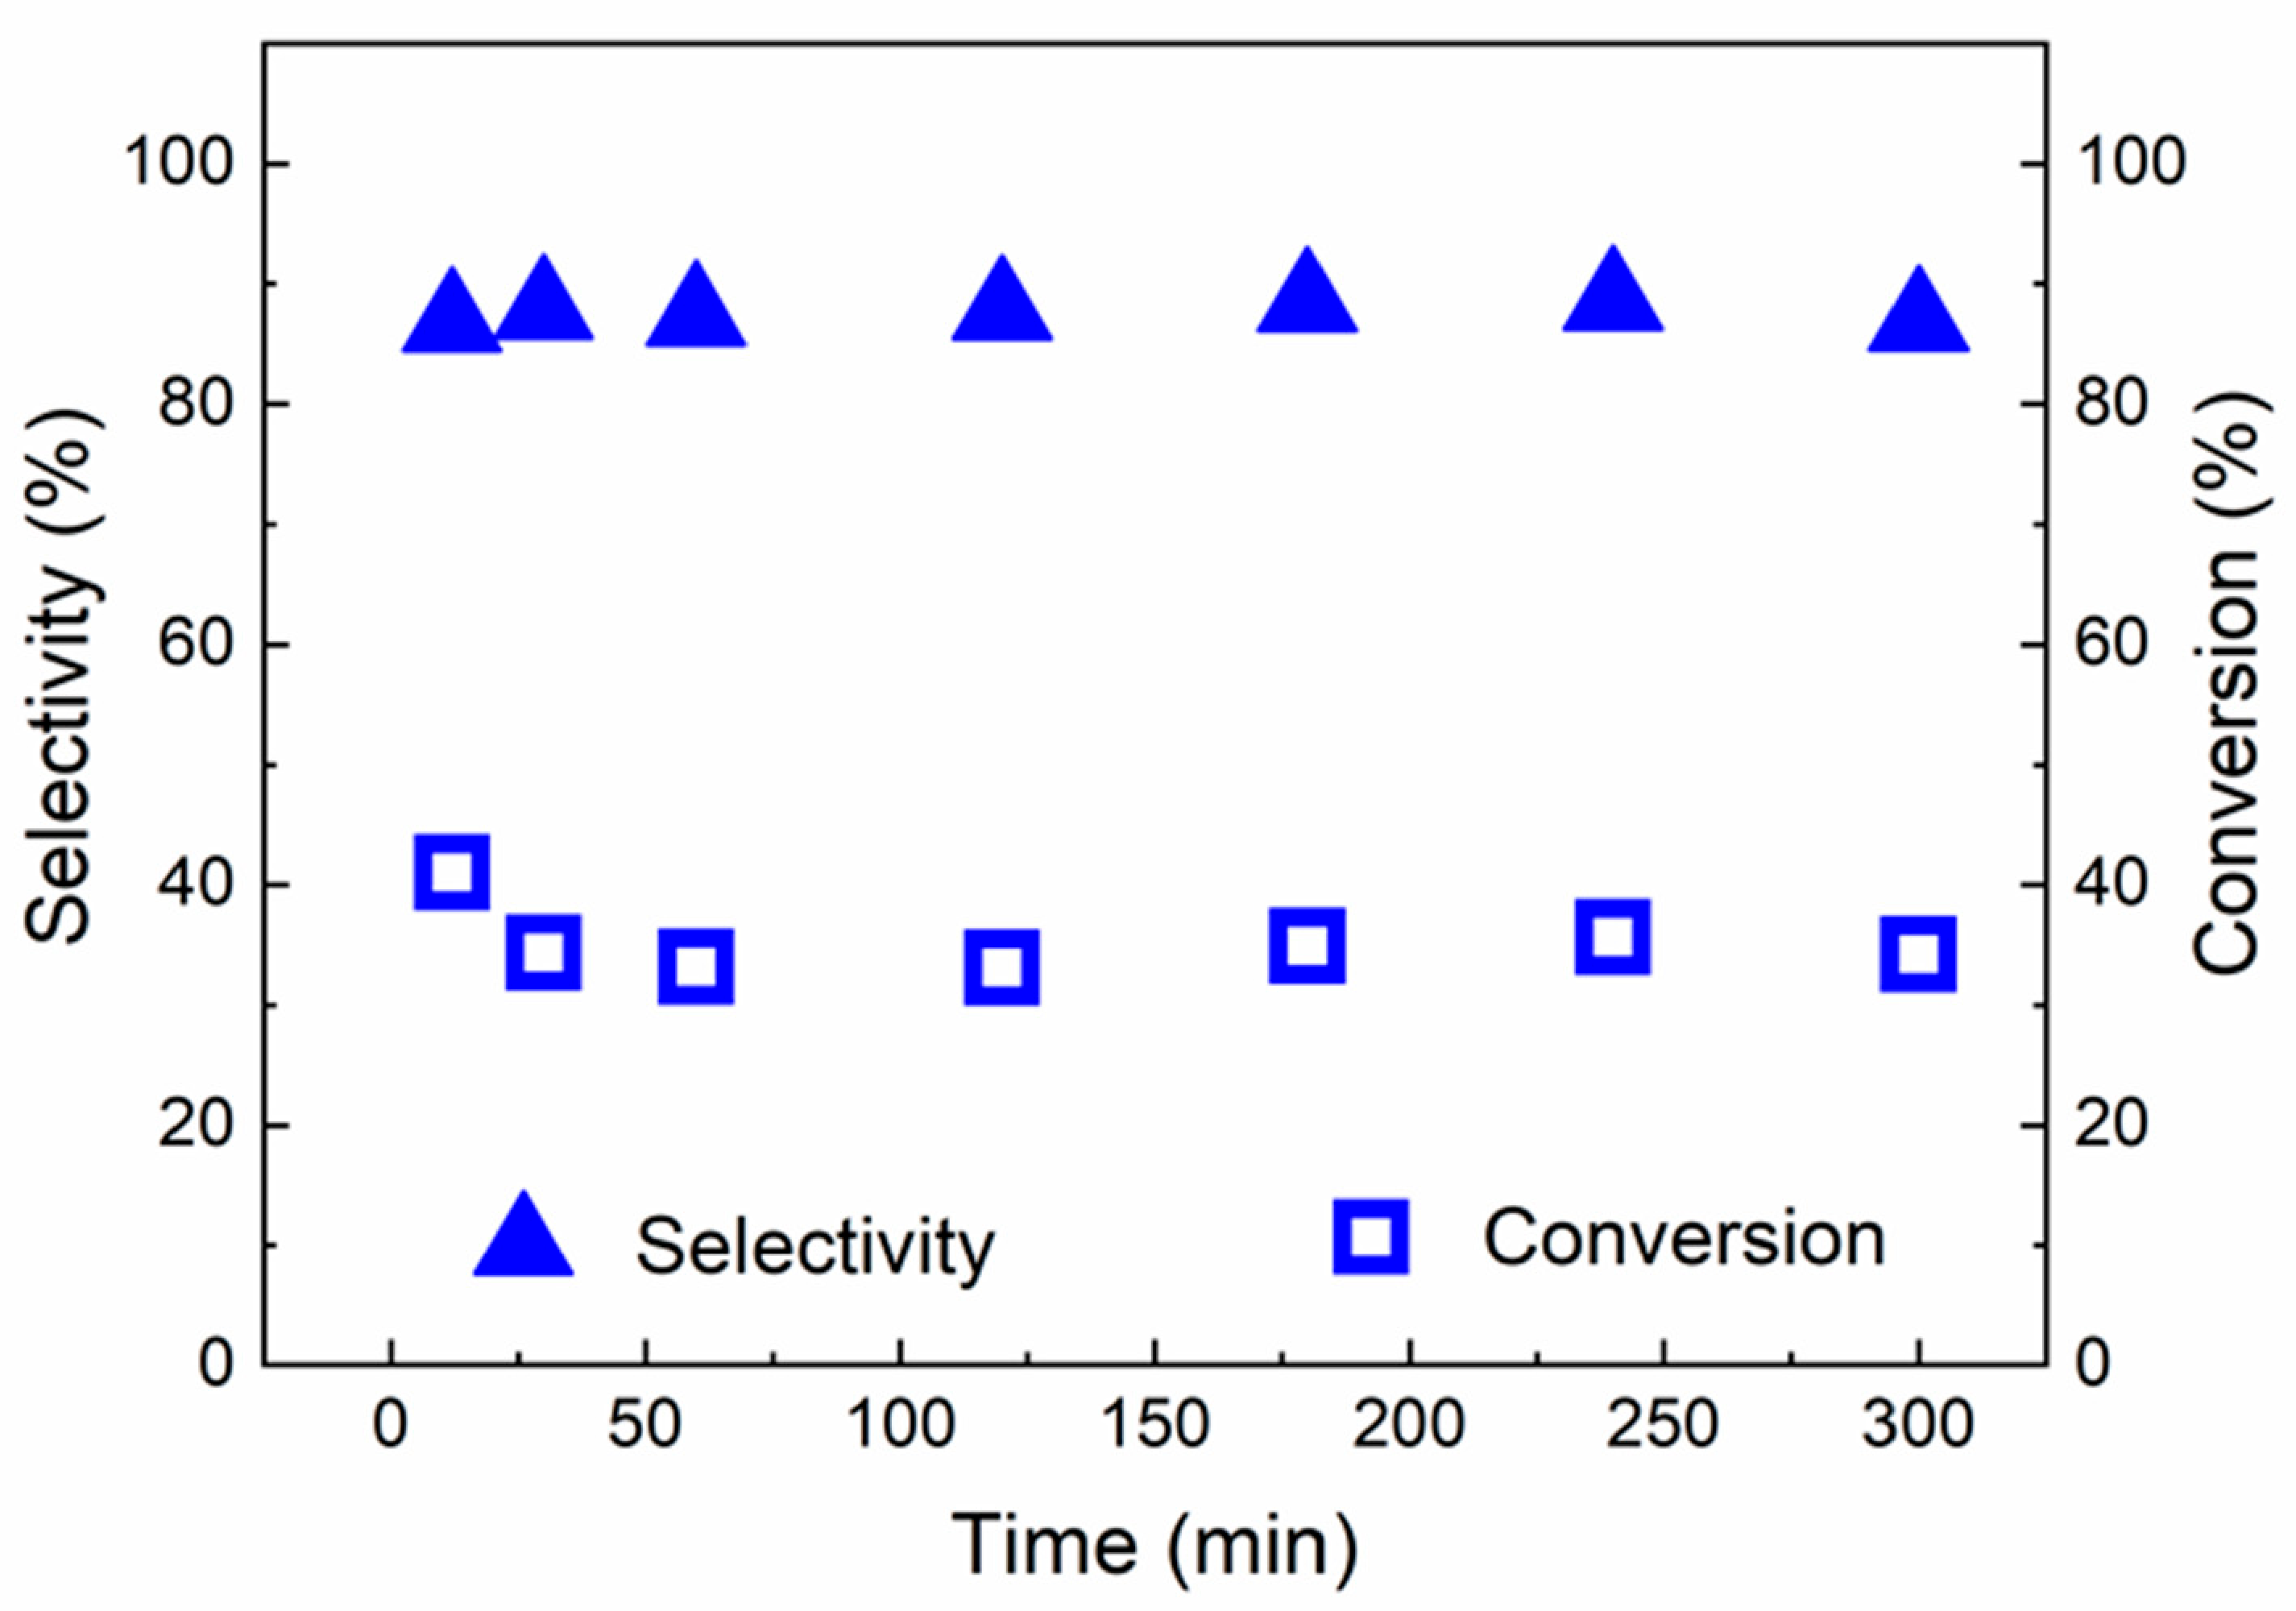
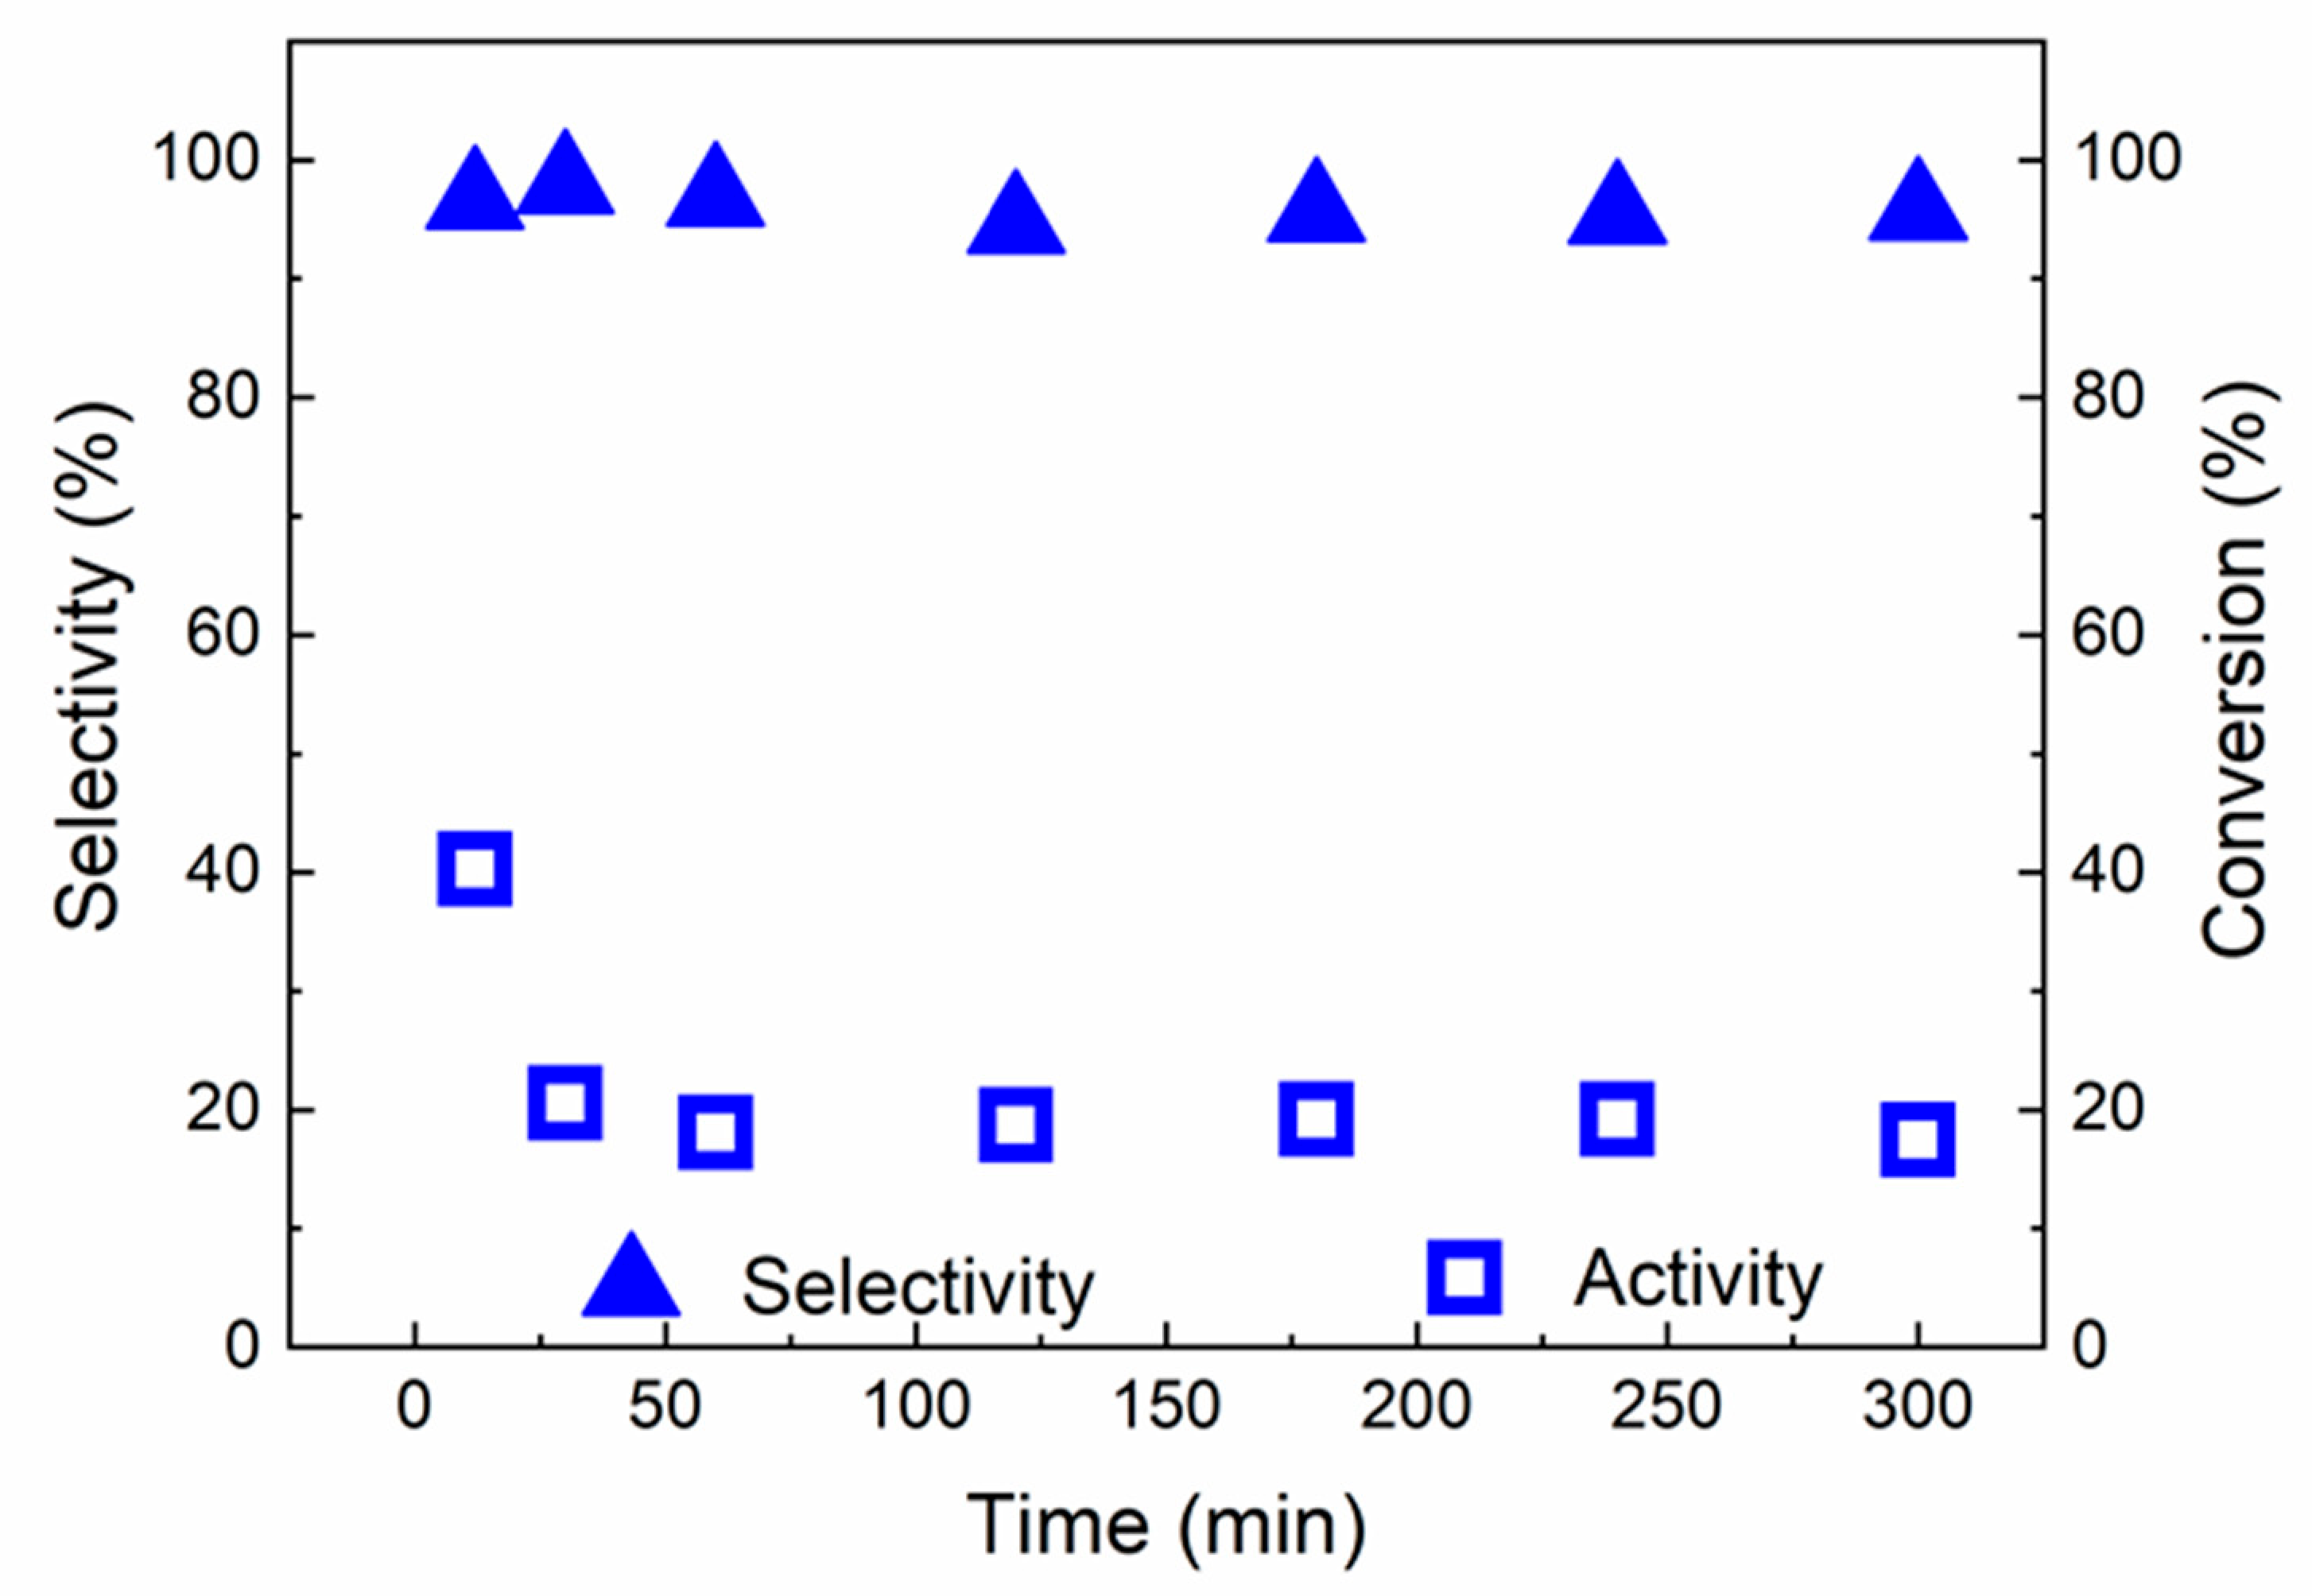
2.2. Catalytic Results

Red(400 °C)-Pd/γ-Al2O3 and red(600 °C)-Pd/γ-Al2O3 catalytic performance was investigated in continuous-flow hydrogenation of 2-methyl-3-butyn-2-ol (MBY) over a wide range of temperatures and pressures (Figure 9, Figure 10, Figure 11, Figure 12 and Figure 13).
The differences between two Pd/γ-Al2O3 catalysts after different pretreatment procedures could be explained in terms of structure sensitivity (Table 2, Figure 2), acidity of dehydroxylated alumina (Section 2.1.6) and/or formation of Pd–Al species under high-temperature treatment (Figure 3). Due to small differences in the amounts and strength of acidic sites in red(400 °C)-Pd/γ-Al2O3 and red(600 °C)-Pd/γ-Al2O3, the acidity seems to not be crucial for explaining differences in catalytic behaviour of the two Pd samples. Therefore, after rejecting a possible catalytic role of the alumina acidity, structure sensitivity of MBE hydrogenation on Pd active sites, the effect of carbon and hydrogen dissolution (β-PdH and PdCx formation), the potential role of Al–Pd species at red(600 °C)-Pd/γ-Al2O3 and hydrogen spillover were considered during interpretation of further results.
Figure 9 shows the influence of reaction conditions on the specific activity expressed as TOF (s−1) of Pd samples. Generally, an increase of the reaction pressure increases the activity of both Pd catalysts. On the other hand, the increase of temperature at each pressure decreases the activity in line with earlier studies on alkyne hydrogenation. They could be explained by different kinetics of carbon (from fragmented substrate molecules) and hydrogen dissolution during alkyne hydrogenation [42,43]. Due to the fact that C dissolution has to be preceded by MBY fragmentation, hydrogen dissolution occurs more favourably than C dissolution at lower temperatures. Moreover, hydrogen chemisorption on Pd is an exothermic process. It means that it begins less favourably with temperature increase [42,44]. In consequence, higher conversion and slightly lower MBE selectivity were observed at lower temperatures (Figure 9, Figure 10 and Figure 11). The volcanic relationship of activity versus temperature was detected only for the catalyst reduced at the higher temperature (Figure 9). However, some activity fluctuations are also known in literature and explained by the coverage fluctuation and/or spatiotemporal heterogeneities, which are intrinsic to the reaction–diffusion problem and not necessarily caused by any dynamical surface effect from the catalyst (e.g., dynamical surface reconstruction) [45,46].
Hence, we concluded that pressure is the crucial parameter that benefits MBY hydrogenation and the changes in conversion with temperature may not follow this trend.
Nevertheless, both Pd catalysts show spectacular differences in the products’ distribution (Figure 10 and Figure 11). Although both 2-methyl-3-butyn-2-ol hydrogenation products are desired in the production of pharmaceutical intermediates (MBE) and fine chemicals manufacture (MBA), our research is focused mainly on 2-methyl-3-buten-2-ol production. Based on the literature data [42,43,44], the selective alkyne to alkene hydrogenation on palladium catalyst is possible only when carbon (from fragmented substrate molecules) occupies interstitial lattice Pd sites and excludes H from populating the subsurface region and hence prevents total hydrogenation of substrate. As it is independent of the temperature and pressure, red(400 °C)-Pd/γ-Al2O3 produces 2-methyl-2-butanol as the main product (Figure 10) in contrast to Pd/γ-Al2O3 reduced at 600 °C (Figure 11), it could be assumed that the rate of C dissolution in red(400 °C)-Pd/γ-Al2O3 is too low to affect MBE selectivity. However, the second significant factor, which should be taken into account, is hydrogen spillover from Pd to the Al2O3 support [42]. It was found that C≡C is only hydrogenated on palladium, whereas hydrogen on the alumina support hydrogenates C=C to the saturated product. The carbonaceous species accumulated on the γ-Al2O3 support act as bridges that accelerate the process and consequently greatly increase the undesirable C=C hydrogenation [42].
Moreover, in accordance with the literature data [47], high selectivity to MBA could suggest that hydrogenation of 2-methyl-3-butyn-2-ol occurs mainly at the edge-active sites, opposite to partial MBY hydrogenation, which occurs preferentially at the plane sites regardless of their crystallographic orientation. This phenomenon confirms structure sensitivity of MBY hydrogenation and it is in line with the results of DFT investigation for MBY hydrogenation [14]. DFT energetic description confirms that C≡C in MBY is activated, by strong interaction energies, preferentially by plane sites with respect to corner/edge atoms. However, further hydrogenation MBE to MBA requires the presence of low coordination sites like edges and corners [14].
Maybe the conclusions go too far, but it seems likely that edge-active sites of Pd are more sensitive to hydrogen subsurface diffusion and dissolution, which strongly enhance hydrogenation of 2-methyl-3-butyn-2-ol toward the fully hydrogenated product (MBA) [42,48]. Consequently, catalytic performance of red(600 °C)-Pd/γ-Al2O3 could be affected by coexistence of three factors: competition between PdH and PdCx formation during the reaction, structure sensitivity, and hydrogen spillover to the alumina support.
The desired MBE was formed as a major product of MBY hydrogenation on red(600 °C)-Pd/γ-Al2O3 over a wide range of pressures (Figure 11). However, it should be noticed that higher pressures (10 and 20 bar) promote saturated alcohol formation instead of unsaturated MBE, with a maximum selectivity to MBA of 42% at 65 °C and 20 bar.
This high MBE selectivity indicates a significant role of Al in Pd–Al species in decreasing the Pdδ− surface concentration via electron transfer from Pd to Al and the decreasing amounts of hydrogen in bulk. Consequently, only surface adsorbed hydrogen could favour partial MBY hydrogenation and MBE formation [43]. It is in conformance with the studies concerning MBA gas-phase hydrogenation on Pd–Zn/Al2O3, where the hydrogen spillover increased surface hydrogen content enhanced MBE production over Pd−Zn/Al2O3 in comparison to Pd/ZnO with similar Pd–Zn alloy content [5]. Moreover, following the literature data [17,49], Pd–Al species with modified electronic properties in comparison to red(400 °C)-Pd/γ-Al2O3 could lead to a weaker Pd–Alkyl bonding and hinderance of carbon penetration into the palladium lattice [42,50]. All of these factors contribute to the fact that the hydrogenation of 2-methyl-3-butyl-2-ol on Pd–Al species leads to the formation of partial hydrogenation product—2-methyl-3-buten-2-ol, opposite to red(400 °C)-Pd/γ-Al2O3, where the production of the fully hydrogenated product (2-methyl-2-butanol) dominates.
Although the highest MBE selectivity was achieved at 45 °C and 1 bar, we have determined the optimal pressure and temperature conditions (5 bar, 25 °C) for 2-methyl-3-buten-2-ol production, due to a higher TOF value in these conditions (Figure 9).
Therefore, the stability tests of red(600 °C)-Pd/γ-Al2O3 were performed both at 5 bar, 25 °C and at 45 °C and 1 bar (Figure 12 and Figure 13). Figure 12 and Figure 13 show changes of conversion and selectivity to the desired product as a function of time of stream. The initial conversion at both conditions was found to be 41% but it decreased to 34% at 5 bar and 25 °C and 20% and at 1 bar and 45 °C after the first 30 min of reaction, which suggests that the catalyst undergoes some equilibration in the initial phase of hydrogenation. Nevertheless, selectivity of the desired product (2-methyl-3-buten-2-ol) was found to be always 88% and 97%, dependent on the reaction conditions (Figure 12 and Figure 13).
All in all, our studies reveal a substantial modification of the catalyst performance in relation to the reduction treatment. Undoubtedly, high-temperature reduction significantly promotes the selectivity towards the desired product, minimising over hydrogenation. Although, comparison of red(400 °C)-Pd/γ-Al2O3 and red(600 °C)-Pd/γ-Al2O3 activity with literature data [5,8,9,10,11,12,13,14,15,16] is not easy due to different reaction conditions (e.g., mode, residence time, substrate concentration and H2/substrate ratio), our results seem promising with 97% selectivity to the vitamin A precursor (2-methyl-3-buten-2-ol) obtained at 45 °C and 1 bar.

3. Materials and Methods

3.1. Catalysts Preparation

The 1 wt.% metal-loaded palladium catalyst was prepared by incipient wetness impregnation. Chlorine-free γ-alumina, Puralox SCCa (supplied by Sasol, Johannesburg, South Africa) (150–200 mesh and 196 m2/g (BET)), was used as a support and aqueous solution of Pd(NO3)2·2H2O (supplied by Chempur, Piekary Śląskie, Poland) as a metal precursor. Impregnation was carried out using a rotary beaker with simultaneous heating (with a standard 200 W infrared lamp) for 24 h until complete evaporation of the solvent.
Afterwards, the material was calcined at 500 °C under flowing air with a 50 cm3/min speed for 3 h and then cooled in the air to room temperature. For the next step, the catalyst was separated into 2 portions. The first portion was reduced with 10% H2/Ar in the flow reactor at 400 °C for 3 h. The second part of the catalyst was exposed to 10% H2/Ar at 600 °C for 17 h. The obtained catalysts were labelled sequentially as red(400 °C)-Pd/γ-Al2O3 and red(600 °C)-Pd/γ-Al2O3.

3.2. Catalysts Characterization

3.2.1. Physisorption

The surface areas and porosities of our materials were measured with ASAP 2020 Chem. Instrument from Micromeritics (Norcross, GA, USA) BET (Brunauer-Emmett-Teller), t-Plot, BJH (Barret-Joyner-Halenda) and HK (Horwath-Kawazoe) methods were used with N2 as the adsorbate. Both γ-Al2O3 and 1 wt.% Pd/γ-Al2O3 after calcination were kept at 300 °C for 3 h in vacuum conditions to clean their surfaces before measurement of the adsorption isotherm at −196 °C.

3.2.2. Chemisorption

Chemisorption measurements of CO using a conventional static method were carried out with an ASAP 2020 Chem. Instrument from Micromeritics (Norcross, GA, USA). The chemisorption measurements were performed with red(400 °C)-Pd/γ-Al2O3 and red(600 °C)-Pd/γ-Al2O3. In accordance with the literature data [51], the surface CO:Pd stoichiometry equals to 1.5:1.

3.2.3. X-ray Diffraction

X-ray diffraction (XRD) measurements were done with a Rigaku-Denki instrument (Tokyo, Japan) equipped with Ni-filtered copper lamp Cu Kα. Diffraction profiles were scanned in the range of 2θ = 20–90°, step size of 0.008°, and counting time 60 s/step.

3.2.4. Temperature Programmed Studies

Temperature-programmed reduction (TPR) was run in a glass flow system in an atmosphere of a mixture of 10% H2/Ar. A Gow-Mac thermal conductivity detector (Bethlehem, PA, USA) was used. The catalyst precursors were heated with a 10 °C/min ramp, started from −20 °C. Injections of known amounts of hydrogen into the flow system were provided for calibration.
Temperature-programmed hydride decomposition (TPHD) was performed in a glass system equipped with independent gas lines, furnace, temperature controller and TCD detector. Freshly reduced catalyst was cooled down to 0 °C and then subjected to a temperature ramp (8 °C/min) up to 150 °C in the gas stream of 10% H2/Ar. The TCD detector allowed monitoring hydrogen concentration in the gas stream, which was related to the formation and decomposition of Pd hydride.

3.2.5. TEM Measurements

Transmission electron microscopy investigations for red(400 °C)-Pd/γ-Al2O3 and red(600 °C)-Pd/γ-Al2O3 were performed with a JEOL JEM-100CXII electron microscope (Tokyo, Japan ) operated at an acceleration voltage of 100 keV. At least 200 particles were employed to compose the size distribution histograms. Before TEM measurements, the samples were dispersed in pure alcohol using an ultrasonic cleaner and putting a drop of this suspension onto carbon films on copper grids.

3.2.6. XPS Measurements

X-ray photoelectron spectroscopic (XPS) measurements were performed using a PHI 5000 VersaProbe (ULVAC-PHI, 2500 Hagisono, Chigasaki, Kanagawa, Japan) spectrometer with monochromatic Al Kα radiation (h = 1486.6 eV) from an X-ray source operating at 100-µm spot size, 25 W and 15 kV. High-resolution (HR) XPS spectra for the samples reduced ex-situ and in-situ by flowing hydrogen (1.5 × 10⁻⁵ Torr, 200 °C, 1 h) were collected with the hemispherical analyser at the pass energy of 117.4 and the energy step size of 0.1 eV. The X-ray beam was incident at the sample surface at the angle of 45° with respect to the surface normal, and the analyser axis was located at 45° with respect to the surface. The CasaXPS software (Ver. 2.3.19, Casa Software Ltd., 26 Burford Crescent, Wilmslow, Cheshire, UK) was used to evaluate the XPS data. Deconvolution of all HR XPS spectra was performed using a Shirley background and a Gaussian peak shape with 30% Lorentzian character.

3.2.7. NH3-TPD Measurements

NH3 temperature-programmed desorption (NH3-TPD) was applied to measure the acid properties of the red(400 °C)-Pd/γ-Al2O3 and red(600 °C)-Pd/γ-Al2O3 catalyst samples. The runs were performed in a quartz tube reactor connected to a quadrupole mass spectrometer (HPR 60, Hiden, Warrington, UK), where 50 mg of the catalyst sample was used for each test. Prior to each measurement, the pre-reduced sample was treated with helium at 500 °C for 1 h to remove the adsorbed impurities. After cooling to 50 °C under a He flow, the sample was exposed to 5% NH3-He mixture (50 mL/min) for 30 min, followed by purging with He for 20 min, and then heated to 500 °C by ramping at 10 °C/min under He flow.

3.3. Catalytic Tests

Hydrogenation of 2-methyl-3-butyn-2-ol (MBY) (98% pure from Sigma-Aldrich, Darmstadt, Germany) was performed in flow mode in a ThalesNano H-Cube device (Budapest, Hungary). In this system, hydrogen is generated in situ via electrolysis of water, and then dried and mixed with the substrate solution (MBY in ethanol (99.8% pure from Avantor Performance Materials, Gliwice, Poland)). An HPLC pump provides the circulation of the reactants, and their pressure is established by the automatic system conjugated with multiple pressure sensors. The catalyst was placed in a 30 mm long stainless-steel cartridge (CatCart®30) with an inner diameter of 4 mm.
Each experiment was performed using 0.1 g of the catalyst and a flow rate of 0.5 mL of solution per min (0.19 mmol MBY/min) and H2 flow 6 mL/min. Different conditions for pressure (1, 3, 5, 10 and 20 bar) and temperature (10, 25, 45 and 65 °C) were investigated.
Additionally, stability tests were performed at 25 °C, 5 bar, and at 45 °C, 1 bar with 6 mL/min of hydrogen for 300 min. In this case, samples were taken after 12, 30, 60, 120, 180, 240 and 300 min of the reaction.
The obtained samples were analysed in a gas chromatographic system (Bruker 456-GC with FID detector, Billerica, MA, USA) equipped with BP5 column (30 m, 0.25 mm and 0.25 µm). A satisfactory carbon balance (within ~97%) was found for GC analyses. The reproducibility of results was fair—±10% (total activity) or good—±2% (products selectivity).

4. Conclusions

Our results clearly show that 1 wt.% Pd/γ-Al2O3 is active in the continuous hydrogenation of 2-methyl-3-butyn-2-ol toward products of importance in pharmaceutical and fine-chemical industries. The catalytic performance of red(400 °C)-Pd/γ-Al2O3 and red(600 °C)-Pd/γ-Al2O3 are affected by the coexistence of several related factors like competition between PdH and PdCx formation during the reaction, structure sensitivity, hydrogen spillover to the alumina support and the presence or absence of Pd–Al species.
Pd–Al surface sites’ presence and the significant enrichment of the surface of the red(600 °C)-Pd/γ-Al2O3 sample with partially oxidised aluminum explained the substantial increase in selectivity to MBE (vitamin A precursor) of this catalyst for the MBY hydrogenation. It is proposed that the Pd–Al species, which reveal unique electronic properties by decreasing the Pdδ− surface concentration via electron transfer from Pd to Al, leading to weaker Pd–Alkyl bonding, additionally assisted by the hydrogen spillover, are the sites of improved semi-hydrogenation.
We also demonstrated the general trend in the catalytic performance of 1 wt.% Pd/γ-Al2O3. Pressure is the crucial parameter that benefits MBY hydrogenation and the changes in conversion with temperature may not follow this trend. The increase in conversion leads to decreased selectivity to 2-methyl-3-buten-2-ol at the expense of increasing the selectivity to 2-methyl-2-butanol. Additionally, it was evident that low pressure and temperature values are preferred to synthesise vitamin A precursor.
In conclusion, utilising a highly reduced Pd/γ-Al2O3 catalyst can be a powerful approach for the pharmaceutical and the fine chemical industries to enhance the continuous-flow synthesis of 2-methyl-3-buten-2-ol, which can facilitate reaching a more environmentally friendly production.

Supplementary Materials

The following are available online at https://www.mdpi.com/article/10.3390/catal11040501/s1, Scheme S1: Scheme of vitamin A synthesis with 2-methyl-3-buten-2-ol as one of the substrate, Figure S1: HRTEM images of red(400 °C)-Pd/γ-Al2O3, Figure S2: HRTEM images of red(600 °C)-Pd/γ-Al2O3, Figure S3: SEM-EDS analysis of red(400°C)-Pd/γ-Al2O3, Figure S4: TEM-EDS analysis of red(400 °C)-Pd/γ-Al2O3, Figure S5: TEM-EDS analysis of red(600 °C)-Pd/γ-Al2O3, Figure S6: O1s + Pd3p3/2 XPS region of red(400 °C)-Pd/γ-Al2O3, Figure S7: O1s + Pd3p3/2 XPS region of red(600 °C)-Pd/γ-Al2O3, Figure S8: C 1s XPS region of red(400°C)-Pd/γ-Al2O3, Figure S9: C 1s XPS region of red(600 °C)-Pd/γ-Al2O3.

Author Contributions

Conceptualization, A.Ś.; Methodology, A.Ś., I.S.P., K.M. and D.L.; Formal Analysis, A.Ś.; Investigation, A.J.F.-R., B.Z., E.K., I.S.P., M.K., K.M. and D.L.; Data Curation, A.Ś.; Writing—original draft preparation, A.J.F.-R., B.Z. and A.Ś.; Writing—review and editing, A.J.F.-R. and A.Ś.; Supervision, A.Ś.; Project Administration, A.Ś.; Funding Acquisition, A.Ś. All authors have read and agreed to the published version of the manuscript.

Funding

This research was funded by National Science Centre in Poland within OPUS 17 Project No. 2019/33/B/ST5/01271.

Data Availability Statement

Data is contained within the article or Supplementary Materials.

Acknowledgments

This work was partially sponsored by National Science Centre in Poland within projects UMO-2019/33/B/ST5/01271.

Conflicts of Interest

The authors declare no conflict of interest.

References

  1. Bonrath, W.; Netscher, T. Catalytic processes in vitamins synthesis and production. Appl. Catal. A Gen. 2005, 280, 55–73. [Google Scholar] [CrossRef]
  2. Ricciardi, R.; Huskens, J.; Verboom, W. Nanocatalysis in Flow. ChemSusChem 2015, 8, 2586–2605. [Google Scholar] [CrossRef] [PubMed]
  3. Baxendale, I.R. The integration of flow reactors into synthetic organic chemistry. J. Chem. Technol. Biotechnol. 2013, 88, 519–552. [Google Scholar] [CrossRef]
  4. Anastas, P.; Eghbali, N. Green Chemistry: Principles and Practice. Chem. Soc. Rev. 2009, 39, 301–312. [Google Scholar] [CrossRef]
  5. González-Fernández, A.; Berenguer-Murcia, Á.; Cazorla-Amoros, D.; Cárdenas-Lizana, F. Zn-Promoted Selective Gas-Phase Hydrogenation of Tertiary and Secondary C4 Alkynols over Supported Pd. ACS Appl. Mater. Interfaces 2020, 12, 28158–28168. [Google Scholar] [CrossRef]
  6. Eggersdorfer, M.; Laudert, D.; Létinois, U.; McClymont, T.; Medlock, J.; Netscher, T.; Bonrath, W. One Hundred Years of Vitamins-A Success Story of the Natural Sciences. Angew. Chem. Int. Ed. 2012, 51, 12960–12990. [Google Scholar] [CrossRef]
  7. Vernuccio, S.; Goy, R.; Von Rohr, P.R.; Medlock, J.; Bonrath, W. Hydrogenation of 2-methyl-3-butyn-2-ol over a Pd/ZnO catalyst: Kinetic model and selectivity study. React. Chem. Eng. 2016, 1, 445–453. [Google Scholar] [CrossRef]
  8. Lindlar, H. Ein neuer Katalysator für selektive Hydrierungen. Helv. Chim. Acta 1952, 35, 446–450. [Google Scholar] [CrossRef]
  9. Ao, I.; Sk, K. The Reduction of Alkynes over Pd-Based Catalyst Materials—A Pathway to Chemical Synthesis. J. Biosens. Bioelectron. 2017, 9, 1–15. [Google Scholar] [CrossRef]
  10. Crespo-Quesada, M.; Grasemann, M.; Semagina, N.; Renken, A.; Kiwi-Minsker, L. Kinetics of the solvent-free hydrogenation of 2-methyl-3-butyn-2-ol over a structured Pd-based catalyst. Catal. Today 2009, 147, 247–254. [Google Scholar] [CrossRef] [Green Version]
  11. Rebrov, E.V.; Klinger, E.A.; Berenguer-Murcia, A.; Sulman, E.M.; Schouten, J.C. Selective Hydrogenation of 2-Methyl-3-butyne-2-ol in a Wall-Coated Capillary Microreactor with a Pd25Zn75/TiO2Catalyst. Org. Process. Res. Dev. 2009, 13, 991–998. [Google Scholar] [CrossRef]
  12. Okhlopkova, L.B.; Kerzhentsev, M.A.; Ismagilov, Z.R. Capillary microreactor with a catalytic coating based on mesoporous titanium dioxide for the selective hydrogenation of 2-methyl-3-butyn-2-ol. Kinet. Catal. 2016, 57, 497–503. [Google Scholar] [CrossRef]
  13. Kundra, M.; Sultan, B.B.M.; Ng, D.; Wang, Y.; Alexander, D.L.; Nguyen, X.; Xie, Z.; Hornung, C.H. Continuous flow semi-hydrogenation of alkynes using 3D printed catalytic static mixers. Chem. Eng. Process. Process. Intensif. 2020, 154, 108018. [Google Scholar] [CrossRef]
  14. Prestianni, A.; Crespo-Quesada, M.; Cortese, R.; Ferrante, F.; Kiwi-Minsker, L.; Duca, D. Structure Sensitivity of 2-Methyl-3-butyn-2-ol Hydrogenation on Pd: Computational and Experimental Modeling. J. Phys. Chem. C 2014, 118, 3119–3128. [Google Scholar] [CrossRef]
  15. Albani, D.; Vilé, G.; Toro, M.A.B.; Kaufmann, R.; Mitchell, S.; Pérez-Ramírez, J. Structuring hybrid palladium nanoparticles in metallic monolithic reactors for continuous-flow three-phase alkyne hydrogenation. React. Chem. Eng. 2016, 1, 454–462. [Google Scholar] [CrossRef]
  16. Vilé, G.; Albani, D.; Nachtegaal, M.; Chen, Z.; Dontsova, D.; Antonietti, M.; López, N.; Pérez-Ramírez, J. A Stable Single-Site Palladium Catalyst for Hydrogenations. Angew. Chem. Int. Ed. 2015, 54, 11265–11269. [Google Scholar] [CrossRef]
  17. Radlik, M.; Małolepszy, A.; Matus, K.; Śrębowata, A.; Juszczyk, W.; Dłużewski, P.; Karpiński, Z. Alkane isomerization on highly reduced Pd/Al2O3 catalysts. The crucial role of Pd-Al species. Catal. Commun. 2019, 123, 17–22. [Google Scholar] [CrossRef]
  18. Skotak, M.; Łomot, D.; Karpiński, Z. Catalytic conversion of C6-alkanes over Pd/Al2O3 catalysts. Appl. Catal. A Gen. 2002, 229, 103–115. [Google Scholar] [CrossRef]
  19. Skotak, M.; Karpiński, Z. C6-alkane conversion over γ-alumina supported palladium and platinum catalysts. Chem. Eng. J. 2002, 90, 89–96. [Google Scholar] [CrossRef]
  20. Skotak, M.; Karpinski, Z.; Juszczyk, W.; Pielaszek, J.; Kepiński, L.; Kazachkin, D.; Kovalchuk, V.; Ditri, J. Characterization and catalytic activity of differently pretreated Pd/Al2O3 catalysts: The role of acid sites and of palladium–alumina interactions. J. Catal. 2004, 227, 11–25. [Google Scholar] [CrossRef]
  21. Bronstein, L.M.; Chernyshov, D.M.; Karlinsey, R.; Zwanziger, J.W.; Matveeva, V.G.; Sulman, E.M.; Demidenko, G.N.; Hentze, H.-P.; Antonietti, M. Mesoporous Alumina and Aluminosilica with Pd and Pt Nanoparticles: Structure and Catalytic Properties. Chem. Mater. 2003, 15, 2623–2631. [Google Scholar] [CrossRef]
  22. Patterson, A.L. The Scherrer Formula for X-Ray Particle Size Determination. Phys. Rev. 1939, 56, 978–982. [Google Scholar] [CrossRef]
  23. Penner, S.; Jenewein, B.; Hayek, K. Pd–Al interaction at elevated temperatures: A TEM and SAED study. Catal. Lett. 2007, 113, 65–72. [Google Scholar] [CrossRef]
  24. McKeehan, L.W. The Crystal Structure of Silver-Palladium and Silver-Gold Alloys. Phys. Rev. 1922, 20, 424–432. [Google Scholar] [CrossRef] [Green Version]
  25. Bergerhoff, G.; Brown, I.D. Crystallographic Databases; Allen, F.H., Bergerhoff, G., Sievers, R., Eds.; International Union of Crystallography: Chester, UK, 1987. [Google Scholar]
  26. Ellner, M. Zusammenhang zwischen strukturellen und thermodynamischen eigenschaften bei phasen der Cu-Familie in den T10-B3-systemen. J. Less Common Met. 1978, 60, P15–P39. [Google Scholar] [CrossRef]
  27. Vegard, L. Die Konstitution der Mischkristalle und die Raumfüllung der Atome. Eur. Phys. J. A 1921, 5, 17–26. [Google Scholar] [CrossRef]
  28. Denton, A.R.; Ashcroft, N.W. Vegard’s law. Phys. Rev. A 1991, 43, 3161–3164. [Google Scholar] [CrossRef]
  29. Lieske, H.; Voelter, J. Palladium redispersion by spreading of palladium(II) oxide in oxygen treated palladium/alumina. J. Phys. Chem. 1985, 89, 1841–1842. [Google Scholar] [CrossRef]
  30. Matam, S.K.; Otal, E.; Aguirre, M.; Winkler, A.; Ulrich, A.; Rentsch, D.; Weidenkaff, A.; Ferri, D. Thermal and chemical aging of model three-way catalyst Pd/Al2O3 and its impact on the conversion of CNG vehicle exhaust. Catal. Today 2012, 184, 237–244. [Google Scholar] [CrossRef]
  31. Bonarowska, M.; Zieliński, M.; Matus, K.; Sá, J.; Śrębowata, A. Influence of microwave activation on the catalytic behavior of Pd-Au/C catalysts employed in the hydrodechlorination of tetrachloromethane. React. Kinet. Mech. Catal. 2018, 124, 375–388. [Google Scholar] [CrossRef] [Green Version]
  32. Baker, R.; Prestridge, E.; McVicker, G. The Interaction of palladium with alumina and titanium oxide supports. J. Catal. 1984, 89, 422–432. [Google Scholar] [CrossRef]
  33. Bonarowska, M.; Kaszkur, Z.; Łomot, D.; Rawski, M.; Karpiński, Z. Effect of gold on catalytic behavior of palladium catalysts in hydrodechlorination of tetrachloromethane. Appl. Catal. B Environ. 2015, 162, 45–56. [Google Scholar] [CrossRef]
  34. Hubkowska, K.; Łukaszewski, M.; Czerwinski, A. Thermodynamics of hydride formation and decomposition in electrodeposited Pd-rich Pd–Ru alloys. Electrochem. Commun. 2014, 48, 40–43. [Google Scholar] [CrossRef]
  35. Moulder, J.F.; Stickle, W.F.; Sobol, P.E.; Bomben, K.D. Handbook of X-ray Photoelectron Spectroscopy; Chastain, J., King, R.C., Jr., Eds.; Physical Electronics, Inc.: Chanhassen, MN, USA, 1995. [Google Scholar]
  36. NIST X-ray Photoelectron Spectroscopy Database; Version 4.1; National Institute of Standards and Technology: Gaithersburg, MD, USA, 2012. Available online: http://srdata.nist.gov/xps/ (accessed on 29 January 2021).
  37. Beamson, G.; Brighs, D. High Resolution XPS of Organic Polymers: The Scienta ESCA300 Database; John Wiley & Sons, Ltd.: Chichester, UK, 1992. [Google Scholar]
  38. Kung, H.; Kung, M.; Costello, C. Supported Au catalysts for low temperature CO oxidation. J. Catal. 2003, 216, 425–432. [Google Scholar] [CrossRef]
  39. Al-Daous, M.A.; Manda, A.A.; Hattori, H. Acid–base properties of γ-Al2O3 and MgO–Al2O3 supported gold nanoparticles. J. Mol. Catal. A Chem. 2012, 363-364, 512–520. [Google Scholar] [CrossRef]
  40. Lv, D.-M.; Xu, Z.-N.; Peng, S.-Y.; Wang, Z.-Q.; Chen, Q.-S.; Chen, Y.; Guo, G.-C. (Pd–CuCl2)/γ-Al2O3: A high-performance catalyst for carbonylation of methyl nitrite to dimethyl carbonate. Catal. Sci. Technol. 2015, 5, 3333–3339. [Google Scholar] [CrossRef]
  41. Wang, J.; Bokhimi, X.; Novaro, O.; López, T.; Tzompantzi, F.; Gómez, R.; Navarrete, J.; Llanos, M.; López-Salinas, E. Effects of structural defects and acid–basic properties on the activity and selectivity of isopropanol decomposition on nanocrystallite sol–gel alumina catalyst. J. Mol. Catal. A Chem. 1999, 137, 239–252. [Google Scholar] [CrossRef]
  42. Borodziński, A.; Bond, G.C. Selective Hydrogenation of Ethyne in Ethene-Rich Streams on Palladium Catalysts. Part 1. Effect of Changes to the Catalyst during Reaction. Catal. Rev. 2006, 48, 91–144. [Google Scholar] [CrossRef]
  43. Teschner, D.; Borsodi, J.; Wootsch, A.; Révay, Z.; Hävecker, M.; Knop-Gericke, A.; Jackson, S.D.; Schlögl, R. The Roles of Subsurface Carbon and Hydrogen in Palladium-Catalyzed Alkyne Hydrogenation. Science 2008, 320, 86–89. [Google Scholar] [CrossRef]
  44. Borodziński, A.; Bond, G.C. Selective Hydrogenation of Ethyne in Ethene-Rich Streams on Palladium Catalysts, Part 2: Steady-State Kinetics and Effects of Palladium Particle Size, Carbon Monoxide, and Promoters. Catal. Rev. 2008, 50, 379–469. [Google Scholar] [CrossRef]
  45. Kim, M.; Bertram, M.; Pollmann, M.; Von Oertzen, A.; Mikhailov, A.S.; Rotermund, H.H.; Ertl, G. Controlling Chemical Turbulence by Global Delayed Feedback: Pattern Formation in Catalytic CO Oxidation on Pt(110). Science 2001, 292, 1357–1360. [Google Scholar] [CrossRef] [Green Version]
  46. Lin, Y.-C.; Kim, W.K.; Dzubiella, J. Coverage Fluctuations and Correlations in Nanoparticle-Catalyzed Diffusion-Influenced Bimolecular Reactions. J. Phys. Chem. C 2020, 124, 24204–24214. [Google Scholar] [CrossRef]
  47. Crespo-Quesada, M.; Yarulin, A.; Jin, M.; Xia, Y.; Kiwi-Minsker, L. Structure Sensitivity of Alkynol Hydrogenation on Shape- and Size-Controlled Palladium Nanocrystals: Which Sites Are Most Active and Selective? J. Am. Chem. Soc. 2011, 133, 12787–12794. [Google Scholar] [CrossRef]
  48. Khan, N.A.; Shaikhutdinov, S.; Freund, H.-J. Acetylene and Ethylene Hydrogenation on Alumina Supported Pd-Ag Model Catalysts. Catal. Lett. 2006, 108, 159–164. [Google Scholar] [CrossRef] [Green Version]
  49. Childers, D.; Saha, A.; Schweitzer, N.; Rioux, R.M.; Miller, J.T.; Meyer, R.J. Correlating Heat of Adsorption of CO to Reaction Selectivity: Geometric Effects vs Electronic Effects in Neopentane Isomerization over Pt and Pd Catalysts. ACS Catal. 2013, 3, 2487–2496. [Google Scholar] [CrossRef]
  50. Ke¸piński, L.; Wołcyrz, M.; Jabłoński, J. Effect of high-temperature reduction on carburization of alumina-supported palladium: Evidence for palladium-aluminium alloy formation. Appl. Catal. 1989, 54, 267–276. [Google Scholar] [CrossRef]
  51. Richards, N.; Carter, J.H.; Nowicka, E.; Parker, L.A.; Pattisson, S.; He, Q.; Dummer, N.F.; Golunski, S.; Hutchings, G.J. Structure-sensitivity of alumina supported palladium catalysts for N2O decomposition. Appl. Catal. B Environ. 2020, 264, 118501. [Google Scholar] [CrossRef]
Scheme 1. Pathway of catalytic 2-methyl-3-butyn-2-ol hydrogenation [5].
Catalysts 11 00501 sch001
Figure 1. X-ray diffraction (XRD) pattern for γ-Al2O3 and 1 wt.% Pd/γ-Al2O3 reduced at 400 °C and 600 °C.
Catalysts 11 00501 g001
Figure 2. Transmission electron microscopy (TEM) images of: (a) of red(400 °C)-Pd/γ-Al2O3 and (b) red(600 °C)-Pd/γ-Al2O3 catalysts. Pd particle size distribution for: (c) red(400 °C)-Pd/γ-Al2O3 and (d) red(600 °C)-Pd/γ-Al2O3 catalysts.
Catalysts 11 00501 g002
Figure 3. High-resolution transmission electron microscopy (HRTEM), scanning transmission electron microscopy (STEM) images and elemental mapping of: (a) red(400 °C)-Pd/γ-Al2O3 and (b) red(600 °C)-Pd/γ-Al2O3 catalysts.
Catalysts 11 00501 g003
Figure 4. Temperature programmed reduction of 1 wt.% Pd/γ-Al2O3 after calcination in air at 500 °C.
Catalysts 11 00501 g004
Figure 5. Temperature-programmed hydride decomposition for red(400 °C)-Pd/γ-Al2O3 and C-red(600 °C)-Pd/γ-Al2O3.
Catalysts 11 00501 g005
Figure 6. Pd 3d XPS X-ray photoelectron spectroscopy (XPS) region of: (a) red(400 °C)-Pd/γ-Al2O3 and (b) red(600 °C)-Pd/γ-Al2O3.
Catalysts 11 00501 g006
Figure 7. Al 2p XPS region of: (a) red(400 °C)-Pd/γ-Al2O3 and (b) red(600 °C)-Pd/γ-Al2O3.
Catalysts 11 00501 g007
Figure 8. NH3 Temperature-Programmed Desorption (NH3-TPD) profiles of red(400 °C)-Pd/γ-Al2O3 and red(600 °C)-Pd/γ-Al2O3.
Catalysts 11 00501 g008
Figure 9. Effect of reaction conditions on the specific activity (TOF (s−1)) of red(400 °C)-Pd/γ-Al2O3 and red(600 °C)-Pd/γ-Al2O3 in 2-metyl-3-butyn-2-ol hydrogenation with 0.5 mL/min flow rate of the reactant and 6 mL/min of the H2 flow.
Catalysts 11 00501 g009
Figure 10. Effect of reaction conditions on the conversion and selectivity of red(400 °C)-Pd/γ-Al2O3 to 2-methyl-3-buten-2-ol (MBE) and 2-methyl-2-butanol (MBA) in 2-metyl-3-butyn-2-ol hydrogenation with 0.5 mL/min flow rate of the reactant and 6 mL/min of the H2 flow.
Catalysts 11 00501 g010
Figure 11. The effect of reaction conditions on the conversion and selectivity of red(600 °C)-Pd/γ-Al2O3 to 2-methyl-3-buten-2-ol and 2-methyl-2-butanol in 2-metyl-3-butyn-2-ol hydrogenation with 0.5 mL/min flow rate of the reactant and 6 mL/min of the H2 flow.
Catalysts 11 00501 g011
Figure 12. Catalytic behaviour of red(600 °C)-Pd/γ-Al2O3 in hydrogenation of 2-methy-3-butyn-2-ol as a function of time on stream at 25 °C and 5 bar.
Catalysts 11 00501 g012
Figure 13. Catalytic behaviour of red(600 °C)-Pd/γ-Al2O3 in hydrogenation of 2-methy-3-butyn-2-ol as a function of time on stream at 45 °C and 1 bar.
Catalysts 11 00501 g013
Table 1. Textural properties of γ-Al2O3 and calcined PdAl2O3 from N2 physisorption.
SamplesBET Specific Surface Area (m2 g−1)Total Pore Volume (cm3 g−1)
γ-Al2O31900.51
Calcined-Pd/γ-Al2O32100.56
Table 2. Palladium particle sizes estimated from CO chemisorption.
SamplesParticle Size (nm) *Dispersion (%)
red(400 °C)-Pd/γ-Al2O310.211
red(600 °C)-Pd/γ-Al2O324.94.5
* Where particles size d = 1.12/D (D is the dispersion estimated from CO chemisorption).
Table 3. Pd, Al, O and C surface contents estimated in at. % by XPS for the two catalysts: red(400 °C)-Pd/γ-Al2O3 and red(600 °C)-Pd/γ-Al2O3, analysed after being air exposed (ex-situ red) and after in-situ H2-reduction.
SamplesPdAlOC
red(400 °C)-Pd/γ-Al2O3, ex-situ red.5.761.716.616.0
red(400 °C)-Pd/γ-Al2O3, in-situ red.5.259.929.25.7
red(600 °C)-Pd/γ-Al2O3, ex-situ red.4.542.430.123.0
red(600 °C)-Pd/γ-Al2O3, in-situ red.7.067.919.06.1
Publisher’s Note: MDPI stays neutral with regard to jurisdictional claims in published maps and institutional affiliations.

