Article

Investigation of Gas Diffusion Electrode Systems for the Electrochemical CO2 Conversion

1
CREST Group, Department of Applied Science and Technology (DISAT), Politecnico di Torino, C.so Duca degli Abruzzi, 24, 10129 Turin, Italy
2
Center for Sustainable Future Technologies (IIT@PoliTo), IIT—Istituto Italiano di Tecnologia, Via Livorno, 60, 10144 Turin, Italy
*
Authors to whom correspondence should be addressed.
These authors contributed equally to this work.
Catalysts 2021, 11(4), 482; https://doi.org/10.3390/catal11040482
Submission received: 13 February 2021 / Revised: 3 April 2021 / Accepted: 6 April 2021 / Published: 9 April 2021
(This article belongs to the Special Issue Photoelectrochemical and Photocatalytic Materials for Fuel Production)

Abstract

:
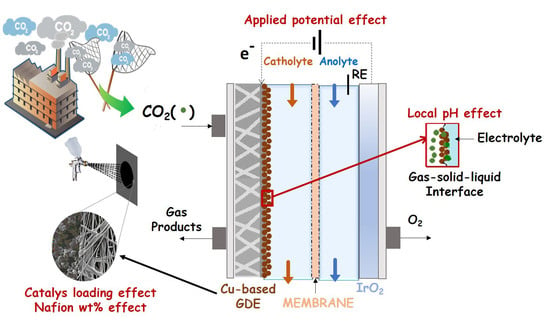
Electrochemical CO2 reduction is a promising carbon capture and utilisation technology. Herein, a continuous flow gas diffusion electrode (GDE)-cell configuration has been studied to convert CO2 via electrochemical reduction under atmospheric conditions. To this purpose, Cu-based electrocatalysts immobilised on a porous and conductive GDE have been tested. Many system variables have been evaluated to find the most promising conditions able to lead to increased production of CO2 reduction liquid products, specifically: applied potentials, catalyst loading, Nafion content, KHCO3 electrolyte concentration, and the presence of metal oxides, like ZnO or/and Al2O3. In particular, the CO productivity increased at the lowest Nafion content of 15%, leading to syngas with an H2/CO ratio of ~1. Meanwhile, at the highest Nafion content (45%), C2+ products formation has been increased, and the CO selectivity has been decreased by 80%. The reported results revealed that the liquid crossover through the GDE highly impacts CO2 diffusion to the catalyst active sites, thus reducing the CO2 conversion efficiency. Through mathematical modelling, it has been confirmed that the increase of the local pH, coupled to the electrode-wetting, promotes the formation of bicarbonate species that deactivate the catalysts surface, hindering the mechanisms for the C2+ liquid products generation. These results want to shine the spotlight on kinetics and transport limitations, shifting the focus from catalytic activity of materials to other involved factors.

Graphical Abstract

1. Introduction

Carbon dioxide (CO2) is an important trace gas in the Earth’s atmosphere, produced by natural processes and human activities (e.g., fossil fuels use as an energy source). With the aim of a transition towards the use of renewables energies, away from fossil fuels, CO2 can be regarded as a resource for beneficial processes. In such a context, several routes can be followed to obtain added-value products, namely: stochiometric, biochemical, photocatalytic, photoelectrochemical, electrochemical, and thermochemical. The last two might be deemed the more encouraging approaches to obtaining added-value products from CO2; however, improved reaction conditions and catalyst materials with high activity and stability are still required [1]. This research work is focused on the electrochemical route.
Electrocatalysis represents a promising method to increase the penetration of renewables into the fuels and chemicals industries, helping to close the carbon loop with carbon-neutral electricity sources. Hence, among the advantages, it offers a way to handle the growing world demand for resources, which greatly continues to depend on fossil fuels and will be severely affected in the near future [2]. Due to the modular design, the scale-up of electrolysers for CO2 conversion can be accomplished by stacking individual cells. The main advantage of the electrochemical processes is water as a hydrogen source, which otherwise is produced with conventional technologies using fossil fuels. The water is present either in electrolyte solutions or humidified feed streams and is fundamental for the in-situ protons (H+) generation to convert CO2 into chemicals or fuels. The electrocatalytic process can be controlled by the used electrode potential and operative conditions: it enables operation under mild conditions like temperature below 100 °C and pressure below 10 bars [3]. Nevertheless, some obstacles hinder the benefits of the electrochemical conversion of CO2; among these: large overpotentials, low exchange current densities, low selectivity, deactivation of electrodes, dependence on reaction environment. Despite its complexity, this innovative process has attracted considerable attention from researchers. Until some years ago, researchers focused their work on observing the effects of surface modification (e.g., nano-structuring and surface tailoring) on catalyst selectivity and activity. In this regard, like H-cell, a traditional configuration has been utilised as a platform for improvements (see Figure S1a). However, researchers have moved their attention towards continuous flow cells (see Figure S1b–d). Compared to their batch-type counterparts, continuous reactors have several benefits: among these, they allow to overcome mass-transport limitations and better control the residence time in the reactor [4]. In contrast to H-cell, the flow-cell set-up consists of different compartments. Thin layers constitute each compartment with a specific design, from whose overlapping gaseous and liquid pathways are defined.
Due to the low solubility of CO2 and mass transfer limitations from the bulk to the electrode surface, current densities in aqueous-fed systems (where CO2 is dissolved in the electrolyte) are limited to 35–40 mA cm−2 [5]. It has prompted researchers toward gas-diffusion layer based-systems (where the catalyst is placed on porous conductive support) to supply gaseous CO2 directly to the catalyst layer, to overcome the main limits of liquid reduction processes, and to make the upscaling possible: shorter diffusion pathway and a higher CO2 concentration can lead to commercially-relevant current densities (≥100 mA cm−2). However, there is a trade-off between high energetic efficiencies and Faradaic efficiencies (FEs): Vennekoetter et al., who focused on the importance of the reactor design for a more energy efficient CO2 conversion, concluded that a zero-gap assembly (Membrane Electrode Assembly (MEA) or cell-like fuel system) would be theoretically the perfect electrochemical reactor [3].
Regarding the local environment, it has been evidenced that this parameter may alter the reaction course. Thus, it affects the catalytic activity, as well as influences the catalyst surface modification [5]. Several studies carried out either on Gas Diffusion Electrode-based (GDE) set-ups or in H-cell reported large pH shifts at the electrode surface during CO2 electroreduction. It has prompted the scientific community to pay attention to the role of pH in electrolysis since changes of pH close to the catalytic surface have been recognised to have a similar effect to that of surface modification on determining the reaction pathways [5]. It is known that the pH near the electrode surface, referred to as “local pH”, is usually higher than that measured in the bulk electrolyte due to the production of OH ions (see Table S1) [6]. The high local pH might play a dual role [7]: on the one hand, favouring the production of carbonate and bicarbonate species (HCO32−, CO32−), which, in turn, tend to decrease the pH and reduce the concentration of CO2 at the catalytic surface [7,8], and on the other hand affects the surface coverage by adsorbed intermediates, suppressing the hydrogen evolution reaction (HER) because of a limited transport of protons [7,9,10]. These mechanisms seem to be quite contradictory and do not help to strengthen the considerations made to date. In this regard, it would be helpful to develop tools for monitoring pH changes during the reaction.
This work aims to offer an insight into the issues encountered when operating a GDE-cell configuration and show the reader how targeted changes may allow this system to overcome the limitations of operation with dissolved CO2 and pursue commercially-relevant current densities. The electrochemical CO2 conversion was here performed on different Cu-based electrocatalysts that are the most abundant, cheap, and the only materials reported to catalyse CO2 reduction to alcohols. For instance, copper coupled with another metal (bi- or multi-metallic systems) and copper oxides catalysts have caught the attention of researchers [11]. A synergistic effect has been denoted by Cu and Bi-based metal-organic frameworks (MOFs), which has prompted C-C coupling and led to the production of alcohols (methanol and ethanol) with a maximum FE of 36.9% [12]. Similarly, Li and co-workers developed a bimetallic Ag/Cu catalyst, obtaining a FE of 41% towards ethanol [13]. On the other hand, Yu et al. designed a robust Cu/TiO2-based catalyst able to achieve a FE of 19.5% towards methanol and up to 43.6% for ethanol [14]. CO2 conversion efficiency of 54.8% to alcohols (mainly methanol) has been instead reached with a Cu2O powder deposited on a carbon paper [15].
There are still many questions about the oxidation state of copper that promotes alcohols formation. Besides this, obtaining a catalyst with stable active sites remains a challenge: [11,16] within this context, it is interesting to consider the role of metal oxides substrates in stabilising the active species [17,18]. Thus, having a system where the active copper state is dispersed in a ZnO/Al2O3 substrate is believed to be an attractive course of action. Indeed, we have recently demonstrated that a ternary CuO/ZnO/Al2O3 catalyst, which finds its origin in the catalytic systems adopted in the thermocatalytic CO2 hydrogenation, can produce methanol from the electrochemical CO2 reduction in batch conditions [1]. Therefore, this kind of mixed oxide material is employed in this work. Moreover, individual aspects of the challenging GDE-based device are here considered to understand their impact on the performance and identify the optimal solution, specifically: catalyst loading, binder content, the influence of metal oxides, like ZnO or/and Al2O3, and cell configuration. Furthermore, the role of pH on the course of reactions was investigated, noting that a shift in the surface pH (regarding its bulk value) could hamper the mechanisms of CO2 conversion: the formation of (bi)carbonate species has been identified as a possible cause for the low C2+ productivities.

2. Results and Discussion

2.1. Physico-Chemical Characterisation of Synthesised Catalysts

The Field Emission Scanning Electron Microscopy (FESEM) images of the employed catalysts are shown in Figure 1. The CuZA-06-03-01 catalyst presents a different morphology compared to that of the other two catalysts. This material distinguishes this material as a precursor in the synthesis process, then regarded as responsible for the novel nano pyramidal structures in the CuZA-06-03-01 catalyst. Instead, the Cu-06 and CuZ-06-03 catalysts show similar spherical microparticles made up of rectangular-section structures. The only difference among them is the presence of very small particles on the spherical microstructures of the CuZ-06-03 catalyst, associated with ZnO (since Zn nitrate was added into the precursor solution).
The CuZ-06-03 catalyst has a 3 times greater surface area than the Cu-06 (as shown in Table S2). It is attributed to the presence of small particles detected on the CuZ-06-03 surface (see Table S3). A similar consideration applies to the CuZA-06-03-01 (in which Al is also present in the powder), which has 5-fold the surface area of the Cu-06 catalyst. Therefore, the incorporation of ZnO and Al2O3 metal oxides seems to be responsible for the increase in surface area of the Cu-based catalyst, with a significant impact in the case of the Al2O3 addition.
The XRD patterns of the employed powders can be seen in Figure S2. The diffraction peaks on Cu-06 can be assigned to the monoclinic CuO crystalline phase. Similar, but broader, CuO diffraction peaks are noticed in the CuZ-06-03 and CuZA-06-03-01 catalysts, which also present the ZnO diffraction peaks. Indeed, the incorporation of Zn and Al seems to influence the growth of the final crystals, leading to 40% and 50% smaller CuO crystallite size, respectively (see values calculated from Scherrer equation reported in Table S3). The diffraction peaks relative to aluminium oxide are absent, indicating that it is probably present as an amorphous phase.
Additionally, the Electrochemically Active Surface Area (ECSA) values of the electrodes were determined (see Supporting Information (SI) for calculation details). As reported in Table S4, the highest ECSA values were obtained for CuZ-06-03 and CuZA-06-03-01 catalysts. This finding is ascribed to their smaller crystallites with respect to Cu-06 (see Table S3).

2.2. Electrochemical Behaviour of the Employed Catalysts

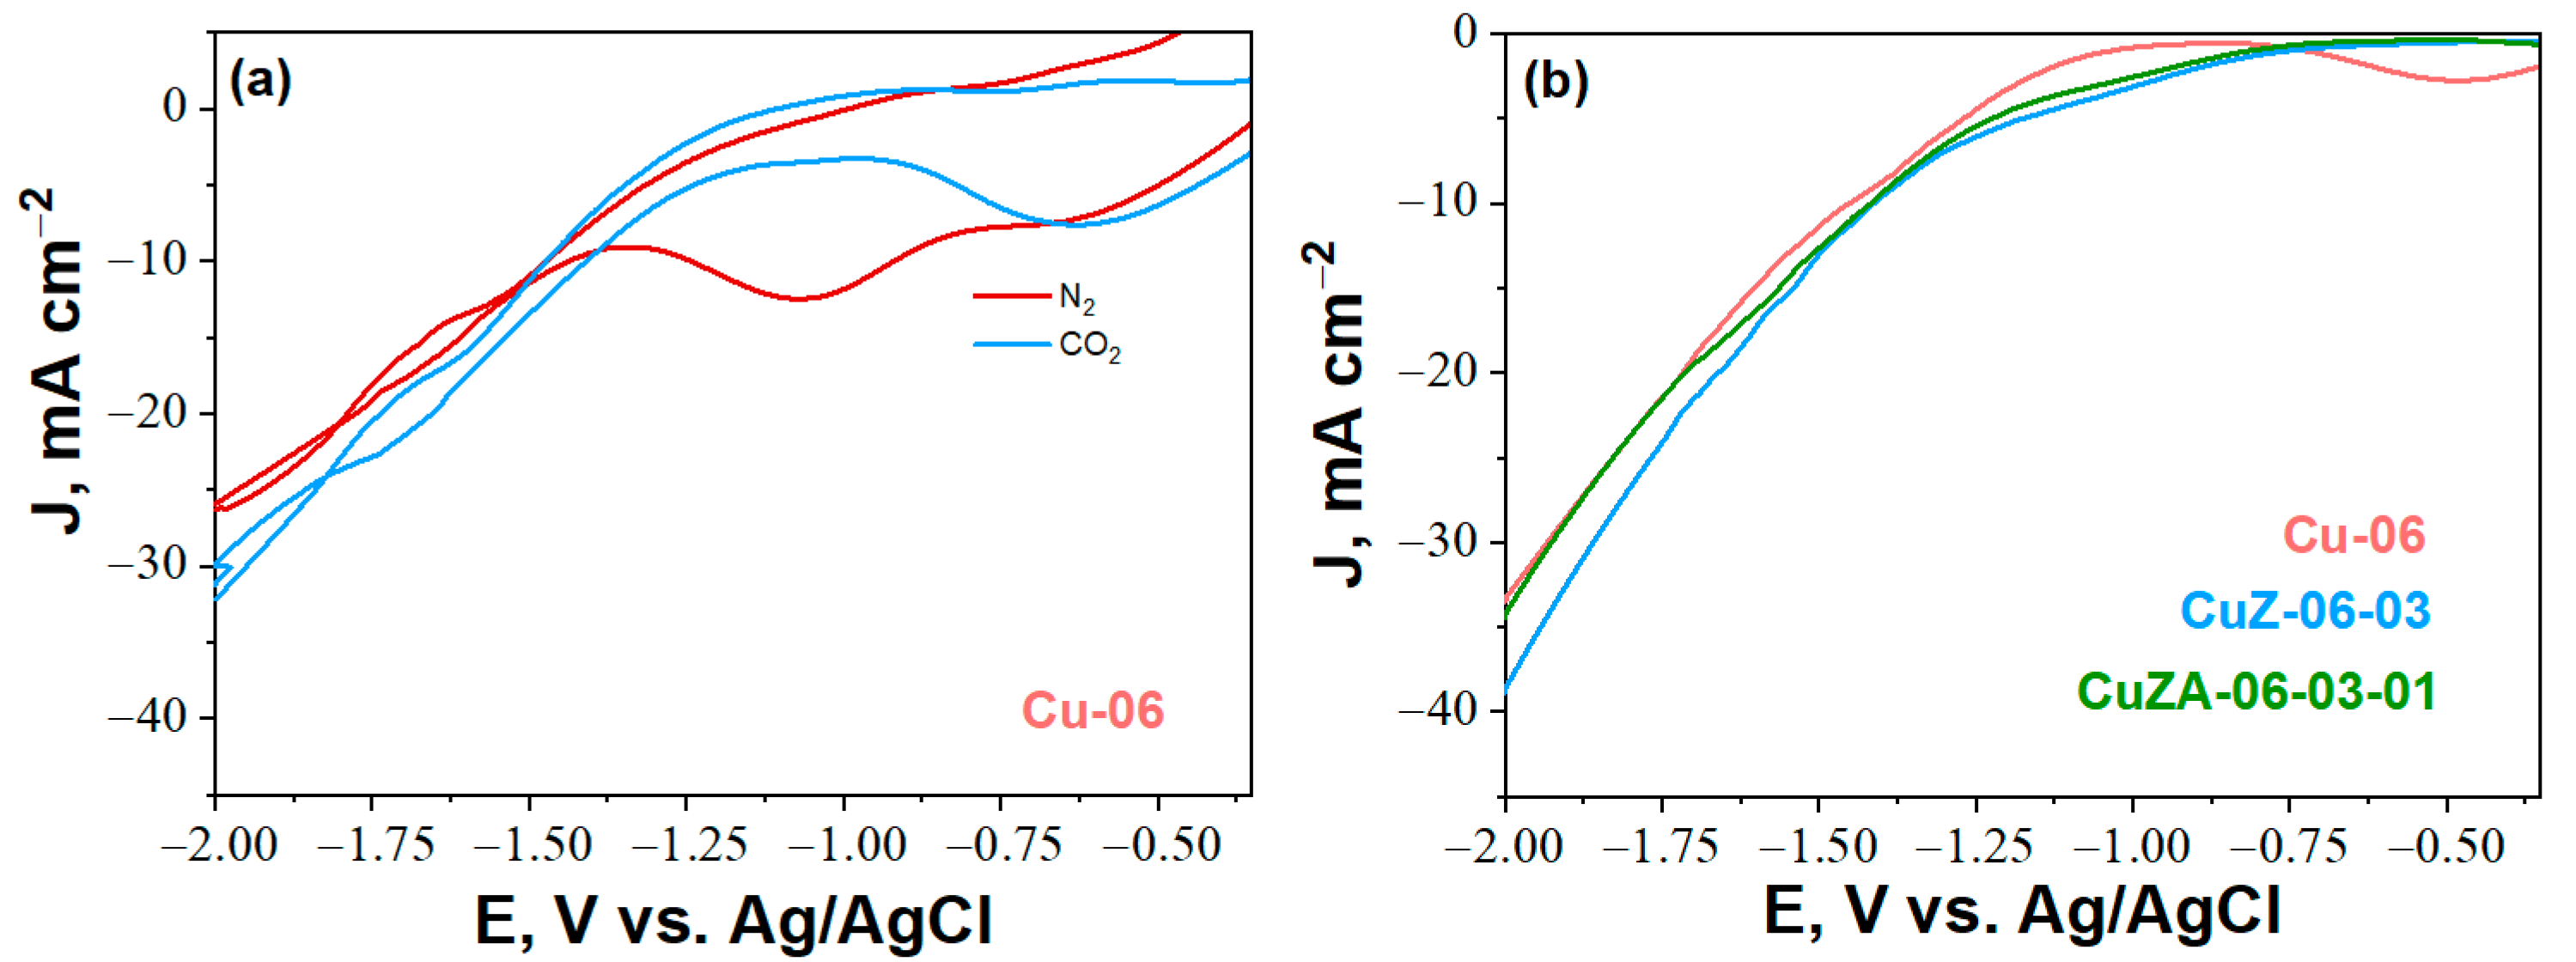
The electrochemical characterisation of the Cu-based catalysts was performed in 1 M KHCO3 at room temperature and atmospheric pressure by cyclic and linear sweep voltammetry. The Cyclic Voltammetry (CV) was carried out at 30 mV s−1 with N2 to study the electrochemical behaviour of the catalyst in the working solution, which can be considered as blank voltammograms (see the red curve in Figure 2a). The electrocatalytic activity under N2 flow can be attributed to the HER or the reduction of the catalyst [19]. In view of the investigations of hydrogen adsorption conducted on palladium and platinum catalysts, the redox peaks appreciated for Cu-06, in Figure 2a, at around −1 V vs. Ag/AgCl may be ascribed to the formation of adsorbed hydrogen [20,21]. On the other hand, the observed peaks can be assigned to reduce Cu+2 to Cu+1 or Cu0 [22]. Considering the voltammograms recorded under CO2 flow, a reduction peak appeared at a lower applied potential of ca. −0.5 V vs. Ag/AgCl, which can be attributed to the electron transfer process associated with the adsorbed intermediates during the CO2 reduction, as previously reported by Hori et al. [23]. Slightly higher activity is observed in the presence of CO2 than in N2, in terms of current densities measured at the same potential values (starting from ca. −1.5 V vs. Ag/AgCl). This improved result may be associated to the electrochemical CO2 reduction. In this regard, reference is made to C-containing products analysis results (see Section 2.3), which confirm this hypothesis. On the other hand, a mass transport phenomenon can be appreciated through the entwined curve over a particular potential range (between −1.625 and −1.875 V vs. Ag/AgCl) in Figure 2a. It is a negative differential resistance (NDR) behaviour (increased resistance is obtained with increasing voltage), typically observed in conventional semiconductor materials [24]. Besides, the capacitive behaviour of the curves may be attributed to charges accumulation.
Figure 2b displays the Linear Sweep Voltammetry (LSV) results under CO2 flow for all the studied Cu-based electrocatalysts. A lower onset potential is noticed for the catalysts containing ZnO and Al2O3, which confirms the role of these metal oxides in promoting catalytic activity. At higher applied potentials, the catalytic activity does not appear to increase, although the CuZ-06-03 shows a current density value that is ~5 mA cm−2 greater than the other two catalysts, the maximum applied potential of −2 V vs. Ag/AgCl. The maximum activity observed in these cases (reduction currents < 40 mA cm−2) may be attributed to mass transfer limitations. In fact, the CuZA catalyst is capable of generating higher reduction current densities (~90 mA cm−2) when there are no mass transfer limitations, as it can be observed in the LSV carried out on this catalyst in a Rotating Disk Electrode (RDE) System (see Figure S5, Supporting Information (SI)).
For comparison, a blank test was performed to have a reference for the evaluation of the products that may be generated from the only carbon support. Thus, the electrochemical behaviour of a carbon paper with a deposited ink without catalyst nanoparticles is described in Section S7 of the SI. In this case, the ink was constituted only by Vulcan Carbon, Nafion solution, and isopropyl alcohol. This blank electrode generates current density values in the CV that are comparable to the ones observed with the catalysed GDEs, under both N2 and CO2 flow conditions (see Figure S6 in the SI); however, under chronoamperometric conditions, it mainly generates H2, while a very small amount of CO2 reduction products was obtained: CO (~1%) and formate (~1%), without any other detected liquid compounds (Figure S7 in the SI).

2.3. Electrochemical CO2 Reduction

This section will discuss how the operative conditions and the electrode components can influence the selectivity and productivity of a GDE-based electrochemical cell towards different CO2 reduction products. The results reported in this section will be presented in the following order. First, the tests of the Cu-06 catalyst at different potential values are discussed. Based on those results, a fixed half-cell potential was selected for performing the subsequent tests, where the effect of different metal oxides, catalyst loading, and ionomer content is assessed.

2.3.1. Effect of Applied Potential

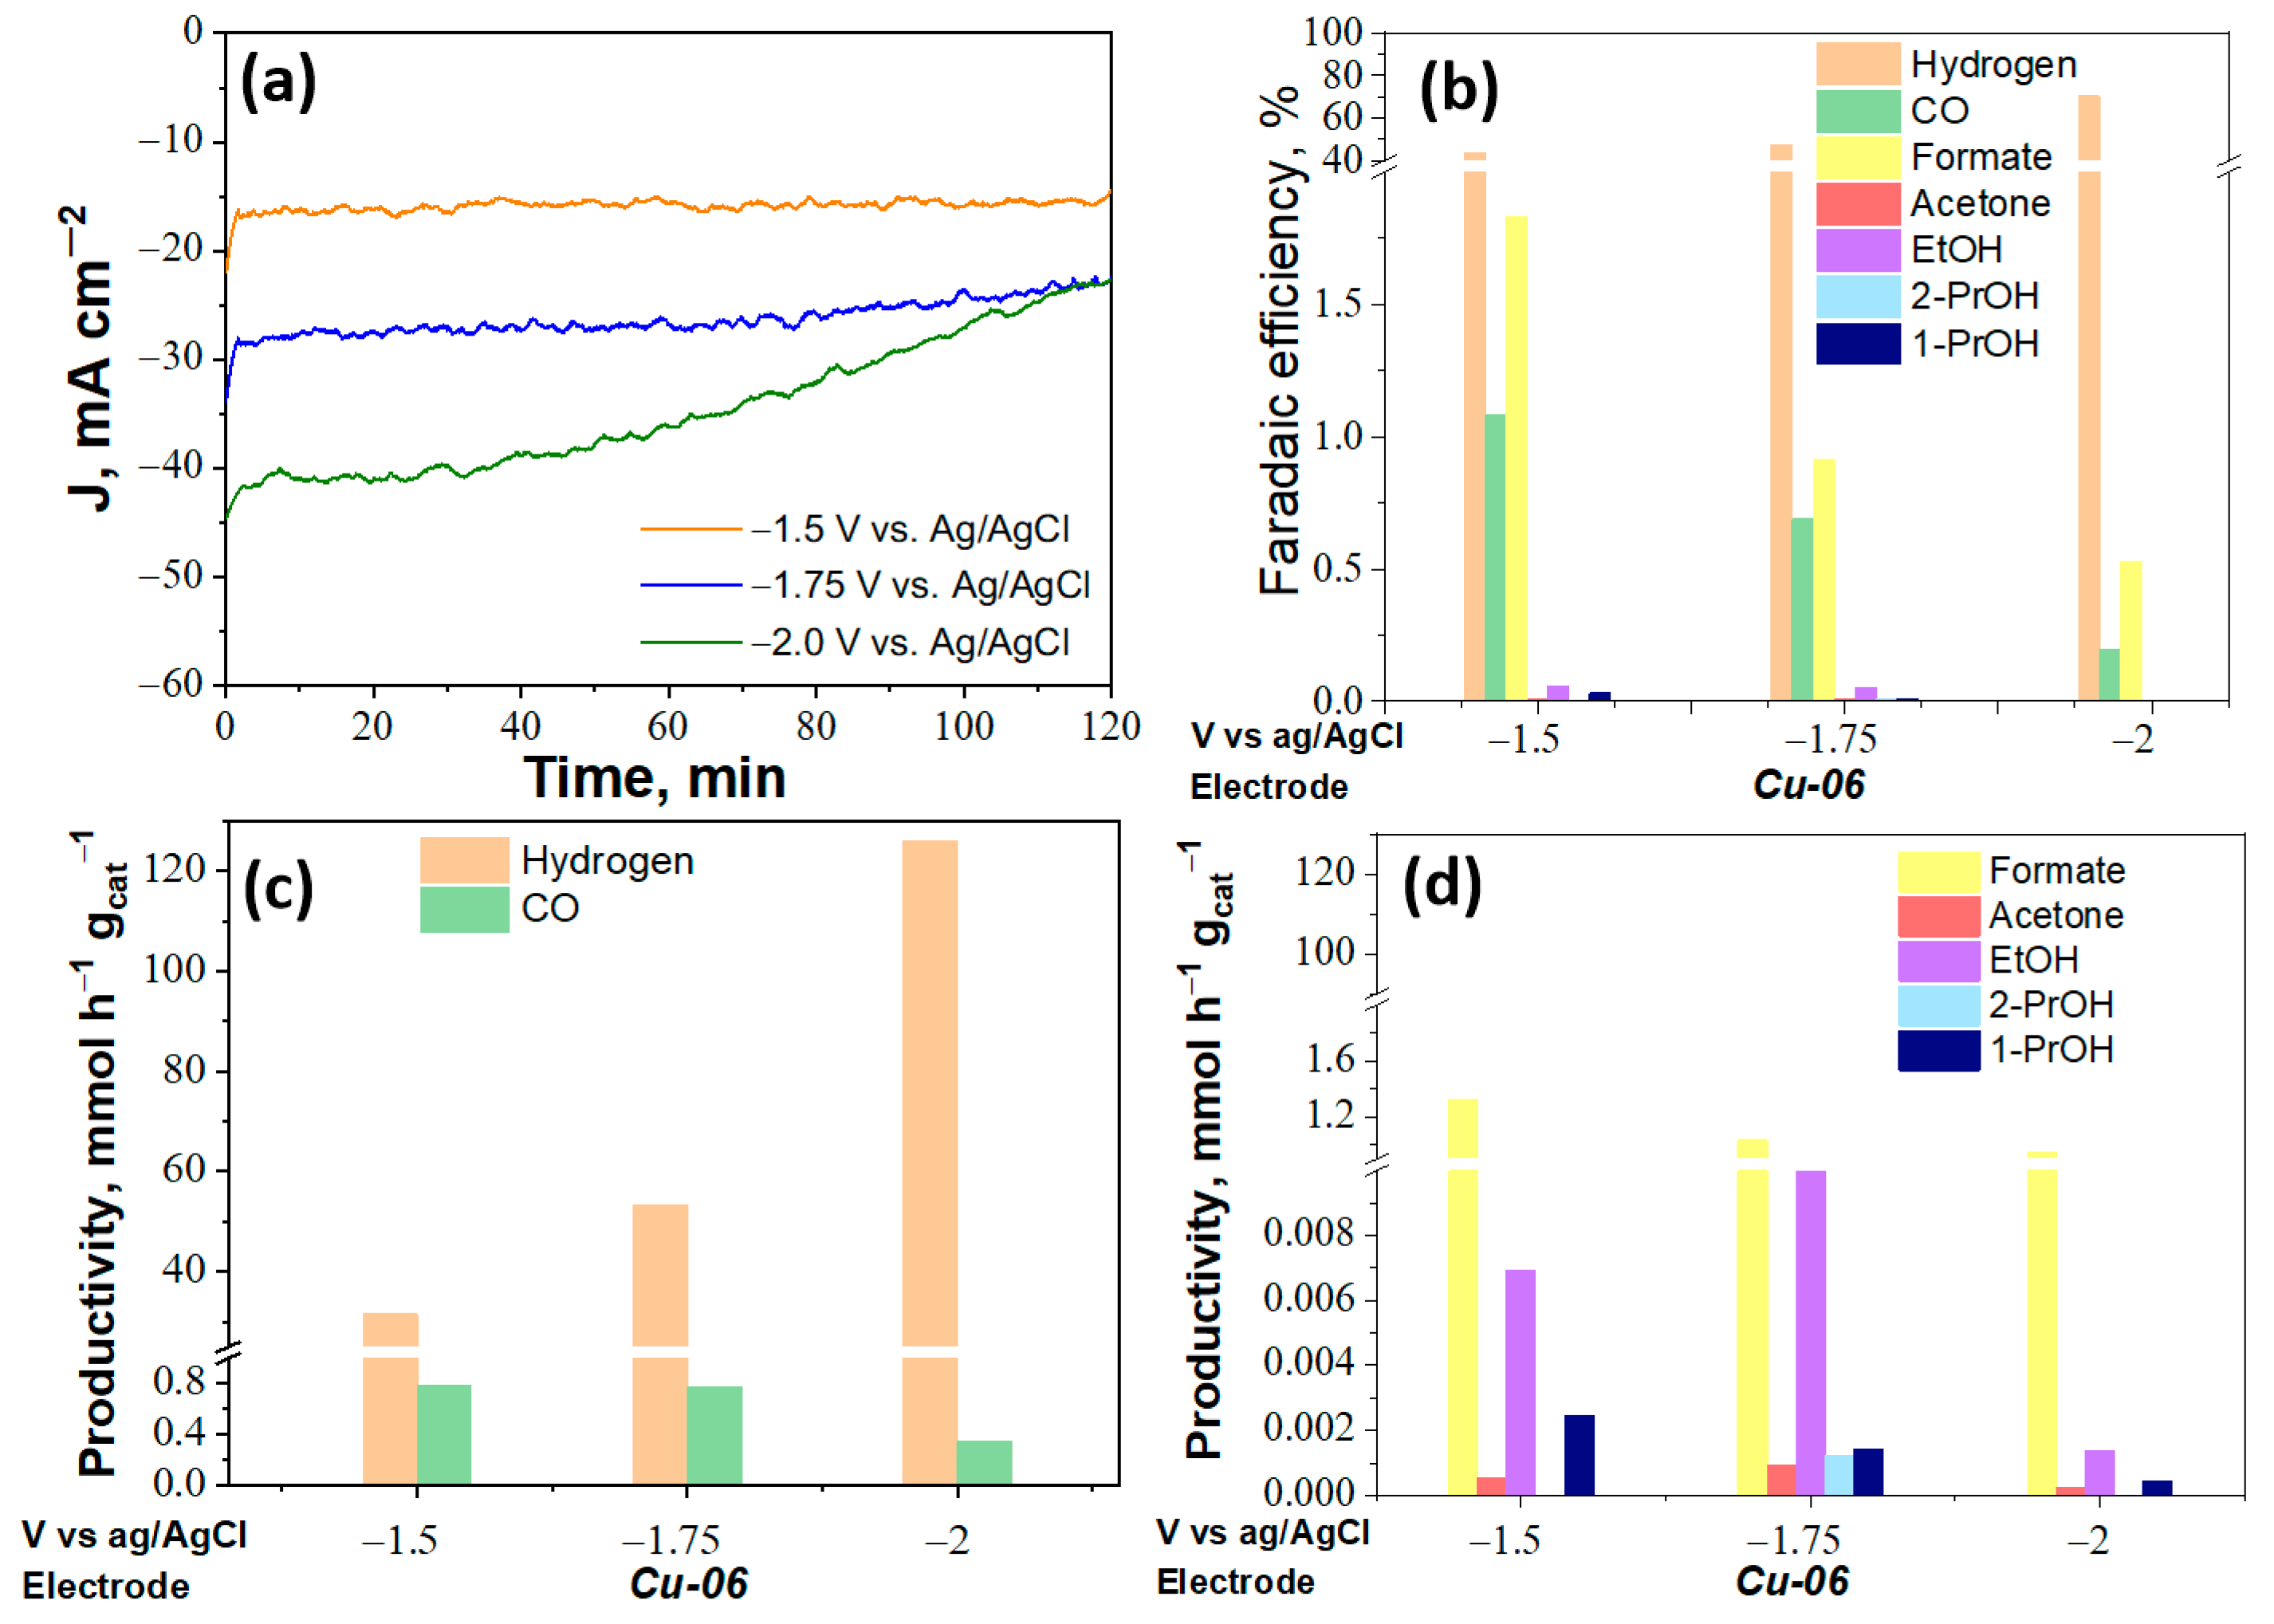
Figure 3 shows the results for the Cu-06 catalyst tested in 1 M KHCO3 at different applied potential values (−1.5 V vs. Ag/AgCl, −1.75 vs. Ag/AgCl, −2 vs. Ag/AgCl). Figure 3a shows the stability of the Cu-06 electrode during the continuous CO2 co-electrolysis test under constant potential mode (chronoamperometry). As expected, the obtained current density increases with the applied potential. These results reveal that higher potentials seem to compromise the stability of the electrode. Indeed, after ca. 50 min of testing at −2 V vs. Ag/AgCl, the current density decreased by about 12% and reached the same value of the test conducted at −1.75 V (i.e., −29 mA cm−2).
In Figure 3b of the same figure, the FEs are reported. It can be observed that H2 and CO formation varies disproportionately with the applied potentials. Particularly, CO and formate formation decreases at the most negative potential (−2 V vs. Ag/AgCl) and the production of alcohols, like ethanol and 1-propanol. Besides, the highest FE to H2 is reached at −2V vs. Ag/AgCl. This behaviour indicates that the side reaction (HER) is favoured at high applied potentials instead of C2+ products. This finding is not in agreement with what was claimed by Lv et al., namely that C-C coupling should be promoted at high overpotentials through the further conversion of surface bond CO, while HER should be suppressed [25]. Indeed, at −2 V vs. Ag/AgCl, the productivity is two orders of magnitude higher for gas products than for liquids (see Figure 3c,d). The productivities confirmed the already displayed trend of the FEs: CO, formate, ethanol and 1-propanol production increase while the hydrogen production decreases at lower negative applied potentials.
The previous results can be explained by managing the transport of the gaseous products (CO, H2) and reactant (CO2) through the GDE, which is a challenge during the tests at high applied potentials [18]. The gas bubbles generation and accumulation could block the active sites because of mass-transfer limitations. Here, the employed carbon support does not have the most suitable porosity for allowing the gaseous products to rapidly exit from the catalytic layer while achieving high production rates. The use of other types of supports, for instance, Polytetrafluoroethylene (PTFE) membrane, can be considered in this respect [26]. Furthermore, the influence on observed liquid perspiration performance should also be considered [27]: to prevent salts (i.e., bicarbonate, carbonate) deposition on the catalyst surface, which causes the blockage of active sites, the liquid crossover must be efficiently controlled. Moreover, perspiration itself can hamper the efficient diffusion of CO2 throughout the pores. Minimisation of the flooding can be accomplished by altering the composition of the electrode (e.g., by varying the catalyst, its loading and/or the binder content). To confirm this hypothesis, further tests with different catalysts and ink compositions were done at the applied potential that shows the highest FE to CO2 reduction products (i.e., −1.5 V vs. Ag/AgCl).
The work done by Duarte et al. was inspirational for us to elaborate on some of the obtained results further. Indeed, they devised a potential screening of the catalyst to distinguish between a mass-transfer limited region and a not affected one by comparing two different operating modes (diffusive regime vs. convective regime) [28]. Testing their Ag-based GDEs at different cathodic potentials in a micro flow cell operated in a flow-by mode (as in our case), they observed that the partial current density towards CO (JCO)—only CO and H2 were produced at significant rates—increases between −1.6 and −2.2 V vs. Ag/AgCl, achieving a plateau when the latter potential value was surpassed. Hence, for higher potentials than −2.2 V, the cell worked at a mass-transfer controlled rate.
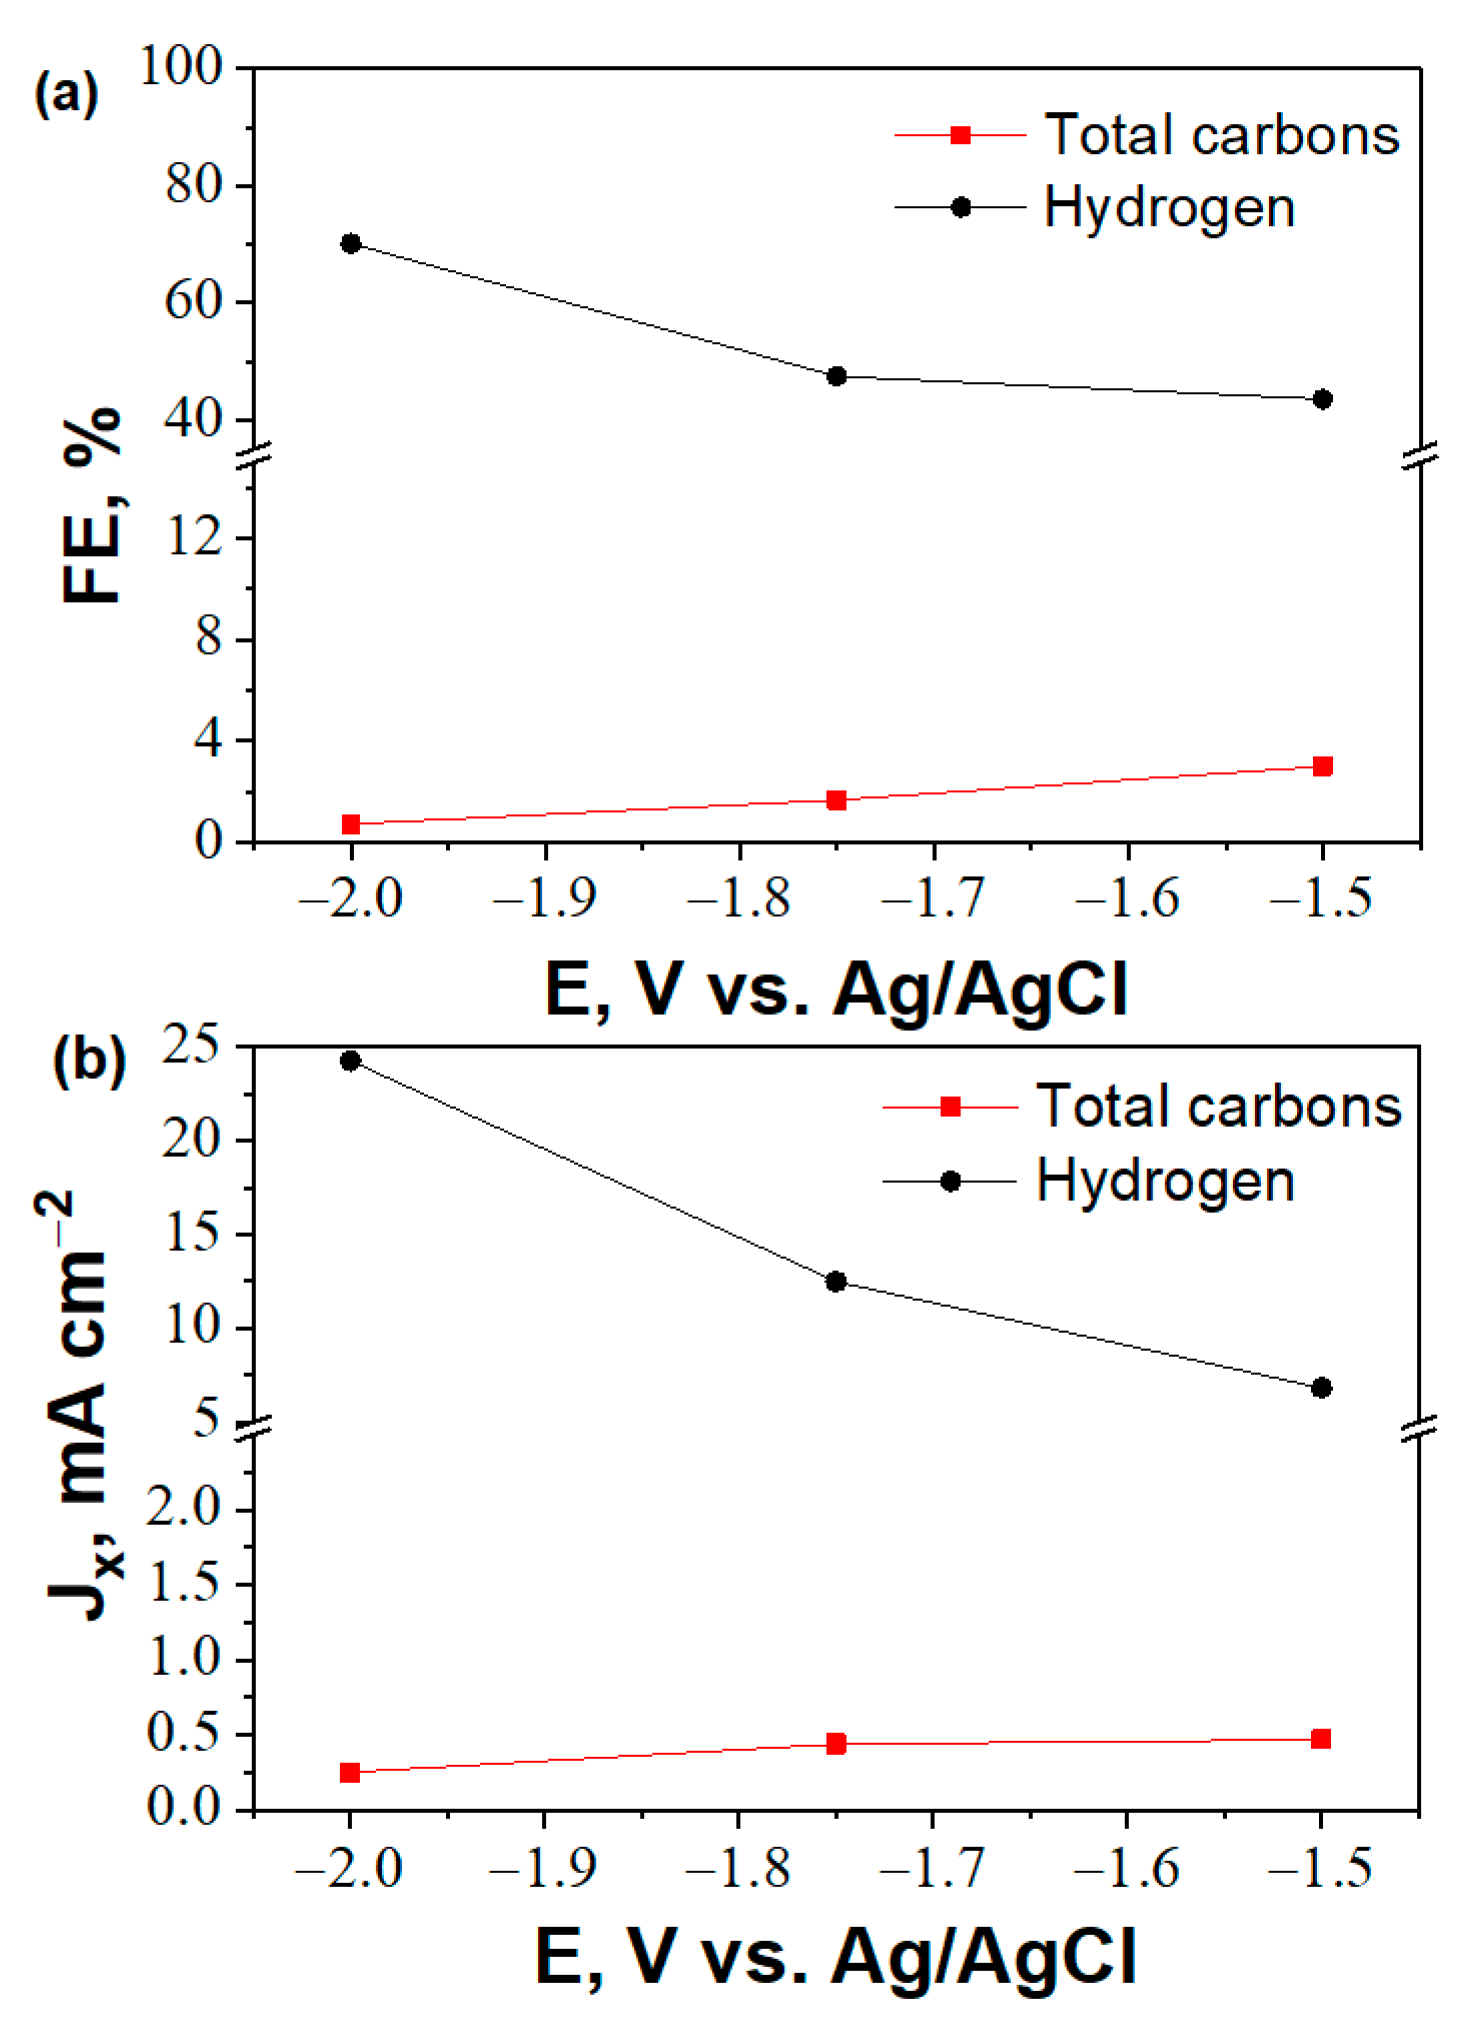
Therefore, a similar evaluation was carried out based on the Cu-06 catalyst results. At potentials more negative than −1.5 V vs. Ag/AgCl (see Figure 4), the Cu-06 catalyst is more selective towards the HER, which indicates that the evaluated region might be mass transfer limited. The decrease of the total carbon partial current density (mainly constituted by CO production) and the increase of the H2 partial current density could confirm the low concentration of CO2 under operating conditions.
On the other hand, it would be useful to consider the influence of catalyst loading and Nafion binder loading on the GDE performance. As suggested by Duarte et al. [28], this study should be realised in a region of conditions where mass-transfer limitations can be excluded. Therefore, in our case, the catalyst and Nafion binder loading effects were evaluated at −1.5 V vs. Ag/AgCl, as shown in Section 2.3.3 and Section 2.3.4.

2.3.2. Comparison between the Different Studied Catalysts

Figure 5a shows the very stable chronoamperometry responses of the CuZ and CuZA GDEs. The CA obtained for the Cu-06 was included for comparison. In agreement with the LSV measurements (Figure 5b), these data show that the current density values are similar to that reached by the Cu-06 catalyst (~17 mA cm−2) at −1.5 V vs. Ag/AgCl. At this applied potential, the addition of ZnO and Al2O3 does not promote the catalytic activity; however, to evaluate the productivity of CO2 reduction products, it is important to evaluate the selectivity (FEs).
Figure 5b compares the FEs obtained with the different catalysts tested at the same potential value of −1.5 V vs. Ag/AgCl. The FE towards H2 and CO decrease in the following order: CuZA-06-03-01 > CuZ-06-03 > Cu-06. This trend is also confirmed in Figure 5c by the productivity of the gas products. At the same time, it should be observed that CO is the second product in terms of FEs, except the Cu-06 catalyst, for which a slightly higher FE towards formate than CO must be highlighted. Moreover, the FEs to all CO2 reduction products is below 10%. In this sense, Gutiérrez-Guerra et al. suggested that a low concentration of CO2 at the catalyst surface may be regarded as responsible for the high kinetics of the hydrogen evolution reactions [29]. Therefore, the observed phenomenon can be considered a warning about the not proper diffusion of CO2 within the gas diffusion electrode, and hence of not proper functioning of the cell.
Figure 5d shows the high productivity of the Cu-06 and CuZ-06-03 catalysts towards CO2 reduction liquid products than of the CuZA-06-03-01 catalyst. When copper was synthesised in combination with ZnO (CuZ), higher selectivity and productivity towards 2-propanol (C3+) can be highlighted than with the Cu-06. Instead, the Cu-06 material is more selective for ethanol.
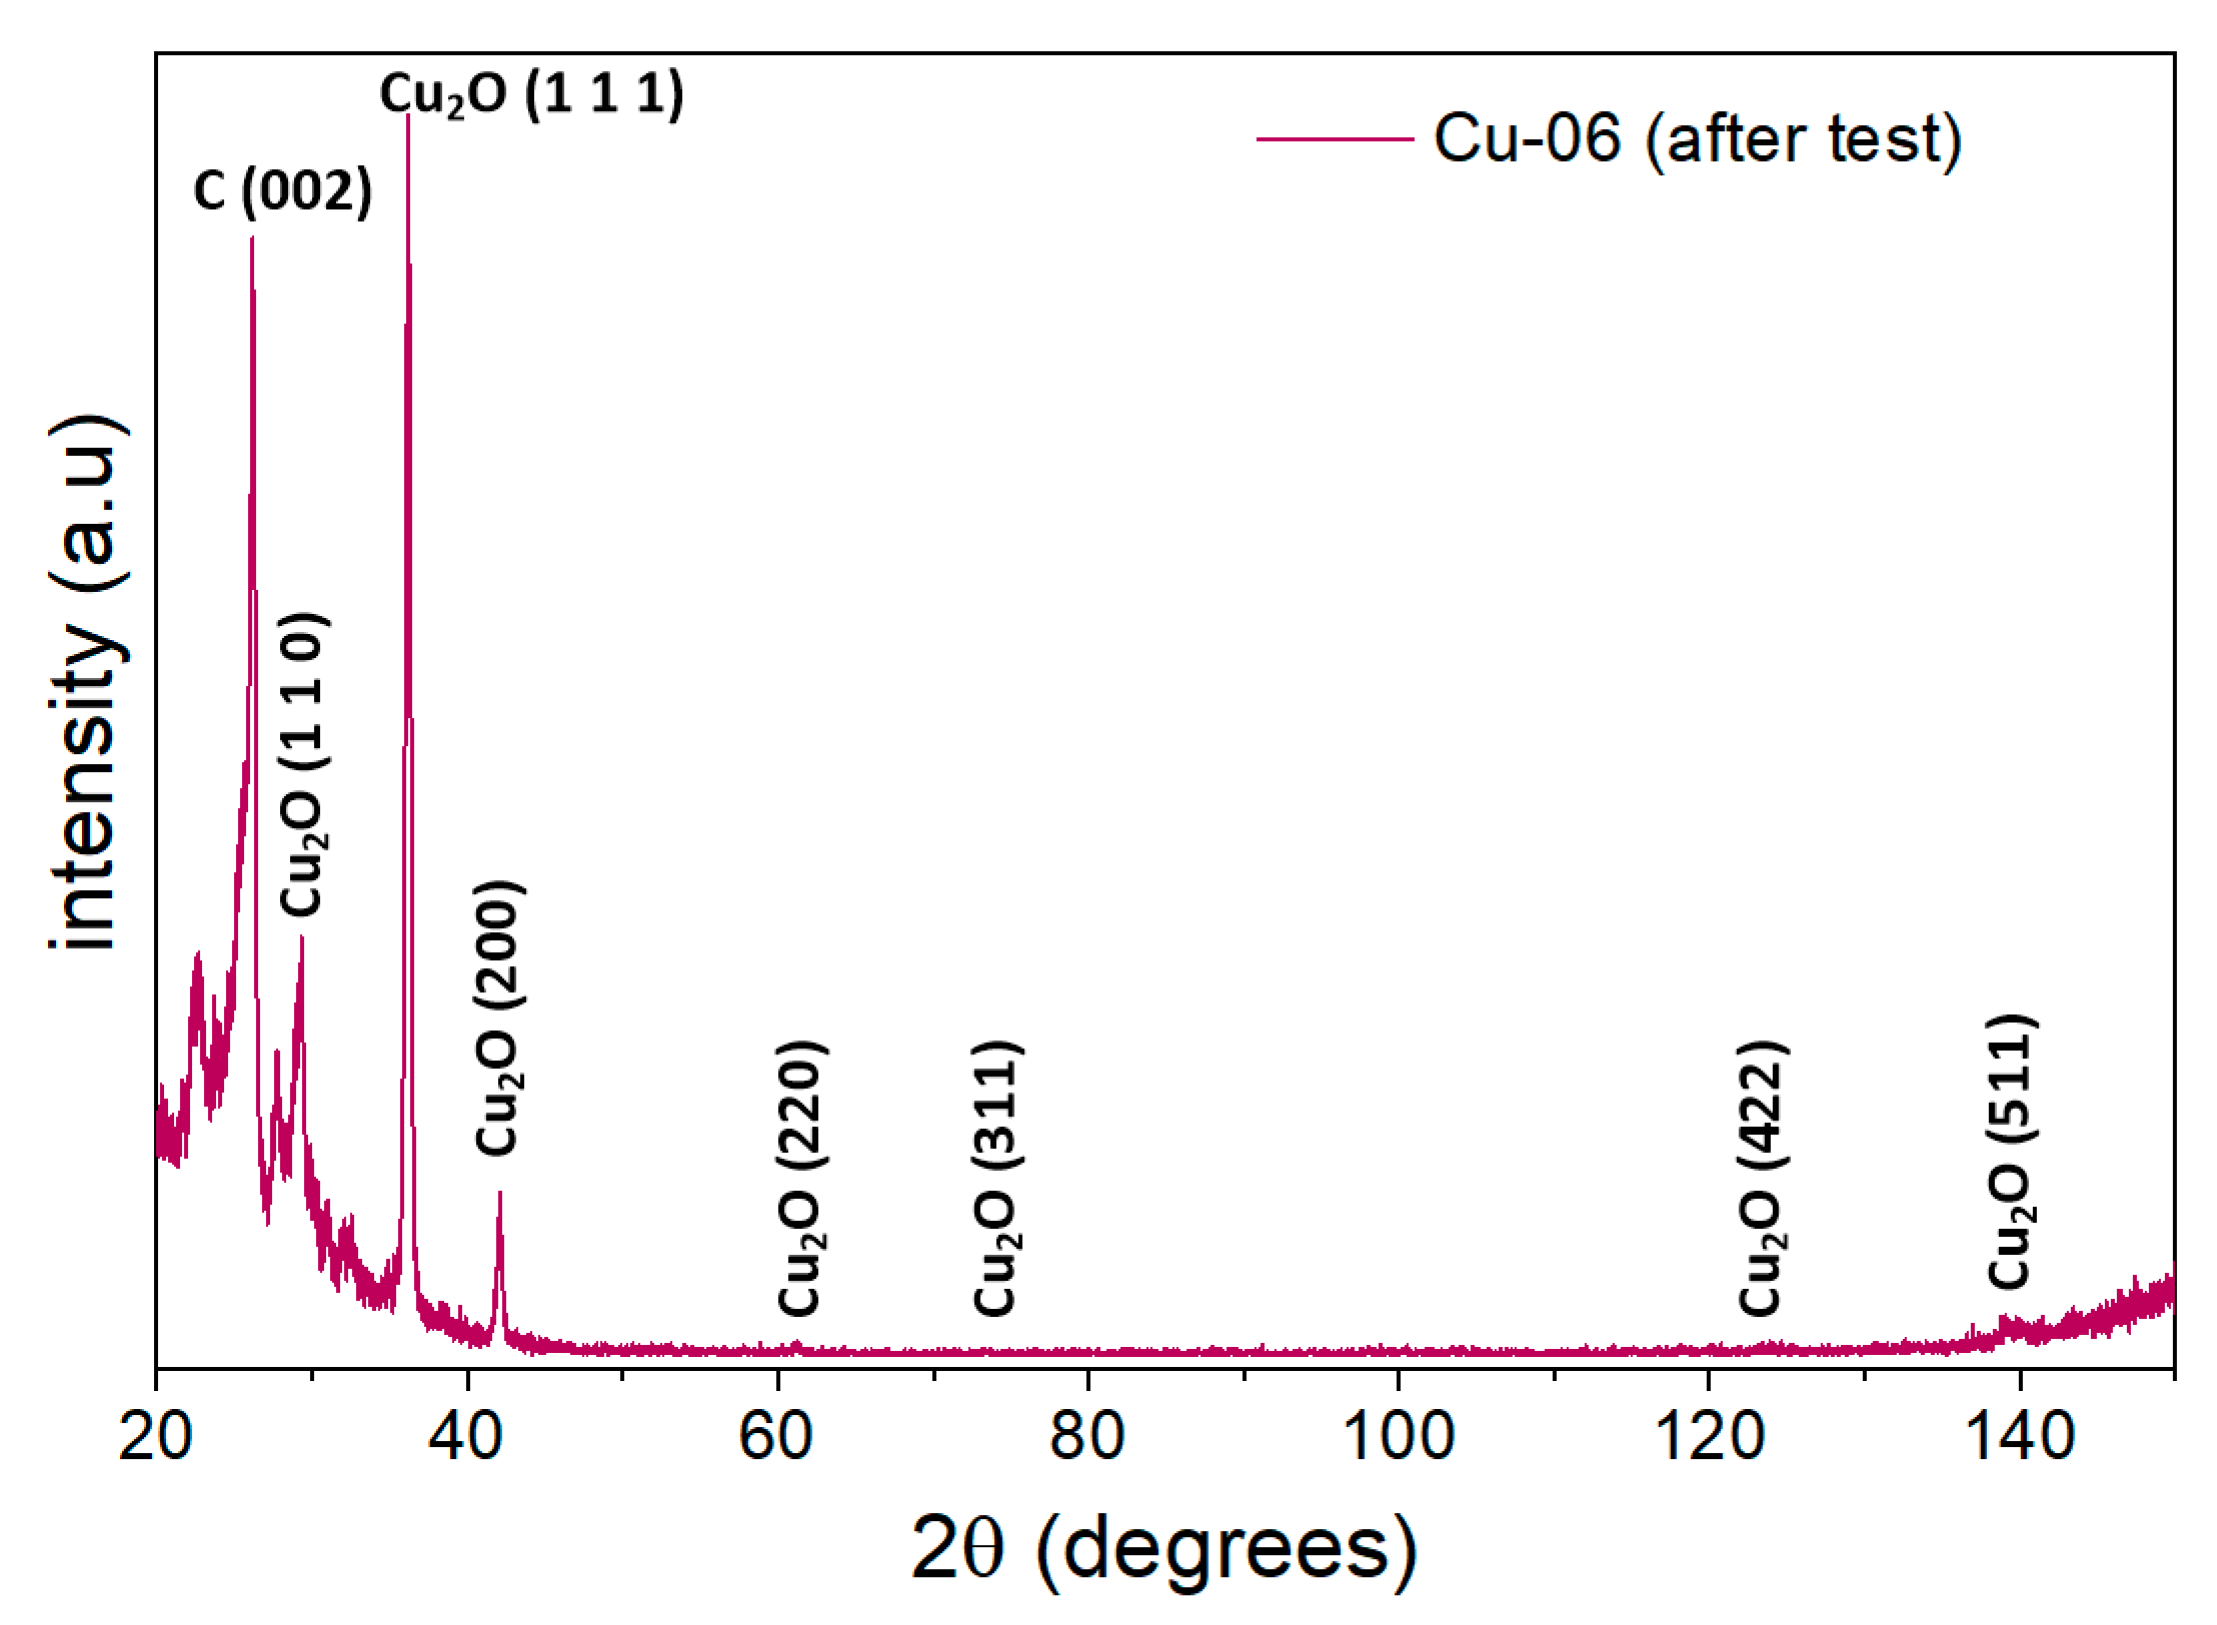
Ex-situ XRD characterisation was performed on the Cu-06 tested electrode to study the generated oxide-derived-Cu (e.g., Cu2O) under the here employed CO2 electroreduction conditions. The analysis demonstrated that the crystalline phase composition has changed during the test, as shown in Figure 6. The CuO (Cu2+) was entirely reduced to Cu1+ [30]. The diffraction peaks in the XRD graph belong to Cu2O (JCPDS number: 00-050-0667) and Graphite (JCPDS number: 00-041-1487) crystalline phases. There are some unknown peaks at 22.65°, 28.02°, and 32.45°, which could be attributed to some carbonate species deposited on the catalyst surface since, after testing, the electrode surface presented a greenish-white colour. It is plausible the CuO transformation to copper(II) hydroxy carbonates (malachite or azurite) during the electroreduction of CO2 in water, as reported in the literature [31]. Thus, the results demonstrated that the formation and in situ stabilisation of Cu1+ contributes to improving the selectivity to more reduced CO2 reduction products, like ethanol and 1-propanol, that were found with this oxide-derived copper [32].
By focusing on CuZA-06-03-01 and CuZ-06-03, a greater CO and formate production can be noted in the former case. Three possible reasons for this behaviour are here proposed. First, it might be associated with a significant role played by aluminium oxide in decreasing the binding energy for *CO. Thus the *CO could be easily desorbed as a CO molecule [33,34]. Second, the catalytic layer with the here employed catalyst loading could be not suitable to allow the proper products diffusion and *CO retention time to be able to reduce the barrier of the rate-determining steps (RDS) for the generation of C2+ products: *CO + *H → *CHO or/and the *CO dimerization [35]. This aspect, in particular, reaffirms the need to assess the effect of the catalyst loading on the GDE performance. Lastly, it could be further observed that Cu crystallite size higher than 15 nm (as in the case of the Cu-06, see Table S3) favours multicarbon oxygenates, which is consistent with previous studies [36,37]. On the other hand, CO and H2 are favoured on smaller Cu particles (<9 nm), as it is the case for the catalysts containing ZnO and Al2O3.

2.3.3. Effect of Catalyst Loading

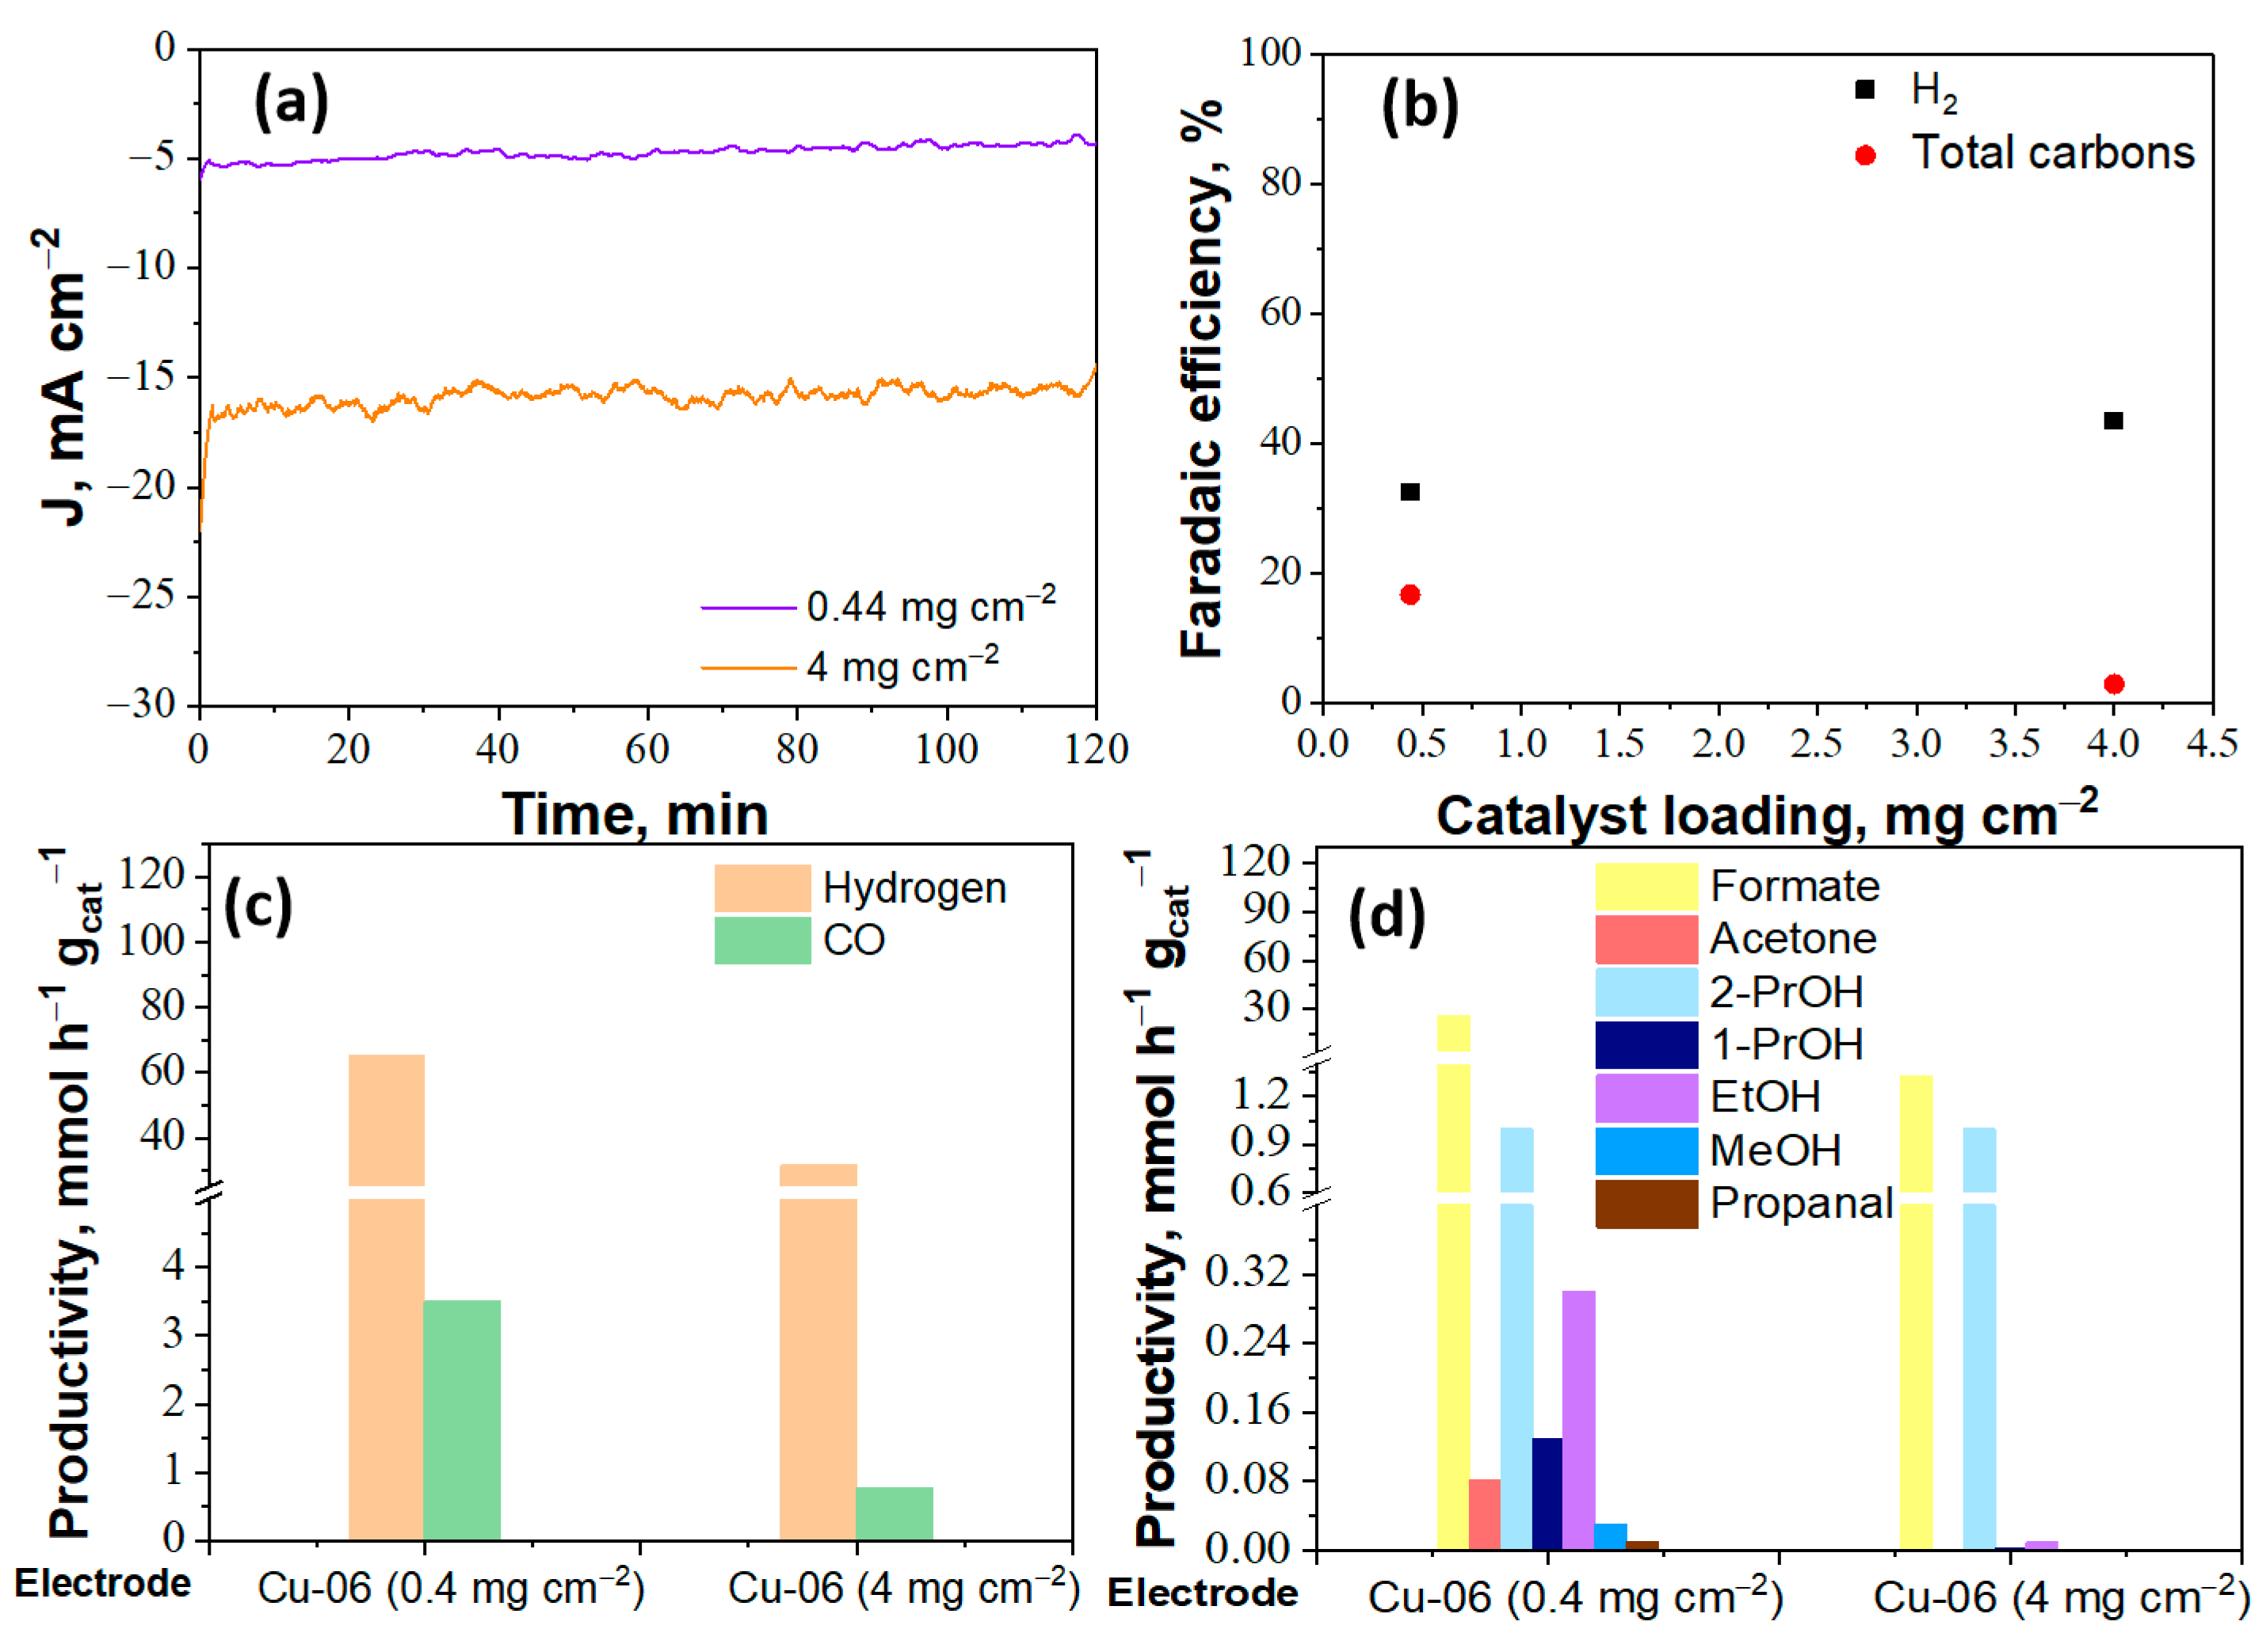
Given the good performance of the Cu-06 catalyst, with which the formate and ethanol production was increased, and H2 was decreased, further tests were performed with this catalyst. In this sense, the effect of a reduction in the catalyst loading was evaluated. Figure 7a shows the result of the potentiostat measurement for the Cu-06 with a lower catalyst loading of 0.44 mg cm−2, in comparison to the result obtained at 4 mg cm−2, at the same applied potential (−1.5 V vs. Ag/AgCl) and electrolyte (i.e., 1 M KHCO3). A significant decrease in the generated current densities can be observed: although this finding is distant from the commercially needed current densities, further investigations are required to give conclusions about the activity and stability of this catalyst.
In particular, higher FEs (Figure 7b) are observed towards CO2 reduction products with the lower catalyst loading case (0.44 mg cm−2), which are reflected in an increase in the productivity of CO and formate, but also in the generation of other liquid products. Therefore, by comparing these values, conclusions can be drawn about the activity. In this regard, Cu-06 GDE loaded with 0.44 mg Cu cm−2 and tested at −1.5 V vs. Ag/AgCl was the most active electrode towards formate production, as well as it was the only case where production of different C1 to C3 products like methanol, ethanol, acetone, 1- and 2-propanol and propanal were visible, as shown in Figure 7d. Two hypotheses have been advanced concerning the better results obtained with a lower catalyst loading: on the one hand, the reactant diffusion towards the active sites (and, consequently, the counter diffusion of the products) may be promoted by reducing the catalyst-layer thickness; moreover, a lower catalyst loading may lead to a lower increase of the local pH, which translates in a reduced formation of (bi)carbonate species, as it will be discussed in Section 2.4.

2.3.4. Effect of Nafion and Electrolyte Concentration

The results obtained with the Cu-06 catalyst deposited in the GDE with a variation of the Nafion concentration in ink (from 15%wt to 45%wt) are discussed in the following. In the light of the better CO2R performance [38] and less favoured H2 production [39] with solutions of low KHCO3 concentration, a more diluted electrolyte was employed at this stage of the work. Knowing that each factor plays a role in the activity and products distribution of the reduction process, it was found to be reasonable to use an intermediate catalyst loading of 2 mg cm−2 to carry out the tests at the same applied potential (−1.5 V vs. Ag/AgCl) and in a 0.1 M KHCO3 electrolyte. In the case of Nafion at 45%wt, a slightly lower current density was recorded (−2.1 mA cm−2) than for the other cases (−2.25 mA cm−2 at 30%wt, −3.5 mA cm−2 at 15%wt), as it could be expected if a decrease in the number of exposed active sites is prevalent due to the high Nafion content. These results agree with recent studies that demonstrated an optimal binder loading in the range between 11%wt and 20%wt [40], by which an optimal balance between ionic conductivity, pH, available active sites and electrons conductivity can be found.
The results of FEs and productivities are displayed in Figure 8. Switching to a lower catholyte concentration and a lower Nafion content than the previous tests led to unexpected data. A higher FE to CO than to H2 was obtained with 15%wt Nafion. A consideration of the relative ratio of CO and formate should be done. Indeed, the increasing of Nafion loading to 30%wt and then to 45%wt seems to favour the formate and C2+ alcohols (i.e., ethanol, 1- and 2-propanol) production over the CO. Thus, it is clear that the Nafion content has a role in altering the course of the CO2 reduction reaction under this conditions. Its interaction with the catalyst nanoparticles probably contributes to decreasing the energy barrier of the RDS: *CO + *H → *CHO and the barrier to the coupling of *CO intermediate, promoting more reduced products.
For an efficient CO2 reduction, an optimal balance needs to be searched among the electroactive surface area, the ionic conductivity and the hydrophilic/hydrophobic properties of the catalyst layer [41]. The study of the effect of the ionomer content was undertaken in this experimental work. A Nafion content of 15%wt maximises the FE and current densities towards carbon products (mainly formate and CO). In literature, a dependence on the Nafion content of the electrode performance is demonstrated. Zhou and co-workers reported an optimal loading of 20%wt in terms of FE and current density for an Sn-based electrode [42]. The obtained results can be used as a starting point for future optimisation of the catalyst layer preparation on GDEs.
The XRD patterns of the Cu-06 electrode with 45% of Nafion (after test) is shown in Figure 9. The diffraction peaks in the XRD graph belong to Cu (JCPDS number: 00-04-0836), Cu2O (JCPDS number: 00-050-0667), and Graphite (JCPDS number: 00-041-1487) crystalline phases. It evidences the reduction of the CuO catalyst to Cu1+ and Cu0 under the here employed CO2 co-electrolysis conditions. The increase of Nafion content to 45% stabilises the Cu1+/Cu0 interface, contributing to the dimerization of *CO adsorbed intermediate to promote C2+ products. It agrees with previous literature works that have revealed that it is possible to induce C-C coupling if this interface is stabilised [43,44]. Besides, it is possible to realise that the selectivity towards alcohols is 19-fold higher in this case (2% FE ethanol) than for the same catalyst (Cu-06 at 4 mg cm−2) with 30% of Nafion and at the same applied potential (see Figure 5). By comparing Figure 9 and Figure 6, conclusions can be drawn about the selectivity. The coexistence of the oxide-derived copper (Cu1+) and Cu0 in the bulk could be responsible for the improved selectivity to C2+ products. Simultaneously, the H2 productivity was decreased by ~3-fold (from ~30 to 8 mmol h−1 gcat−1) by increasing the Nafion content from 30% to 45%, which could be also attributed to the presence of high-index facets of Cu, such as (400), (331), and (420). Indeed, in a recent work, Philip et al. [45] have demonstrated the suppression of H2 evolution due to the increased amount of these high-index Cu facets.

2.3.5. Considerations about the Obtained Results

Some considerations about the apparent inconsistency of some results should be done. Indeed, as can be observed, in some cases, the overall FE exceeds 100%, while, in other cases, this value is less than 50%. It has also been observed in previous studies by different authors [46,47]. A possible cause could be the experimental uncertainty in measuring the inlet and outlet real flow rates of the gaseous streams. A slight variation of these values might significantly impact the processed data, with particular reference to the efficiencies beyond 100%. When FE is far below 100%, a possible reason may be the oxidation of liquid products that travel to the anolyte through the membrane. As suggested by Gabardo et al. in their work, a control experiment based on the verification of the oxidation levels of possible products in the anolyte can be performed [48]. Otherwise, analysing the distribution of the liquid products in the two liquid chambers of the flow cell would allow having important qualitative information. Relative to the latter case, traces of formate were detected in the analysed anolyte sample collected after the electroreduction test of the Cu-06 based GDE with a Nafion loading of 30%wt.
Copper oxides have been proposed to play an important role in the electrochemical CO2 conversion due to their high-surface-area structures, rough morphology, and large defect density. They also can lead to changes in the local pH [30,32,36,49] When negative potentials are applied under CO2 flow, these oxides would be entirely or partially reduced to Cu1+ and/or Cu0, producing nanostructured Cu during the in-situ transformation [30]. It has been demonstrated that these copper species (Cu1+ and Cu0) are the active catalyst species for the CO2 reduction reaction [32]. Instead, Kas et al. [50] suggested that the Cu2+ surface itself is not the active catalyst species in the electrochemical CO2 conversion. For this reason, the authors suggest that the presence of Cu2+ could explain the higher H2 evolution reaction selectivity [51], whereas the presence or more reduced Cu species lead to the gaseous CO production.
The better performances showed by Cu-06 catalyst may be further related to a higher presence of Cu0 and Cu+1 species on the surface than on the other two catalysts (CuZ-06-03 and CuZA-06-03-01), as reported in the table in Figure S3 from the XPS investigation and as observed from the ex-situ XRD analyses of the GDEs after the tests (Figure 6 and Figure 9).
A general outcome is that gaseous products are favoured despite the liquids of more interest. This observation reflects the complexity and the slow kinetics of multi-step reactions, which require CO2, electrons and protons to be available in a correct stoichiometry at the three-phase boundary of the GDE. Moreover, the role of pH must be kept in mind: in this sense, ions and products crossover through the proton exchange membrane might cause the pH of anolyte and catholyte to vary continuously, thus negatively affecting the CO2 reduction reaction performance [52]. However, a deficiency in CO2 concentration on the catalyst layer is the most plausible hypothesis in the present study.

2.4. Effect of Local pH

In this work, a reaction-diffusion model was used to predict the pH in the vicinity of the electrode surface and the trends of the involved species.
In their work, Lv et al. [25] found a strong correlation between the production of C2+ products and calculated surface pH, which is consistent with the hypothesis that near OH favours C-C coupling. However, from the analysis of our results, it seems that the production of liquid products is correlated to a lower increase of the surface pH. Indeed, the two best results in terms of FE and productivity towards liquid compounds correspond to the lowest calculated surface pH values, that is 8.93 and 9.05 (Table 1). Therefore, in our specific case, a higher pH on the electrode surface may be regarded as responsible for promoting the hydration of CO2 to carbonate and bicarbonate species, thus reducing CO2 concentration at the triple-phase boundary and negatively impacting its conversion to “more complex” multicarbon products. These findings demonstrate that pH can determine the course of reactions in different ways.

3. Materials and Methods

3.1. Materials

Copper (II) nitrate trihydrate (CuN2O6·3H2O, 99–104%), zinc nitrate hexahydrate crystallised (Zn(NO3)2·6H2O, ≥99.0%) and aluminium nitrate nonahydrate (AlN3O9·9H2O, ≥98%), and sodium Carbonate (Na2CO3, ≥99%) were used in the preparation of the catalysts. Potassium bicarbonate (KHCO3, 99.7%) was used as electrolyte for the electrochemical tests. Nafion perfluorinated resin solution Green Alternative (5 wt.% in lower aliphatic alcohols and water contains 15–20% water and Isopropanol for HPLC ((CH3)2CHOH, 99%) were employed in the preparation of the catalytic ink. All the materials were purchased from Sigma-Aldrich (Milan, Italy), and they were used as received unless otherwise specified.

3.2. Synthesis of CuZnAl-Oxide Based Catalysts

The catalysts employed in our experimental work were CuZnAl-based catalysts obtained by the co-precipitation method. Briefly, the catalysts were prepared with a solution of hydrated metal nitrates (Cu(NO3)2, Zn(NO3)2, Al(NO3)3) as precursors and using a solution of Na2CO3 (1M) as precipitating agent. The CuZA-06-03-01 material constituted by CuO, ZnO, and Al2O3, was synthesised by using the metal nitrates in the following molar concentrations: Cu:Zn:Al = 0.6 M:0.3 M:0.1 M. Then, by using the same concentrations of precursors but deprived of Al (Cu:Zn = 0.6 M:0.3), the CuZ-06-03 catalyst was obtained to assess the contribution of Al. After that, also the Zn was also eliminated to study the role of this metal, resulting in the Cu-06 (0.6 M). More details about the catalyst preparation are given in the Supplementary Material (Section S3). At the end of the co-precipitation, the precipitate was filtered, left drying overnight at 60 °C in an oven and finally calcined at 350 °C for 3 h with a heating ramp of 2 °C min−1. Moreover, the oxidation state of copper species on the surface of the synthesised catalysts and the actual amount of each elements in the studied samples were investigated by means of X-ray Photoelectron Spectroscopy (XPS) and Inductively Coupled Plasma (ICP) techniques and are described in Section S4. However, identify the issues faced when operating a GDE-cell configuration is the main aim of this work.

3.3. Electrochemical Cell and Experimental Conditions

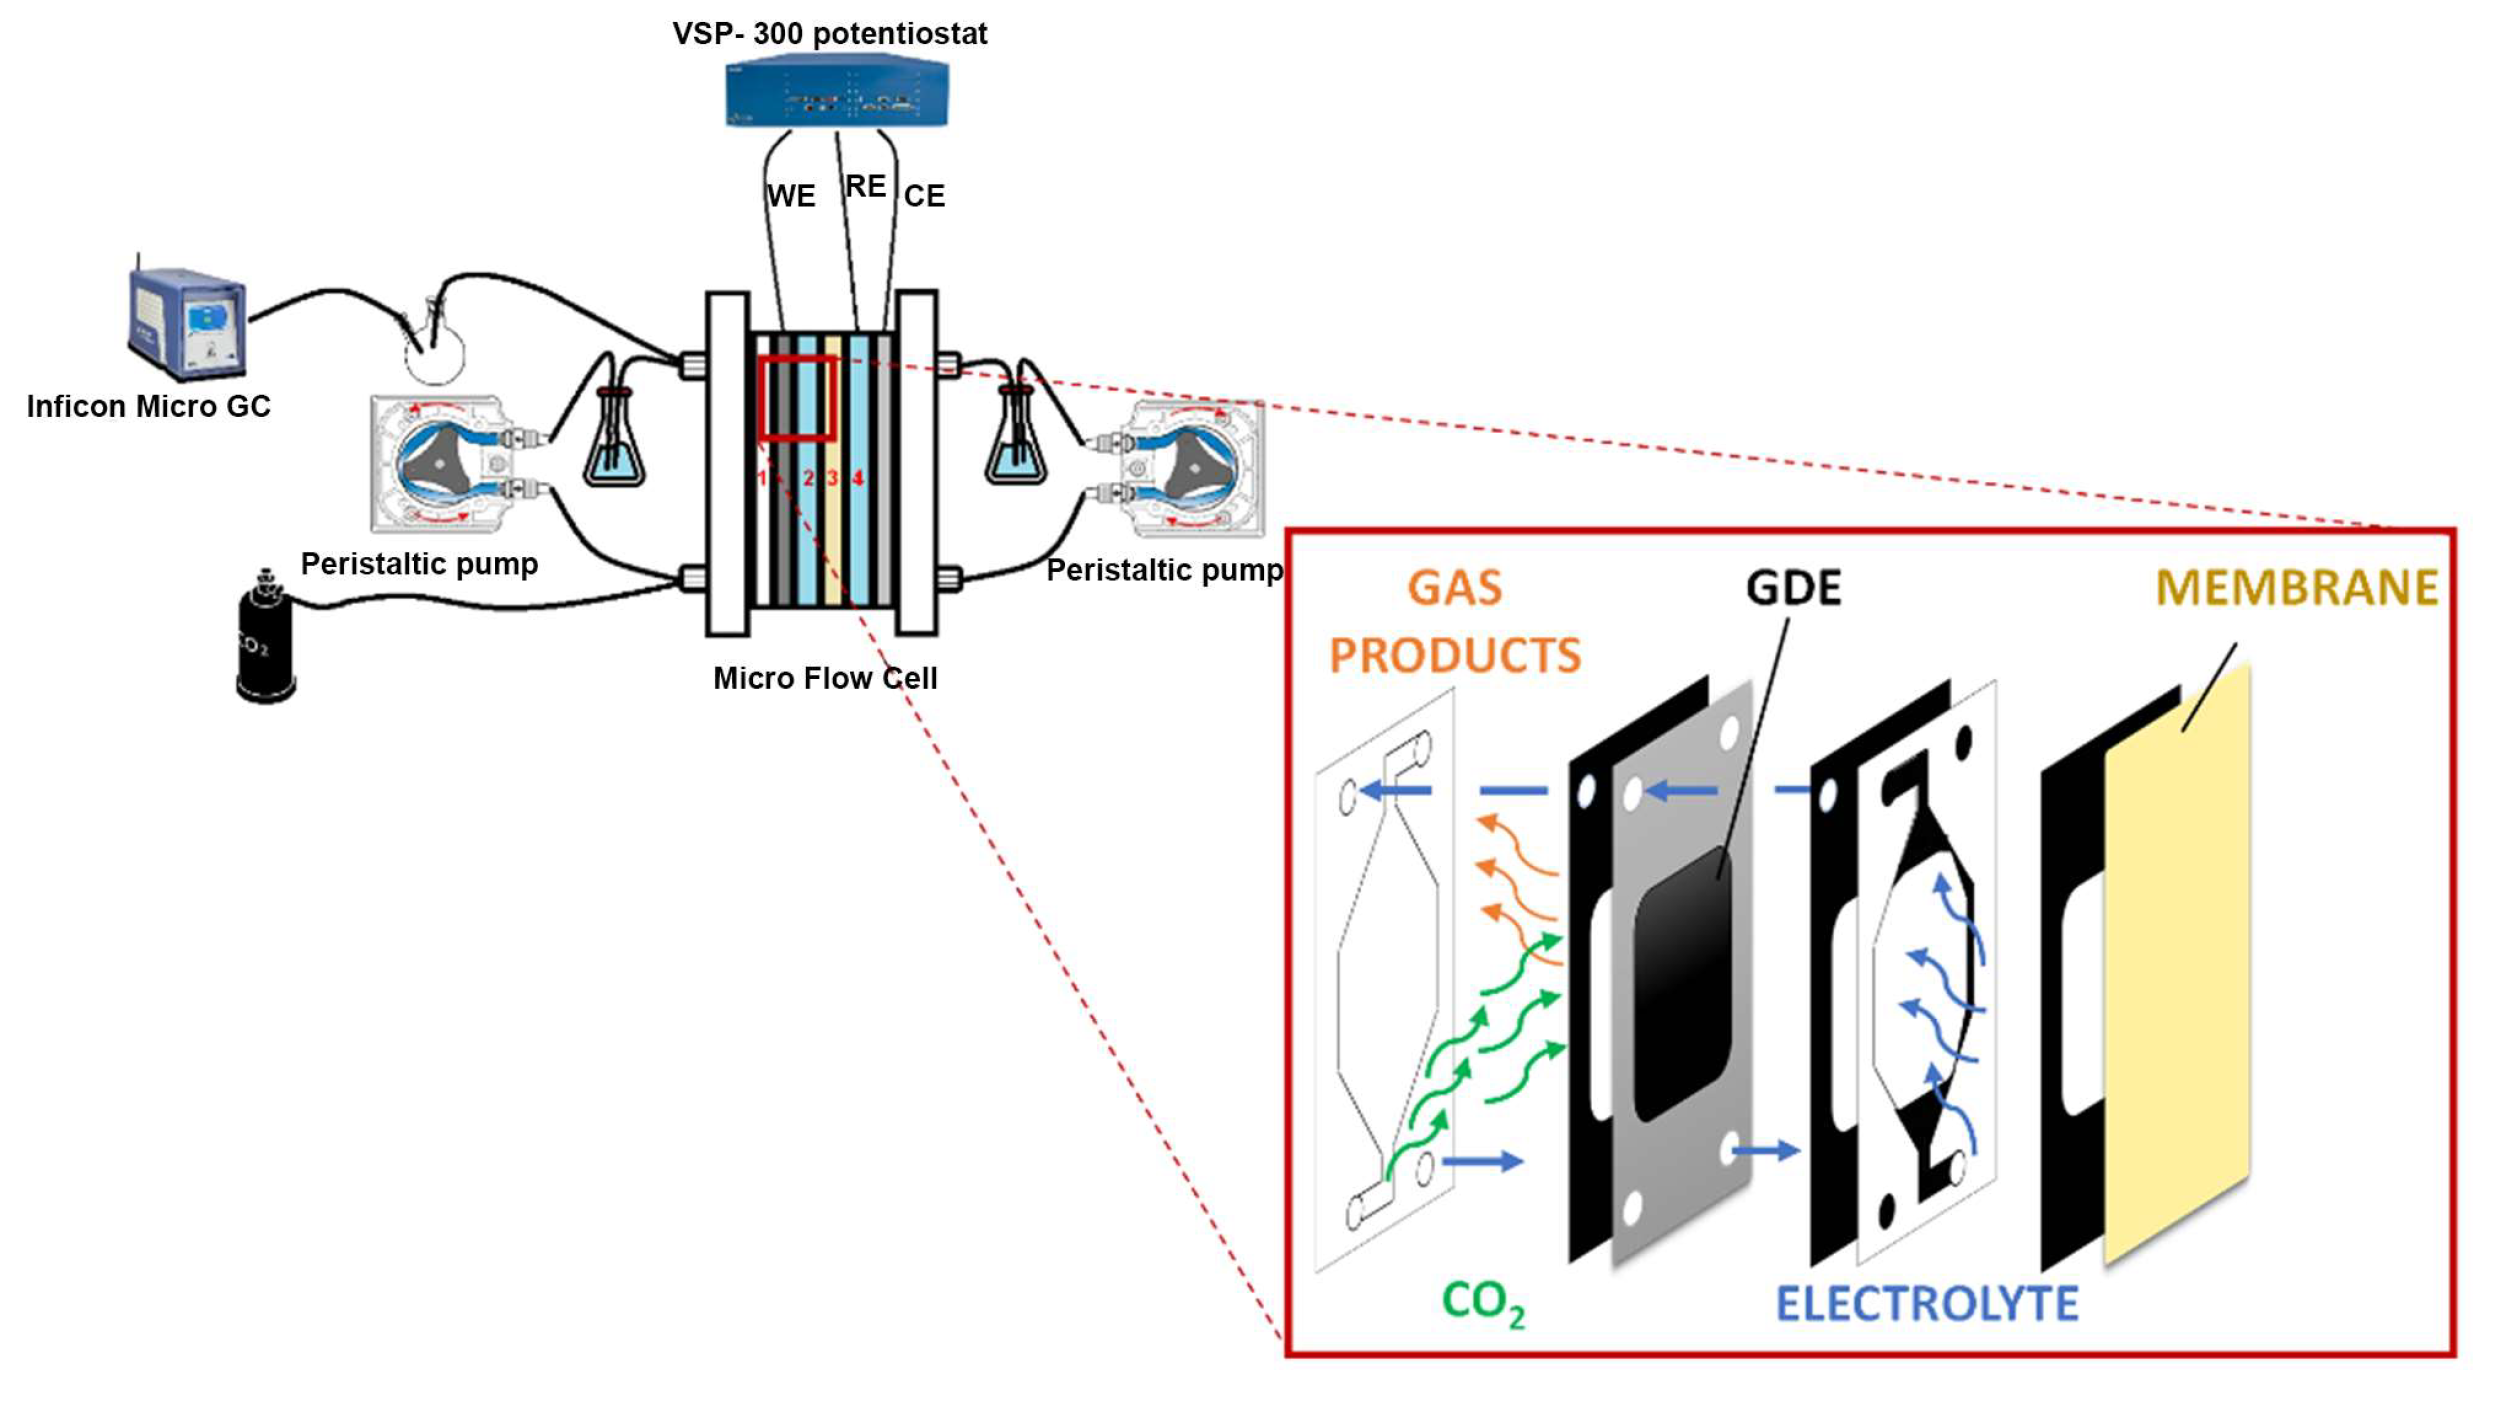
A schematic view of the experimental set-up is shown in Figure 10 to provide an idea of the various involved components. The electrical supply to the Micro Flow electrochemical Cell (by ElectroCell, Tarm, Denmark) was ensured by a Biologic VSP-300 multichannel potentiostat (Bio-Logic SAS, Seyssinet-Pariset, France), which was operated in potentiostatic mode. The electrochemical tests were carried out at ambient conditions in a three-electrode cell configuration. The working electrode (WE) was a Cu-based GDE, while the counter electrode was an Ir-MMO plate, and the reference electrode was a 1 mm leak-free Ag/AgCl (3.4 M KCl). The cathodic and the anodic compartments were separated by a proton exchange membrane (Nafion 117 by Fuel Cell Store, College Station, TX, USA). The electrolyte supply was realised by two peristaltic pumps, with a flux rate of 26 mL min−1 for the catholyte compartment and 12 mL min−1 for the anolyte compartment. The external catholyte and anolyte flasks (0.1 M or 1 M of KHCO3 electrolyte solution) were filled with 30 mL and 35 mL of electrolyte, respectively, and were closed with rubber caps, which served both to isolate the system and to support the connection of the flexible tubes. The gas flow was kept constant via a mass flow controller (EL-Flow Select, PN64 by Bronkhorst High-Tech B.V., Ruurlo, The Netherlands) at 16.29 NmL min−1. The catholyte flow leaving the cell was sent to the external flask and recirculated, whereas, the gas outlet flow was directed to a gas/liquid separation flask, thus allowing the recovery of the liquid that crossed the GDE.
The manufacturing process of the different GDEs was based on the preparation of a catalytic ink and its deposition on porous carbon support (Toray carbon paper 060) by air-brushing. The catalytic ink was based on different components: (i) Cu NPs-based catalysts, in the powder form; (ii) Nafion (dispersion, 5%wt in water and 1-propanol) as a binder for the particles, which is necessary for their adhesion to the GDL; (iii) Vulcan XC 72R Carbon (VC) to improve dispersion and electrons conductivity of the electrocatalyst; (iv) isopropyl alcohol (isopropanol), as a carrier for the ink deposition because the ink must be fluid to be uniformly spread on the area of interest. Each Cu-based GDE was prepared with a geometric area of 10.2 cm2. The deposition process was performed by placing the carbon paper on a heating plate at 120 °C to ensure complete solvent evaporation. A pressure of 1.5 bar for the carrier gas in the airbrush inlet was chosen to have a regular ink flux, avoiding undesired liquid drops. All the electrodes were then kept on the heating plate for 15 min before their usage.
The electrochemical cell was operated at ambient conditions (1 bar, 20 °C). Each GDE was firstly subjected to Cyclic Voltammetry (CV)—both in N2 and in CO2 environment—with an applied potential scanned between 0 and −2.0 V vs. Ag/AgCl until stabilization. Then, the electrochemical behaviour was evaluated with a Linear Sweep Voltammetry (LSV) by applying a potential from 0 to −2.0 V vs. Ag/AgCl. Finally, the electrochemical reduction of CO2 was carried out for 2 h through a chronoamperometry (CA) to evaluate the selectivity of the catalytic materials.
As aforementioned, different catalysts were tested. Three tests were carried out with the Cu-06 catalyst in 1 M KHCO3, specifically at −1.5, −1.75, and −2.0 V vs. Ag/AgCl (the values here specified were corrected by compensating the ohmic potential drop (iR-compensation) by the instrument). Then, the CuZ-06-03 and CuZA-06-03-01 GDEs were tested at −1.5 V vs. Ag/AgCl. Furthermore, the catalyst loading and binder content of the GDE was also studied using the Cu-06 catalyst. Their influence on the electrochemical behaviour of the system was evaluated by performing tests at −1.5 V vs. Ag/AgCl.
The gas products analysis was performed using a micro gas-chromatograph (Inficon, Micro GC Fusion Gas Analyzer by Pollution S.r.l., Bologna, Italy). The liquid products were analysed with a liquid chromatograph (Shimadzu HPLC, Prominence model with detector RID-10A, SPD-M20A, ELSD-LT II and RF-20A by Shimadzu Europa GmbH, Duisburg, Germany) and a Gas Chromatograph (Perkin Elmer GC, model Clarus 580) with a Mass Spectrometer (model Clarus SQ8 S) and Head Space (Turbomatrix 16) by PerkinElmer Italia Spa, Milan, Italy.
The FE of the electron transfer towards the CO2 reduction products was determined by using the following Equation (1):
FE   ( % ) = z   ·   n ˙   ·   F j   ·   A   ·   t   × 100 ,
where z represents the number of electrons exchanged at the cathode surface,   n ˙ is the outlet molar flow rate of each product, j is the current density, t is the reaction time, F is the Faraday constant, and A is the active geometric area.

3.4. Modelling of GDE Local pH

In an aqueous electrolyte, at the triple-phase boundary, OH reacts with CO2 forming carbonates and bicarbonates, thus leading to a complex system involving the transport of these species from the catalyst layer to the electrode/electrolyte interface and the bulk electrolyte, and vice versa [6]. The two major involved reactions are (Equations (2) and (3)):
CO 2 ( aq ) + OH k 1 r   k 1 f HCO 3     with   K 1   =   4.44   ·   10 7   [ 1 / M ] ,
HCO 3 + OH k 2 r   k 2 f CO 3 2 + H 2 O     with   K 2   =   4.66   ·   10 3   [ 1 / M ]   .
The equations governing the mass transport of CO2, OH, HCO 3 and CO 3 2 in steady-state conditions were adopted from previous work [25] and can be written as follows in Equations (4)–(7):
0 = D CO 2 2 [ CO 2 ] x 2 k 1 f [ CO 2 ] [ OH ] + k 1 r [ HCO 3 ] Rxn CO 2 ,
0 = D OH 2 [ OH ] x 2 k 1 f [ CO 2 ] [ OH ] + k 1 r [ HCO 3 ] k 2 f [ HCO 3 ] [ OH ]   k 2 r [ CO 3 2 ] + Rxn OH ,
0 = D HCO 3 2 [ HCO 3 ] x 2 + k 1 f [ CO 2 ] [ OH ] k 1 r [ HCO 3 ] k 2 f [ HCO 3 ] [ OH ] + k 2 r [ CO 3 2 ] ,
0 = D CO 3 2 2 [ CO 3 2 ] x 2 + k 2 f [ HCO 3 ] [ OH ] k 2 r [ CO 3 2 ] ,
where Di terms account for species diffusivity, kir/kif account for the rate constants of forward and reverse reactions, and RxnCO2 and RxnOH account for the consumption of CO2 and production of OH , respectively.
By implementing this non-linear system of ordinary differential equations (ODE) in Matlab, it is possible to obtain the trend of species concentrations in relation to the distance from the electrode surface and to estimate the surface (local) pH (see Supporting Information (SI) for calculation details).

4. Conclusions

The electrochemical conversion of CO2 to added-value products was investigated in a gas diffusion electrode-based system. The GDE was fabricated by depositing different Cu-based catalytic inks on a porous conductive support through an airbrush, which was used to disperse the catalyst well and minimise the agglomeration of particles. Different products were obtained during the CO2 reduction process, specifically: hydrogen, carbon monoxide, formate, methanol, acetone, ethanol, 1-propanol, 2-propanol, and other compounds. Depending on the type of catalyst and the operating conditions, specific products were obtained in greater quantities than others. At the lowest applied potential, CO and formate formation was promoted on a CuO-based catalyst (Cu-06). The variation of the catalyst loading and Nafion content on the Cu-06 GDE structure affected the electrode performance. At the lowest Nafion ionomer loading (15%), the electrochemical CO2 reduction to CO drastically increases, achieving an H2/CO ratio of ~1, a suitable feedstock for further ethanol synthesis. On the contrary, with a Nafion content of 45%, the selectivity towards CO decreased by 80%, while the production of ethanol, 1-propanol, and 2-propanol was increased (FE < 5%).
From these findings, it emerged that C-C coupling was not promoted at high overpotentials, as one would instead expect from literature and from primary experimental data in liquid-phase conditions. On the contrary, higher applied potentials seemed to promote the HER, as a consequence of mass-transport limitations occurring throughout the porous structure of the electrode, where the triple-phase boundary (TPB, catalyst-CO2-electrolyte) should be formed. This research shows that the liquid crossover severely impacts the GDE performance, which is affected by electrode-wetting. At high applied potentials, a higher flow rate of liquid crossing the GDE may be responsible for a worsening of the CO2 diffusion towards the active sites of the catalyst, hampering its conversion and favouring the hydrogen production. Further efforts to investigate the influence of the GDE structure on electrolyte flooding are needed to support the optimisation of this challenging co-electrolysis system and move towards its industrial deployment.
Moreover, the role of the pH on the CO2 reduction process was also studied: a higher pH on the electrode surface may promote the CO2 hydration to carbonate and bicarbonate species, thus lowering the CO2 concentration at the TPB, causing the deactivation of the catalyst and hindering the mechanisms for C2+ liquid products formation.
As a general outcome, gaseous products were favoured over the liquids of most interest. It reflects the complexity of C2+ reaction pathways and the need to optimise the GDE-based co-electrolysis system further to achieve high current densities and Faradaic efficiencies (FE) towards liquid CO2 reduction products.

Supplementary Materials

The following are available online at https://www.mdpi.com/article/10.3390/catal11040482/s1, Figure S1: Schematic concepts of (a) H-type cell, (b) two compartments cell, (c) Gas Diffusion Electrode cell and (d) Membrane Electrode Assembly for electrochemical CO2 reduction reactions, Figure S2: XRD patterns of CuZnAl-oxide based catalysts (a) Cu-06, (b) CuZ-06-03, (c) CuZA-06-03-01, Figure S3: High resolution O1s (a) and Zn2p3/2 (b) XPS spectra of CuZ-06-03 and CuZA-06-03-01 catalysts and in the table the percentage of oxidation states of copper calculated from Auger parameter values on the surface of the CuZnAl-oxide based catalysts, Figure S4: Determination of relative roughness (geometric area 0.0706 cm2) of Cu-06 catalyst, Figure S5: LSV responses under CO2 flow of CuZA-06-03-01 catalysts in a Rotating Disk Electrode System. The test was carried out in CO2-purged 0.1 M KHCO3 electrolyte (scan rate: 5 mV s−1) with a catalyst loading of 0.6 mgCuO cm−2, Figure S6: CV responses for a electrode with a ink without catalyst nanoparticles. The VC/Nafion ratio was 70/30, and the test was carried out in 0.1 M KHCO3 aqueous electrolyte, Figure S7: Faradaic efficiencies of gas and liquid products at −1.5 V vs. Ag/AgCl for a electrode with a ink without catalyst nanoparticles. The chronoamperometry was carried out in 0.1 M KHCO3 aqueous electrolyte, Figure S8: Schematic of the control volume, Figure S9: Surface pH trends obtained with the developed model: reproduction of the data reported by Lv et al. and processing of our experimental data (green curve) (obtained with tests conducted on Cu-06 catalyst at −1.5, −1.75 and −2 V vs. Ag/AgCl in 1 M KHCO3 electrolyte solution), Figure S10: Influence of the catalyst thickness on the calculated surface pH for a specific test, conducted on Cu-06 catalysts at −1.5 V vs. Ag/AgCl in 1 M KHCO3 electrolyte solution, Table S1: CO2 reduction products and corresponding standard reduction potential (E0) vs. Normal Hydrogen Electrode (NHE) at pH = 0, Table S2: Main textural parameters of the synthesized CuZnAl-oxide based catalysts, Table S3: Crystallite sizes of the synthesized CuZnAl-oxide based catalysts, Table S4: Capacitance and ECSA values of the electrodes, Table S5: Effective and bulk diffusion coefficients of chemical species in the bulk electrolyte at 25 °C, Table S6: Rate constants for forward and reverse reaction at 25 °C.

Author Contributions

Data curation, Investigation and Writing—original draft, H.G. and F.Z.; Catalysts synthesis, D.R. and H.G.; XRD and ICP analyses, C.G. and H.G.; Methodology, H.G., F.Z. and S.H.; Modelling, F.Z.; Funding acquisition, S.H.; Supervision and Resources, N.R. and S.H.; Writing—review & editing, H.G., F.Z. and S.H. All authors have read and agreed to the published version of the manuscript.

Funding

This research was funded by European Union’s Horizon 2020 Research and Innovation Action programme under the SunCoChem project, Grant Agreement No 862192, and the Piedmont Region project Saturno (https://saturnobioeconomia.it (accessed on 6 April 2021)).

Acknowledgments

The authors are thankful to Mauro Raimondo and Micaela Castellino for the technical support in the acquisition of FESEM images and XPS data, respectively.

Conflicts of Interest

The authors declare no conflict of interest.

References

  1. Guzmán, H.; Salomone, F.; Batuecas, E.; Tommasi, T.; Russo, N.; Bensaid, S.; Hernández, S. How to make sustainable CO2 conversion to Methanol: Thermocatalytic versus electrocatalytic technology. Chem. Eng. J. 2020, 127973. [Google Scholar] [CrossRef]
  2. Jouny, M.; Luc, W.W.; Jiao, F. General Techno-Economic Analysis of CO2 Electrolysis Systems. Ind. Eng. Chem. Res. 2018, 57, 2165–2177. [Google Scholar] [CrossRef]
  3. Vennekoetter, J.-B.; Sengpiel, R.; Wessling, M. Beyond the catalyst: How electrode and reactor design determine the product spectrum during electrochemical CO2 reduction. Chem. Eng. J. 2019, 364, 89–101. [Google Scholar] [CrossRef]
  4. Endrődi, B.; Bencsik, G.; Darvas, F.; Jones, R.; Rajeshwar, K.; Janáky, C. Continuous-flow electroreduction of carbon dioxide. Prog. Energy Combust. Sci. 2017, 62, 133–154. [Google Scholar] [CrossRef]
  5. Burdyny, T.; Smith, W.A. CO2 reduction on gas-diffusion electrodes and why catalytic performance must be assessed at commercially-relevant conditions. Energy Environ. Sci. 2019, 12, 1442–1453. [Google Scholar] [CrossRef] [Green Version]
  6. Sacco, A.; Zeng, J.; Bejtka, K.; Chiodoni, A. Modeling of gas bubble-induced mass transport in the electrochemical reduction of carbon dioxide on nanostructured electrodes. J. Catal. 2019, 372, 39–48. [Google Scholar] [CrossRef]
  7. Raciti, D.; Mao, M.; Wang, C. Mass transport modelling for the electroreduction of CO2 on Cu nanowires. Nanotechnology 2017, 29, 044001. [Google Scholar] [CrossRef] [PubMed]
  8. Singh, M.R.; Clark, E.L.; Bell, A.T. Effects of electrolyte, catalyst, and membrane composition and operating conditions on the performance of solar-driven electrochemical reduction of carbon dioxide. Phys. Chem. Chem. Phys. 2015, 17, 18924–18936. [Google Scholar] [CrossRef] [PubMed] [Green Version]
  9. Schouten, K.J.P.; Gallent, E.P.; Koper, M.T. The influence of pH on the reduction of CO and CO2 to hydrocarbons on copper electrodes. J. Electroanal. Chem. 2014, 716, 53–57. [Google Scholar] [CrossRef]
  10. Ooka, H.; Figueiredo, M.C.; Koper, M.T.M. Competition between Hydrogen Evolution and Carbon Dioxide Reduction on Copper Electrodes in Mildly Acidic Media. Langmuir 2017, 33, 9307–9313. [Google Scholar] [CrossRef]
  11. Guzmán, H.; Russo, N.; Hernández, S. CO2 valorisation towards alcohols by Cu-based electrocatalysts: Challenges and perspectives. Green Chem. 2021, 23, 1896–1920. [Google Scholar] [CrossRef]
  12. Albo, J.; Perfecto-Irigaray, M.; Beobide, G.; Irabien, A. Cu/Bi metal-organic framework-based systems for an enhanced electrochemical transformation of CO2 to alcohols. J. CO2 Util. 2019, 33, 157–165. [Google Scholar] [CrossRef]
  13. Li, Y.C.; Wang, Z.; Yuan, T.; Nam, D.-H.; Luo, M.; Wicks, J.; Chen, B.; Li, J.; Li, F.; De Arquer, F.P.G.; et al. Binding Site Diversity Promotes CO2 Electroreduction to Ethanol. J. Am. Chem. Soc. 2019, 141, 8584–8591. [Google Scholar] [CrossRef]
  14. Yuan, J.; Yang, M.-P.; Hu, Q.-L.; Li, S.-M.; Wang, H.; Lu, J.-X. Cu/TiO2 nanoparticles modified nitrogen-doped graphene as a highly efficient catalyst for the selective electroreduction of CO2 to different alcohols. J. CO2 Util. 2018, 24, 334–340. [Google Scholar] [CrossRef]
  15. Albo, J.; Irabien, A. Cu2O-loaded gas diffusion electrodes for the continuous electrochemical reduction of CO2 to methanol. J. Catal. 2016, 343, 232–239. [Google Scholar] [CrossRef] [Green Version]
  16. Fan, L.; Xia, C.; Yang, F.; Wang, J.; Wang, H.; Lu, Y. Strategies in catalysts and electrolyzer design for electrochemical CO2 reduction toward C2+ products. Sci. Adv. 2020, 6, eaay3111. [Google Scholar] [CrossRef] [Green Version]
  17. Liu, G.; Tran-Phu, T.; Chen, H.; Tricoli, A. A Review of Metal- and Metal-Oxide-Based Heterogeneous Catalysts for Electroreduction of Carbon Dioxide. Adv. Sustain. Syst. 2018, 2, 1800028. [Google Scholar] [CrossRef]
  18. Nitopi, S.; Bertheussen, E.; Scott, S.B.; Liu, X.; Engstfeld, A.K.; Horch, S.; Seger, B.; Stephens, I.E.L.; Chan, K.; Hahn, C.; et al. Progress and Perspectives of Electrochemical CO2 Reduction on Copper in Aqueous Electrolyte. Chem. Rev. 2019, 119, 7610–7672. [Google Scholar] [CrossRef] [Green Version]
  19. Marcos-Madrazo, A.; Casado-Coterillo, C.; Irabien, Á. Sustainable Membrane-Coated Electrodes for CO2 Electroreduction to Methanol in Alkaline Media. ChemElectroChem 2019, 6, 5273–5282. [Google Scholar] [CrossRef]
  20. Gabrielli, C.; Grand, P.P.; Lasia, A.; Perrot, H. Investigation of Hydrogen Adsorption and Absorption in Palladium Thin Films. J. Electrochem. Soc. 2004, 151, A1937–A1942. [Google Scholar] [CrossRef]
  21. Rodríguez, J.M.D.; Alberto, J.; Melián, H.; Peña, J.P.B.C.G. In the laboratory. Lancet 1928, 211, 408–409. [Google Scholar]
  22. Albo, J.; Sáez, A.; Solla-Gullón, J.; Montiel, V.; Irabien, A. Production of methanol from CO2 electroreduction at Cu2O and Cu2O/ZnO-based electrodes in aqueous solution. Appl. Catal. B: Environ. 2015, 176–177, 709–717. [Google Scholar] [CrossRef] [Green Version]
  23. Hori, Y.; Koga, O.; Yamazaki, H.; Matsuo, T. Infrared spectroscopy of adsorbed CO and intermediate species in electrochemical reduction of CO2 to hydrocarbons on a Cu electrode. Electrochim. Acta 1995, 40, 2617–2622. [Google Scholar] [CrossRef]
  24. Khurana, R.; Mohanty, J.; Padma, N.; Barooah, N.; Bhasikuttan, A.C. Redox-mediated Negative Differential Resistance (NDR) Behavior in Perylenediimide Derivative: A Supramolecular Approach. Chem. Eur. J. 2012, 25, 13939–13944. [Google Scholar] [CrossRef]
  25. Lv, J.-J.; Jouny, M.; Luc, W.; Zhu, W.; Zhu, J.-J.; Jiao, F. A Highly Porous Copper Electrocatalyst for Carbon Dioxide Reduction. Adv. Mater. 2018, 30, e1803111. [Google Scholar] [CrossRef] [PubMed]
  26. Dinh, C.-T.; Burdyny, T.; Kibria, G.; Seifitokaldani, A.; Gabardo, C.M.; De Arquer, F.P.G.; Kiani, A.; Edwards, J.P.; De Luna, P.; Bushuyev, O.S.; et al. CO2 electroreduction to ethylene via hydroxide-mediated copper catalysis at an abrupt interface. Science 2018, 360, 783–787. [Google Scholar] [CrossRef] [PubMed] [Green Version]
  27. De Mot, B.; Hereijgers, J.; Duarte, M.; Breugelmans, T. Influence of flow and pressure distribution inside a gas diffusion electrode on the performance of a flow-by CO2 electrolyzer. Chem. Eng. J. 2019, 378, 122224. [Google Scholar] [CrossRef]
  28. Duarte, M.; De Mot, B.; Hereijgers, J.; Breugelmans, T. Electrochemical Reduction of CO2: Effect of Convective CO2 Supply in Gas Diffusion Electrodes. ChemElectroChem 2019, 6, 5596–5602. [Google Scholar] [CrossRef]
  29. Gutiérrez-Guerra, N.; González, J.; Serrano-Ruiz, J.; López-Fernández, E.; Valverde, J.; De Lucas-Consuegra, A. Gas-phase electrocatalytic conversion of CO2 to chemicals on sputtered Cu and Cu–C catalysts electrodes. J. Energy Chem. 2019, 31, 46–53. [Google Scholar] [CrossRef] [Green Version]
  30. Pander, J.E.; Ren, D.; Huang, Y.; Loo, N.W.X.; Hong, S.H.L.; Yeo, B.S. Understanding the Heterogeneous Electrocatalytic Reduction of Carbon Dioxide on Oxide-Derived Catalysts. ChemElectroChem 2018, 5, 219–237. [Google Scholar] [CrossRef]
  31. Albo, J.; Vallejo, D.; Beobide, G.; Castillo, O.; Castaño, P.; Irabien, A. Copper-Based Metal-Organic Porous Materials for CO2 Electrocatalytic Reduction to Alcohols. ChemSusChem 2017, 10, 1100–1109. [Google Scholar] [CrossRef] [PubMed]
  32. Mandal, L.; Yang, K.R.; Motapothula, M.R.; Ren, D.; Lobaccaro, P.; Patra, A.; Sherburne, M.; Batista, V.S.; Yeo, B.S.; Ager, J.W.; et al. Investigating the Role of Copper Oxide in Electrochemical CO2 Reduction in Real Time. ACS Appl. Mater. Interfaces 2018, 10, 8574–8584. [Google Scholar] [CrossRef] [Green Version]
  33. Back, S.; Kim, H.; Jung, Y. Selective Heterogeneous CO2 Electroreduction to Methanol. ACS Catal. 2015, 5, 965–971. [Google Scholar] [CrossRef]
  34. Liu, X.; Schlexer, P.; Xiao, J.; Ji, Y.; Wang, L.; Sandberg, R.B.; Tang, M.; Brown, K.S.; Peng, H.; Ringe, S.; et al. pH effects on the electrochemical reduction of CO(2) towards C2 products on stepped copper. Nat. Commun. 2019, 10, 1–10. [Google Scholar] [CrossRef]
  35. Nie, X.; Luo, W.; Janik, M.J.; Asthagiri, A. Reaction mechanisms of CO2 electrochemical reduction on Cu(111) determined with density functional theory. J. Catal. 2014, 312, 108–122. [Google Scholar] [CrossRef]
  36. Velasco-Vélez, J.-J.; Jones, T.E.; Gao, D.; Carbonio, E.; Arrigo, R.; Hsu, C.-J.; Huang, Y.-C.; Dong, C.-L.; Chen, J.-M.; Lee, J.-F.; et al. The Role of the Copper Oxidation State in the Electrocatalytic Reduction of CO2 into Valuable Hydrocarbons. ACS Sustain. Chem. Eng. 2018, 7, 1485–1492. [Google Scholar] [CrossRef]
  37. Marepally, B.C.; Ampelli, C.; Genovese, C.; Tavella, F.; Veyre, L.; Quadrelli, E.A.; Perathoner, S.; Centi, G. Role of small Cu nanoparticles in the behaviour of nanocarbon-based electrodes for the electrocatalytic reduction of CO2. J. CO2 Util. 2017, 21, 534–542. [Google Scholar] [CrossRef]
  38. Zhong, H.; Fujii, K.; Nakano, Y.; Jin, F. Effect of CO2 Bubbling into Aqueous Solutions Used for Electrochemical Reduction of CO2 for Energy Conversion and Storage. J. Phys. Chem. C 2014, 119, 55–61. [Google Scholar] [CrossRef]
  39. Varela, A.S.; Kroschel, M.; Reier, T.; Strasser, P. Controlling the selectivity of CO2 electroreduction on copper: The effect of the electrolyte concentration and the importance of the local pH. Catal. Today 2016, 260, 8–13. [Google Scholar] [CrossRef]
  40. Wang, Q.; Dong, H.; Yu, H.; Yu, H. Enhanced performance of gas diffusion electrode for electrochemical reduction of carbon dioxide to formate by adding polytetrafluoroethylene into catalyst layer. J. Power Sources 2015, 279, 1–5. [Google Scholar] [CrossRef]
  41. Garg, S.; Li, M.; Weber, A.Z.; Ge, L.; Li, L.; Rudolph, V.; Wang, G.; Rufford, T.E. Advances and challenges in electrochemical CO2 reduction processes: An engineering and design perspective looking beyond new catalyst materials. J. Mater. Chem. A 2020, 8, 1511–1544. [Google Scholar] [CrossRef]
  42. Wu, J.; Risalvato, F.G.; Ma, S.; Zhou, X.-D. Electrochemical reduction of carbon dioxide III. The role of oxide layer thickness on the performance of Sn electrode in a full electrochemical cell. J. Mater. Chem. A 2014, 2, 1647–1651. [Google Scholar] [CrossRef]
  43. Chen, C.; Sun, X.; Lu, L.; Yang, D.; Ma, J.; Zhu, Q.; Qian, Q.; Han, B. Efficient electroreduction of CO2 to C2 products over B-doped oxide-derived copper. Green Chem. 2018, 20, 4579–4583. [Google Scholar] [CrossRef]
  44. Zhou, Y.; Che, F.; Liu, M.; Zou, C.; Liang, Z.; De Luna, P.; Yuan, H.; Li, J.; Wang, Z.; Xie, H.; et al. Dopant-induced electron localization drives CO2 reduction to C2 hydrocarbons. Nat. Chem. 2018, 10, 974–980. [Google Scholar] [CrossRef] [PubMed]
  45. Philip, M.; Woldu, A.R.; Akbar, M.B.; Louis, H.; Cong, H. A facile synthesis of Cu catalysts with multiple high-index facets for the suppression of competing H2 evolution during electrocatalytic CO2 reduction. Nanoscale 2021, 13, 3042–3048. [Google Scholar] [CrossRef] [PubMed]
  46. Ma, S.; Luo, R.; Gold, J.I.; Yu, A.Z.; Kim, B.; Kenis, P.J.A. Carbon nanotube containing Ag catalyst layers for efficient and selective reduction of carbon dioxide. J. Mater. Chem. A 2016, 4, 8573–8578. [Google Scholar] [CrossRef]
  47. Komatsu, S.; Tanaka, M.; Okumura, A.; Kungi, A. Preparation of cu-solid polymer electrolyte composite electrodes and application to gas-phase electrochemical reduction of CO2. Electrochim. Acta 1995, 40, 745–753. [Google Scholar] [CrossRef]
  48. Gabardo, C.M.; O’Brien, C.P.; Edwards, J.P.; McCallum, C.; Xu, Y.; Dinh, C.-T.; Li, J.; Sargent, E.H.; Sinton, D. Continuous Carbon Dioxide Electroreduction to Concentrated Multi-carbon Products Using a Membrane Electrode Assembly. Joule 2019, 3, 2777–2791. [Google Scholar] [CrossRef]
  49. Gao, D.; Arán-Ais, R.M.; Jeon, H.S.; Cuenya, B.R. Rational catalyst and electrolyte design for CO2 electroreduction towards multicarbon products. Nat. Catal. 2019, 2, 198–210. [Google Scholar] [CrossRef]
  50. Kas, R.; Kortlever, R.; Milbrat, A.; Koper, M.T.M.; Mul, G.; Baltrusaitis, J. Electrochemical CO2 reduction on Cu2O-derived copper nanoparticles: Controlling the catalytic selectivity of hydrocarbons. Phys. Chem. Chem. Phys. 2014, 16, 12194–12201. [Google Scholar] [CrossRef] [PubMed]
  51. Zeng, J.; Bejtka, K.; Di Martino, G.; Sacco, A.; Castellino, M.; Fiorentin, M.R.; Risplendi, F.; Farkhondehfal, M.A.; Hernández, S.; Cicero, G.; et al. Microwave-Assisted Synthesis of Copper-Based Electrocatalysts for Converting Carbon Dioxide to Tunable Syngas. ChemElectroChem 2020, 7, 229–238. [Google Scholar] [CrossRef] [Green Version]
  52. Ramdin, M.; Morrison, A.R.T.; De Groen, M.; Van Haperen, R.; De Kler, R.; Van Den Broeke, L.J.P.; Trusler, J.P.M.; De Jong, W.; Vlugt, T.J.H. High Pressure Electrochemical Reduction of CO2 to Formic Acid/Formate: A Comparison between Bipolar Membranes and Cation Exchange Membranes. Ind. Eng. Chem. Res. 2019, 58, 1834–1847. [Google Scholar] [CrossRef] [PubMed] [Green Version]
Figure 1. FESEM micrographs of CuZnAl-oxide based catalysts (a) CuZA -06-03-01, (b) CuZ-06-03, (c) Cu-06.
Catalysts 11 00482 g001
Figure 2. CV responses for electrodes with Cu-06 catalyst (a) and Linear Sweep Voltammetry (LSV) responses under CO2 flow of electrodes with Cu-06, CuZ-06-01, and CuZA-06-03-01 catalysts (b). The catalyst loading was ~4 mg cm−2, the Catalyst/Nafion ratio was 70/30 in all cases, and the tests were carried out in 1 M KHCO3 aqueous electrolyte.
Catalysts 11 00482 g002
Figure 3. Chronoamperometry curves (a), Faradaic efficiencies (FEs) (b), Productivities of gas (c) and liquid (d) products at different potentials (−1.5, −1.75 and −2 V vs. Ag/AgCl) for Cu-06 catalyst (~4 mg cm−2) with 30% of Nafion, tested in 1 M KHCO3 aqueous electrolyte.
Catalysts 11 00482 g003
Figure 4. Influence of the cathodic potential on the Faradaic efficiencies (FEs) (a) and partial current densities (b) with Cu-06 gas diffusion electrodes (GDEs) loaded with ~4 mg cm−2 and tested in 1 M KHCO3.
Catalysts 11 00482 g004
Figure 5. Chronoamperometry responses (a), Faradaic efficiencies (FEs) (b), productivities of gas (c) and liquid (d) products for CuZA-06-03-01, CuZ-06-03 and Cu-06 catalysts (~4 mg cm−2) with 30% of Nafion tested in 1M KHCO3 aqueous electrolyte at −1.5 V vs. Ag/AgCl.
Catalysts 11 00482 g005
Figure 6. XRD patterns of Cu-06 electrode (~4 mg cm−2) with 30% of Nafion tested in 1 M KHCO3 aqueous electrolyte at −1.5 V vs. Ag/AgCl.
Catalysts 11 00482 g006
Figure 7. Chronoamperometry responses (a), partial FEs (b), productivities of gas (c) and liquid (d) products for Cu-06 catalyst with ~ 4 mg cm−2 and 0.44 mg cm−2 (30% of Nafion) tested in 1 M KHCO3 aqueous electrolyte at −1.5 V vs. Ag/AgCl.
Catalysts 11 00482 g007
Figure 8. Faradaic efficiencies (FEs) (a) and productivities of gas and liquid products (b) for Cu-06 catalyst with different mass percentage of Nafion. The tests were carried out in 0.1 M KHCO3 aqueous electrolyte at −1.5 V vs. Ag/AgCl.
Catalysts 11 00482 g008
Figure 9. XRD patterns of Cu-06 electrode (~4 mg cm−2) with 45% of Nafion tested in 1 M KHCO3 aqueous electrolyte at −1.5 V vs. Ag/AgCl.
Catalysts 11 00482 g009
Figure 10. A schematic view of the experimental set-up: (1) Gas chamber, (2) Catholyte chamber, (3) Ion exchange membrane, (4) Anolyte chamber.
Catalysts 11 00482 g010
Table 1. pH values of electrolytes (catholyte) at the surface of the electrode and after electrolysis (bulk).
ElectrolyteCatalyst MaterialReal Applied
Potential, V vs. Ag/AgCl
Current Density, mA cm−2Bulk pH,
before/after the Co-Electrolysis
Calculated Surface pH
(±0.05)
1 M
KHCO3
Cu-06 −1.515.68.38/8.89.37
Cu-06 1.7526.38.38/9.39.62
Cu-06 −234.68.38/9.79.76
CuZ-06-03−1.511.58.38/8.99.25
CuZA-06-03-01−1.513.58.38/8.79.31
Cu-06−1.54.78.38/8.68.93
0.1 M
KHCO3
Cu-06 (15%wt Nafion)−1.53.58.36/7.69.28
Cu-06 (30%wt Nafion)−1.52.258.36/7.59.09
Cu-06 (45%wt Nafion)−1.52.18.36/7.59.05
Publisher’s Note: MDPI stays neutral with regard to jurisdictional claims in published maps and institutional affiliations.