Article

Hydrogen Evolution on Reduced Graphene Oxide-Supported PdAu Nanoparticles

1
INS Vinca, Department of Atomic Physics, University of Belgrade, Mike Alasa 12-14, 11001 Belgrade, Serbia
2
Institute of Chemistry, Technology and Metallurgy, Department of Electrochemistry, University of Belgrade, Njegoseva 12, 11000 Belgrade, Serbia
*
Author to whom correspondence should be addressed.
Catalysts 2021, 11(4), 481; https://doi.org/10.3390/catal11040481
Submission received: 14 March 2021 / Revised: 2 April 2021 / Accepted: 7 April 2021 / Published: 9 April 2021
(This article belongs to the Special Issue Efficient PGM Electrocatalysts for Hydrogen Evolution Reaction)

Abstract

:
Hydrogen evolution reaction (HER) was investigated on reduced graphene oxide (rGO)-supported Au and PdAu nanoparticles in acid solution. The graphene spread over glassy carbon (rGO/GC) was used as a support for the spontaneous deposition of Au and Pd. The resulting Au/rGO and PdAu/rGO electrodes were characterized using atomic force microscopy (AFM) and X-ray photoelectron spectroscopy (XPS) techniques. Phase AFM images have shown that the edges of the rGO sheets were active sites for the deposition of both Au and Pd. XPS analysis revealed that the atomic percentages of both Au and PdAu nanoparticles were slightly higher than 1%. The activity of the PdAu/rGO electrode for the HER was remarkably high, with the overpotential close to zero. HER activity was stable over a 3 h testing time, with a low Tafel slope of approx. −46 mV/dec achieved after prolonged hydrogen evolution at a constant potential.

1. Introduction

Platinum group metals (PGM) are the most extensively exploited catalysts for the studies of hydrogen evolution reaction (HER) from both a fundamental and practical point of view. Although PGM-based catalysts are expensive and scarce they are still widely used for hydrogen production, but for practical use their design aims to limit their amount. Therefore, the synthesis of cost-effective PGM-based catalysts goes in the direction of their minimum consumption by using bimetallic nanoparticles supported by a conductive and cheap material [1]. Carbon-based materials are widely used as support owing to their electrical conductivity and inertness, among which bare carbon black (C) is commonly used for the preparation of commercial PGM/C catalysts [2]. Most recently, the use of graphene as a support has gained particular attention due to its contribution to electrocatalytic activity through the interaction between the support and bimetallic nanoparticles [3]. In addition to the intrinsic properties of metal nanoparticles, their local geometric and electronic state are also determined by the support. This plays a crucial role in the adsorption of hydrogen, and thus the hydrogen evolution reaction rate [4].
A combination of PGM either as bimetallic electrodes or supported bimetallic nanoparticles are widely studied as electrocatalysts, among which the PdAu system is particularly interesting for the HER. The intrinsic activity of gold is relatively low compared to palladium, which is a good catalyst for the HER [5]. Due to the synergistic effect between Au and Pd, when the two are combined, the activity for HER becomes significantly enhanced. Various PdAu nanostructured electrodes, consisting of Au-supported Pd nanoparticles at submonolayer coverage, have shown the activity approaching that of the most active platinum [6,7,8].
The activity for the HER of PdAu nanoparticles supported on carbon-based materials has already been reported. Low onset potential and high current density for the HER in acid solution were reported for graphene oxide nanosheets decorated with Au–Pd bimetallic nanoparticles [9]. Bimetallic AuPd nanoclusters supported on graphitic carbon nitride [10], as well as flower-like Au@AuPd nanoparticles supported on reduced graphene oxide, have also shown high activity for HER [11]. High activity for HER was also reported for PdAu24 nanoclusters in ref. [12], with the emphasis on the study of the activity of specific PdAu surface sites for hydrogen adsorption. In our recent work on glassy carbon (GC)-supported Au and PdAu nanoislands [13], the PdAu/GC catalyst obtained by the electrochemical deposition of Au on GC, followed by a spontaneous deposition of Pd, have shown exceptionally high activity for the HER in acid solution. Based on this work we have chosen to prepare, characterize and examine the activity for HER of graphene thin layer-supported Au and PdAu nanoparticles.
In this work, we examined the activity of Au and PdAu nanoparticles supported on reduced graphene oxide (rGO) towards the HER in acid solution. The graphene was synthesized using electrochemical exfoliation of graphite, and spread using a drop of suspension over the glassy carbon (GC) support. PdAu nanoparticles were obtained by a spontaneous deposition of Au on the rGO/GC, followed by a subsequent spontaneous deposition of Pd. Surface morphology and chemical analysis of rGO/GC, and rGO-supported Au and PdAu nanoparticles were performed using atomic force microscopy (AFM), and X-ray photoelectron spectroscopy (XPS). Electrochemical characterization was performed by cyclic voltammetry (CV) in 0.5 M H2SO4 solution, while linear sweep voltammetry (LSV) was used to gain insight into the electrocatalytic activity of these electrodes for HER. Test stability and activity measurements of the electrode consisting of reduced grapheme oxide-supported PdAu nanoparticles (PdAu/rGO) were performed by CV, LSV, and chronoamperometry (CA).

2. Results and Discussion

2.1. Characterization of Graphene/GC

AFM images and high-resolution XPS spectra of the substrate electrode, consisting of the synthesized graphene suspension spread over the glassy carbon disc, are shown in Figure 1. The image recorded in height mode, Figure 1a, shows the surface morphology of the graphene/GC electrode, with the graphene sheets densely and randomly distributed over the GC surface. The average lateral size of graphene sheets is approximately 100 nm, while the average surface roughness estimated from this image is 18 nm. On such a rough surface, the individual graphene sheets are better resolved on the AFM image recorded in phase mode, Figure 1b.
Although the surface is chemically uniform since it is composed of only two elements (carbon and oxygen), the presence of edges and the difference in the thickness of the individual sheets contribute to the difference in the elasticity of each particular surface site. As a result, the difference in color from bright to dark reflects their response according to the difference in elasticity (or hardness), and the highlighted boundaries.
High-resolution XPS spectra of C 1s and O 1s are shown in Figure 1c,d. The C 1s line, Figure 1c, is fitted to three components that correspond to carbon atoms in the following different functional groups: C–C bond (284.7 eV) of sp2 carbon in the basal plane of graphene oxide, the C–C bond in carbon crystal (285.1 eV) [14], and in C–O–C bonds (286.7 eV) [15,16]. The O 1s line, Figure 1d, is fitted to three components corresponding to oxygen atoms in the following different functional groups: C=O (532.3 eV) [15,16], C–OH (533.4 eV) [15], and C–O–C (534.1 eV) [15]. According to the atomic ratio of carbon (87.58 at%) to oxygen (12.42 at%) of 7.0, the reduced graphene oxide (further denoted as rGO) is obtained as a result of the synthesis [17,18].

2.2. AFM and XPS Characterization of Au/rGO and PdAu/rGO

Figure 2 shows phase AFM images of Au/rGO and PdAu/rGO and cross sections along the lines denoted in the images.
In both cases, a few cross sections are only illustrations of the differences in the Au or PdAu nanoparticles lateral sizes (the distances on the x-axes) and the differences in elasticity (the phase angles on the y-axes). Due to the difference in the phase angles, it is possible to highlight the edges of graphene sheets and the deposited nanoparticles. On the other hand, due to the low amount of the deposited metals, it is impossible to differentiate Pd from Au in PdAu nanoparticles.
Figure 2a demonstrates that Au nanoparticles deposited on Au/rGO occupy the edges of the graphene sheets. The size of the Au nanoparticles ranged from 10 to 50 nm. The cross sections indicate that larger nanoparticles are composed of agglomerated smaller ones. For PdAu/rGO, Figure 2b shows that after Pd deposition on previously prepared Au/rGO, the resulting PdAu nanoparticles occupy the edges of the graphene sheets. Although PdAu nanoparticles cannot be distinguished from bare Au or Pd nanoparticles, they can only be identified as those with an average lateral size of 20 to 60 nm, which is larger than the previously deposited Au nanoparticles. A closer analysis of many cross sections in the images of both samples reveals that the graphene edges are rich in Au or PdAu nanoparticles. Although the density of the nanoparticles and their size distribution cannot be determined, their presence provides many surface active sites, and their importance for HER will be discussed below.
Figure 3 shows XPS survey spectra of rGO/GC, Au/rGO, and PdAu/rGO. The main photoelectron lines C 1s and O 1s, characteristic of the graphene substrate layer, are visible in all spectra. Au 4f and Au 4d doublets are visible on both Au/rGO and PdAu/rGO. For PdAu/rGO, the Au 4f line is lower in intensity than for Au/rGO, indicating a shielding effect of Pd deposited on top of gold nanoparticles. On the other hand, Au 4d for PdAu/rGO is higher in intensity than for bare Au/rGO and overlaps with the Pd 3d doublet.
Figure 4 shows high-resolution spectra of Au 4f and Au 4d5/2 lines for Au/rGO, as well as Au 4f and Au 4d5/2 overlapped with Pd 3d lines for PdAu/rGO. Figure 4a shows the high-resolution spectrum of the Au 4f doublet for gold in the Au/rGO electrode. The deconvolution of two 4f photoelectron lines shows that each line consists of the following two components: the 4f7/2 line consists of one component with a higher intensity at 84.3 eV and one with a lower intensity at 84.5 eV, and the 4f5/2 line consists of one component with a higher intensity at 87.9 eV and the other one with lower intensity at 88.0 eV. Similarly, for the PdAu/rGO electrode, Figure 4b, the 4f7/2 line consists of one component with a higher intensity at 84.2 eV, and the other one with a lower intensity at 84.4 eV. The 4f5/2 line consists of one component with a higher intensity at 87.8 eV and the other one with a lower intensity at 88.0 eV.
When compared to the previously reported spectra for gold, it can be seen that the positions of the two lines with higher intensity correspond well to the ones of the bulk components of bare Au(111), (Au 4f7/2 at 84.4 eV and Au 4f5/2 at 88.07 eV), in its metallic state, Au0 [19,20]. On the other hand, the two lines of lower intensity correspond to the surface component of bare Au(111). The significantly lower intensity of both Au 4f peaks components for PdAu/rGO than for Au/rGO indicates that palladium, which is deposited on previously prepared Au/rGO, partially shields the underlaying gold nanoparticles. This also means that Pd is deposited on the top of gold nanoparticles, as well as on their edges. When Pd partially covers the top of gold nanoparticles, the bulk Au 4f component becomes significantly lower compared to Au/rGO. On the other hand, the surface component becomes wider with relatively higher intensity, meaning that the relative overall number of gold edges is increased. Apart from the influence of the intrinsic properties of both Pd and Au, the number of edges as surface active sites is crucial for the activity of graphene-supported PdAu nanoparticles for HER.
A slight downshift of 0.1 eV for both the bulk and surface components of Au 4f7/2 and Au 4f5/2 lines in PdAu/GC compared to Au/rGO, indicates the influence of the presence of the deposited palladium on the electronic state of the deposited gold nanoparticles [21].
Figure 4c shows a broad Au 4d5/2 line for Au/rGO at 335.4 eV, which is downshifted by 0.3 eV compared to metallic gold (335.7 eV [22]), due to the influence of the rGO support. Figure 4d shows that the Au 4d5/2 line becomes narrower for PdAu/rGO, and partially overlaps with the Pd 3d doublet line as the primary one for palladium. Therefore, the Au 4d5/2 binding energy region for Au/rGO consists of overlapped Au 4d5/2 + Pd 3d5/2 lines for PdAu/rGO. This line is deconvoluted into the following three components: two Pd 3d5/2 at different binding energies, and one Au 4d5/2 component. The peak for the Au 4d5/2 line at 335.3 eV shows that this line is further downshifted by 0.1 eV compared to the same line for Au/rGO, due to the additional electronic influence of the deposited palladium.
The Pd 3d5/2 photoelectron line at 335.7 eV corresponds to Pd0, but the binding energy is slightly higher than for polycrystalline Pd [23]. This is in agreement with a positive shift found for the supported Pd nanoparticles [24,25] caused by the loss of a metal character of the deposited Pd nanoparticles compared to bulk Pd. The other Pd 3d5/2 component at 337.8 eV can be associated with the presence of a smaller fraction of palladium oxide, although rather to PdO2 [26] than to PdO [27]. The palladium 3d3/2 photoelectron line at 340.8 eV corresponds to the metallic Pd0 (340.5 eV) [23]. The other Pd 3d3/2 line at 342.3 eV corresponds to PdOx with unspecified stoichiometry [28]. For metallic Pd, the spin–orbit separation between the two Pd 3d components is 5.32 eV, which agrees with literature data (Δ = 5.3 eV) [23]. Table 1 shows the atomic percentage (at%) of the elements constituting Au/rGO and PdAu/rGO electrodes, estimated from high-resolution spectra.
The presence of partially oxidized Pd, either as PdOx or hydrated PdOx (or even corresponding hydroxides) [26], is consistent with the presence of a higher atomic percentage of oxygen on PdAu/rGO than on Au/rGO (see Table 1).
Taking into account the atomic percentages of Au and Pd and their ratios, it is estimated that PdAu nanoparticles are composed of 15% Au and 85% Pd.

2.3. Electrochemical Measurements

2.3.1. Cyclic Voltammetry of PdAu/rGO

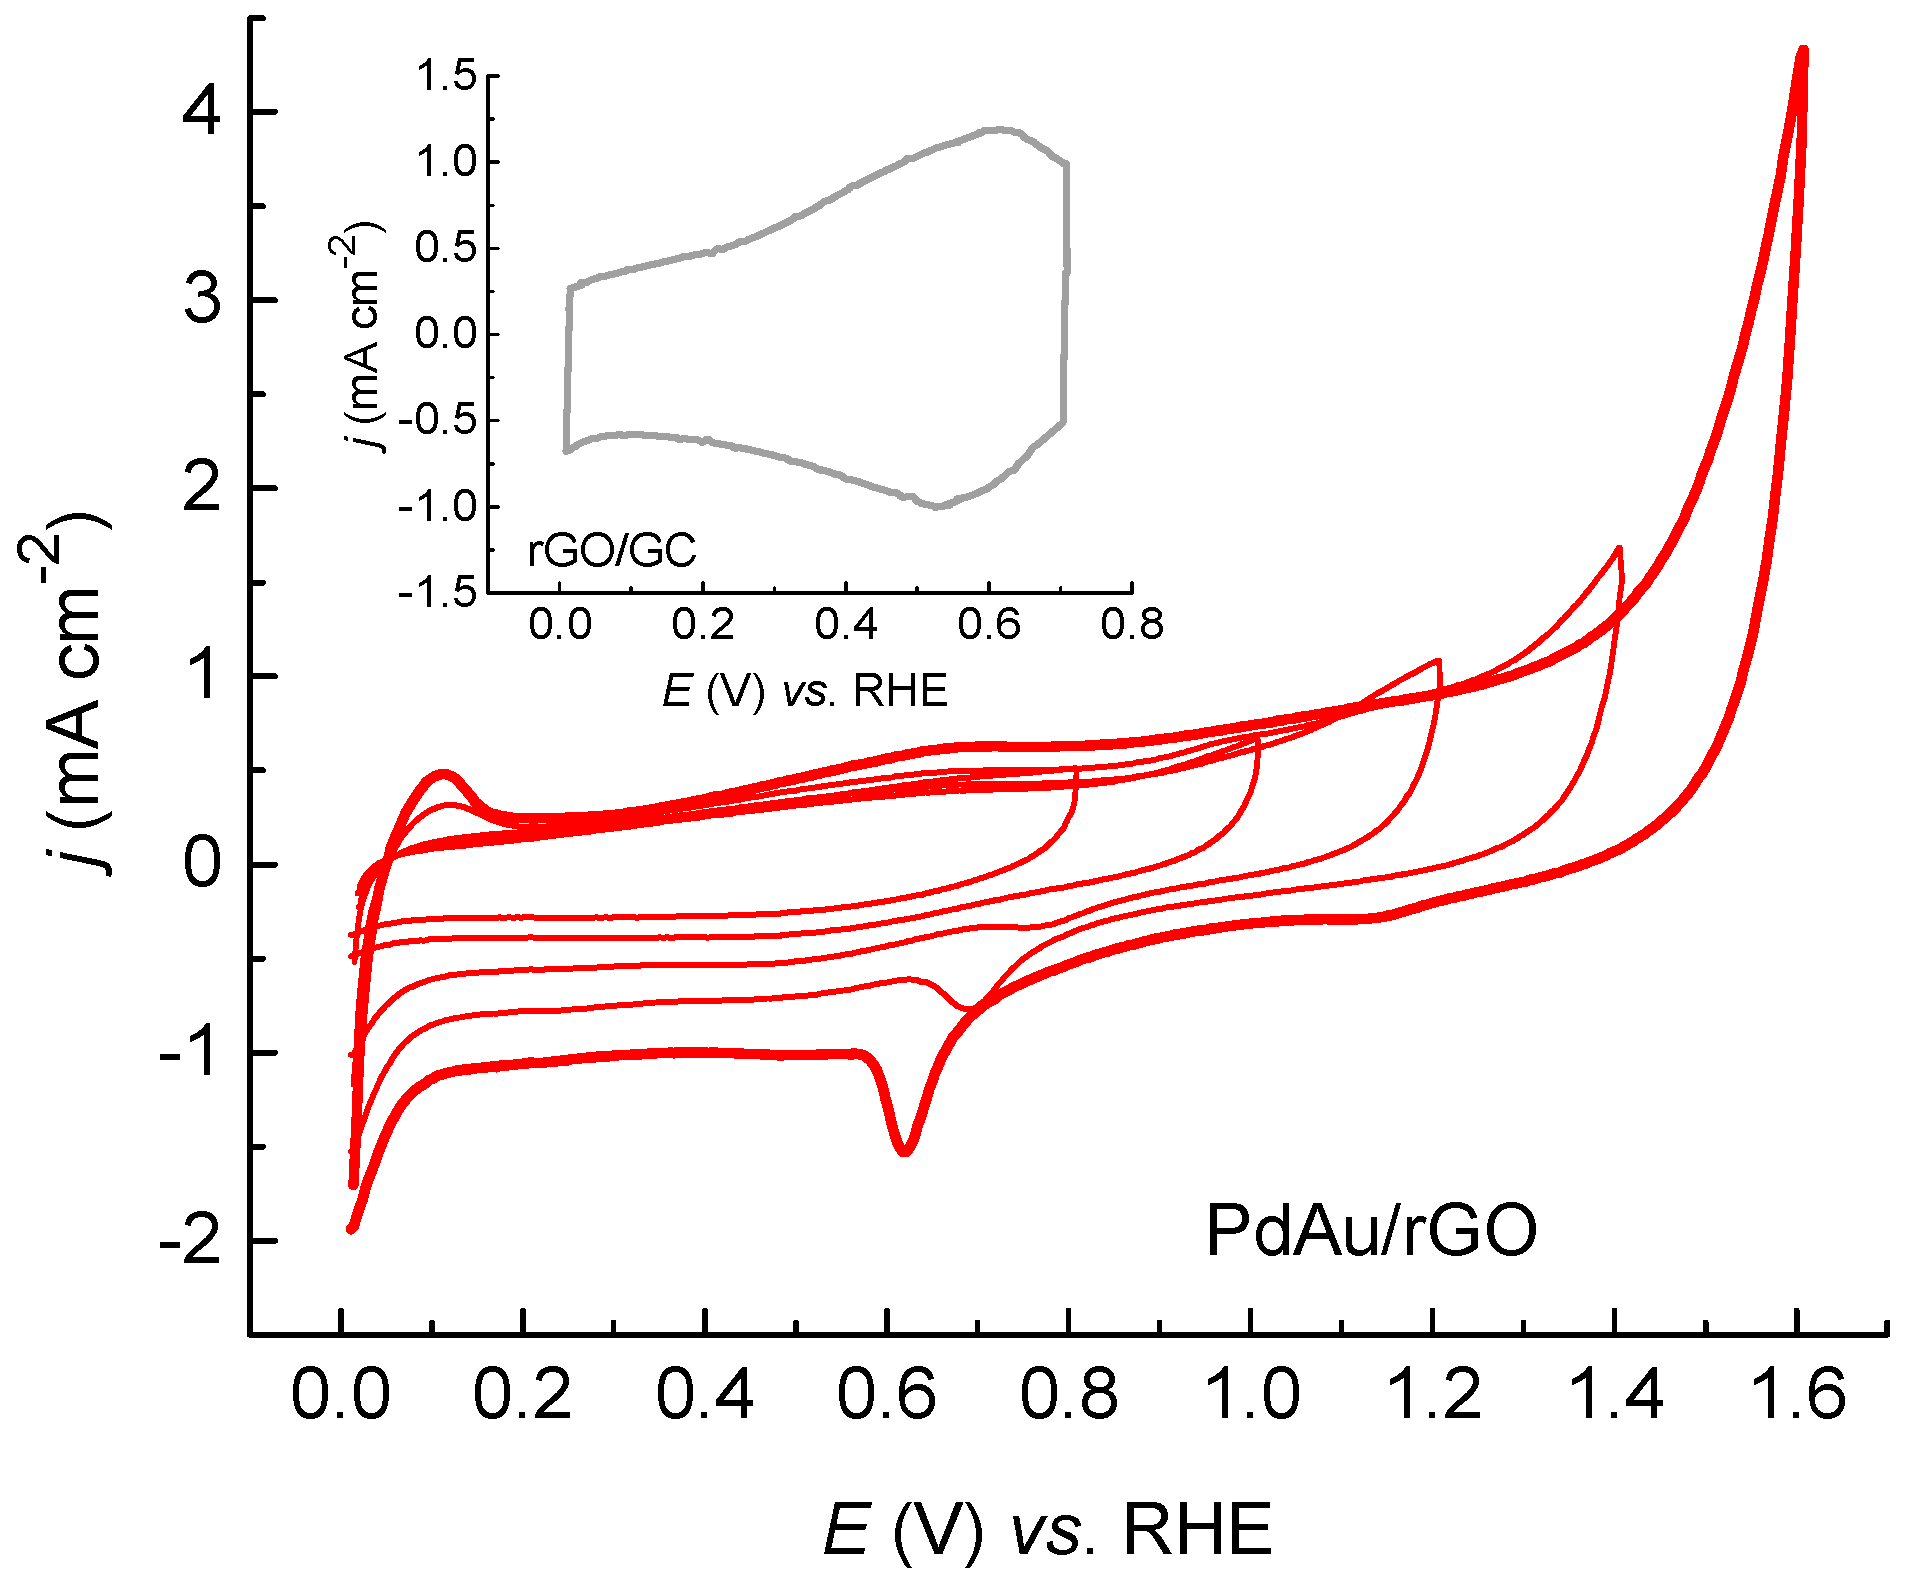
Figure 5 shows cyclic voltammograms of the PdAu/rGO electrode in 0.5 M H2SO4 solution in a wide potential range. The inset illustrates the CV curve of a bare GC-supported rGO electrode recorded from 0.0 V to 0.7 V, the shape of which indicates a high double-layer capacity, following reported ones recorded under similar conditions [29,30].
Cyclic voltammograms of the PdAu/rGO electrode with the opening of the upper potential limit from 0.80 V to 1.60 V show that CV features indicating the presence of the deposit on the rGO substrate appear for the positive limit of 1.2 V and higher. The peaks that are characteristic of hydrogen adsorption/desorption processes on the deposited palladium cannot be identified clearly due to the early hydrogen evolution/oxidation reactions (HER/HOR). With the increase of the upper potential limit, peaks for HER/HOR increase, as well as the double-layer capacity. The low-intensity peak at approx. 0.77 V, which originates from the reduction in palladium oxides, becomes visible on the CV recorded in the potential range of 0.00 V to 1.20 V. By increasing the upper limit, the intensity of the Pd reduction peak increases. At the same time, the peak gradually shifts to more negative potentials. The second reduction peak at approx. 1.15 V originates from the reduction in gold oxides. This peak can barely be seen even on the last recorded voltammogram in the potential range of 0.0 V to 1.6 V, and even in the case of bare Au/rGO (CV not presented). When the deposited Pd partially covers previously deposited Au nanoparticles, the presence of the Au oxide reduction peak is almost invisible on the CVs. The exception is the last recorded CV, where the Au reduction peak appears, but the palladium is most likely already dissolved to some extent due to high potentials [31]. It is expected to be due to a small amount of the deposited Au on both Au/rGO and PdAu/rGO as revealed by XPS (see Table 1).
On the other hand, on the CV recorded in the potential range of 0.0 V to 1.2 V, palladium oxidation/reduction peaks are visible. Therefore, palladium coverage is estimated from the ratio between the charge passed during Pd oxide reduction on PdAu/rGO and bare polycrystalline Pd (424 μC/cm2 [32]). The calculated charge of 10.4 μC/cm2 gives the coverage value of 2.5%, which is in agreement with the XPS results (see Table 1).

2.3.2. Hydrogen Evolution on Au/rGO and PdAu/rGO Electrodes

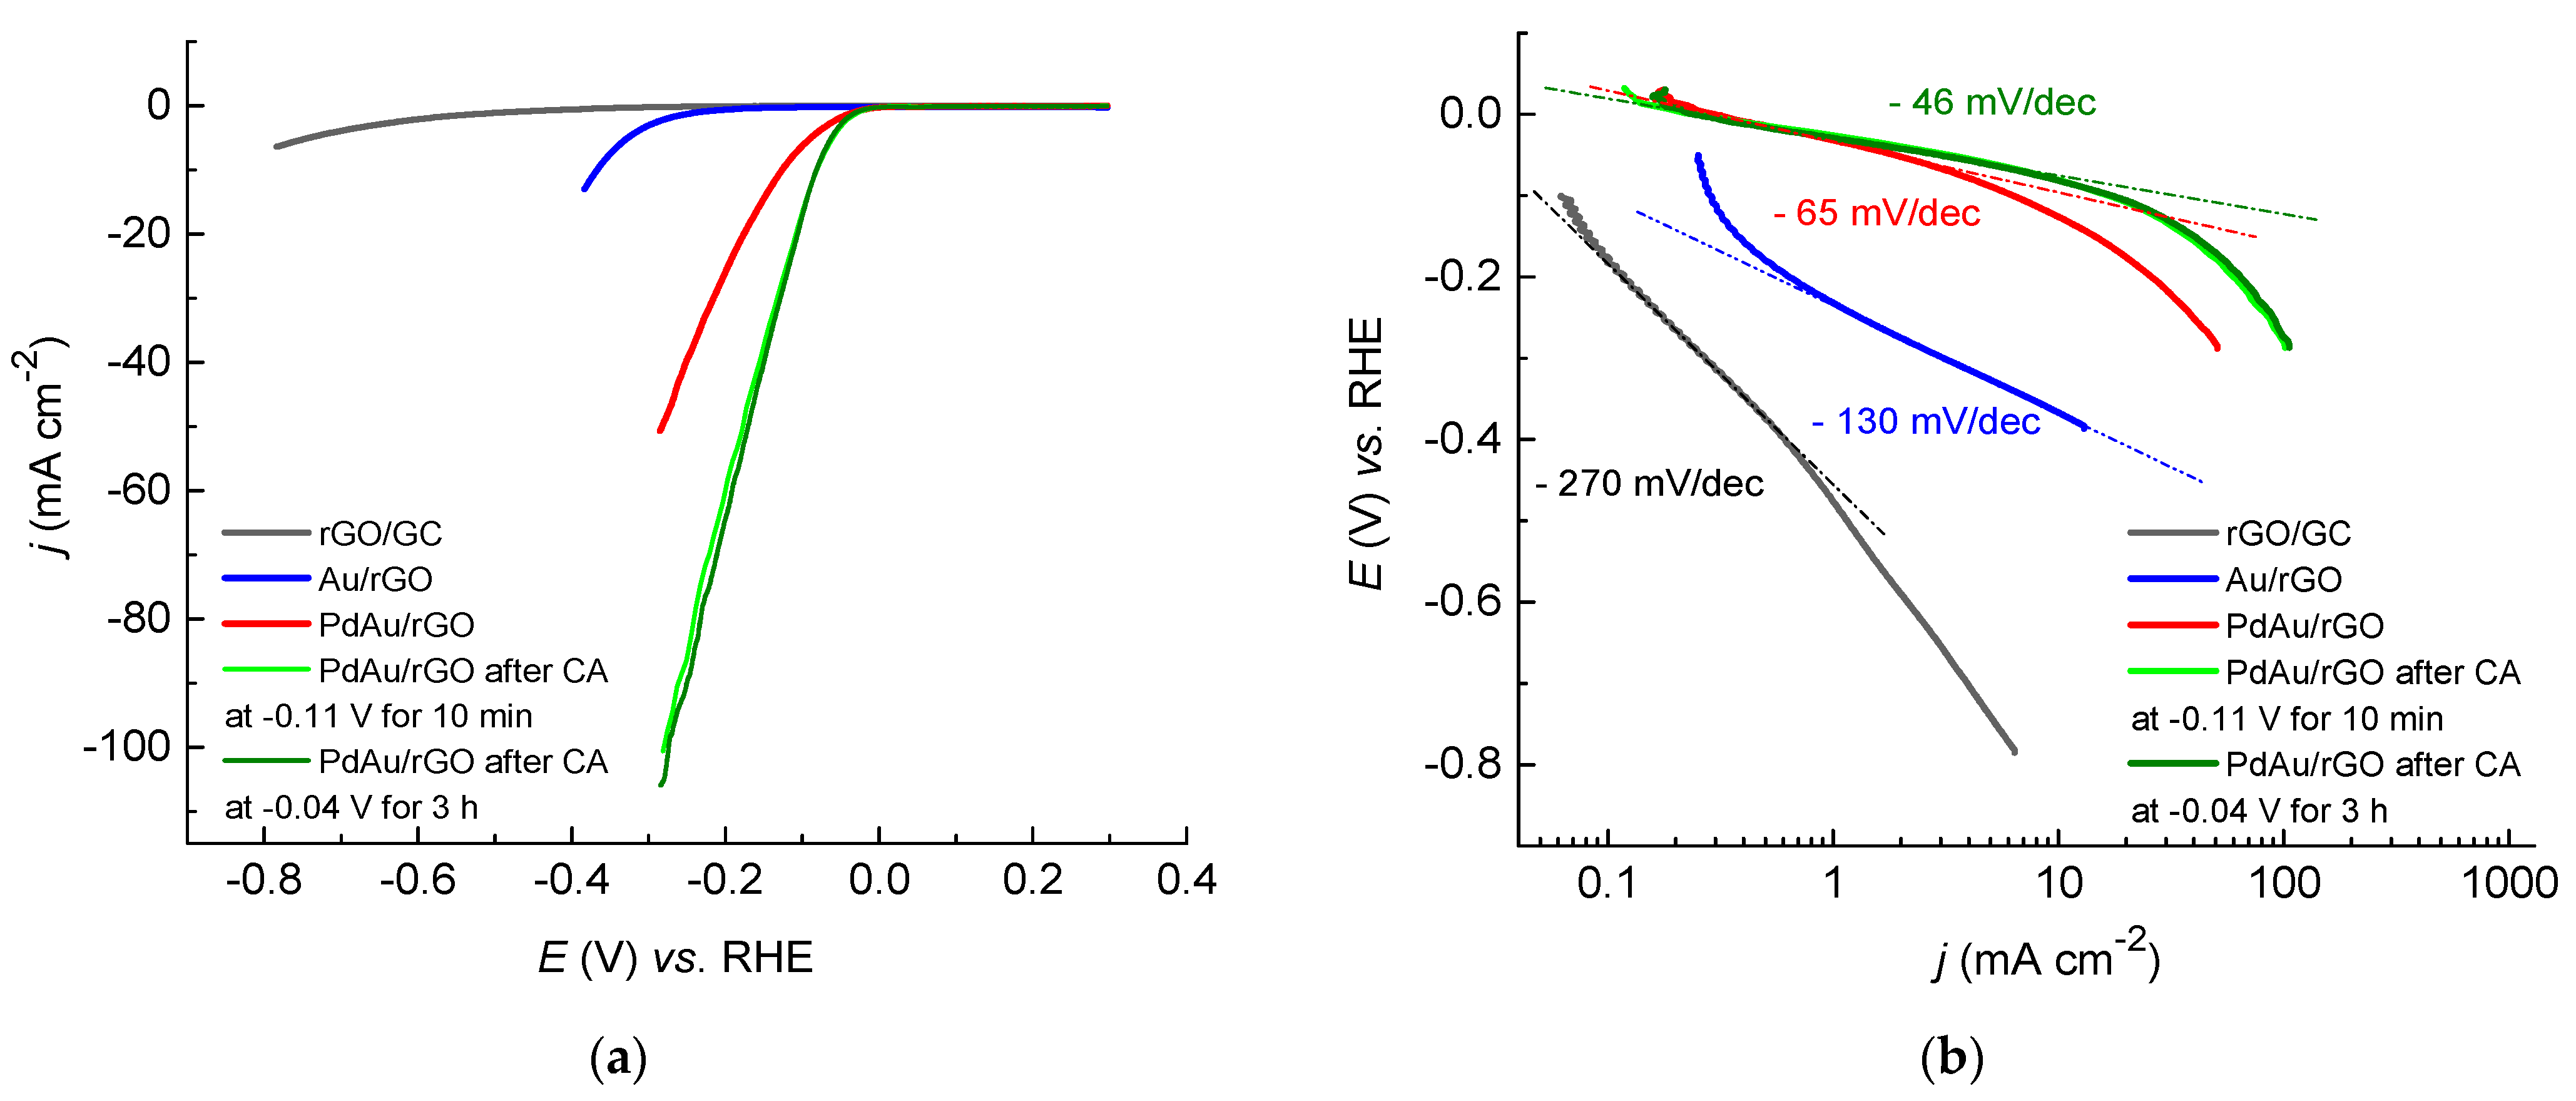
Figure 6 shows LSV curves and the corresponding Tafel slopes for HER on bare rGO/GC, Au/rGO, and PdAu/rGO electrodes. Among polarization curves for HER in Figure 6a, also presented are the ones for PdAu/rGO recorded after holding the potential at −0.11 V for 10 min, and additionally at −0.04 V for 3 h.
The onset potential of approx. −0.25 V for HER on rGO/GC is much higher than for similar carbon-based electrodes [13,33], including various graphene structures [9,34,35,36]. Besides, higher current densities for a given potential indicate higher activity for HER of the bare rGO/GC substrate electrode used in this work.
The onset potential of –0.09 V for HER on Au/rGO obtained by a spontaneous deposition of Au on rGO/GC is the same as for Au/GC prepared by the electrochemical deposition of Au on bare GC [13], demonstrating similar catalytic activity of both electrodes.
On the other hand, the PdAu/rGO electrode shows an onset potential of approx. −0.01 V, which is almost equal to the equilibrium potential for HER. This demonstrates the extraordinarily high activity for HER of the electrode consisting of a low atomic percentage of Au and Pd (see Table 1). The PdAu/rGO electrode becomes even more active after holding the potential during the chronoamperometry measurements (see below), with the same onset potentials but higher current densities. Comparing the activity for HER of the Au/rGO for the same current density of −5.0 mA/cm2, the potential for HER is shifted positively by 240 mV (from −0.33 V for Au/rGO to −0.09 V for PdAu/rGO), and an additional 30 mV after CA measurements.
Figure 6b shows the corresponding Tafel slopes for HER on the bare and modified rGO electrodes. The high value of −270 mV/dec for bare rGO indicates a slow reaction rate, as already reported in the literature [34,35,36]. The Tafel slope of −130 mV/dec, which is obtained for Au/rGO, indicates that the Volmer step is the rate-determining step in the Volmer–Heyrovsky mechanism. This slope is reported for various gold structures [8,37]. The slope of −65 mV/dec for the PdAu/rGO electrode indicates a faster reaction rate, and a Volmer–Heyrovsky mechanism with a slow Volmer step. The same is obtained in our previous work for Pd and Au nanoparticles deposited on a GC substrate [13]. The lowest slope of −46 mV/dec is obtained on PdAu/rGO after CA measurements, which indicates faster kinetics. The same value is obtained for AuPd nanoclusters supported on graphitic carbon nitride [10].
This decrease in the Tafel slope in a sequence: rGO/GC > Au/rGO > PdAu/rGO > activated PdAu/rGO, indicates a respective increase in the reaction rate. In addition, the change in the rate-determining step, and the reaction mechanism for all investigated electrodes cannot be determined with certainty due to their dependence on the coverage of adsorbed hydrogen, as well as on the potential as discussed comprehensively in ref. [38].

2.3.3. Stability and Durability Test for HER on PdAu/rGO Electrode

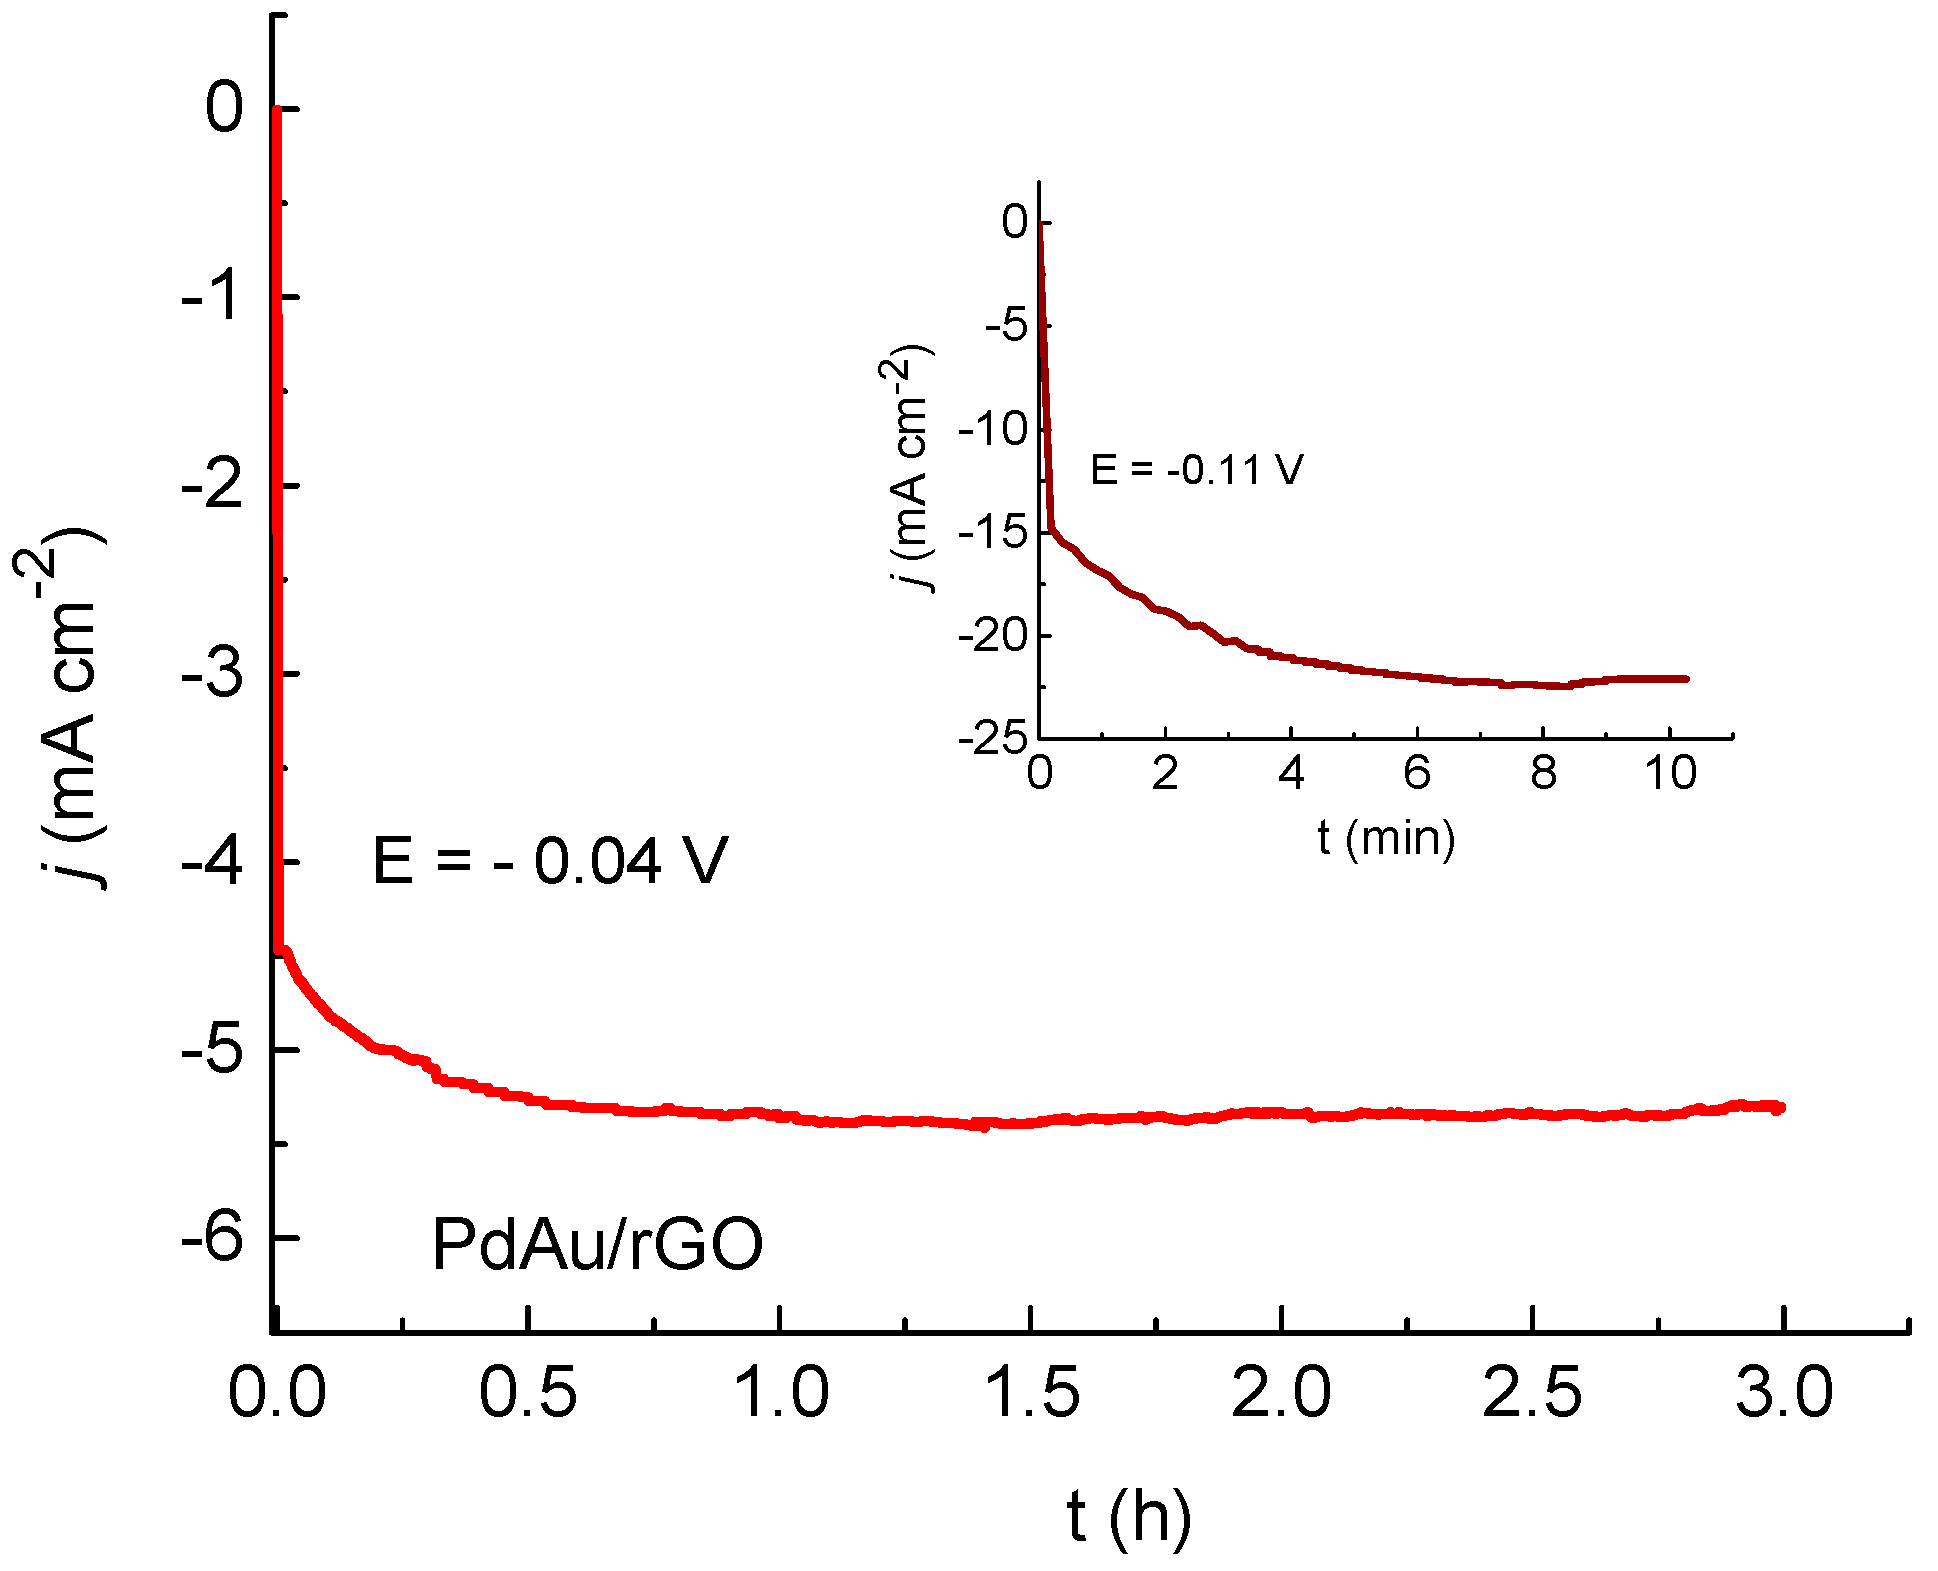
For the stability and durability test, chronoamperometry curves for HER on PdAu/rGO were recorded in deaerated 0.5 M H2SO4, at a constant potential and with the electrode rotating at 2500 rpm, and presented in Figure 7. The PdAu/rGO electrode was first subjected to a potential of −0.11 V for 10 min, insert in Figure 7. High hydrogen evolution current densities were immediately reached, with visible bubbles on the electrode surface, achieving a constant value of −22.3 mA/cm2 after 7 min. The LSV curve recorded after shows improved catalytic properties for HER compared to the one before holding the potential (see Figure 6a). In the second CA measurement, the holding potential was –0.04 V, and the duration was 3 h. The activity for HER increased during the first hour then stabilized at −5.3 mA/cm2. The LSV curve recorded after that shows no difference with the first one recorded after holding the potential for 10 min at −0.11 V (see Figure 6a). These indicate that the PdAu/rGO was activated and stabilized after the first CA measurement. Such activation of the electrode during prolonged test measurements is commonly found in the literature [9,10,11].
Besides, the hydrogen yield was calculated from the LSV curves recorded immediately after the PdAu/rGO electrode preparation (red curve in Figure 6a) and after CA at a constant potential of −0.04 V for 3 h (olive curve in Figure 6a). Both curves were integrated over the potential range from 0.0 to −0.3 V, i.e., for the hydrogen evolution duration of 30 s. For HER on prepared PdAu/rGO, the amount of evolved hydrogen was 5.2 × 10⁻¹⁰ mol, while after activation during CA measurement, the hydrogen yield was 12.4 × 10⁻¹⁰ mol. Finally, the PdAu/rGO electrode activated during prolonged hydrogen evolution is the most active one concerning both the onset potential and reaction rate.
We can only speculate about the origin of such high activity for HER of the PdAu/rGO electrode. Namely, according to AFM analysis, nanosized PdAu nanoparticles are situated on graphene edges. The XPS study revealed a low atomic percentage of both metals on the PdAu/rGO surface, and that PdAu nanoparticles consist of 15% Au and 85% Pd. Besides, the intrinsic Pd activity for HER enhances when diluted with a low amount of Au. Due to the low amount of both metals on the PdAu/rGO electrode, the density and size distribution of PdAu nanoparticles cannot be determined precisely. In many previous studies, the catalytic activity was correlated with the size and composition of PdAu nanoparticles. The catalytic effect of Au addition to Pd for hydrogen production, where it prevents Pd deactivation, is reported for formic acid dehydrogenation over a carbon-supported PdAu catalyst [39]. The effect of the composition on the activity for HER in an acid solution is reported for PdxAuy nanoparticles supported on carbon-based materials [12,13,40]. In this case, we can speculate that graphene edges and other defect sites rich in PdAu nanoparticles provide many active surface sites for proton reduction and subsequent hydrogen adsorption and evolution. The low content of Au in PdAu nanoparticles contributes to the dilution of the deposited Pd with Au and the formation of more active sites suitable for hydrogen adsorption, not only on the edges but also on top of the PdAu nanoparticles.
The activation of the PdAu/rGO electrode for HER is most likely caused by the disintegration and rearrangement of PdAu nanoparticles during the hydrogen evolution reaction, either with prolonged cycling (LSV measurements) or while holding the potential in the HER potential region (CA measurements). Such disintegration and rearrangement of the deposited Ru and Os nanoislands spontaneously deposited on Au(111) and induced by higher potentials are previously reported [41,42], and this most likely occurs during the hydrogen evolution reaction.
Further studies about surface active sites for hydrogen adsorption of PdAu nanoparticles are needed, including surface characterization after potential cycling or holding the potential in the hydrogen evolution region.

3. Materials and Methods

3.1. Materials Preparation

3.1.1. Graphene Synthesis

Graphene was synthesized by the electrochemical exfoliation of spectral graphite (carbon rod 5 mm dia., Specpure, Grade 2, Johnson Matthey Chemicals Ltd., London, UK) in 1 M H3PO4 solution according to the procedure described in ref. [43]. Graphite rods connected to the DC power supply were used as the anode and cathode electrodes. The distance between the electrodes was about 5 cm. A voltage of 1.0 V was applied for 5 min first, and after that it was raised to 7.0 V and held for 10 min. The poles of the graphite bars were changed every 10 min. After exfoliation, the resulting solution was filtered and the filtrate was washed with water. The graphite filter paper was dried for several hours at 110 °C. The resulting powder was dissolved in ethanol and treated in an ultrasonic bath for about 4 h. A suspension containing 3 g/L of thus synthesized graphene was further used for graphene/GC electrode preparation.

3.1.2. Preparation of Au/rGO and PdAu/rGO Electrodes

The rGO/GC substrate electrode was prepared by applying the graphene suspension containing 3 g/L of synthesized graphene dropwise and drying successively to a total weight of 0.075 mg of graphene on a 5 mm radius GC electrode, i.e., 0.38 mg/cm2. The Au/rGO electrode was prepared by spontaneous deposition of gold from 1 mM HAuCl4 + 0.5 M H2SO4 solution for 10 min. The PdAu/rGO electrode was prepared by depositing palladium spontaneously from 1 mM PdSO4 + 0.05 M H2SO4 solution for 30 min on the previously obtained Au/rGO electrode. The spontaneous deposition involved the immersion of the electrodes at the open-circuit potential into the depositing solutions at room temperature. To produce PdAu nanoparticles consisting of a lower amount of Au than Pd, the immersion time for Au deposition was lower than for subsequent Pd deposition.

3.2. Materials Characterization

AFM imaging of rGO/GC, Au/rGO, and PdAu/rGO electrodes was performed ex situ using Multimode Quadrex SPM (Veeco Instruments, Inc., Plainview, NY, USA). The height and phase AFM images were recorded simultaneously in a tapping mode using a silicon probe with a radius ≤ 10 nm (Vista probes).
XPS characterization of the electrodes was carried out using the SPECS System with an XP50M X-ray source for the Focus 500 and PHOIBOS 100/150 analyzer. An AlKα source (1486.74 eV) at 12.5 kV and 32 mA was used for this study. XPS spectra were obtained at a pressure of 7 × 10⁻⁹ mbar. To minimize the effects of charging on the samples, a SPECS FG15/40 electron flood gun was used for charge neutralization. All the peak positions were referenced to C 1s at 284.8 eV. Spectra were collected by SpecsLab data analysis software and analyzed using the CasaXPS software package, both supplied by the manufacturer.

3.3. Electrochemical Measurements

Electrochemical measurements were performed by Pine potentiostat in a three-electrode cell, where the working rGO/GC, Au/rGO, or PdAu/rGO electrode was mounted into the Teflon holder in a rotating disk electrode set up. The counter electrode was a Pt wire, and the reference electrode was Ag/AgCl, 3 M KCl. All potential scales and all potential values in the text are given vs. the reference hydrogen electrode (RHE). Electrochemical characterization of the electrodes was performed by cyclic voltammetry, while their electrocatalytic activity for HER was examined using linear sweep voltammetry and chronoamperometry, all in deaerated 0.5 M H2SO4 solution.

3.4. Chemicals

Suprapure H3PO4 (Fisher Chemical, Hampton, NH, USA) was used for graphite exfoliation, and ethanol (96%, Merck, Darmstadt, Germany) for resulting graphene powder dissolution. Depositing Au and Pd solutions were prepared using HAuCl4(aq) (MaTeck, Jülich, Germany), PdSO4·2H2O (Alfa Aesar, Haverhill, MA, USA), and suprapure H2SO4 (Merck). Working electrolyte solutions were prepared using suprapure H2SO4 (Merck). Milli-pure water was used for all solutions. The electrochemical measurements were performed in solutions deaerated by N2 (99.9995%, Messer, Frankfurt, Germany).

4. Conclusions

PdAu/rGO electrode preparation involved successive spontaneous deposition of Au and Pd. The XPS results revealed that PdAu nanoparticles consist of 85% Pd and 15% Au. The analysis of phase AFM images showed that 20–50 nm large PdAu nanoparticles occupy the edges of reduced graphene sheets. The PdAu nanoparticles edges are supposed to be the active sites for HER. During prolonged hydrogen evolution, PdAu nanoparticles most likely undergo disintegration and rearrangement. This causes the initial increase and subsequent stabilization in the activity of the PdAu/rGO electrode for HER. The reaction begins at −0.01 V, while the Tafel slope after prolonged hydrogen evolution is −46 mV/dec.

Author Contributions

Conceptualization, S.Š., I.S. and L.R.; graphene synthesis, A.M.; electrodes preparation, I.S., AFM characterization, S.Š.; XPS characterization, L.R.; electrochemical measurements, I.S., J.G., and L.R.; writing—original draft preparation, I.S., A.M., L.R.; writing—review and editing, S.Š.; supervision, S.Š. All authors have read and agreed to the published version of the manuscript.

Funding

This research was funded by the Ministry of Education, Science and Technological Development of the Republic of Serbia.

Conflicts of Interest

The authors declare no conflict of interest.

References

  1. Hou, J.; Yang, M.; Ke, C.; Wei, G.; Priest, C.; Qiao, Z.; Wu, G.; Zhang, J. Platinum-group-metal catalysts for proton exchange membrane fuel cells: From catalyst design to electrode structure optimization. Energy Chem. 2020, 2, 100023. [Google Scholar] [CrossRef]
  2. Zheng, J.; Sheng, W.; Zhuang, Z.; Xu, B.; Yan, Y. Universal dependence of hydrogen oxidation and evolution reaction activity of platinum-group metals on pH and hydrogen binding energy. Sci. Adv. 2016, 2, e1501602. [Google Scholar] [CrossRef] [Green Version]
  3. Martín, A.; Escarpa, A. Graphene: The cutting–edge interaction between chemistry and electrochemistry. Trends Analyt. Chem. 2014, 56, 13–26. [Google Scholar] [CrossRef]
  4. Garlyyev, B.; Fichtner, J.; Piqué, O.; Schneider, O.; Bandarenka, A.S.; Calle-Vallejo, F. Revealing the nature of active sites in electrocatalysis. Chem. Sci. 2019, 10, 8060–8075. [Google Scholar] [CrossRef] [PubMed] [Green Version]
  5. Nørskov, J.K.; Bligaard, T.; Logadottir, A.; Kitchin, J.R.; Chen, J.G.; Pandelov, S.; Stimming, U. Trends in the exchange current for hydrogen evolution. J. Electrochem. Soc. 2005, 152, J23–J26. [Google Scholar] [CrossRef] [Green Version]
  6. Kibler, L.A. Hydrogen electrocatalysis. ChemPhysChem 2006, 7, 985–991. [Google Scholar] [CrossRef] [PubMed]
  7. Pandelov, S.; Stimming, U. Reactivity of monolayers and nanoislands of palladium on Au(111) with respect to proton reduction. Electrochim. Acta 2007, 52, 5548–5555. [Google Scholar] [CrossRef]
  8. Smiljanić, M.; Srejić, I.; Grgur, B.; Rakočević, Z.; Štrbac, S. Catalysis of hydrogen evolution on Au(111) modified by spontaneously deposited Pd islands. Electrocatalysis 2012, 3, 369–375. [Google Scholar] [CrossRef]
  9. Darabdhara, G.; Amin, M.A.; Mersal, G.A.M.; Ahmed, E.M.; Das, M.R.; Zakaria, M.B.; Malgras, V.; Alshehri, S.M.; Yamauchi, Y.; Szunerits, S.; et al. Reduced graphene oxide nanosheets decorated with Au, Pd and Au-Pd bimetallic nanoparticles as highly efficient catalysts for electrochemical hydrogen generation. J. Mater. Chem. A 2015, 3, 20254–20266. [Google Scholar] [CrossRef]
  10. Feng, J.-J.; Chen, L.-X.; Song, P.; Wu, X.-l.; Wang, A.-J.; Yuan, J. Bimetallic AuPd nanoclusters supported on graphitic carbon nitride: One-pot synthesis and enhanced electrocatalysis for oxygen reduction and hydrogen evolution. Int. J. Hydrog. Energy 2016, 41, 8839–8846. [Google Scholar] [CrossRef]
  11. Li, D.-N.; Wang, A.-J.; Wei, J.; Zhang, Q.-L.; Feng, J.-J. Facile synthesis of flower-like Au@AuPd nanocrystals with highly electrocatalytic activity for formic acid oxidation and hydrogen evolution reactions. Int. J. Hydrog. Energy 2017, 42, 19894–19902. [Google Scholar] [CrossRef]
  12. Choi, W.; Hu, G.; Kwak, K.; Kim, M.; Jiang, D.; Choi, J.-P.; Lee, D. Effects of metal-doping on hydrogen evolution reaction catalyzed by MAu24 and M2Au36 nanoclusters (M = Pt, Pd). ACS Appl. Mater. Interfaces 2018, 10, 44645–44653. [Google Scholar] [CrossRef]
  13. Rakočević, L.; Štrbac, S.; Srejić, I. Hydrogen evolution on Au/GC and PdAu/GC nanostructures in acid solution: AFM, XPS, and electrochemical study. Int. J. Hydrog. Energy 2021, 46, 9052–9063. [Google Scholar] [CrossRef]
  14. Morar, J.F.; Himpsel, F.J.; Hollinger, G.; Jordan, J.L.; Huges, G.; McFeely, F.R. C 1s excitation studies of diamond (111). I. Surface core levels. Phys. Rev. B 1986, 33, 1340–1345. [Google Scholar] [CrossRef] [PubMed]
  15. Al-Gaashani, R.; Najjar, A.; Zakaria, Y.; Mansour, S.; Atieh, M.A. XPS and structural studies of high quality graphene oxide and reduced graphene oxide prepared by different chemical oxidation methods. Ceram. Int. 2019, 45, 14439–14448. [Google Scholar] [CrossRef]
  16. Zhang, L.; Yang, L.Y.; Zhang, L.; Li, D.-W.; Karpuzov, D.; Long, Y.-T. Electrocatalytic oxidation of NADH on graphene oxide and reduced graphene oxide modified screen-printed electrode. Int. J. Electrochem. Sci. 2011, 6, 819–829. [Google Scholar]
  17. Morimoto, N.; Kubo, T.; Nishina, Y. Tailoring the oxygen content of graphite and reduced graphene oxide for specific applications. Sci. Rep. 2016, 6, 21715. [Google Scholar] [CrossRef] [PubMed]
  18. Chandrakumara, G.G.; Shang, J.; Qiu, L.; Fang, X.-Y.; Antolasic, F.; Easton, C.D.; Song, J.; Alan, T.; Li, D.; Liu, J.Z. Tuning the oxygen functional groups in reduced graphene oxide papers to enhance the electromechanical actuation. RSC Adv. 2015, 5, 68052–68060. [Google Scholar] [CrossRef]
  19. Heimann, P.; Van der Veen, J.F.; Eastman, D.E. Structure-dependent surface core level shifts for the Au(111), Au(100), and Au(110) surfaces. Solid State Commun. 1981, 38, 595–598. [Google Scholar] [CrossRef]
  20. Štrbac, S.; Smiljanić, M.; Rakočević, Z. Spontaneously deposited Rh on Au(111) observed by AFM and XPS: Electrocatalysis of hydrogen evolution. J. Electrochem. Soc. 2016, 163, D3027–D3033. [Google Scholar] [CrossRef]
  21. Štrbac, S.; Srejić, I.; Rakočević, Z. Catalysis of oxygen reduction on electrochemically activated polycrystalline gold by Pd nanoislands in alkaline solution. J. Electroanal. Chem. 2017, 789, 76–84. [Google Scholar] [CrossRef]
  22. Turner, N.H.; Single, A.M. Determination of peak positions and areas from wide-scan XPS spectra. Surf. Interface Anal. 1990, 15, 215–222. [Google Scholar] [CrossRef]
  23. Militello, M.C.; Simko, S.J. Elemental palladium by XPS. Surf. Sci. Spectra 1994, 3, 387–394. [Google Scholar] [CrossRef]
  24. Venezia, A.M.; Rossi, A.; Duca, D.; Martorana, A.; Deganello, G. Particle size and metal support interaction effects in pumice supported palladium catalysts. Appl. Catal. A 1995, 125, 113–128. [Google Scholar] [CrossRef]
  25. Bertolini, J.C.; Delichere, P.; Khanra, B.C.; Massardier, J.; Noupa, C.; Tardy, B. Electronic properties of supported Pd aggregates in relation with their reactivity for 1,3-butadiene hydrogenation. Catal. Lett. 1990, 6, 215–223. [Google Scholar] [CrossRef]
  26. Kim, K.S.; Grossmann, A.F.; Winograd, N. X-ray photoelectron spectroscopic studies of palladium oxides and the palladium-oxygen electrode. Anal. Chem. 1974, 46, 197–200. [Google Scholar] [CrossRef]
  27. Militello, M.C.; Simko, S.J. Palladium oxide (PdO) by XPS. Surf. Sci. Spectra 1994, 3, 395–401. [Google Scholar] [CrossRef]
  28. Moddeman, W.E.; Bowling, W.C.; Carter, D.C.; Grove, D.R. XPS surface and bulk studies of heat treated palladium in the presence of hydrogen at 150 °C. Surf. Interface Anal. 1988, 11, 317–326. [Google Scholar] [CrossRef]
  29. Marcelina, V.; Syaki, N.; Wyantuti, S.; Hartati, Y.W.; Hidayat, R. Fitrilawati Characteristic of Thermally Reduced Graphene Oxide as Supercapacitors Electrode Materials. IOP Conf. Ser. Mater. Sci. Eng. 2017, 196, 012034. [Google Scholar]
  30. Karbowska, B.; Rebis, T.; Milczarek, G. Electrode modified by reduced graphene oxide for monitoring of total thallium in grain products. Int. J. Environ. Res. Public Health 2018, 15, 653. [Google Scholar] [CrossRef] [Green Version]
  31. Juodkazis, K.; Juodkazytė, J.; Šebeka, B.; Stalnionis, G.; Lukinskas, A. Anodic dissolution of palladium in sulfuric acid: An electrochemical quartz crystal microbalance study. Russ. J. Electrochem. 2003, 39, 954–959. [Google Scholar] [CrossRef]
  32. Grdeń, M.; Łukaszewski, M.; Jerkiewicz, G.; Czerwiński, A. Electrochemical behaviour of palladium electrode: Oxidation, electrodissolution and ionic adsorption. Electrochim. Acta 2008, 53, 7583–7598. [Google Scholar] [CrossRef]
  33. Suffredini, H.B.; Machado, S.A.S.; Avaca, L.A. The water decomposition reactions on boron-doped diamond electrodes. J. Braz. Chem. Soc. 2004, 15, 16–21. [Google Scholar] [CrossRef] [Green Version]
  34. Ferrari, A.G.M.; Brownson, D.A.C.; Banks, C.E. Investigating the integrity of graphene towards the electrochemical hydrogen evolution reaction (HER). Sci. Rep. 2019, 9, 15961. [Google Scholar] [CrossRef]
  35. Ghasemi, S.; Hosseini, S.R.; Nabipour, S.; Asen, P. Palladium nanoparticles supported on graphene as an efficient electrocatalyst for hydrogen evolution reaction. Int. J. Hydrog. Energy 2015, 40, 16184–16191. [Google Scholar] [CrossRef]
  36. Ito, Y.; Cong, W.; Fujita, T.; Tang, Z.; Chen, M. High catalytic activity of nitrogen and sulfur co-doped nanoporous graphene in the hydrogen evolution reaction. Angew. Chem. Int. Ed. 2014, 53, 1–7. [Google Scholar]
  37. Wang, Y.; Sun, Y.; Liao, H.; Sun, S.; Li, S.; Ager, J.W., III; Xu, Z.J. Activation effect of electrochemical cycling on gold nanoparticles towards the hydrogen evolution reaction in sulfuric acid. Electrochim. Acta 2016, 209, 440–447. [Google Scholar] [CrossRef] [Green Version]
  38. Shinagava, T.; Garcia-Espanza, A.T.; Takanabe, K. Insight on Tafel slopes from a microkinetic analysis of aqueous electrocatalysis for energy conversion. Sci. Rep. 2015, 5, 13801. [Google Scholar] [CrossRef] [Green Version]
  39. Santos, J.L.; León, C.; Monnier, G.; Ivanova, S.; Centeno, M.Á.; Odriozola, J.A. Bimetallic PdAu catalysts for formic acid dehydrogenation. Int. J. Hydrog. Energy 2020, 45, 23056–23068. [Google Scholar] [CrossRef]
  40. Al-Odail, F.A.; Anastasopoulos, A.; Hayden, B.E. The hydrogen evolution reaction and hydrogen oxidation reaction on thin film PdAu alloy surfaces. Phys. Chem. Chem. Phys. 2010, 12, 11398–11406. [Google Scholar] [CrossRef]
  41. Štrbac, S.; Maroun, F.; Magnussen, O.; Behm, R.J. The structure, growth and reactivity of electrodeposited Ru/Au(111) surfaces. Electroanal. Chem. 2001, 500, 479–490. [Google Scholar] [CrossRef]
  42. Johnston, C.M.; Štrbac, S.; Wieckowski, A. In situ STM study of Au(111)/Os bimetallic surfaces: Spontaneous deposition and electrochemical dissolution. Langmuir 2005, 21, 9610–9617. [Google Scholar] [CrossRef] [PubMed]
  43. Liu, J.; Yang, H.; Zhen, S.G.; Poh, C.K.; Chaurasia, A.; Luo, J.; Wu, X.; Lee, E.K.; Sahoo, N.G.; Lin, J.; et al. A green approach to the synthesis of high-quality graphene oxide flakes via electrochemical exfoliation of pencil core. RSC Adv. 2013, 3, 11745–11750. [Google Scholar] [CrossRef]
Figure 1. Atomic force microscopy (AFM) images, (2 × 2) µm2, and X-ray photoelectron spectroscopy (XPS) spectra of the graphene/GC electrode. (a) A height image showing the surface morphology (z-range = 200 nm); (b) the corresponding phase image (z-range = 16 deg); (c) a high-resolution XPS spectrum of C 1s line, and (d) a high-resolution XPS spectrum of O 1s line.
Catalysts 11 00481 g001
Figure 2. Phase AFM images, (200 × 200) nm2, and corresponding cross sections of the following: (a) reduced grapheme oxide-supported Au (Au/rGO) (z-range = 36 deg), and (b) reduced grapheme oxide-supported PdAu (PdAu/rGO) (z-range = 43 deg).
Catalysts 11 00481 g002
Figure 3. Survey XPS spectra showing the main photoelectron lines of reduced graphene oxide (rGO), Au/rGO, and PdAu/rGO.
Catalysts 11 00481 g003
Figure 4. High-resolution XPS spectra of the following: (a) Au 4f line for Au/rGO; (b) Au 4f line for PdAu/rGO; (c) Au 4d line for Au/rGO, and (d) Au 4d + Pd 3d lines for PdAu/rGO.
Catalysts 11 00481 g004
Figure 5. Cyclic voltammograms of the PdAu/rGO electrode recorded in 0.5 M H2SO4 solution with the opening of the upper potential limit. The inset shows the cyclic voltammetry (CV) curve of a bare rGO electrode. The scan rate was 50 mV/s.
Catalysts 11 00481 g005
Figure 6. Hydrogen evolution reaction (HER) on bare rGO, Au/rGO and PdAu/rGO electrodes. (a) LSV curves recorded in 0.5 M H2SO4 at a sweep rate of 10 mV/s and (b) the corresponding Tafel slopes.
Catalysts 11 00481 g006
Figure 7. Chronoamperometry measurements recorded on the PdAu/rGO electrode at a constant potential of −0.11 V vs. the reference hydrogen electrode (RHE) for 10 min (insert figure), and at a constant potential of −0.04 V vs. RHE for 3 h.
Catalysts 11 00481 g007
Table 1. Atomic percentage (at%) of the elements constituting Au/rGO and PdAu/rGO electrodes.
LineAu/rGO Electrode
at%
PdAu/rGO Electrode
at%
C 1s87.3785.35
O 1s11.3413.31
Au 4f7/21.180.21
Pd 3d5/2 1.13
Publisher’s Note: MDPI stays neutral with regard to jurisdictional claims in published maps and institutional affiliations.