Article

Visible Light Driven Photocatalytic Decolorization and Disinfection of Water Employing Reduced TiO2 Nanopowders

by
Xiaolan Kang
1,†,
Chrysanthi Berberidou
2,*,†,
Augustinas Galeckas
3,
Calliope Bazioti
3,
Einar Sagstuen
4,
Truls Norby
1,
Ioannis Poulios
2 and
Athanasios Chatzitakis
1,*
1
Centre for Materials Science and Nanotechnology, Department of Chemistry, University of Oslo, FERMiO, Gaustadalléen 21, NO-0349 Oslo, Norway
2
Department of Chemistry, Aristotle University of Thessaloniki, 54124 Thessaloniki, Greece
3
Centre for Materials Science and Nanotechnology, Department of Physics, University of Oslo, P.O. Box 1048 Blindern, NO-0316 Oslo, Norway
4
Department of Physics, University of Oslo, P.O. Box 1048 Blindern, NO-0316 Oslo, Norway
*
Authors to whom correspondence should be addressed.
Equally contributing authors.
Catalysts 2021, 11(2), 228; https://doi.org/10.3390/catal11020228
Submission received: 27 December 2020 / Revised: 29 January 2021 / Accepted: 5 February 2021 / Published: 9 February 2021

Abstract

:
Defect-engineering of TiO2 can have a major impact on its photocatalytic properties for the degradation of persisting and non-biodegradable pollutants. Herein, a series of intrinsic and extrinsic defects are induced by post annealing of crystalline TiO2 under different reducing atmospheres. A detailed optoelectronic characterization sheds light on the key characteristics of the defect-engineered TiO2 nanopowders that are linked to the photocatalytic performance of the prepared photocatalysts. The photodegradation of a model dye, malachite green, as well as the inactivation of bacterial endospores of the Geobacillus stearothermophilus species were studied in the presence of the developed catalysts under visible light illumination. Our results indicate that a combination of certain defects is necessary for the improvement of the photocatalytic process for water purification and disinfection under visible light.

1. Introduction

Semiconductor photocatalysis has attracted great attention in the last decades due to the potential and prospects it offers in a variety of fields including environmental remediation, energy production, and organic synthesis [1]. The exploitation of solar energy in the presence of nanostructured semiconductors and mild environmental conditions may serve as a reliable alternative to energy-intensive conventional technologies [2,3].
A well-established material for photocatalytic applications is TiO2 (anatase) because of its high photocatalytic activity, resistance to photo-corrosion, biological inertness, and low cost. [4,5,6]. Several strategies have been applied to tackle the main disadvantage of TiO2, which is its inability to be activated by visible light due to its high band gap energy. Strategies such as doping with transition-metal ions (Fe, W, Mo, V, and many others), dye sensitization (Ru-, Os-, Zn-complexes, etc.), as well as non-metal ion doping with nitrogen serving as probably the most popular and efficient dopant [7,8,9]. It has been found that substitutional doping of N introduces p states that, combined with the O 2p states of TiO2, contribute to its bandgap narrowing. In addition, interstitial N doping couples with lattice O, creating antibonding states in the bandgap of the material [10,11]. These states are located close to the valence band (VB) of TiO2, and ionized electrons coming from the VB can be accommodated. In turn, this increases the concentration of holes in the VB. Additionally, electrons from these states can be photoexcited by longer wavelengths improving the performance of TiO2 under visible light irradiation [12,13].
Recently, the colorful chemistry of TiO2 has been revealed and especially important was the development of black TiO2 by Chen and co-workers [14]. In the latter case, the formation of oxygen vacancies, Ti3+ states, as well as of core-shell crystalline-disorder structures, Ti-H and Ti-OH species, has extended the activation potential of TiO2 even in the IR region of the light spectrum. Since the discovery of black TiO2 in 2011, there have been numerous reports of the improved photocatalytic activity and electronic conductivity of TiO2, leading to enhanced photocatalytic efficiencies both in the degradation of organic molecules, and the production of solar fuels [14,15,16,17,18].
In this work, TiO2 nanopowders were synthesized via the sol-gel method and were then sensitized by (a) high temperature nitridation in NH3 atmosphere and (b) reduction in H2 atmosphere. The synthesized N-doped and black TiO2 nanopowders were then tested for their efficiency on the decomposition of a model and non-biodegradable organic pollutant as well as on the inactivation of highly resistant biological targets, in the presence of visible light. Both N-doped and black TiO2 are well-known material classes and they have been extensively studied in the literature. However, a direct comparison of their efficacy and efficiency in the visible light-driven water remediation coupled to their intrinsic and extrinsic defects (oxygen vacancies, Ti3+, N lattice heteroatoms) is not common. Our work showcases how certain defects are associated with the photocatalytic performance of two important forms of TiO2.
More specifically, an evaluation of photocatalytic efficiencies of the as prepared TiO2 nanopowders under visible light was conducted based on the degradation of an organic, triarylmethane dye, malachite green (MG). Organic dyes are used in a wide range of applications including textile, leather, and paper production industries, laser technology, photoelectrochemical, and dye-sensitized solar cells [19,20,21]. It is estimated that approximately 7 × 10⁵ tons of dyes are produced annually, while more than 105 tons per year are released in output flows, severely contaminating aquatic bodies. Organic dyes are in most cases soluble in water, non-biodegradable, and toxic to humans and ecosystems, rendering their efficient removal from waterbodies of the outmost importance [22,23]. MG, in particular, is annually produced in thousands of tons and consumed mainly in the textile and paper industry [24]. MG is also used as one of the most effective fungicides and ectoparasiticides in aquaculture and fisheries [25] and may persist in edible fish tissues for extended periods of time [26]. Furthermore, MG is used in medical applications as a disinfectant and a biological stain or counterstain for microscopic analysis of cell biology and tissue samples. In spite of its extended use, MG is a highly controversial material due to its toxic properties which are known to cause respiratory problems, carcinogenesis, mutagenesis and teratogenicity [27].
After investigation of the photocatalytic degradation of MG in the presence of the as prepared photocatalysts and visible irradiation, the study focused on the catalysts with the optimum photocatalytic properties and their potential to inactivate bacterial endospores of the Geobacillus stearothermophilus species. After prions [28] and along with certain protozoans, endospores demonstrate the highest resistance to harsh environmental conditions, enabling them to survive in dormant state for up to thousands of years and to germinate when conditions become favorable. Endospores, such as G. stearothermophilus exhibit a remarkably high degree of resistance to inactivation by most physical treatments and oxidizing agents [29,30]. Bacterial endospores can serve as excellent reference tools in inactivation studies, due to the remarkable stability of their suspensions [31].

2. Results

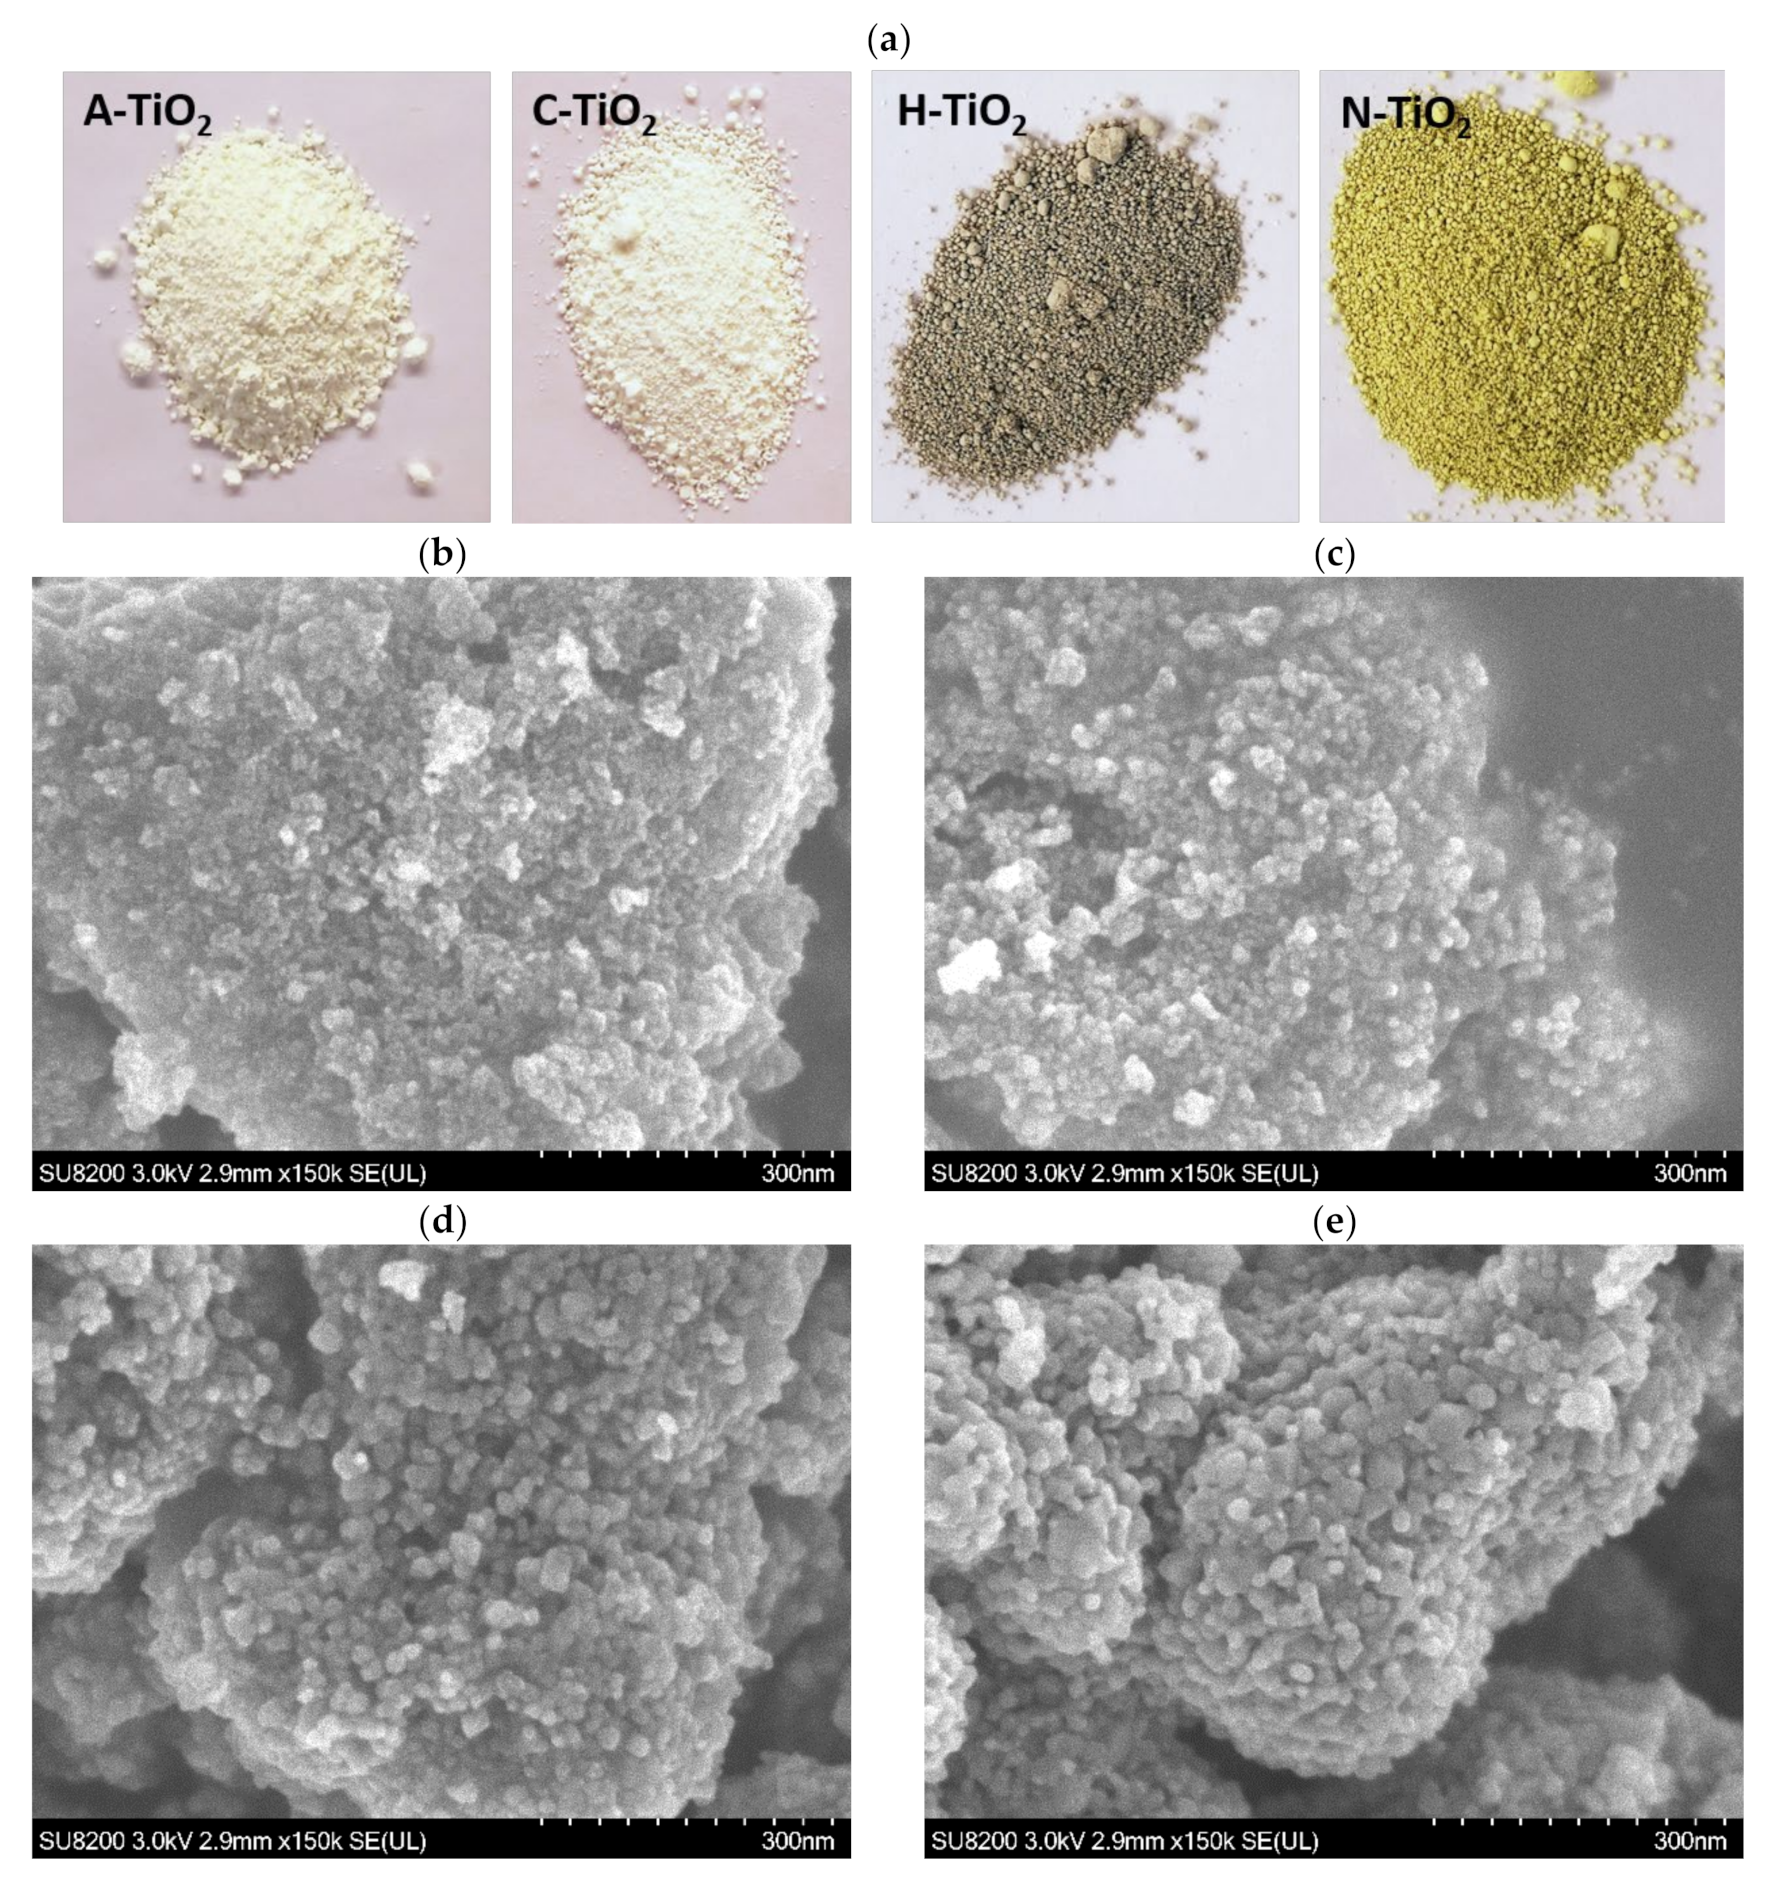
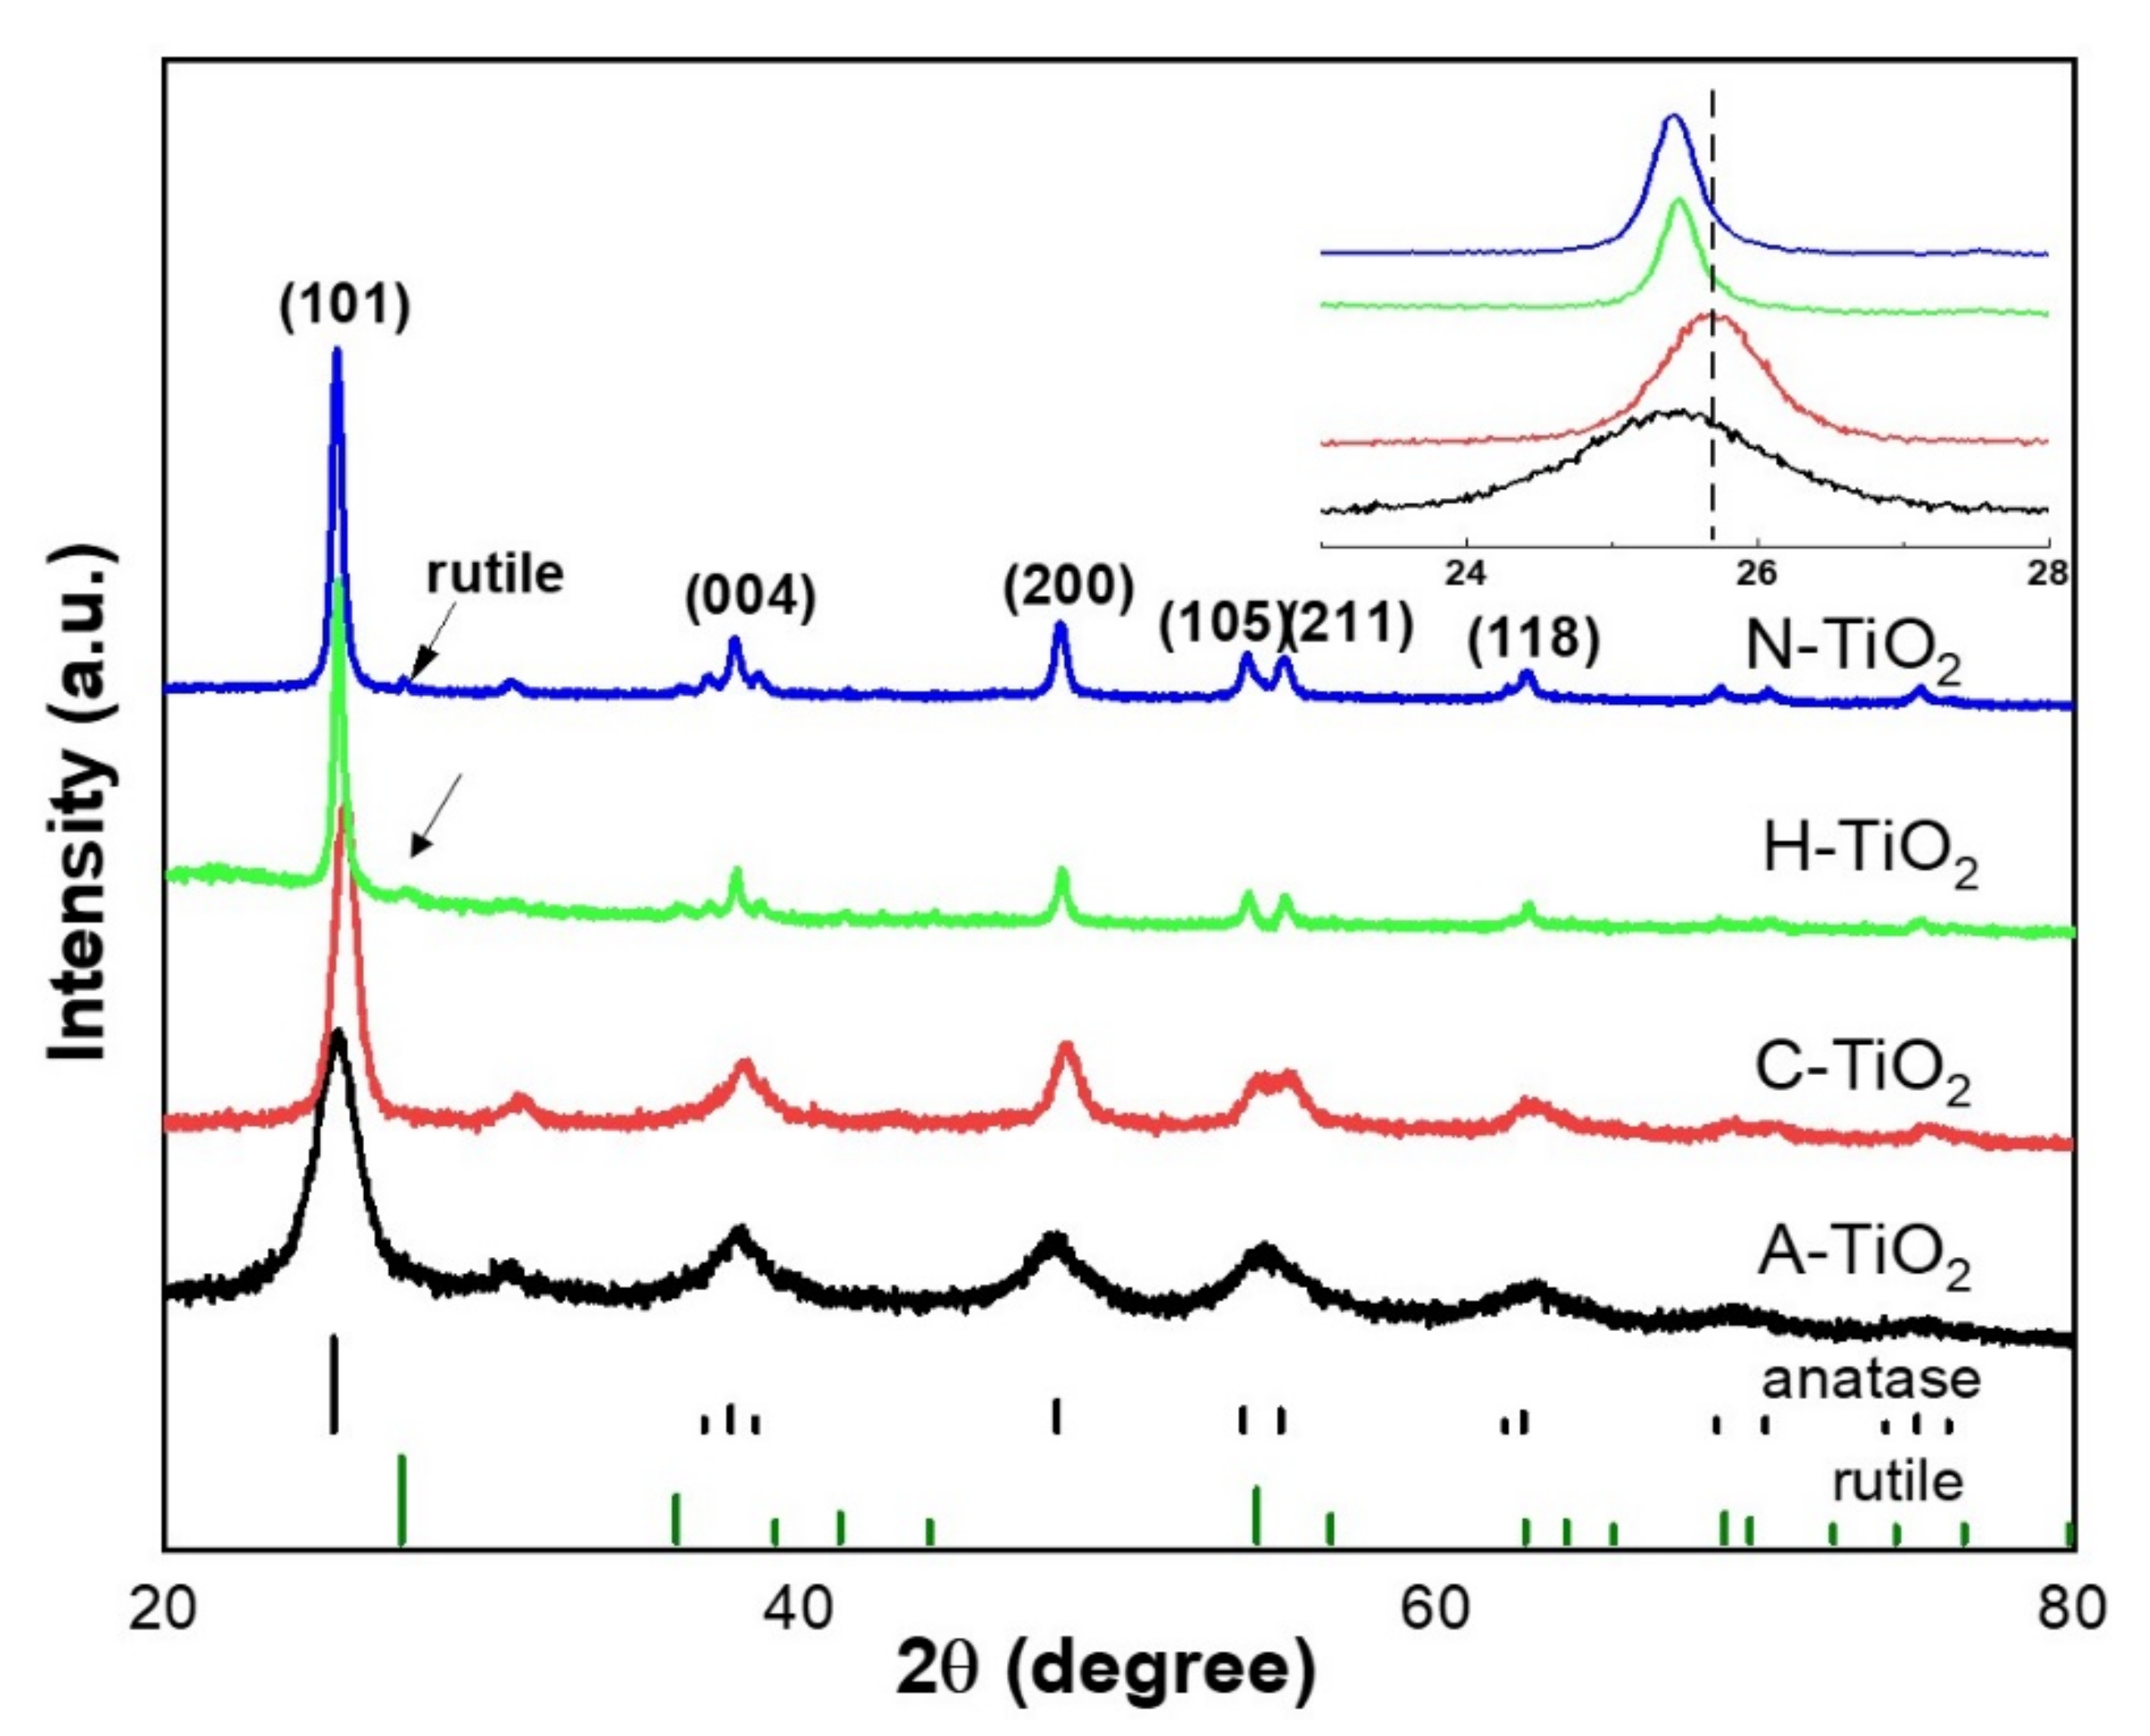
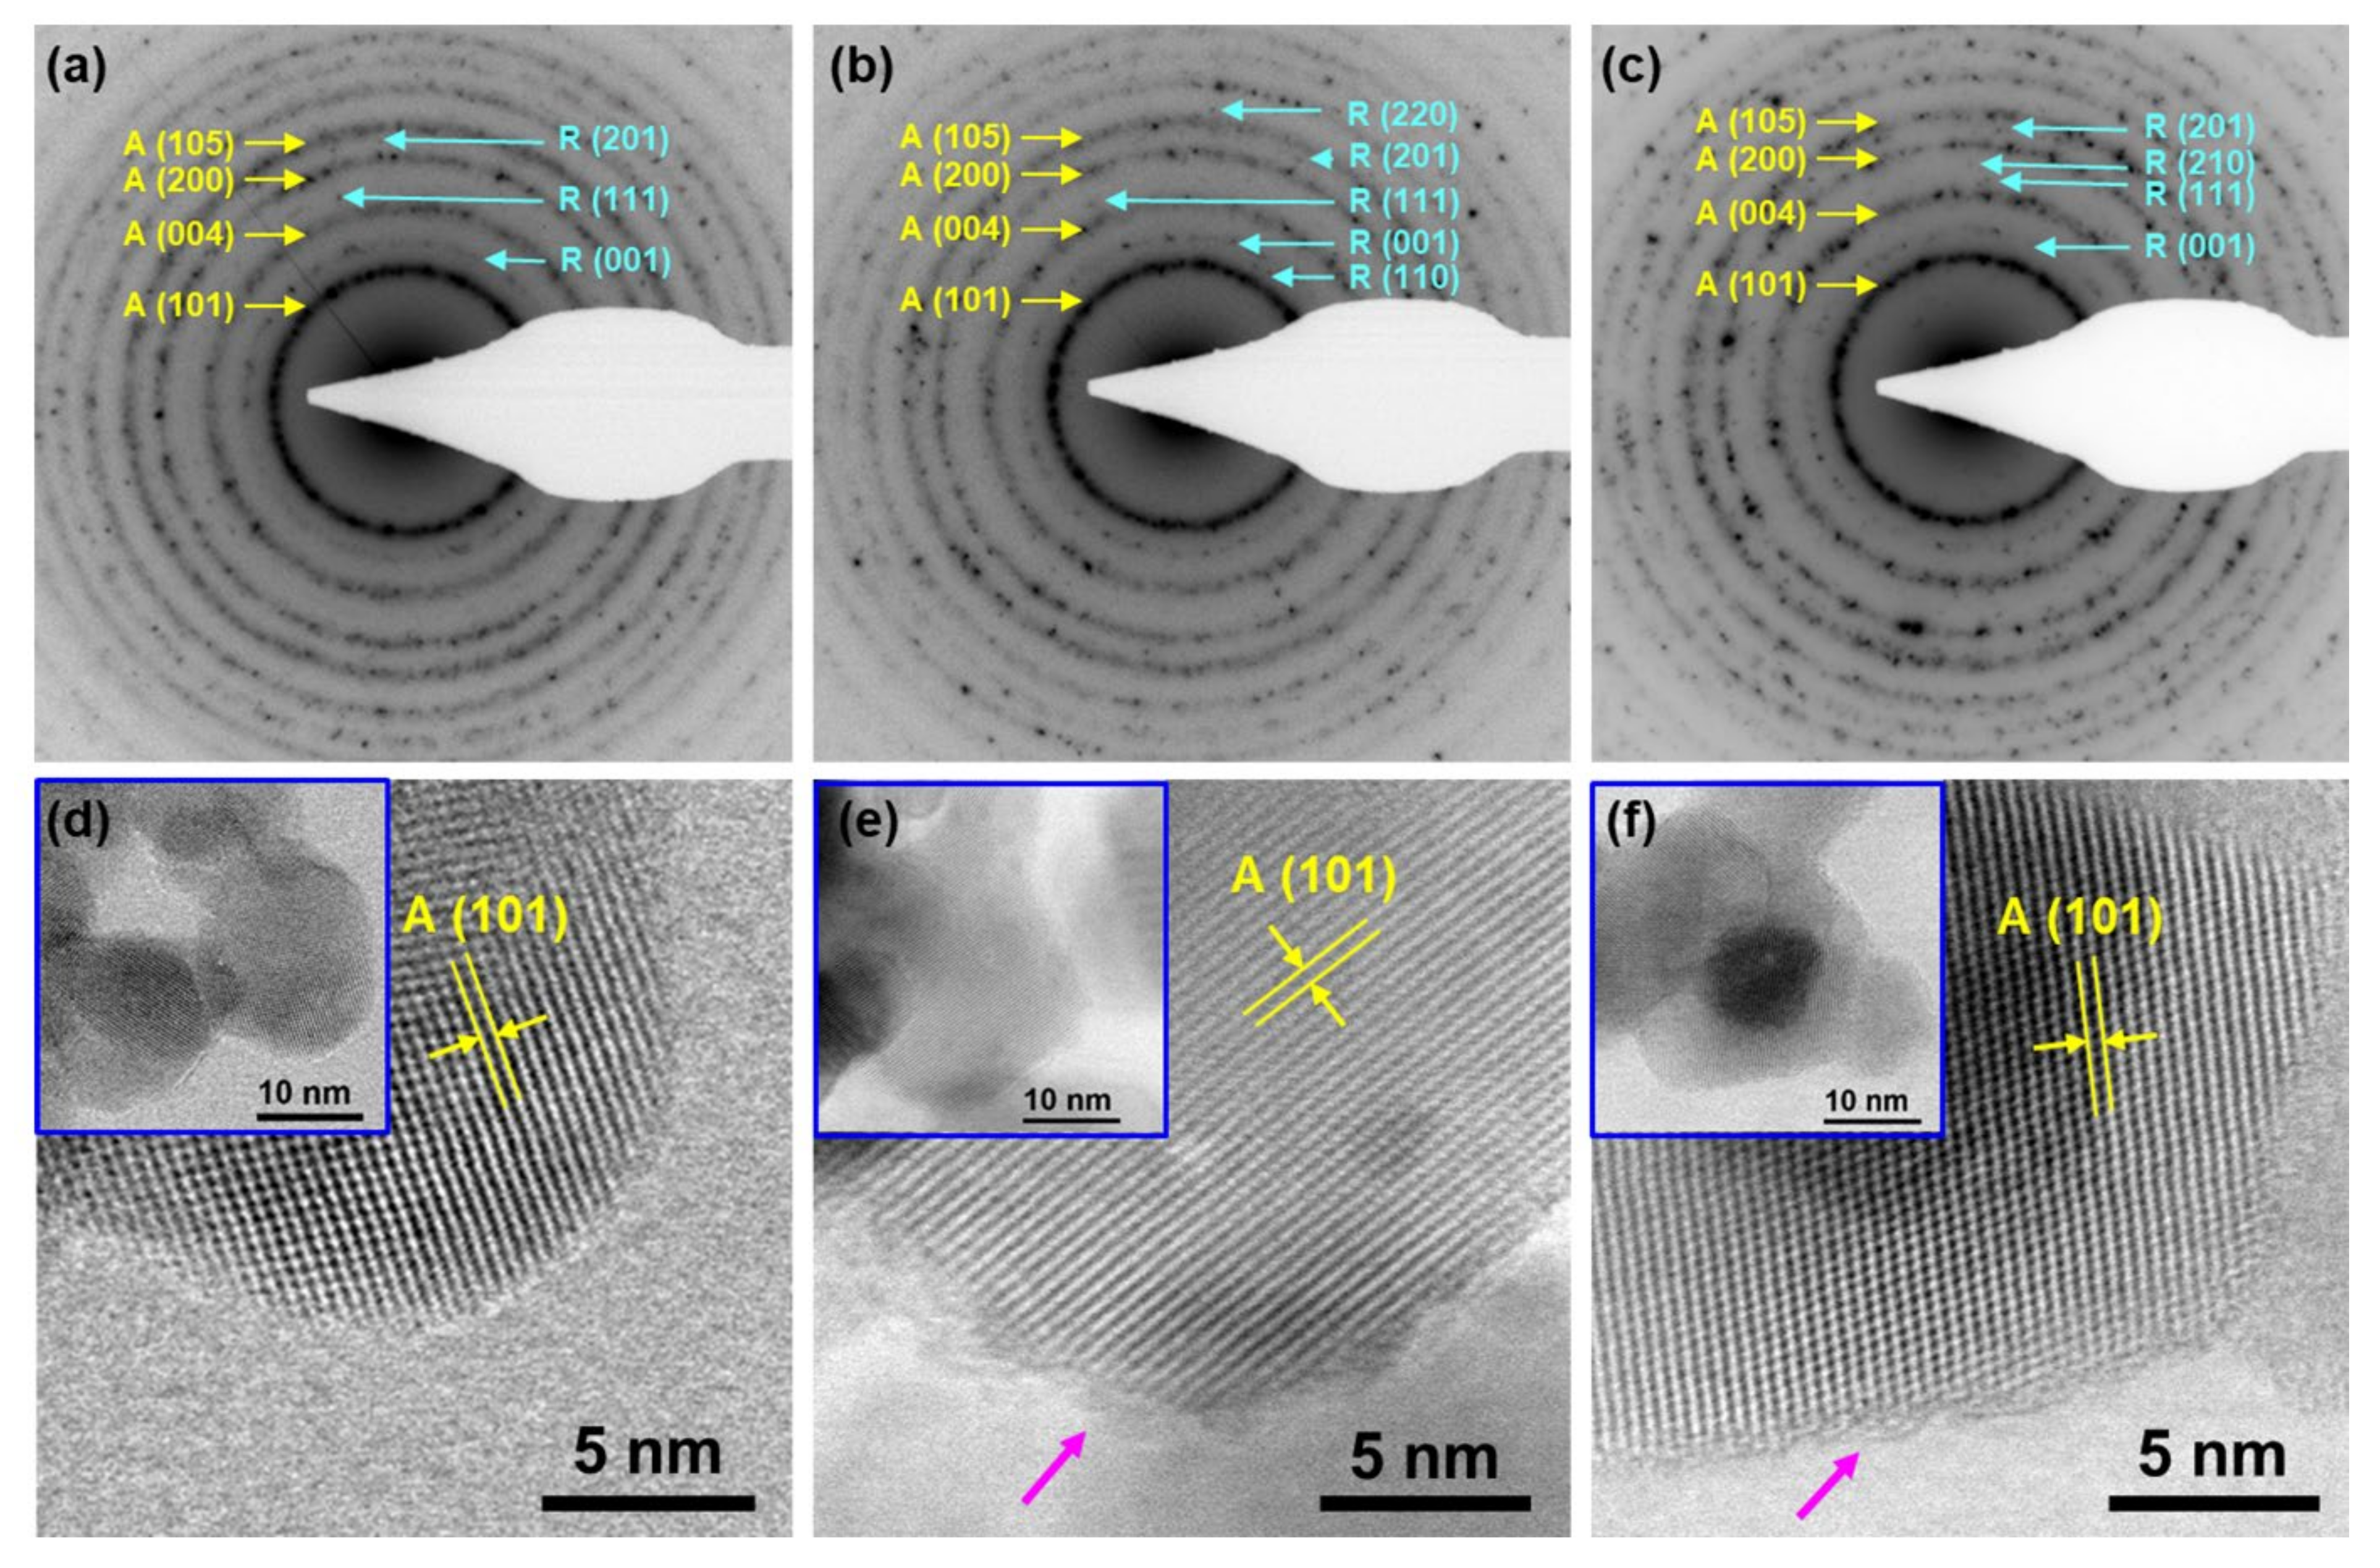
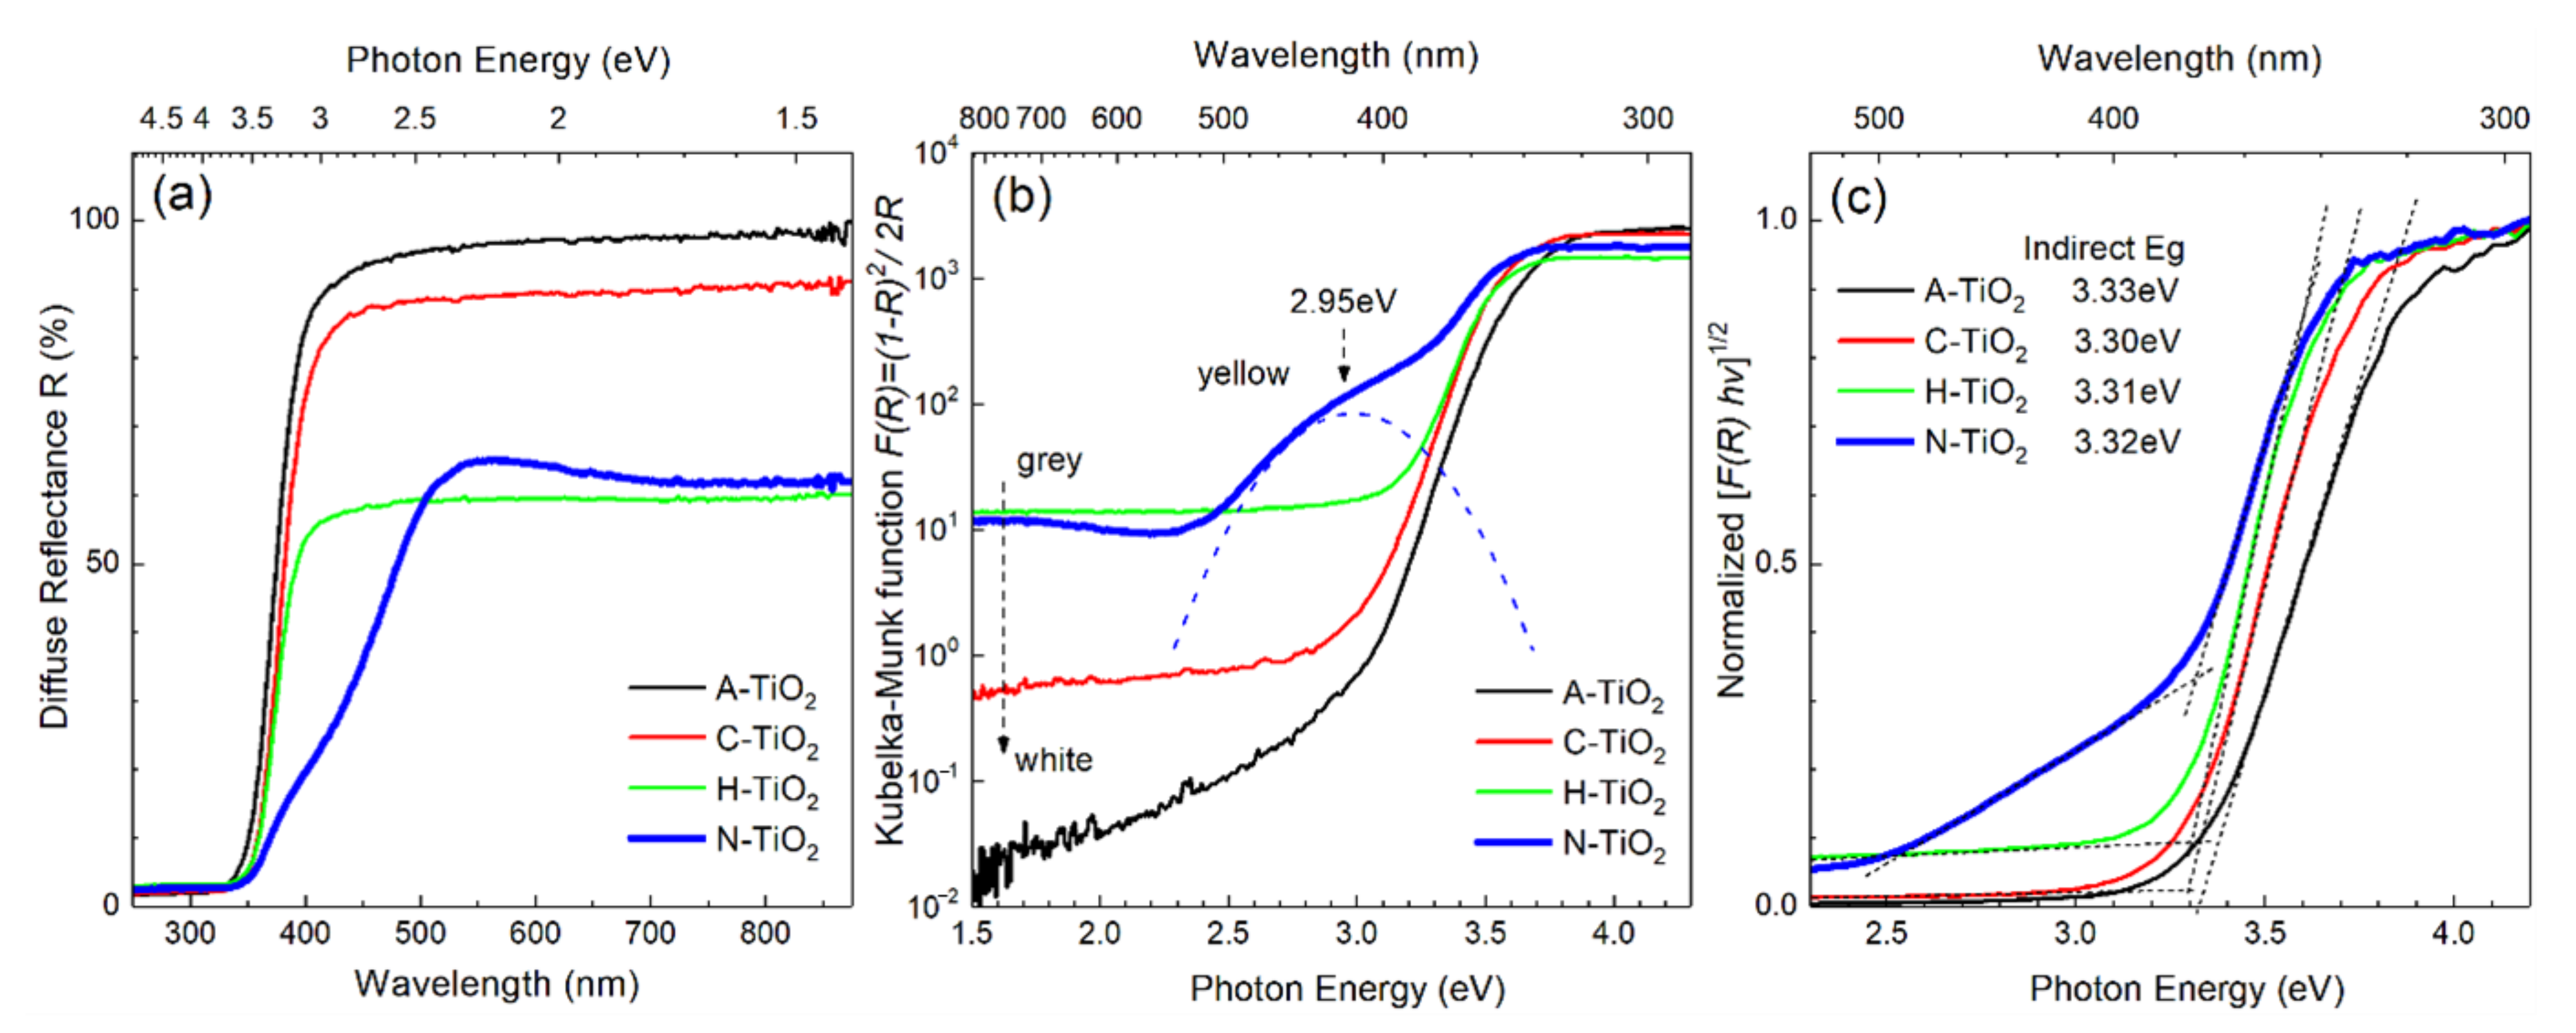
2.1. Characterizations

The morphology of the as-prepared TiO2 samples was observed under ultra-high resolution cold-field emission SEM, as shown in Figure 1b–e. Photographs of the obtained powders are also presented in Figure 1a.
All the nanoparticles in the A-TiO2 sample appear to aggregate and do not show regular morphology (Figure 1b). However, the post thermal treatments have a significant effect on the visual appearance and size of the obtained TiO2 nanoparticles. The white color of the amorphous TiO2 powder (A-TiO2) did not change after heat treatment at 550 °C in air (C-TiO2), but it turned yellow after nitridation (N-TiO2) and grey after hydrogen reduction (H-TiO2), as seen in Figure 1a. In general, bandgap engineering in order to alter the absorption properties of a semiconductor produces colored powders and especially the lattice N incorporation results in yellow-colored TiO2. In the case of intrinsic doping of TiO2, i.e., induction of intrinsic defects, the appearance of a grey color can be ascribed to Ti3+ and oxygen vacancies ( v O ) species that increase in concentration after treatment in reducing atmospheres. Furthermore, as evident from the comparison of nanocrystals in Figure 1b–e, the average particle size progressively increases in accord with the received amount of thermal energy (annealing T × treatment time).
To determine the crystal structure and possible phase changes after the hydrogenation and nitridation treatments, the X-ray diffraction (XRD) patterns of the TiO2 samples annealed in the presence of different gases were collected and are presented in Figure 2. All the TiO2 nanocrystals display almost the same XRD patterns, which can be indexed mainly to the pure anatase phase. More specifically, the peaks at 2θ = 25.2°, 37.7°, 48.0°, 53.8°, 55.2°, and 62.7° are indexed to the (101), (004), (200), (105), (211), and (118) crystal planes of anatase (JCPDS Card No.21-1272), respectively. The intense XRD diffraction peaks for the H- and N-TiO2 at 2θ = 25.4° samples indicate their improved crystallinity, in accordance with the SEM observations above. The crystallite size of all the samples was calculated using the Scherrer equation based on the XRD spectra. The results show that the crystallite sizes are increasing following the trend: A-TiO2 (5.4 nm) < C-TiO2 (13.1 nm) < H-TiO2 (21.6 nm) < N-TiO2 (29.6 nm). The calculated values indicate that calcination under H2 and NH3 atmosphere promoted the growth of the TiO2 naono- grains. Consequently, we can assume that the surface area of each powder sample decreases with the same trend. Compared to the C-TiO2, the (101) diffraction peak (Figure 2 inset) of the rest three samples shows a slight shift towards a lower angle, which can be ascribed to lattice expansion [32]. It is reasonable to assume that this expansion is the result of the lattice disorder and the interstitial/substitutional N incorporation in the case of the H- and N-TiO2 samples. Moreover, the XRD patterns of the H-TiO2 and N-TiO2 samples show a small amount of rutile phase. Indeed, the characteristic diffraction peaks at 27.5°, 36.1° and 41.2° are attributed to the (110), (101) and (111) facets of rutile, respectively (JCPDS Card No. 21-1276). The rutile phase in the C-TiO2 sample is not obvious from the corresponding XRD pattern, but it may be hindered by the lower degree of crystallinity and obscured by the background signal.
(Scanning) Transmission Electron Microscopy ((S)TEM) was employed for a more detailed phase identification and structural analysis on the nanoscale. Figure 3 shows Selected-Area Electron Diffraction (SAED) patterns (a–c) and high-resolution Annular Bright Field (ABF) STEM images (d–f) from C-TiO2, H-TiO2 and N-TiO2, respectively. The coexistence of both anatase and rutile phases is identified in all samples, with anatase being dominant. High-resolution imaging reveals the formation of nanoparticles of high crystal quality, terminated by well-defined facets. The maximum particle-size is ~15 nm for C-TiO2, while a slight enlargement up to ~25 nm is observed when TiO2 was annealed in H2 and NH3 atmospheres, corresponding very well with the sizes obtained by the XRD refinement. Additional ABF-STEM images indicative of the difference in the grain sizes can be seen in Figure S1 as well. Precise measurements of the d-spacings were performed on high-resolution images, as well as on the corresponding Fast Fourier Transform (FFT) diffractograms. A lattice expansion in the H-TiO2 and N-TiO2 nanoparticles is detected with respect to C-TiO2. In particular, the average d-spacing of the anatase (101) lattice planes in C-TiO2 is 0.347 ± 0.001 nm, while the values increase in the case of H-TiO2 and N-TiO2 to 0.355 ± 0.001 nm and 0.357 ± 0.001 nm, respectively. This lattice expansion justifies the left-shift of the XRD peaks presented in Figure 2. Furthermore, as shown at Figure 3d, the C-TiO2 nanoparticles were terminated by highly crystalline sharp facets, while arrows at Figure 3e,f indicate the formation of a distorted surface layer of ~1 nm thickness in the case of H-TiO2 and N-TiO2. This phenomenon is well known and discussed for black TiO2 and was also reported by Wang et al., where surface distortion in TiO2 nanoparticles was also observed after hydrogen and nitrogen plasma treatments [17,33].
The absorption properties of the TiO2 powders derived from the diffuse reflectance measurements at room temperature are summarized in Figure 4. The bandgap energy and the dominant type of optical transitions can be determined from the onset and linearity of the absorption edge by applying standard Kubelka–Munk [34] and Tauc [35] treatment to the DRS spectra in Figure 4a. The absorption spectra, represented by K-M function in Figure 4b, explain the coloration of TiO2 powders apparent in Figure 1a. The dissimilar yet spectrally uniform absorption throughout the visible range leads to a white/grey appearance of the A-TiO2, C-TiO2 and H-TiO2, whereas the yellow color of N-TiO2 is a result of higher absorption in the blue-green region (400–500 nm). Note that unlike other samples, N-TiO2 exhibits a prominent absorption band in the visible spectral region centered at 2.95 eV as indicated by the dashed curve in Figure 4b obtained after deconvolution of the fundamental edge. The investigated TiO2 powders demonstrate a relatively minor variation of optical bandgaps as evidenced by the absorption edge positions indicated on the Tauc plot in Figure 4c. It is worth noting at this point that the direct application of the Tauc method for bandgap estimation is only appropriate for spectra with fundamental edge undistorted by manifestation of defects/dopants, localized states and phonon interaction collectively referred to as Urbach tail. In practice, most accurate estimates can be obtained through deconvolution of absorption spectra into major constituents, or by employing the so-called baseline method [36], which was used in the present work. The estimated bandgap values of the C-TiO2 and H-TiO2 powders appear similar and close to 3.3 eV, whereas A-TiO2 and N-TiO2 demonstrate slightly blue-shifted fundamental edges at ~3.33 eV. These values are consistent with the reported bandgaps of amorphous [37,38] and anatase TiO2 [2], also suggesting that crystallization of anatase leads to a slight reduction of the bandgap in agreement with earlier studies [39].
In general, there are several factors that can affect the apparent absorption edge (optical bandgap) of the investigated TiO2 powders, such as the level of crystallinity (lattice disorder/imperfections), strain-induced bandgap modulation (built-in strain in nanoparticles) and doping-induced bandgap modulation (bandgap-narrowing and Burstein-Moss effects). The bandgap states introduced by defects and dopants are a common cause of absorption extending into the visible range. Indeed, the red-shift of TiO2 absorption edge is generally attributed to the localized gap states induced by Ti3+ and N species (interstitial and/or substitutional N ions, whose orbitals hybridize with orbitals from lattice oxygen) [40,41] as well as to oxygen vacancies [42]. These paramagnetic species have been evidenced in the case of H-TiO2 and N-TiO2 by our EPR measurement as shown and discussed later. In the case of N-TiO2, the absorption band seen in the visible spectral region at 2.95 eV is unambiguously associated with oxygen vacancies (F-type color centers) according to [43].
The optical emission properties of the TiO2 powders measured in vacuum at 300 K and 10 K are summarized in Figure 5. The high surface-to-volume ratio of the nanometer size particles that form TiO2 powders leads to an enhanced role of surface-related effects as compared to bulk material or a film. The luminescence from surface-related sources of both intrinsic and extrinsic nature, such as sub-surface defects (e.g., v O ) and adsorbed species on the surface (e.g., -OH), apparently dominate in the room-temperature spectra (PL300K) shown in Figure 5a, where several characteristic optical signatures are indicated by arrows. For reference, their spectral positions are extrapolated as vertical dash-line markers and shared with low-temperature spectra (PL10K) presented in Figure 5b. At low temperatures, the non-radiative recombination pathways are suppressed, and surface-related features become overwhelmed by the increased emission originating from self-trapped exciton (STE) recombination [44,45,46,47] and luminescent defects in the bulk of nanoparticles, which collectively represent intrinsic properties of the anatase TiO2. There is a consensus in the literature that the emission in the visible optical spectral range of anatase TiO2 can be due to two distinct radiative recombination processes involving STEs and localized states within the bandgap related to surface defects [48]. Indeed, the broad PL band comprises of several emission components, as indicated by Gaussian deconvolution curves with shaded areas in Figure 5b. In addition to the dominant STE emission centered at around 2.37 eV, the other major contributions at 2.55 eV and 2.13 eV could be associated with N species (interstitial and substitutional) incorporated in the TiO2 lattice; such an assumption was inferred from the calculations by Asahi and Morikawa in [49]. On the other hand, note that the deconvoluted components in Figure 5b are common to all TiO2 samples, and thus their respective origins cannot be associated with specific outcomes of different growth/doping/post-processing of the powders. Instead, according to the literature reports, the emission peak at 3.16 eV can be attributed to phonon-assisted indirect band transitions, and the peak at 2.97 eV can be linked to STE localized on TiO6 octahedra [50]. A series of peaks originate from v O –the peaks at 2.78 and 2.55 eV are associated with Ti3+ ions (Ec-0.5 eV), the peaks at 2.37 eV and 1.9 eV are linked to color centers F (oxygen vacancies occupied by two electrons, v O , Ec-0.8 eV) and F+ (oxygen vacancy occupied by a single electron, v O ), respectively [51,52,53]. Note that the peak at 2.37 eV could also be assigned to STEs as mentioned earlier. The emission around 2.13 eV is possibly due to transitions involving hydroxyl (OH) related deep acceptors [52].
As a final point, we note that a generally low PL efficiency is observed for all samples, which is consistent with the indirect bandgap of TiO2 also inferring that photo-generated carriers recombine mostly non-radiatively via surface defect traps and mid-bandgap states. The concentration of such non-radiative centers determines quantum efficiency; hence the total PL yield can be considered as a measure of TiO2 crystallinity. In this regard, the highest PL yields observed for the N-TiO2 and H-TiO2 powders imply the highest degree of crystal order among the investigated samples, which agrees very well with the XRD and TEM results discussed afore.
To further analyze the electronic defects in the different TiO2 samples, EPR studies were performed and the results are presented in Figure 6. Several EPR signals have been identified, which are summarized in Table 1. It can be seen that all the studied samples have EPR signals arising from the presence of oxygen vacancies with varying intensities. As expected, the H-TiO2 has the strongest EPR signal associated with oxygen vacancies, which is attributed to electrons localized at the vacancies induced by high temperature reduction in H2 gas atmosphere. This is in accordance with previous studies on black TiO2 nanotubes prepared in our labs [54]. Moreover, the presence of oxygen vacancies in C-TiO2, with a much lower intensity though, is also reasonable and explains the n-type conductivity of TiO2. In the case of N-TiO2 several additional paramagnetic species have been detected, such Ti3+, O2•−, and Nb. The latter, as argued by Livraghi et al., denotes the incorporation of N in the bulk of the TiO2 crystal and it can be either placed interstitially or substitutionally [55]. The same authors have also identified the presence of superoxide radicals upon illumination of their N-doped TiO2 samples [55], but these species have been previously detected in reduced TiO2 surfaces [56,57]. Another interesting finding is the presence of Ti3+ only in the case of N-TiO2, as indicated by the strong EPR signal at g = 1.9846. Such a signal arises when excess of electrons is introduced into the crystal and it is suggested that these additional electrons representing Ti3+ are delocalized over several Ti4+ lattice ions [58].

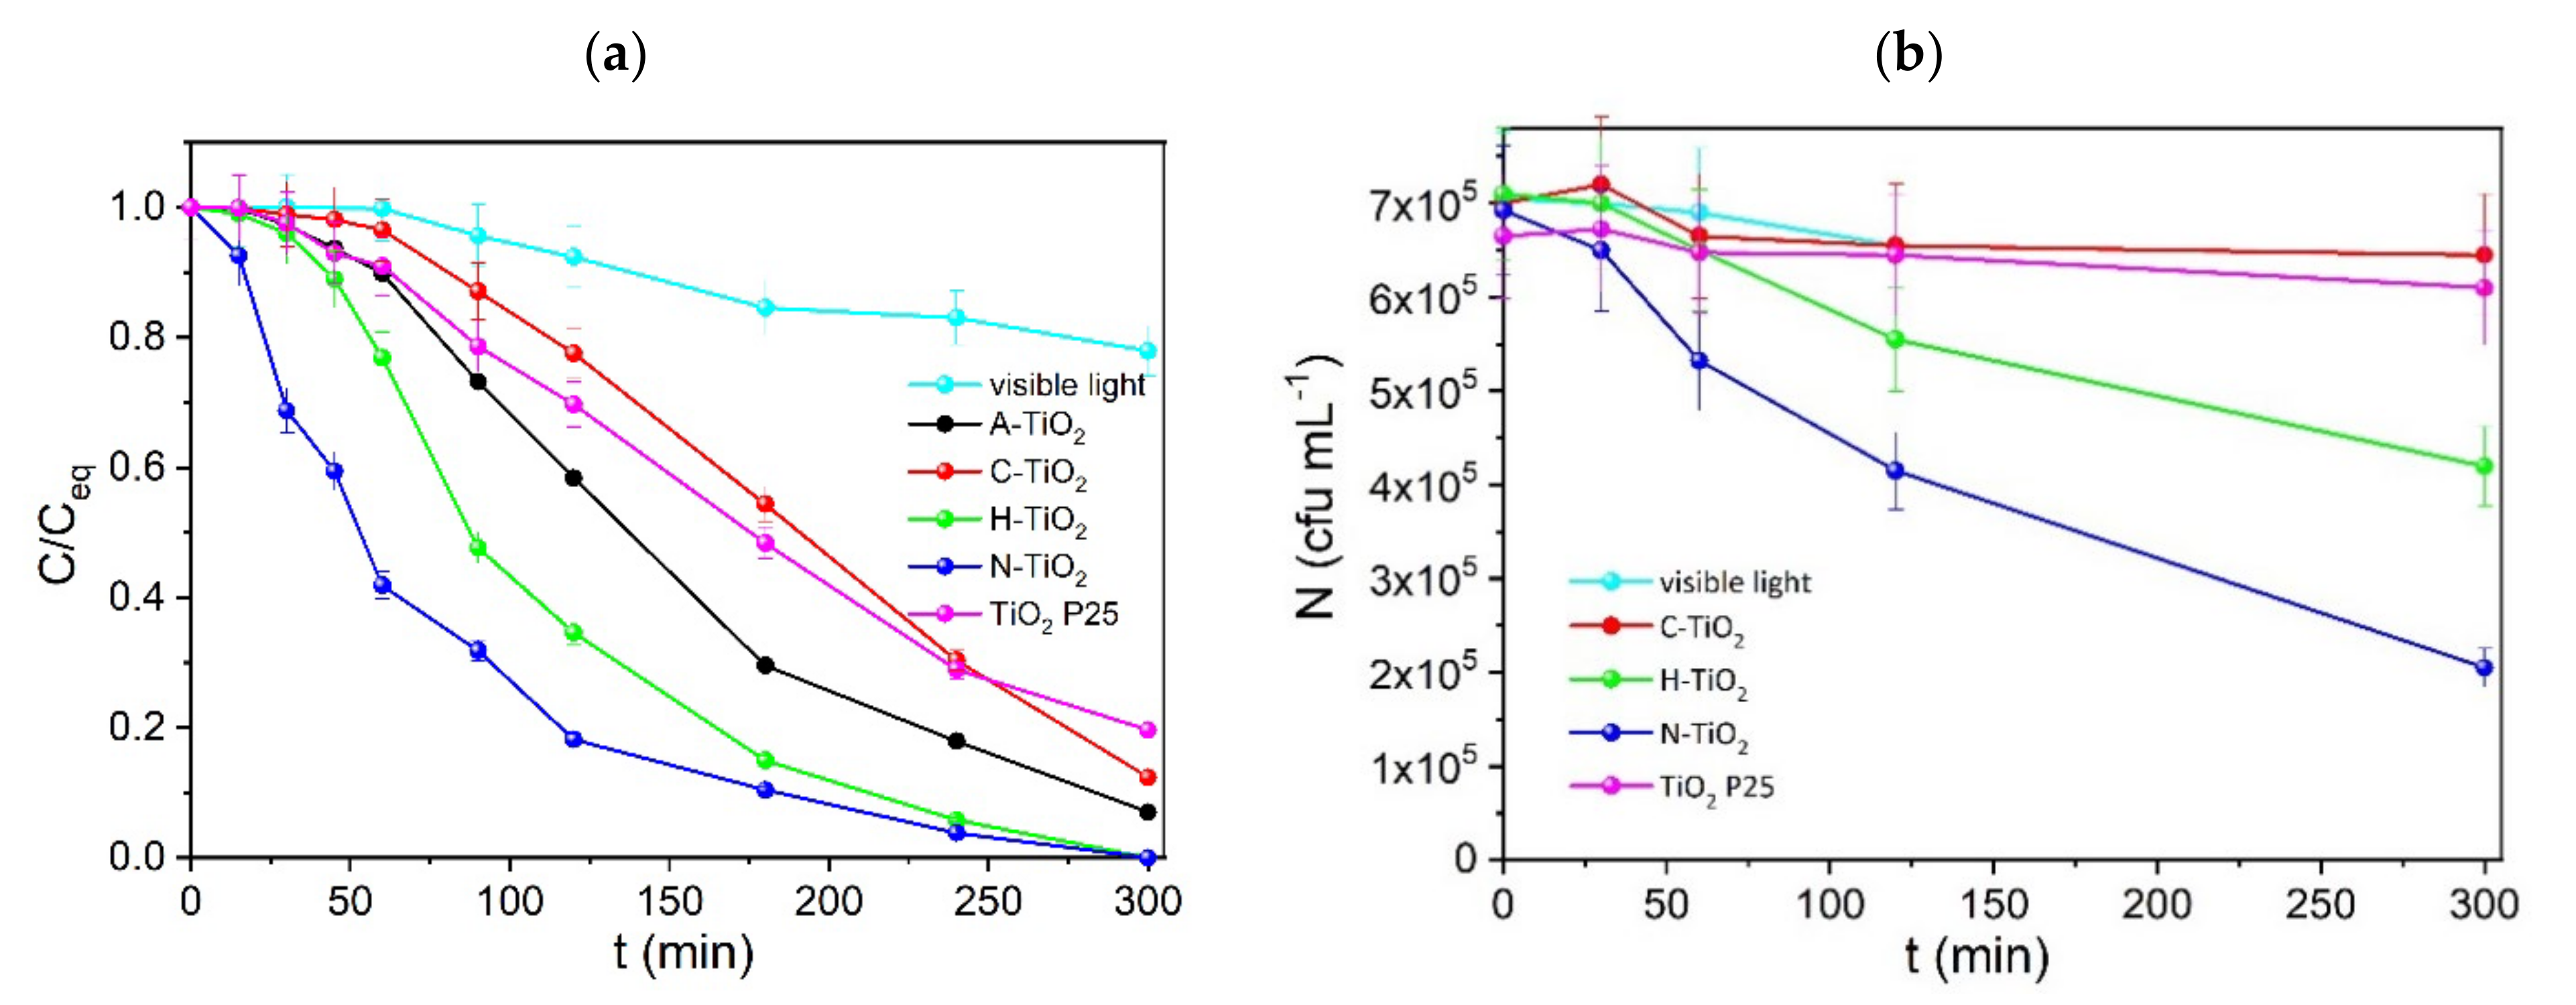
2.2. Evaluation of Photocatalytic Efficiencies

An evaluation of the photocatalytic efficacy and efficiency of the as prepared nanopowders was conducted in bench scale employing MG as a target molecule, at an initial concentration of 5 mg L−1 in the presence of 0.5 g L−1 of photocatalyst and visible light illumination. The performance of the prepared photocatalysts was compared against the state-of-the-art and commercially available TiO2 P25 [59]. The concentration of the organic molecule present in the aqueous suspension (C), divided with the equilibrium concentration (Ceq), after 15 min of dark adsorption, is plotted as a function of the illumination time in Figure 7a. Degradation kinetics are described by a pseudo first-order equation based on the Langmuir–Hinshelwood model, according to which the initial degradation rates, r0, were calculated and are given in Table 2. The prevalence of the N-TiO2 followed by H-TiO2 is revealed by the degradation curves of Figure 7. The initial degradation rate of N-TiO2 is approximately three times higher than that of P25 or A-TiO2. H-TiO2 has a two times higher degradation rate in comparison to P25, while both have led to the complete decolorization of the MG solution within 300 min of illumination. On the other hand, visible light itself led to a mere 23% degradation of MG after 300 min.
The photocatalytic inactivation of G. stearothermophilus was conducted in aqueous endospore suspensions in the presence of 0.5 g L−1 nanopowders and visible light illumination. The number of G. stearothermophilus endospores present in the suspension, N (cfu mL−1) is plotted as a function of the illumination time (Figure 7b). As it can be seen, C-TiO2 and P-25 were unable to inactivate G. stearothermophilus even after 5 h of visible light illumination. On the other hand, and similarly to the decolorization of MG, Figure 7b demonstrates the efficacy of the N-TiO2 sample also in the oxidative attack on the endospore suspension. N-TiO2 followed by H-TiO2 led in both cases in enhanced photocatalytic efficiencies and after 300 min of illumination approximately 70 and 40% of the initial endospore content was inactivated. On the other hand, spore viability was not affected when experiments were performed in the dark (data are not shown), in the presence of all tested photocatalysts, demonstrating that spore death was induced by the photogenerated ROS.

3. Discussion

It is well known that the charge-carrier mobility and the band edge positions are key-factors which determine the photocatalytic reactivity of TiO2. To achieve the solar degradation of organic pollutants, the photo-generated holes must be able to oxidize OH to reactive •HO groups, while the reduction ability of conduction band (CB) electrons should be able to generate superoxide anion radicals (O2•−) and superoxide acid. For pure anatase, the bandgap is 3.2 eV while the conduction band minimum (CBM) and valence band maximum (VBM) are about −0.37 V and +2.83 V, respectively. The oxidation ability of the generated holes in the VB is so high that may induce a significant potential difference between the VB holes and most organic materials, which in turn undermines the transfer of holes to the target organic material. The superiority of the as prepared N-doped TiO2 in the disinfection and decolorization of water is primarily attributed to its improved visible light absorption as identified by our DRS measurements. These are closely related to the different defects found by our well-aligned EPR and PL data. In addition, high-resolution ABF-STEM images on N-TiO2 further showcase the formation of point defects, which are observed as nano-scale crystal lattice distortion (Figure S3). The presence of the Nb species is known to introduce energy levels above the valence band of TiO2 due to the hybridization of the O 2p with the N 2p orbitals [11,60]. Such hybridization leads to the uplifting of the density of states (DOS) in the VB region that eventually improves the mobility of charge carriers. Furthermore, the potential difference between holes and pollutants is also diminished due to the overlap between O 2p and N 2p states. Apart from the sub bandgap charge excitation in the N-doped material (i.e., visible light activation), an increased number of holes is expected that can contribute to its improved oxidizing power. It should be mentioned that X-ray Photoelectron Spectroscopy (XPS) measurements were also conducted (refer to SI and Figures S4 and S5) and the N 1 s peak at 399.91 eV implies that N is placed interstitially in the TiO2 lattice [61]. Interstitial N incorporation correlates very well with the shift in the (001) peak in the XRD measurements but on the other hand, the same N 1 s peak is found for the rest of the samples, which is not uncommon even for undoped TiO2 [10]. Ar+ sputtering can probe further into the bulk of the material, but ion sputtering in TiO2 is also known to preferentially remove oxygen and reduce the material (induction of Ti3+ states) [61]. For these reasons, we relied on the EPR and PL data for our conclusions.
In accordance with the increased holes concentration, the presence of Ti3+ introduces localized states below the CBM, which may finally render the formation of the conduction band tail. An excess of electrons and improved electron conductivity are achieved in the CB region, which can facilitate reducing reactions, e.g., of oxygen gas to superoxide radicals [60]. Such reactive oxygen species (ROS) can further contribute to the oxidation of organic pollutants and herein we provide clear evidence of such boosting phenomena. This finding also suggests that both v O and Ti3+ species are necessary for the improvement of the photocatalytic efficiency under visible light. This is the reason that H-TiO2 is inferior compared to N-TiO2. Our PL data at 10 K showed the improved crystallinity of the N-TiO2, and the decreased amount of non-radiative recombination centers, implying the improved charge separation of the N-doped sample and its higher intrinsic photocatalytic activity. Moreover, we see that H-TiO2 can completely decolorize the MG solution after 300 min, similarly as the N-TiO2, but its efficiency in the endospore inactivation is 40%, while N-TiO2 reached 70%. This observation further correlates with the notion that both defect species are necessary for improved visible light photocatalysis.
Finally, it should not be neglected that reduced oxides, operating under oxidizing conditions may not be stable and oxidize themselves. Recycling experiments involving the H-TiO2 and N-TiO2 samples have been performed for the decolorization of MG solutions. The results are given in Figure S6 and show the excellent stability of both samples after three consecutive photocatalytic cycles of 300 min each. The N-TiO2 sample showed no efficiency degradation, while the H-TiO2 sample retained 95% of each activity after 900 min of photocatalytic MG decolorization. The structural integrity of the recycled photocatalysts was also confirmed by XRD, where no changes were observed (Figure S7).

4. Materials and Methods

4.1. Materials

Malachite green carbinol hydrochloride (bis[4-(dimethylamino)phenyl]-phenylmethanol hydrochloride, C23H26N2O•HCl, CAS No: 123333-61-9, Mr: 382.93) was purchased from Sigma-Aldrich and was used as received.
TiO2 P25 (Evonik GmbH, anatase/rutile = 3.6/1, BET: 50 m2 g−1, nonporous) was used for comparative purposes against the synthesized nanopowders. All other reagent-grade chemicals were purchased from Merck and were used without further purification. Doubly distilled water was used throughout the study.
B. stearothermophilus endospores were initially purchased impregnated on paper strips (ATCC 7953, Fluka, 106 cfu/strip). These endospores are highly resistant thermophiles and can grow at temperatures ≥ 60 °C. This particular strain is used as an indicator of proper autoclave performance and is specified by U.S. military specification MIL-S-36586 as GMP requirements of the U.S. Food and Drug Administration.

4.2. Synthesis of TiO2 Nanopowders

TiO2 was prepared according to the sol-gel method. The desired amounts of titanium isopropoxide (TTIP, ≥97%, Merck, KGaA, Darmstadt, Germany, 87560) and absolute ethanol (Fisher chemicals, E/0650DF/17, Fisher Scientific UK Ltd., Leicestershire, UK) were mixed in a beaker and placed in an ultrasonic bath for 15 min taking the necessary precautions to prevent addition of moisture in the TTIP/ethanol mixture. Then, an aqueous HCl 1 M solution was added dropwise (~1 mL min−1) to the above solution under vigorous magnetic stirring. The molecular ratio of TTIP/ethanol/H2O/acid was 1/25/8/0.007. The viscous content of the beaker was vigorously stirred for 16 h and then left to age for 16 h at room temperature yielding a gel, which was dried at 75 °C for 16 h. The resulting white product (A-TiO2) was ground, washed 5 times with doubly distilled H2O and dried at 75 °C for 16 h. This was followed by calcination at 550 °C with a heating rate of 2 °C min−1 for 60 min, cooling to room temperature, grinding, and storage at room temperature. This sample is denoted as C-TiO2.
N-doped TiO2 (N-TiO2) was obtained by high temperature annealing in NH3 gas atmosphere of the C-TiO2 sample. Briefly, the as-prepared TiO2 powder was put in a ProboStat™ cell (NORECS, Oslo, Norway) under NH3 gas flow at atmospheric pressure and calcined at 550 °C for 4 h with a heating rate of 5 °C min−1. Finally, hydrogenated TiO2 (H-TiO2) was obtained by annealing the A-TiO2 sample under H2 gas atmosphere at 550 °C with a heating rate of 5 °C min−1 for 2 h.

4.3. Characterizations

Micrographs were obtained with a Hitachi SU8230 ultra-high resolution cold-field emission scanning electron microscope (SEM) equipped with a secondary electron (SE) detector under an acceleration voltage of 3 kV. The TiO2 phase in all the samples was confirmed using X-ray diffraction (XRD, Bruker D8 Discover, Cu Kα1, Bragg-Brentano) with a Cu Kα-filtered radiation source (λ = 1.5046 Å), step 0.01° (2θ) and a scan rate of 1° min−1.
(S)TEM investigations were conducted on an FEI Titan G2 60–300 kV equipped with a CEOS DCOR probe-corrector, monochromator and Super-X EDX detectors. Observations were performed at 300 kV with a probe convergence angle of 24 mrad. The camera length was set to 77 mm and simultaneous STEM imaging was conducted with 3 detectors: HAADF (collection angles 98.7–200 mrad), ADF (collection angles 21.5–98.7 mrad), and ABF (collection angles 10.6–21.5 mrad). The resulting spatial resolution achieved was approximately 0.08 nm. For the (S)TEM study, the TiO2 powders were dispersed in ethanol with ultrasonic support and drop-casted onto Cu-grids supported by holey-C films.
The optical absorption properties were investigated at room temperature by means of diffuse reflectance spectroscopy (DRS) using a ThermoScientific EVO-600 UV−Vis spectrophotometer. The emission properties were attained by measuring photoluminescence (PL) of the powder samples in vacuum at 10 K and 300 K using a 325 nm wavelength He-Cd cw-laser as an excitation source (power density < 10 W cm−2). The emission was collected by a microscope and analyzed by an imaging spectrometer system (Horiba Jobin Yvon, iHR320 coupled to Andor iXon888 Ultra EMCCD) with a spectral resolution below 0.2 nm. Low-temperature measurements were realized using a closed-cycle He refrigerator (Janis, Inc. CCS450).
Electron paramagnetic resonance (EPR) spectra were recorded at room temperature using a BRUKER EleXsyS 560 spectrometer operating at X-band frequencies and an ER 4122 SHQE cavity. The sample was placed in a 4 mm OD Wilmad quartz tube located in the cavity center by a Teflon rod. Spectra were obtained at 5 mW microwave power (16 dB attenuation), receiver gain 76 dB and 0.4 mT modulation width at 100 kHz modulation frequency. The central magnetic field was fixed at 338 mT and the sweep width at 20 mT at 1 k points resolution. The field sweep time and the time constant were 84 s and 165 ms, respectively. Among the samples, the microwave frequency varied between 9753.3 and 9755.0 MHz. 10 spectra were added for each sample.

4.4. Preparation of G. stearothermophilus Endospore Suspension

The G. stearothermophilus endospore suspension was prepared as previously described [31]. After staining with the Schaeffer–Fulton method [62] and enumeration employing a reverse phase microscope, it was found that the suspension consisted of at least 98% endospores. To determine the initial concentration of the prepared endospore suspension, serial dilutions were performed in triplicates and the samples were plated and incubated on plates containing tryptic soy broth (TSB) as described in Section 4.5. It was found that the initial concentration of the purified endospore suspension was approximately 4 × 10⁷ cfu mL−1.

4.5. Enumeration of G. stearothermophilus Endospores

To evaluate the efficiency of photocatalytic inactivation of G. stearothermophilus, samples were collected in duplicates and spread on 9 cm agar plates containing TSB (casein peptone 17 g L−1, soya peptone 3 g L−1, K2HPO4 2.5 g L−1, NaCl 5 g L−1, glucose 2.5 g L−1, bacteriological agar 15 g L−1) under sterile conditions. The samples collected during the photocatalytic experiments were incubated for 5 min at 100 °C to induce sporulation of endospores to vegetative cells (thermal activation). 20 μL of each activated sample were added to 3 mL of melted TSB containing 0.7% (w/v) agarose (pure plate method) and were spread under sterile conditions onto the plates. The plates were then incubated for 24 h at 60 °C and BSE colonies were enumerated by direct counting.

4.6. Photocatalytic Experiments

The photocatalytic oxidation of MG was performed in a bench-scale photocatalytic reactor of 300 mL capacity, equipped with a central visible lamp (Osram Dulux S, 9 W/71, emission range: 400–550 nm, maximum emission: 450 nm) and inlet and outlet ports for bubbling CO2 free air, under constant magnetic stirring, at a working volume of 250 mL. Potassium ferrioxalate served as a chemical actinometer [63] to determine the incident photon flow of the irradiation source, which was 57 × 10−6 Einstein L−1 min−1. Photocatalytic experiments were conducted at initial pH of 5.0 ± 0.1 and constant temperature (25 ± 0.1 °C). Maximum adsorption of the dye onto the photocatalyst’s surface, in the absence of light, was achieved within 30 min. The photocatalyst particles were removed from the MG solution by employing a 0.45 μm filter.
The photocatalytic inactivation of BSE endospores was performed in sterile polystyrene 6 well plates with lid (Greiner). Each well served as a cylindrical 12 mL photocatalytic reactor. The appropriate amount of the stock endospore suspension was diluted in sterile distilled H2O and was added to a single well of the plate. The catalyst was then added at the desired concentration, resulting to a 10 mL working volume. The plate was illuminated by a system of 4 parallel lamps emitting visible irradiation (length: 45 cm, Osram L 15 W/840. Lumilux cool white, emission range: 400–700 nm, maximum emission: 550 nm), connected with a voltage regulator, placed 5 cm above the surface of the endospore suspension. The intensity of the incident irradiation at this distance was measured using a Photometer/Radiometer PMA 2140 (Solar Light Co., Glenside, PA, USA) equipped with a global range detector, which measures irradiance within the range of 400–1100 nm and found to be 2 ± 0.1 mW cm−2. Photocatalytic inactivation took place at room temperature, under constant magnetic stirring. Samples of 20 μL were collected in duplicates at various time intervals in sterile Eppendorf tubes, diluted up to a final volume of 200 μL with sterile, distilled H2O, and kept in the dark. After the end of the photocatalytic process the samples were spread on TSB plates and enumerated as described in Section 4.5. All experiments were repeated three times, under identical experimental conditions.

4.7. Analytical Methods

A UV-Visible spectrophotometer (UV-1700, PharmaSpec, Shimadzu, Randburg, South Africa) was employed to follow changes in the concentration of MG, based on the linear dependence between the initial concentration of the insecticide and its absorption at 617 nm. The standard deviation of the optical density values was within ±5%.

5. Conclusions

In this work, TiO2 nanopowders were prepared via a sol-gel synthesis route followed by anatase formation after annealing at high temperature in air atmosphere (C-TiO2). In order to obtain visible light activated photocatalysts, the sol-gel prepared powders were subsequently annealed in hydrogen gas (H-TiO2) or ammonia stream (N-TiO2). An extensive physico-chemical characterization revealed the presence of several lattices as well as electronic defects. Clearly, the N-TiO2 sample showed an absorption shoulder stretching in the visible region and down to 2.5 eV, as showed by the DRS spectra. It also showed the highest degree of crystallinity and a suppressed number of non-radiative recombination centers, which are related to the identified defects via the EPR measurements ( v O , Ti3+, O2•− and Nb). These defects are known to introduce energy states inside the bandgap of the material and facilitate its activation with light in the visible region, in accordance with the DRS and PL data. On the other hand, the hydrogenation of the C-TiO2 sample led to an increased amount of oxygen vacancies, which are charge compensated by localized electrons in the form of Ti3+ species. The latter species were not seen by EPR but only a strong signal assigned to oxygen vacancies, thus leading to the conclusion that the excess electrons were not delocalized in the Ti atoms. The H-TiO2 sample was still not visible light active and retained the bandgap of the C-TiO2 of approx. 3.3 eV.
The efficiency of the synthesized photocatalytic nanopowders was assessed based on the decolorization and disinfection of water and two model systems were studied for this purpose: malachite green, a triarylmethane dye and G. stearothermophilus endospores, respectively. As expected, the N-TiO2 sample showed the best performance in both cases under visible light illumination. The MG solution was completely decolorized after 3 h of illumination, while the endospore suspension was inactivated by 70% after 5 h. It should be underlined that both TiO2 P25 and C-TiO2 showed no activity towards the inactivation of the endospore suspension in the presence of visible light.
This work studies and exemplifies the colorful chemistry of defective TiO2 and provides a direct comparison of the photocatalytic activity under visible light between white (C-TiO2), grey (H-TiO2) and yellow (N-TiO2) TiO2. The ability to tune and induce certain defects can have a major impact on the photocatalytic efficiency and intrinsic properties of the material. Photocatalysts activated by visible illumination are highly desirable, especially for practical applications regarding water purification and disinfection.

Supplementary Materials

The following are available online at https://www.mdpi.com/2073-4344/11/2/228/s1, Figure S1: Additional ABF-STEM images, Figure S2: A higher magnification of the EPR spectra of paramagnetic species in C-TiO2, H-TiO2 and N-TiO2, Figure S3: Additional high resolution and filtered ABF-STEM images, Figure S4: Survey XPS spectra of A-TiO2 (black), C-TiO2 (blue), H-TiO2 (green) and N-TiO2 (red). Atomic percentages are given on the graph, Figure S5: XPS spectra of N 1 s of A-TiO2 (black), C-TiO2 (blue), H-TiO2 (green) and N-TiO2 (red), Figure S6: Recycling experiments and Figure S7: Post-operation XRD results.

Author Contributions

X.K.: Investigation (synthesis and characterization of the reduced TiO2 samples), methodology, visualization, funding acquisition, writing original draft, review and editing. C.B. (Chrysanthi Berberidou): Conceptualization, investigation (synthesis of the original TiO2 powders), methodology (photocatalytic experiments), writing original draft, review and editing. A.G.: Investigation, methodology, visualization, funding acquisition, writing original draft, review and editing. C.B. (Calliope Bazioti): Investigation, methodology, visualization, writing review and editing. E.S.: Investigation, methodology, writing review and editing. T.N.: Supervision, resources, writing review and editing. I.P.: Supervision, resources writing review and editing. A.C.: Conceptualization, investigation, methodology, funding acquisition, supervision, visualization, writing original draft, review and editing. All authors have read and agreed to the published version of the manuscript.

Funding

X.K. acknowledges the China Scholarship Council (File number 20180606014). A.G. acknowledges the FUNDAMeNT project (project number 251131) and A.C. acknowledges the PH2ON project (project number 288320), both sponsored by the Research Council of Norway (Norges Forskningsråd). The Research Council of Norway is also acknowledged for its support of the Norwegian Center for Transmission Electron Microscopy (NORTEM) (197405/F50).

Data Availability Statement

Data available in a publicly accessible repository.

Acknowledgments

The authors acknowledge Ingvild Julie Thue Jensen (SINTEF Industry) and Ylva Knausgård Hommedal for the XPS measurements.

Conflicts of Interest

The authors declare no conflict of interest.

References

  1. Agbe, H.; Nyankson, E.; Raza, N.; Dodoo-Arhin, D.; Chauhan, A.; Osei, G.; Kumar, V.; Kim, K.H. Recent advances in photoinduced catalysis for water splitting and environmental applications. J. Ind. Eng. Chem. 2019, 72, 31–49. [Google Scholar] [CrossRef]
  2. Chen, X.; Mao, S.S. Titanium dioxide nanomaterials: Synthesis, properties, modifications, and applications. Chem. Rev. 2007, 107, 2891–2959. [Google Scholar] [CrossRef] [PubMed]
  3. 6-Nanostructured semiconductor composites for solar cells. In Nanostructured Semiconductor Oxides for the Next Generation of Electronics and Functional Devices; Zhuiykov, S. (Ed.) Woodhead Publishing: Sawston, UK, 2014; pp. 267–320. [Google Scholar] [CrossRef]
  4. Noman, M.T.; Ashraf, M.A.; Ali, A. Synthesis and applications of nano-TiO2: A review. Environ. Sci. Pollut. R 2019, 26, 3262–3291. [Google Scholar] [CrossRef]
  5. Xu, H.; Ouyang, S.X.; Liu, L.Q.; Reunchan, P.; Umezawa, N.; Ye, J.H. Recent advances in TiO2-based photocatalysis. J. Mater. Chem. A 2014, 2, 12642–12661. [Google Scholar] [CrossRef]
  6. Nakata, K.; Fujishima, A. TiO2 photocatalysis: Design and applications. J. Photoch. Photobio. C 2012, 13, 169–189. [Google Scholar] [CrossRef]
  7. Asahi, R.; Morikawa, T.; Ohwaki, T.; Aoki, K.; Taga, Y. Visible-Light Photocatalysis in Nitrogen-Doped Titanium Oxides. Science 2001, 293, 269–271. [Google Scholar] [CrossRef]
  8. Kumara, N.T.R.N.; Lim, A.; Lim, C.M.; Petra, M.I.; Ekanayake, P. Recent progress and utilization of natural pigments in dye sensitized solar cells: A review. Renew. Sustain. Energy Rev. 2017, 78, 301–317. [Google Scholar] [CrossRef]
  9. Di Paola, A.; Garcıa-López, E.; Ikeda, S.; Marcì, G.; Ohtani, B.; Palmisano, L. Photocatalytic degradation of organic compounds in aqueous systems by transition metal doped polycrystalline TiO2. Catal. Today 2002, 75, 87–93. [Google Scholar] [CrossRef]
  10. Asahi, R.; Morikawa, T.; Irie, H.; Ohwaki, T. Nitrogen-Doped Titanium Dioxide as Visible-Light-Sensitive Photocatalyst: Designs, Developments, and Prospects. Chem. Rev. 2014, 114, 9824–9852. [Google Scholar] [CrossRef] [PubMed]
  11. Di Valentin, C.; Pacchioni, G.; Selloni, A.; Livraghi, S.; Giamello, E. Characterization of Paramagnetic Species in N-Doped TiO2 Powders by EPR Spectroscopy and DFT Calculations. J. Phys. Chem. B 2005, 109, 11414–11419. [Google Scholar] [CrossRef]
  12. Di Valentin, C.; Finazzi, E.; Pacchioni, G.; Selloni, A.; Livraghi, S.; Paganini, M.C.; Giamello, E. N-doped TiO2: Theory and experiment. Chem. Phys. 2007, 339, 44–56. [Google Scholar] [CrossRef]
  13. Spadavecchia, F.; Cappelletti, G.; Ardizzone, S.; Bianchi, C.L.; Cappelli, S.; Oliva, C.; Scardi, P.; Leoni, M.; Fermo, P. Solar photoactivity of nano-N-TiO2 from tertiary amine: Role of defects and paramagnetic species. Appl. Catal. B Environ. 2010, 96, 314–322. [Google Scholar] [CrossRef]
  14. Chen, X.; Liu, L.; Yu, P.Y.; Mao, S.S. Increasing Solar Absorption for Photocatalysis with Black Hydrogenated Titanium Dioxide Nanocrystals. Science 2011, 331, 746. [Google Scholar] [CrossRef]
  15. Lin, T.; Yang, C.; Wang, Z.; Yin, H.; Lü, X.; Huang, F.; Lin, J.; Xie, X.; Jiang, M. Effective nonmetal incorporation in black titania with enhanced solar energy utilization. Energy Environ. Sci. 2014, 7, 967–972. [Google Scholar] [CrossRef]
  16. Wang, Z.; Yang, C.; Lin, T.; Yin, H.; Chen, P.; Wan, D.; Xu, F.; Huang, F.; Lin, J.; Xie, X.; et al. Visible-light photocatalytic, solar thermal and photoelectrochemical properties of aluminium-reduced black titania. Energy Environ. Sci. 2013, 6, 3007–3014. [Google Scholar] [CrossRef]
  17. Chatzitakis, A.; Sartori, S. Recent Advances in the Use of Black TiO2 for Production of Hydrogen and Other Solar Fuels. ChemPhysChem 2019, 20, 1272–1281. [Google Scholar] [CrossRef]
  18. Naldoni, A.; Allieta, M.; Santangelo, S.; Marelli, M.; Fabbri, F.; Cappelli, S.; Bianchi, C.L.; Psaro, R.; Dal Santo, V. Effect of Nature and Location of Defects on Bandgap Narrowing in Black TiO2 Nanoparticles. J. Am. Chem. Soc. 2012, 134, 7600–7603. [Google Scholar] [CrossRef]
  19. Grätzel, M. Dye-sensitized solar cells. J. Photochem. Photobiol. C Photochem. Rev. 2003, 4, 145–153. [Google Scholar] [CrossRef]
  20. Sakthivel, S.; Neppolian, B.; Shankar, M.V.; Arabindoo, B.; Palanichamy, M.; Murugesan, V. Solar photocatalytic degradation of azo dye: Comparison of photocatalytic efficiency of ZnO and TiO2. Sol. Energy Mater. Sol. Cells 2003, 77, 65–82. [Google Scholar] [CrossRef]
  21. Wróbel, D.; Boguta, A.; Ion, R.M. Mixtures of synthetic organic dyes in a photoelectrochemical cell. J. Photochem. Photobiol. A Chem. 2001, 138, 7–22. [Google Scholar] [CrossRef]
  22. Reza, K.M.; Kurny, A.S.W.; Gulshan, F. Parameters affecting the photocatalytic degradation of dyes using TiO2: A review. Appl. Water Sci. 2017, 7, 1569–1578. [Google Scholar] [CrossRef] [Green Version]
  23. Gusain, R.; Gupta, K.; Joshi, P.; Khatri, O.P. Adsorptive removal and photocatalytic degradation of organic pollutants using metal oxides and their composites: A comprehensive review. Adv. Colloid. Interface Sci. 2019, 272, 102009. [Google Scholar] [CrossRef]
  24. Shedbalkar, U.; Jadhav, J.P. Detoxification of Malachite Green and Textile Industrial Effluent by Penicillium ochrochloron. Biotechnol. Bioproc. E 2011, 16, 196–204. [Google Scholar] [CrossRef]
  25. Lieke, T.; Meinelt, T.; Hoseinifar, S.H.; Pan, B.; Straus, D.L.; Steinberg, C.E. Sustainable aquaculture requires environmental-friendly treatment strategies for fish diseases. Rev. Aquacultute 2020, 12, 943–965. [Google Scholar] [CrossRef] [Green Version]
  26. Yaoping, H.; Zhijin, G.; Junfei, L. Fluorescence detection of malachite green in fish tissue using red emissive Se,N,Cl-doped carbon dots. Food Chem. 2021, 335, 127677. [Google Scholar]
  27. Srivastava, S.; Sinha, R.; Roy, D. Toxicological effects of malachite green. Aquat. Toxicol. 2004, 66, 319–329. [Google Scholar] [CrossRef] [PubMed]
  28. Berberidou, C.; Xanthopoulos, K.; Paspaltsis, I.; Lourbopoulos, A.; Polyzoidou, E.; Sklaviadis, T.; Poulios, I. Homogenous photocatalytic decontamination of prion infected stainless steel and titanium surfaces. Prion 2013, 7, 488–495. [Google Scholar] [CrossRef] [Green Version]
  29. Nicholson, W.L.; Munakata, N.; Horneck, G.; Melosh, H.J.; Setlow, P. Resistance of Bacillus endospores to extreme terrestrial and extraterrestrial environments. Microbiol. Mol. Biol. R 2000, 64, 548–572. [Google Scholar] [CrossRef] [Green Version]
  30. Schottroff, F.; Pyatkovskyy, T.; Reineke, K.; Setlow, P.; Sastry, S.K.; Jaeger, H. Mechanisms of enhanced bacterial endospore inactivation during sterilization by ohmic heating. Bioelectrochemistry 2019, 130, 107338. [Google Scholar] [CrossRef]
  31. Berberidou, C.; Paspaltsis, I.; Pavlidou, E.; Sklaviadis, T.; Poulios, I. Heterogenous photocatalytic inactivation of B. stearothermophilus endospores in aqueous suspensions under artificial and solar irradiation. Appl Catal. B Environ. 2012, 125, 375–382. [Google Scholar] [CrossRef]
  32. Xu, Y.; Zhang, C.; Zhang, L.; Zhang, X.; Yao, H.; Shi, J. Pd-catalyzed instant hydrogenation of TiO2 with enhanced photocatalytic performance. Energy Environ. Sci. 2016, 9, 2410–2417. [Google Scholar] [CrossRef]
  33. Wang, H.; Xiong, J.; Cheng, X.; Chen, G.; Kups, T.; Wang, D.; Schaaf, P. Hydrogen–nitrogen plasma assisted synthesis of titanium dioxide with enhanced performance as anode for sodium ion batteries. Sci. Rep. 2020, 10, 11817. [Google Scholar] [CrossRef] [PubMed]
  34. Kubelka, P.; Munk, F. Ein Beitrag Zur Optik Der Farbanstriche. Zhurnal Tekhnicheskoi Fiz. 1931, 12, 593–601. [Google Scholar]
  35. Tauc, J.; Grigorovici, R.; Vancu, A. Optical Properties and Electronic Structure of Amorphous Germanium. Physica Status Solidi 1966, 15, 627–637. [Google Scholar] [CrossRef]
  36. Makuła, P.; Pacia, M.; Macyk, W. How To Correctly Determine the Band Gap Energy of Modified Semiconductor Photocatalysts Based on UV–Vis Spectra. J. Phys. Chem. Lett. 2018, 9, 6814–6817. [Google Scholar] [CrossRef] [Green Version]
  37. Zhang, M.; Lin, G.; Dong, C.; Wen, L. Amorphous TiO2 films with high refractive index deposited by pulsed bias arc ion plating. Surf. Coat. Technol. 2007, 201, 7252–7258. [Google Scholar] [CrossRef]
  38. Bendavid, A.; Martin, P.J.; Takikawa, H. Deposition and modification of titanium dioxide thin films by filtered arc deposition. Thin Solid Film. 2000, 360, 241–249. [Google Scholar] [CrossRef]
  39. Ohtani, B.; Kakimoto, M.; Miyadzu, H.; Nishimoto, S.; Kagiya, T. Effect of surface-adsorbed 2-propanol on the photocatalytic reduction of silver and/or nitrate ions in acidic titania suspension. J. Phys. Chem. 1988, 92, 5773–5777. [Google Scholar] [CrossRef]
  40. Kalathil, S.; Khan, M.M.; Ansari, S.A.; Lee, J.; Cho, M.H. Band gap narrowing of titanium dioxide (TiO2) nanocrystals by electrochemically active biofilms and their visible light activity. Nanoscale 2013, 5, 6323–6326. [Google Scholar] [CrossRef]
  41. Liu, X.; Gao, S.; Xu, H.; Lou, Z.; Wang, W.; Huang, B.; Dai, Y. Green synthetic approach for Ti3+ self-doped TiO2−x nanoparticles with efficient visible light photocatalytic activity. Nanoscale 2013, 5, 1870–1875. [Google Scholar] [CrossRef]
  42. Pan, X.; Yang, M.-Q.; Fu, X.; Zhang, N.; Xu, Y.-J. Defective TiO2 with oxygen vacancies: Synthesis, properties and photocatalytic applications. Nanoscale 2013, 5, 3601–3614. [Google Scholar] [CrossRef] [PubMed]
  43. Kuznetsov, V.N.; Serpone, N. On the Origin of the Spectral Bands in the Visible Absorption Spectra of Visible-Light-Active TiO2 Specimens Analysis and Assignments. J. Phys. Chem. C 2009, 113, 15110–15123. [Google Scholar] [CrossRef]
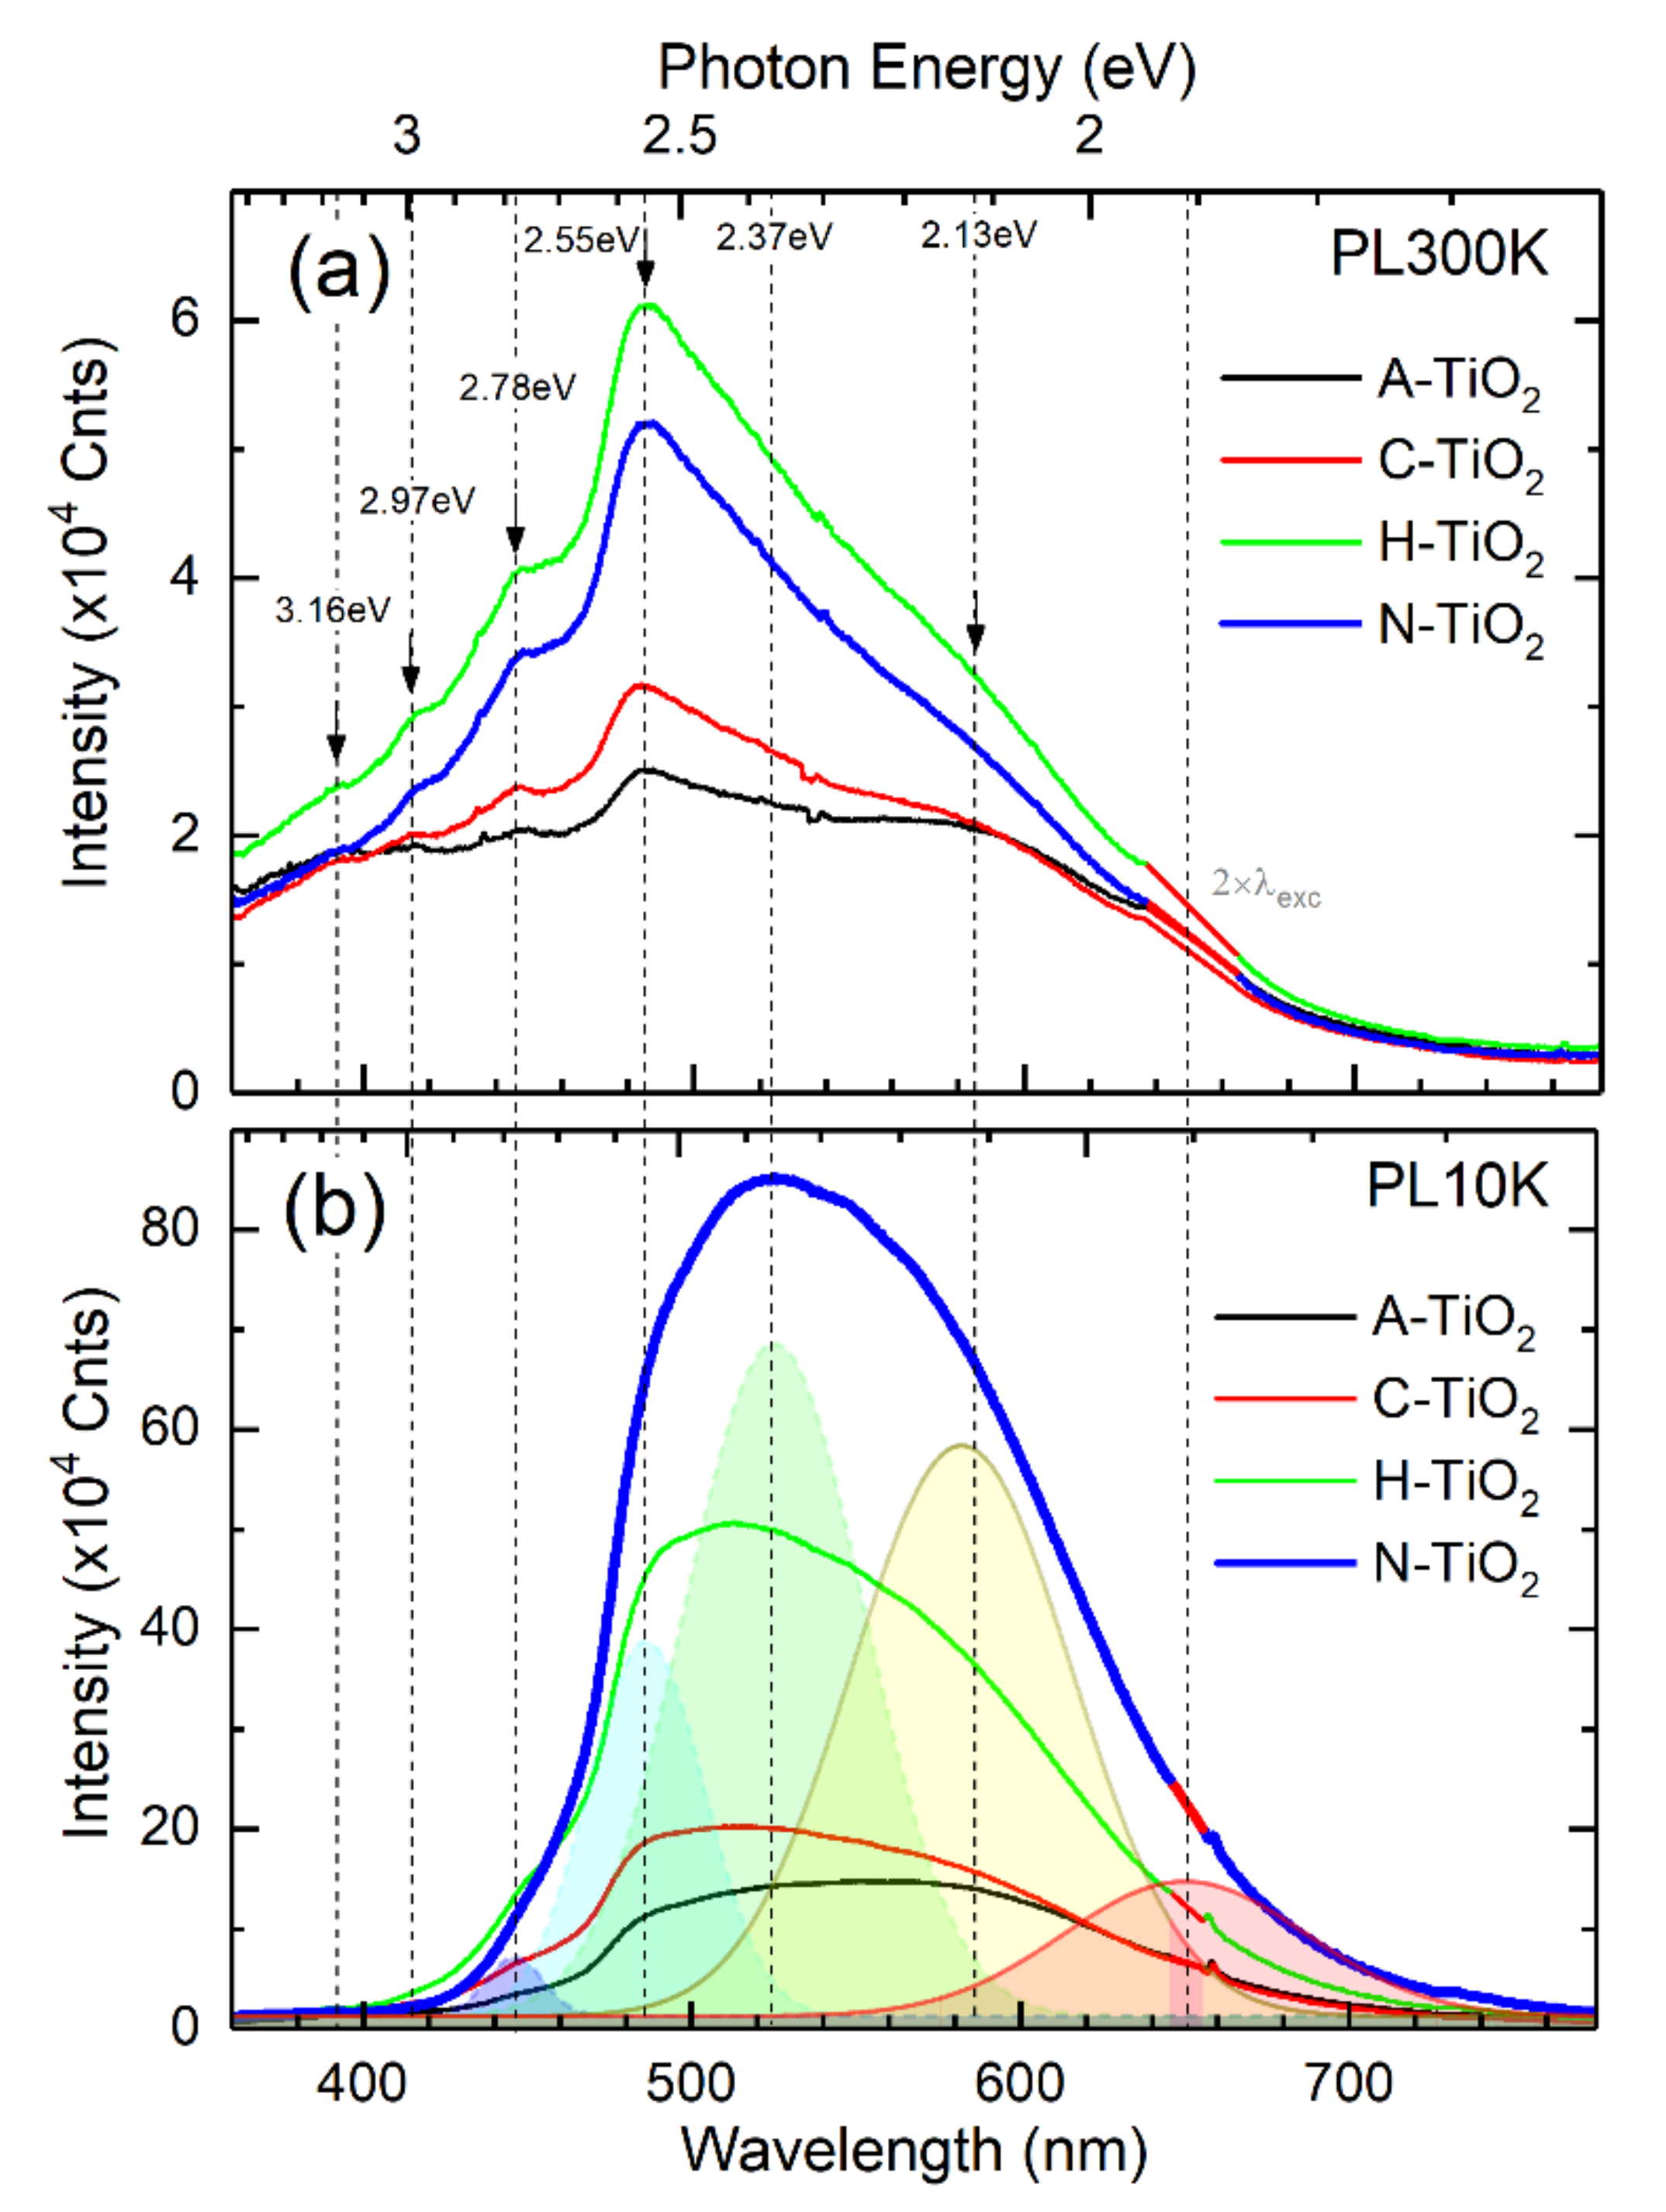
  44. Watanabe, M.; Sasaki, S.; Hayashi, T. Time-resolved study of photoluminescence in anatase TiO2. J. Lumin. 2000, 87–89, 1234–1236. [Google Scholar] [CrossRef]
  45. Tang, H.; Berger, H.; Schmid, P.E.; Lévy, F.; Burri, G. Photoluminescence in TiO2 anatase single crystals. Solid State Commun. 1993, 87, 847–850. [Google Scholar] [CrossRef]
  46. Sildos, I.; Suisalu, A.; Aarik, J.; Sekiya, T.; Kurita, S. Self-trapped exciton emission in crystalline anatase. J. Lumin. 2000, 87–89, 290–292. [Google Scholar] [CrossRef]
  47. Najafov, H.; Tokita, S.; Ohshio, S.; Kato, A.; Saitoh, H. Green and Ultraviolet Emissions From Anatase TiO2 Films Fabricated by Chemical Vapor Deposition. Jpn. J. Appl. Phys. 2005, 44, 245–253. [Google Scholar] [CrossRef]
  48. Zhang, W.F.; Zhang, M.S.; Yin, Z.; Chen, Q. Photoluminescence in anatase titanium dioxide nanocrystals. Appl. Phys. B 2000, 70, 261–265. [Google Scholar] [CrossRef]
  49. Asahi, R.; Morikawa, T. Nitrogen complex species and its chemical nature in TiO2 for visible-light sensitized photocatalysis. Chem. Phys. 2007, 339, 57–63. [Google Scholar] [CrossRef]
  50. Saraf, L.V.; Patil, S.I.; Ogale, S.B.; Sainkar, S.R.; Kshirsager, S.T. Synthesis of Nanophase TiO2 by Ion Beam Sputtering and Cold Condensation Technique. Int. J. Mod. Phys. B 1998, 12, 2635–2647. [Google Scholar] [CrossRef]
  51. Serpone, N. Is the Band Gap of Pristine TiO2 Narrowed by Anion- and Cation-Doping of Titanium Dioxide in Second-Generation Photocatalysts? J. Phys. Chem. B 2006, 110, 24287–24293. [Google Scholar] [CrossRef]
  52. Mathew, S.; Prasad, A.K.; Benoy, T.; Rakesh, P.P.; Hari, M.; Libish, T.M.; Radhakrishnan, P.; Nampoori, V.P.N.; Vallabhan, C.P.G. UV-visible photoluminescence of TiO2 nanoparticles prepared by hydrothermal method. J. Fluoresc 2012, 22, 1563–1569. [Google Scholar] [CrossRef]
  53. Lei, Y.; Zhang, L.D.; Meng, G.W.; Li, G.H.; Zhang, X.Y.; Liang, C.H.; Chen, W.; Wang, S.X. Preparation and photoluminescence of highly ordered TiO2 nanowire arrays. Appl. Phys. Lett. 2001, 78, 1125–1127. [Google Scholar] [CrossRef]
  54. Liu, X.; Carvalho, P.; Getz, M.N.; Norby, T.; Chatzitakis, A. Black Anatase TiO2 Nanotubes with Tunable Orientation for High Performance Supercapacitors. J. Phys. Chem. C 2019, 123, 21931–21940. [Google Scholar] [CrossRef]
  55. Livraghi, S.; Paganini, M.C.; Giamello, E.; Selloni, A.; Di Valentin, C.; Pacchioni, G. Origin of Photoactivity of Nitrogen-Doped Titanium Dioxide under Visible Light. J. Am. Chem. Soc. 2006, 128, 15666–15671. [Google Scholar] [CrossRef]
  56. Shiotani, M.; Moro, G.; Freed, J.H. ESR studies of 0–2 adsorbed on Ti supported surfaces: Analysis of motional dynamics. J. Chem. Phys. 1981, 74, 2616–2640. [Google Scholar] [CrossRef]
  57. Che, M.; Tench, A.J. Characterization and Reactivity of Molecular Oxygen Species on Oxide Surfaces. In Advances in Catalysis; Eley, D.D., Pines, H., Weisz, P.B., Eds.; Academic Press: Cambridge, MA, USA, 1983; Volume 32, pp. 1–148. [Google Scholar]
  58. Livraghi, S.; Chiesa, M.; Paganini, M.C.; Giamello, E. On the Nature of Reduced States in Titanium Dioxide As Monitored by Electron Paramagnetic Resonance. I: The Anatase Case. J. Phys. Chem. C 2011, 115, 25413–25421. [Google Scholar] [CrossRef]
  59. Kang, X.; Song, X.Z.; Han, Y.; Cao, J.; Tan, Z. Defect-engineered TiO2 Hollow Spiny Nanocubes for Phenol Degradation under Visible Light Irradiation. Sci. Rep. 2018, 8, 5904. [Google Scholar] [CrossRef] [PubMed]
  60. Dong, F.; Zhao, W.; Wu, Z.; Guo, S. Band structure and visible light photocatalytic activity of multi-type nitrogen doped TiO2 nanoparticles prepared by thermal decomposition. J. Hazard. Mater. 2009, 162, 763–770. [Google Scholar] [CrossRef] [PubMed]
  61. Chatzitakis, A.; Grandcolas, M.; Xu, K.; Mei, S.; Yang, J.; Jensen, I.J.T.; Simon, C.; Norby, T. Assessing the photoelectrochemical properties of C, N, F codoped TiO2 nanotubes of different lengths. Catal. Today 2017, 287, 161–168. [Google Scholar] [CrossRef] [Green Version]
  62. Schaeffer, A.B.; Fulton, M.D. A simplified method of staining endospores. Science 1933, 77, 194. [Google Scholar] [CrossRef]
  63. Braun, A.M.; Maurette, M.T.; Oliveros, E. Photochemical Technology; Wiley: New York, NY, USA, 1991. [Google Scholar]
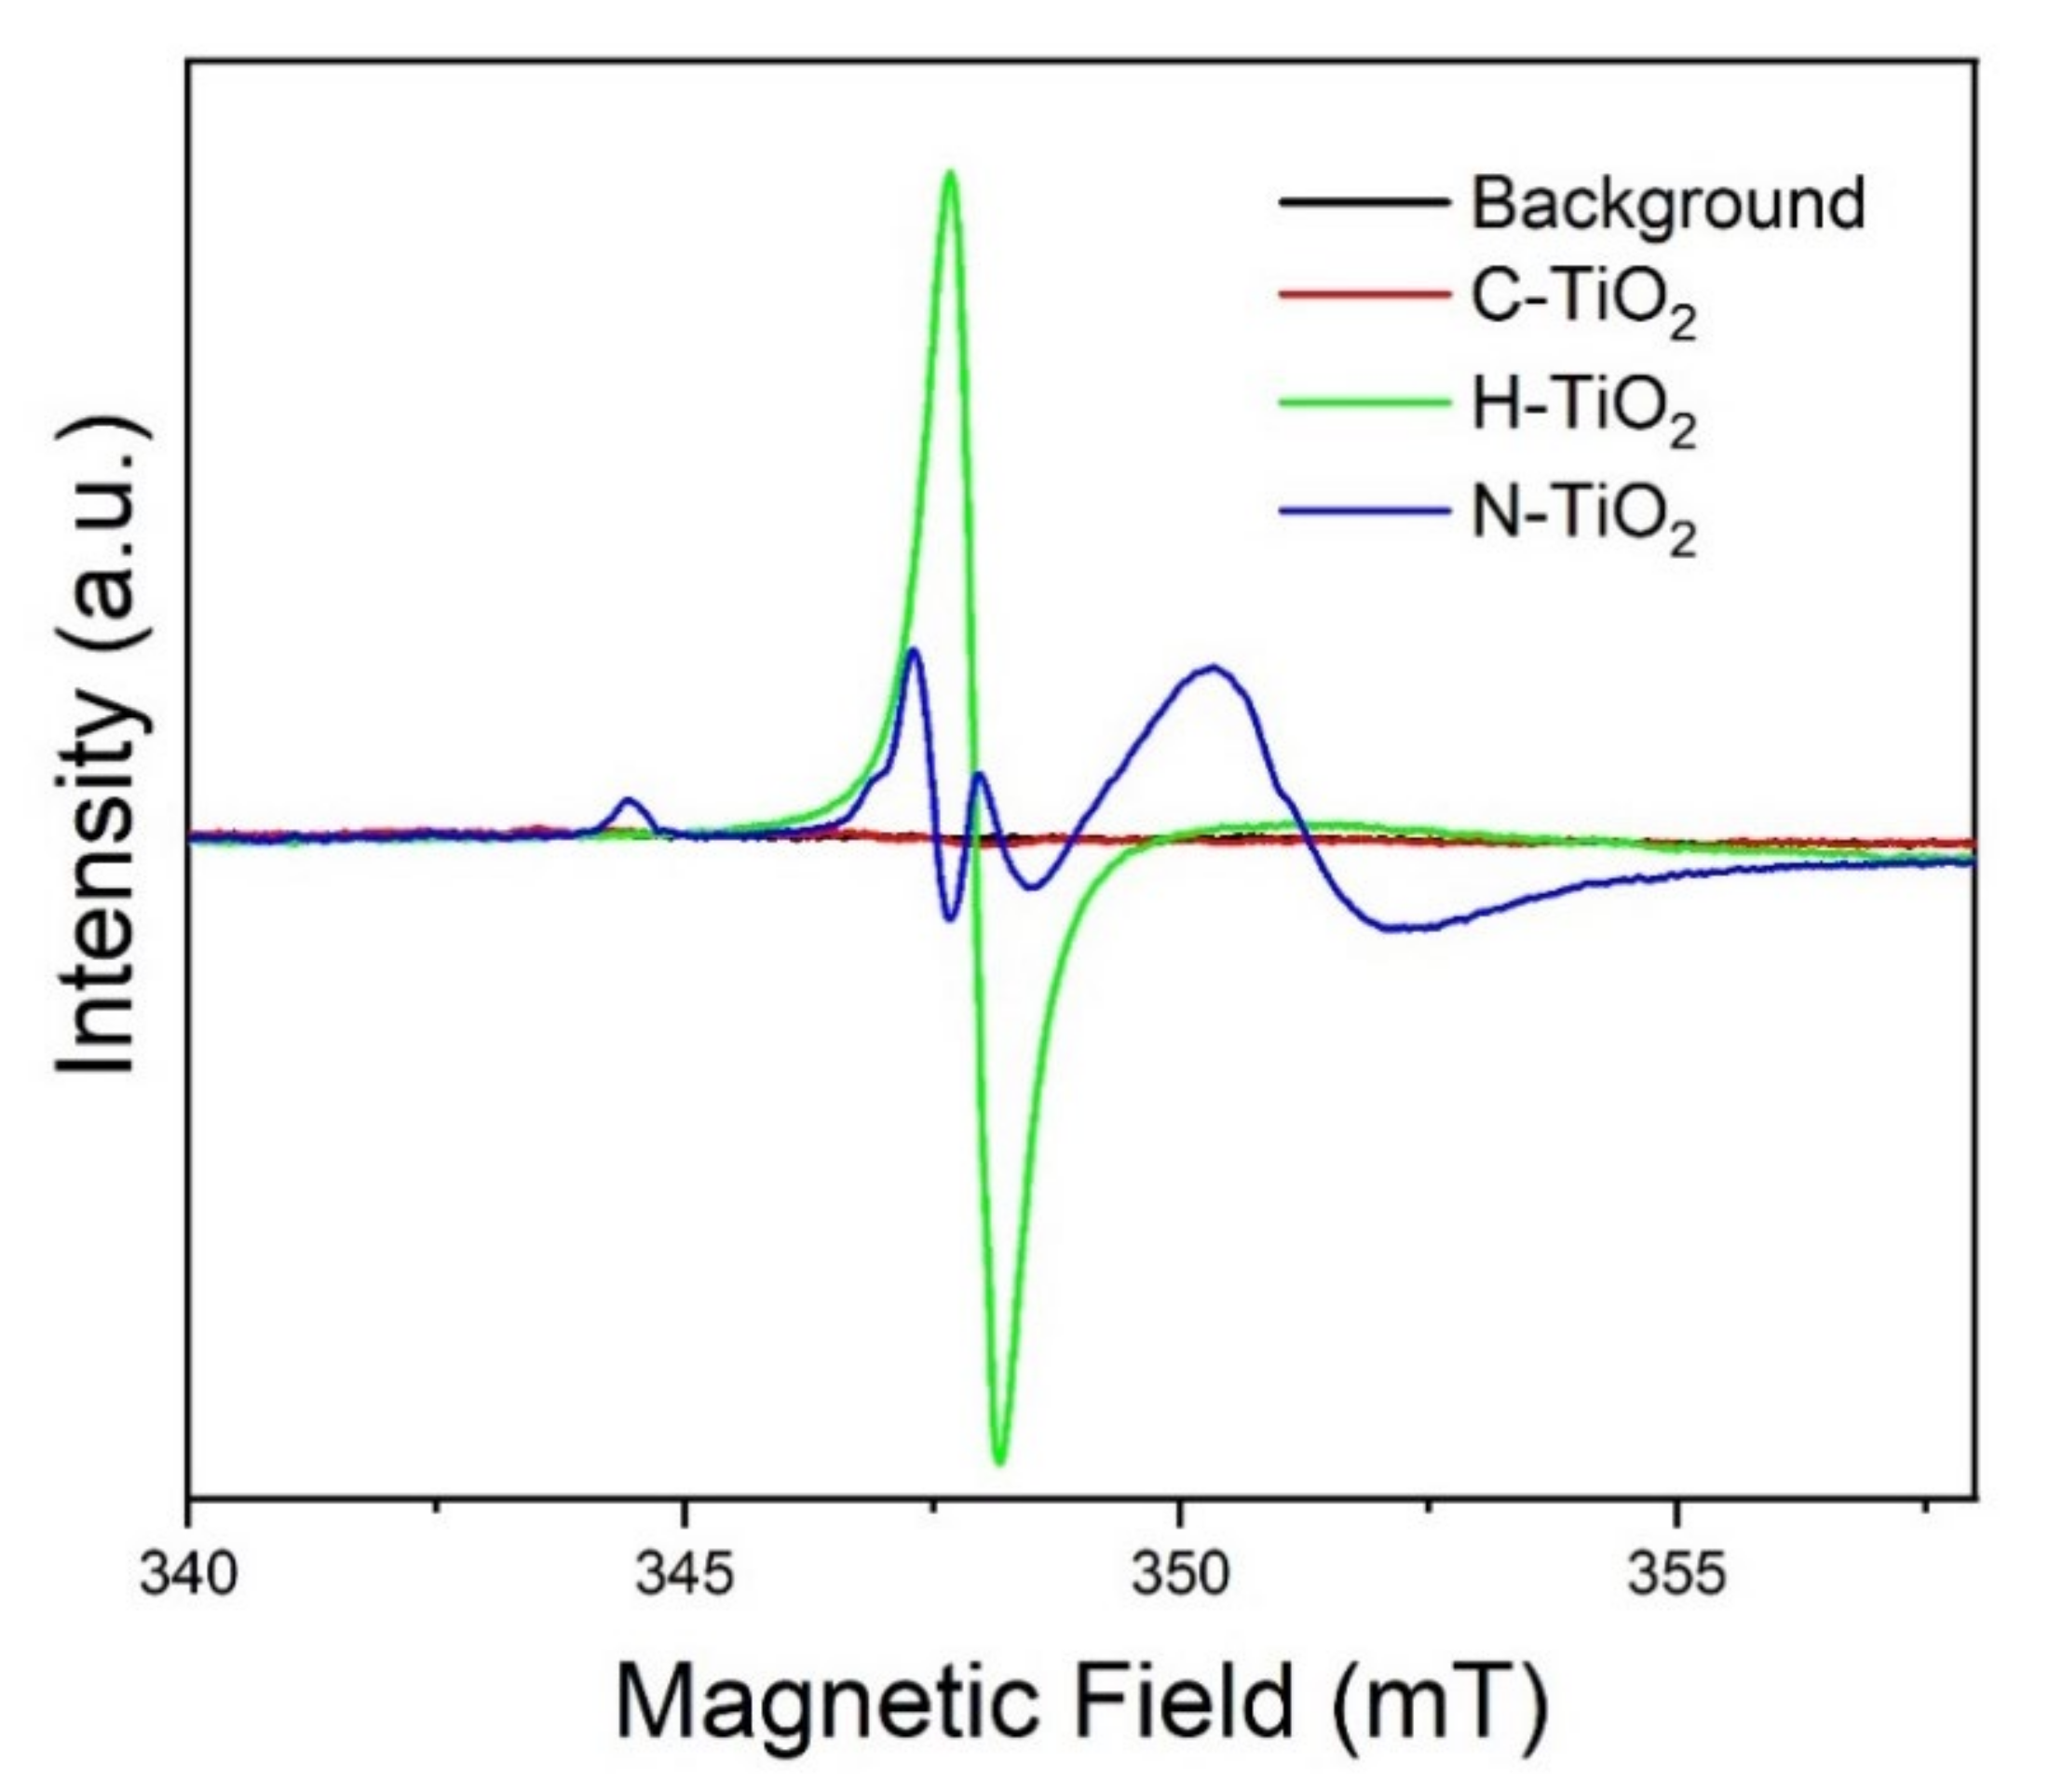
Figure 1. Photographs of the investigated TiO2 nanocrystals (a) and representative SEM images of A-TiO2 (b), C-TiO2 (c), H-TiO2 (d), and N-TiO2 (e), respectively. Scale bar: 300 nm.
Catalysts 11 00228 g001
Figure 2. XRD patterns of the prepared TiO2 nanocrystals.
Catalysts 11 00228 g002
Figure 3. Selected-Area Electron Diffraction (SAED) patterns(ac) and high-resolution ABF-STEM images (df) acquired from C-TiO2, H-TiO2 and N-TiO2, respectively. Anatase (A) and rutile (R) phases coexist in all samples, with anatase being dominant. The insets in (df) show lower-magnification images, illustrating the overall morphology of the faceted nanoparticles. Measurements of the A(101) d-spacings reveal a lattice expansion in the case of H-TiO2 and N-TiO2 along with the formation of ~1 nm surface lattice distortion (annotated by pink arrows).
Catalysts 11 00228 g003
Figure 4. Optical absorption properties of the TiO2 powders: diffuse reflectance (a), modified Kubelka-Munk function (b), Tauc plot assuming indirect (allowed) transitions (c).
Catalysts 11 00228 g004
Figure 5. Optical emission properties of the TiO2 powders: PL spectra measured in vacuum at 300 K (a) and 10 K (b). The key emission components are indicated by Gaussian deconvolution curves/shaded areas.
Catalysts 11 00228 g005
Figure 6. EPR spectra of paramagnetic species in C-TiO2, H-TiO2 and N-TiO2. Spectra in this display have not been adjusted for slightly different microwave frequencies or for slightly different sample weights. The frequencies were 9755.2 MHz, 9755.0 MHz, 9753.3 MHz and 9754.3 MHz for background, C-TiO2, H-TiO2 and N-TiO2, respectively.
Catalysts 11 00228 g006
Figure 7. Photocatalytic decolorization of MG (a) and inactivation of G. stearothermophilus endospores (b) under visible light illumination. In all cases 0.5 g L−1 of the corresponding photocatalyst were used.
Catalysts 11 00228 g007
Table 1. Spin Hamiltonian Parameters of the different paramagnetic species in C-TiO2, H-TiO2, and N-TiO2 identified by EPR. The uncertainty is about ±0.0006.
Sample v O Ti3+O2•− (gzz)O2•− (gyy)Nb (g1)
Species *
C-TiO22.0020--2.0088 **2.0050 **
H-TiO22.0033----
N-TiO22.00181.98462.02352.00872.0055
* The notation used herein is in accordance with Livraghi et al. [55]. ** It is underlined that the intensity of these signals is marginal but can still be differentiated from the background signal. A higher resolution graph is given in the Supplementary Information (SI) in Figure S1.
Table 2. Initial degradation (r0) rates during photocatalytic oxidation of 5 mg L−1 MG in the presence of 0.5 g L−1 photocatalyst and visible light illumination.
Photocatalyst r0 (mg L−1 min−1)
-0.0002 ± 0.00008
A-TiO20.007 ± 0.0009
C-TiO20.002 ± 0.0003
H-TiO20.012 ± 0.007
N-TiO20.019 ± 0.002
TiO2 P250.006 ± 0.001
Publisher’s Note: MDPI stays neutral with regard to jurisdictional claims in published maps and institutional affiliations.

