Review

Roadmap of Effects of Biowaste-Synthesized Carbon Nanomaterials on Carbon Nano-Reinforced Composites

by
Bhavana H. Thippeswamy
1,
Anantha Sunil Maligi
1 and
Gurumurthy Hegde
2,3,*
1
Department of Electronics & Communication Engineering, B.M.S. College of Engineering, Bengaluru 560019, Bangalore, India
2
Department of Chemistry, CHRIST (Deemed to be University), Hosur Road, Bengaluru 560029, Karnataka, India
3
Centre for Advanced Research and Development (CARD), CHRIST (Deemed to be University), Hosur Road, Bengaluru 560029, Karnataka, India
*
Author to whom correspondence should be addressed.
Catalysts 2021, 11(12), 1485; https://doi.org/10.3390/catal11121485
Submission received: 13 October 2021 / Revised: 19 November 2021 / Accepted: 22 November 2021 / Published: 3 December 2021
(This article belongs to the Special Issue Recent Advances in Energy-Related Materials in Catalysts)

Abstract

:
Sustainable growth can be achieved by recycling waste material into useful resources without affecting the natural ecosystem. Among all nanomaterials, carbon nanomaterials from biowaste are used for various applications. The pyrolysis process is one of the eco-friendly ways for synthesizing such carbon nanomaterials. Recently, polymer nanocomposites (PNCs) filled with biowaste-based carbon nanomaterials attracted a lot of attention due to their enhanced mechanical properties. A variety of polymers, such as thermoplastics, thermosetting polymers, elastomers, and their blends, can be used in the formation of composite materials. This review summarizes the synthesis of carbon nanomaterials, polymer nanocomposites, and mechanical properties of PNCs. The review also focuses on various biowaste-based precursors, their nanoproperties, and turning them into proper composites. PNCs show improved mechanical properties by varying the loading percentages of carbon nanomaterials, which are vital for many defence- and aerospace-related industries. Different synthesis processes are used to achieve enhanced ultimate tensile strength and modulus. The present review summarizes the last 5 years’ work in detail on these PNCs and their applications.

Graphical Abstract

1. Introduction

Polymer nanocomposites (PNCs) are thermoplastics and thermosets that are reinforced with small quantities (less than 5 wt% loading) of nanosized particles (<100 nm diameter) as fillers with a high aspect ratio [1]. Fillers play a significant role in the formation of PNCs, as they provide excellent mechanical, electrical, and optical properties. The microsized fillers, such as glass fibre, talc, calcium carbonate, charcoal powder, and ash powder, are extensively used to enhance the strength of host materials. Microsized fillers require loading in the range of 10–40 wt%. High loading of fillers leads to an increase in viscosity and weak molecular bonding, hence making the synthesis of nanocomposites difficult. On the other hand, nanosized fillers with 3–5 wt% loading achieve the same reinforcement as 20–30 wt% loading of microsized fillers [1]. J. R. Pothnis et al. synthesized polymer composites with 0.25 wt% filler loading and report 30% improvement in the tensile strength [2]. Nanomaterials have a weight advantage compared to other fillers and are a potential candidate for synthesis of PNCs. They also possess extraordinary interfacial interaction in the composite materials, which enhances the tensile properties. Hence, PNCs gained attention for various applications, such as the defence, automotive, transportation, aerospace, electronics, and biomedical fields [3,4,5].
PNCs reinforced with activated carbon, such as carbon nanotubes (CNTs), graphene, carbon nanospheres (CNSs), carbon black, and biochar, proved to be excellent filler for the preparation of polymer composites [6]. Eco friendly carbon nanomaterials derived from renewable and sustainable lignocellulose biomass have attracted the researchers recently since non-renewable sources such as fossils, coal, oil and gases generate excessive green house gases, reduces fossil fuel resources and also economically viable [7].
The synthesis of nanocarbons from biomass involves extraction of carbon from natural and inexpensive bioresources, such as lignin, glucose, and cellulose-based materials. Various biowaste materials, such as coffee grounds [8], areca nut [9], onion peel [10], garlic peel [11], banana peel [12], walnut shell [13], wheat husk [14], corn cob [15], and fish scale [16] are used as precursors for the generation of carbon nanomaterials (CNMs). The presence of a cellulose component in the biowaste helps to improve the nanoparticle properties, such as porosity, crystallinity, morphology, and dispersion ability. Hence biowaste-derived carbon nanomaterials find various applications in biomedical, energy storage, optical, material science, and other advanced technologies [6].
Recently, biowaste or biorenewable nanomaterials with polymer nanocomposites attracted a lot of attention, and recent Scopus data suggest interest in the field is growing with respect to subject, country, and year (see Figure 1a–c). Data were collected from Scopus for the last 5 years by typing the keywords “bio”, ”nano”, and “polymer composites”. One can see that as the years progress, more and more researchers are taking part in this subject, as evidenced by the publication numbers. In this review article, polymer composites reinforced with CNMs derived from different biowaste materials from recent research activities are critically reviewed. The significance of CNMs in reinforcement and synthesis of PNCs are discussed. Mechanical properties, such as tensile strength, modulus, and fractural behaviour of PNCs are summarized.

2. Biowaste-Based Carbon Nanomaterials

The global demand for food, goods, and energy sources increases continuously with the growing population. Enormous energy requirements and consumption of resources have made a severe impact on our ecosystem. The effect is due to the release of waste materials from different sectors of the globe into land, air, and water sources. The increased level of carbon dioxide, waste disposal cost, storage space, and land and water pollution from ecological and industrial wastes have created a global issue.

2.1. Classification of Biowaste Material

Biomass is basically plant or plant-based materials with the advantages of low cost, abundantly availability, good quality, and eco-friendliness. The biowaste consists of enormous amounts of organic and inorganic residue from living matter or different sources. These sources include food-processing units (industries, restaurants, kitchens), residues from gardens and forests, waste from agriculture and fisheries, domestic sewage and manure, and agro-based industries [17,18]. Biomass production is around 105 billion metric tonnes worldwide, which leads to the generation of 104.9 petagrams of carbon every year [19]. Biomass can be classified based on source and waste composition as described by Figure 2.
The conversion of these biowaste materials into value-added materials or products attracts researchers and industries. Various technical and business models were initiated to encourage waste-to-wealth schemes under biorefinery proposals [20,21]. The lignocellulose present in biomass is a suitable precursor to produce activated carbon nanomaterial [22]. Cellulose, hemicellulose, and lignin are the major constituents of biowaste, which vary based on the plant species and age and weather, whereas some minerals are minor constituents [23]. Lignin is another carbon-rich component of biomass after cellulose, and the worldwide production of lignin is around 40–50 million tons per year. The organic carbon content of biomass can be converted into solid (biochar), liquid (bio-oil), and gaseous (syngas) carbon products by thermochemical treatments [24].

2.2. Carbon Nanomaterial Synthesis and Its Applications

Carbon is unique and vital, the 17th most common element in Earth’s crust [25], but elemental carbon is only about 0.2% of the total mass of the planet. Compared to normal carbon materials, carbon nanomaterials exhibit exceptional properties, such as high surface area, mechanical strength, electrical conductivity, low toxicity, biocompatibility, and thermal stability. Carbon nanomaterials have sp2-bonder carbon material with different allotropes, as shown in Figure 3, which have the same chemical properties but distinct physical properties. Many synthetic processes, which prepare carbon nanomaterials in different sizes, shapes, and chemical compositions, are discussed in the literature.
The synthesis of low-cost activated carbon from biomass depends on the characteristics of its precursors, such as abundant availability, lower cost, non-hazardous nature, high carbon, and less ash content [26]. The extraction of carbon from waste biomass is a simple process and reduces the cost of waste disposal and environmental hazards.
Biomass precursors are treated physically and chemically to reduce the particle size and remove contaminants, respectively. Chemical treatment is by strong acid hydrolysis with HNO3, H2SO4, and HCL, but these strong acids need to be neutralized. The precursors can also be treated with distilled water, which does not require the addition of toxic chemicals. The physical treatment mainly involves grinding and milling. The milling process is carried out in ball mills for particle refinement. In this process, small particles are obtained by rolling mills followed by a sieving process. Increased milling time reduces the size of particles. To separate particles of different sizes, screen mesh is used.
Pyrolysis is a thermochemical process that is extensively employed to extract carbon from biomass or organic-based products in the literature. It is considered advantageous over other methods as a complete conversion of lignin content is achieved by breaking the bonds in organic matter using high temperature, usually at 300–700 °C. This process is carried out in a furnace without oxygen and a controlled supply of inert atmosphere. Since chemical bonds of the material are thermally less stable, the bonds disintegrate due to the generation of heat. The pyrolysis produces solids (charcoal, biochar), liquids, and non-condensable gases (H2, CO, CO2, and N). The precursor material composition, pyrolysis temperature, residence time of material inside the pyrolysis chamber, and particle size and physical structure influence the result of the pyrolysis process. In the pyrolysis process, moisture and volatile components are lost, and finally, the remaining biochar decomposes slowly, forming a carbon-rich solid residue [27,28]. Table 1 gives a summary of the biowaste lignocellulose matrix used as precursors for the synthesis of activated carbon. It brings great value to ordinary waste materials.
Because of the attractive properties of carbon nanomaterials, they have a wide range of applications in various fields as described in Figure 4 [30].
The carbon nanomaterial can create strong bonds with lighter objects and itself [31,32], and hence, can synthesize materials with high strength-to-weight ratio, which are suitable for weight-critical applications in the fields of defence, transportation, and aerospace. The usage of carbon nanomaterial in polymers as filler to reinforce the mechanical properties is well documented. Carbon nanomaterials, such as carbon black, carbon nanospheres, and biochar derived from waste biomass are widely used as nanofillers in different polymer matrices. Table 2 gives the nanomaterials obtained from various biowastes and their applications from previous works.
Structural studies are carried out to determine the crystal structure of nanoparticles. The morphology and particle size of synthesized carbon nanoparticles prepared from various biowastes are discussed using microscopic tools, such as a scanning electron microscope (SEM), atomic force microscopy (AFM), and transmission electron microscopy (TEM). Fourier-transform infrared spectroscopy (FTIR) studies are carried out to determine the absorption characteristics and surface functionality of carbon bonds associated with hydrogen and oxygen.

3. Reinforced Polymer Composites

3.1. Properties and Applications of Polymer Composites

The properties of polymers, such as their light weight, easy fabrication, good strength, and low cost, make them useful for various day-to-day applications [46,47,48]. Tailoring the mechanical, thermal, and electrical properties of polymers augments them to be used in industrial applications [49]. Reinforced polymers gained significant interest in the field of nanotechnology and the polymer industry when compared to neat polymers. The reinforced polymers are basically a composite material, which is combination of two or more micro-/macro-/nanofillers and a matrix. The composites consist of a matrix phase (metal, ceramic, polymer) and a reinforcement phase (particles, fibre, filler components, etc.). The filler and polymer matrices have different chemical compositions and are insoluble in each other. The addition of nano-reinforced particles adds new characteristics to the matrices. Fabricating coffee-based bioplastics in a controlled manner can help the food industry [50].
The polymer matrices reinforced with nanomaterials gained the attention of researchers across the globe, since they provide enhanced electrical, optical, mechanical, and thermal properties even at lower loading. Nanomaterials also possess high strength and high surface-to-volume ratio, making them a unique filler for polymer matrices. The carbon-based nanomaterials mainly consist of carbon as a major element and some of the carbon fillers are CNT, fullerene, graphene, and carbon black. Carbon-reinforced polymers exhibit special properties, such as high strength, low weight, and low cost, making them suitable for various applications, such as biomedical, sensors and actuators, defence and aircraft, antibacterial, water remediation, environmental, and food packaging [51].

3.2. Factors Influencing Reinforced Composites

The reinforced nanocomposite is a mixture of nanoparticle and polymer material having distinct chemical and physical properties. For the formation of nanocomposites, factors, such as dispersion, interfacial interaction, surface-to-volume ratio, and mechanical strength of nanofillers, play a significant role.

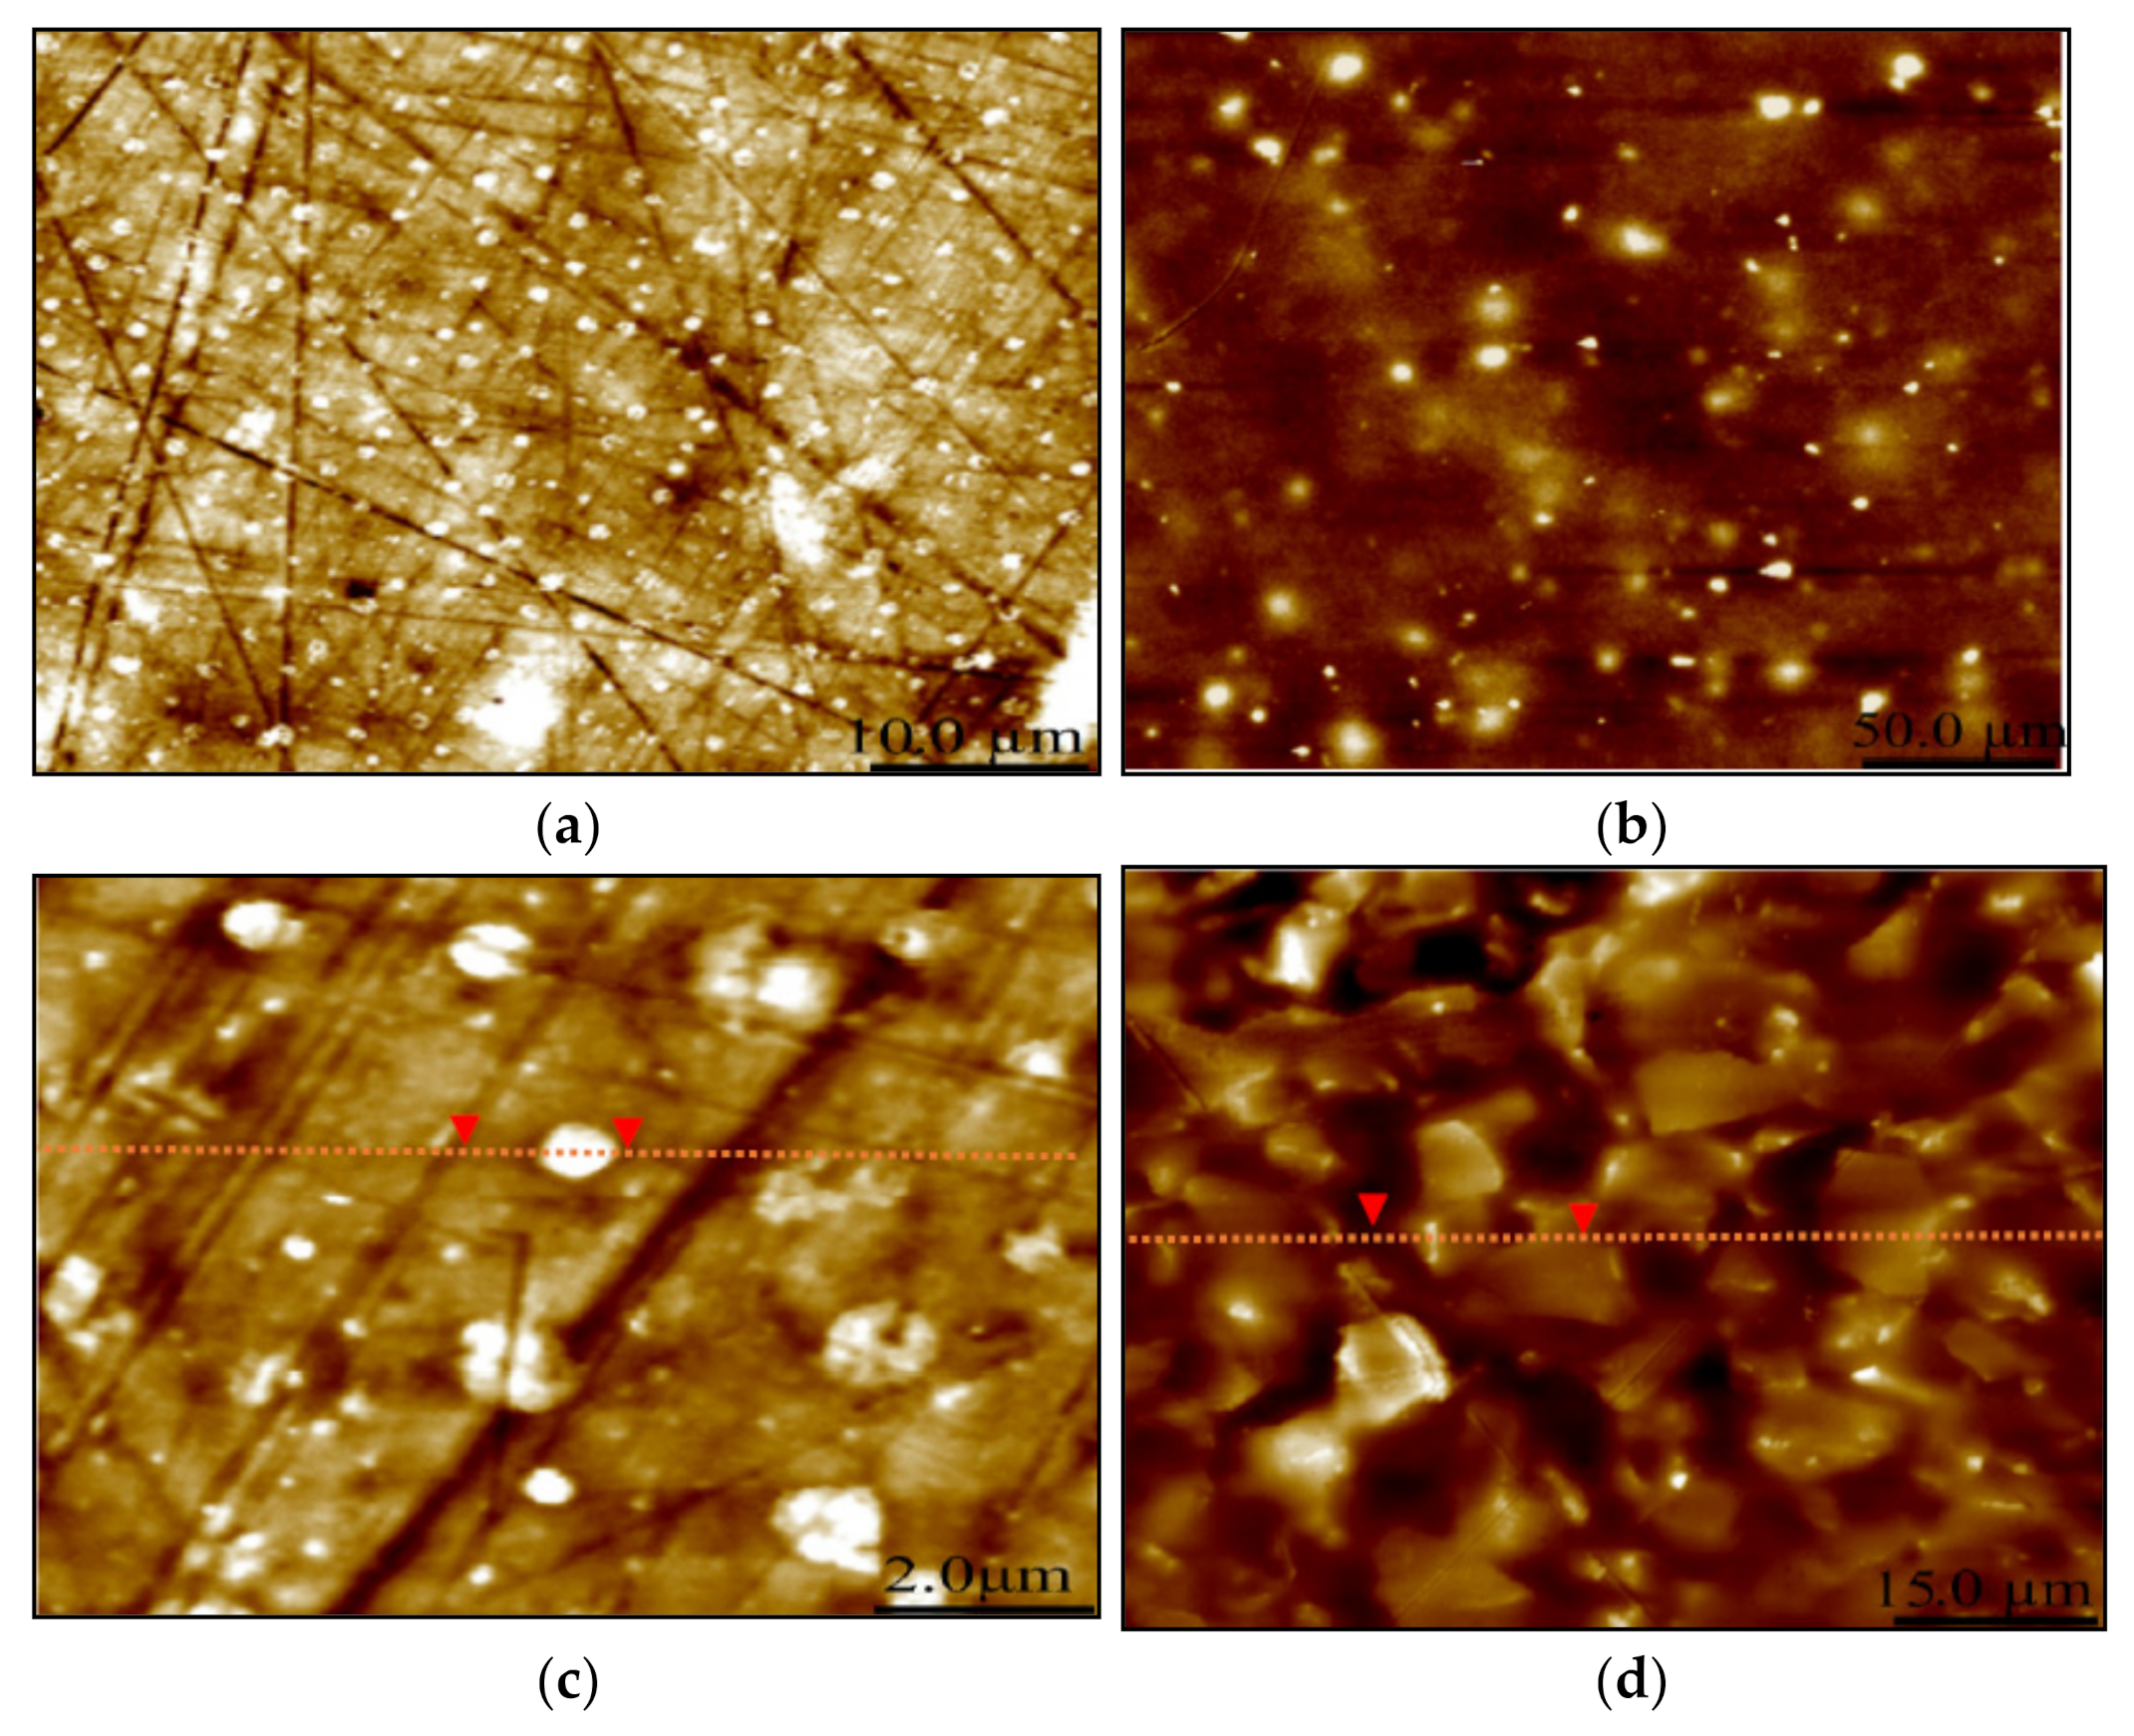
3.2.1. Well Dispersion and Reduced Agglomerations

The maximum benefits of composites can be derived if the dispersion of nanofiller is effective in the polymer matrix. Dispersion of particles strongly influences the load transferring from matrix to reinforcement, and hence, effecting the mechanical properties of composites. Nanomaterials easily combine with each other due to Van der Waals’ attraction in the polymer matrix, resulting in agglomeration. The increase in agglomeration is due to poor dispersion of nanoparticles. The agglomeration also reduces the surface area of nanofillers for transferring load, and hence, it is not desirable.

3.2.2. Interfacial Interaction between Polymer and Nanofiller

The interfacial interaction (adhesion) between the nanoparticles and polymer matrix should be very high for effective load transferring and enhanced mechanical properties [52]. Poor adhesiveness results in the formation of agglomeration, and hence, reduced physical properties of the composite.

3.2.3. High Surface-to-Volume Ratio of Nanofillers

The high surface-to-volume ratio increases the number of particle matrix interactions, and hence, aids in the improvement of the load-bearing capacity of composite materials.

3.2.4. Good Mechanical Properties of Nanofillers

The shape and amount of nanofiller greatly affects the formation of composites. The mechanical properties of nanofillers, such as Young’s modulus and strength, should be high to produce high-quality polymer composites.

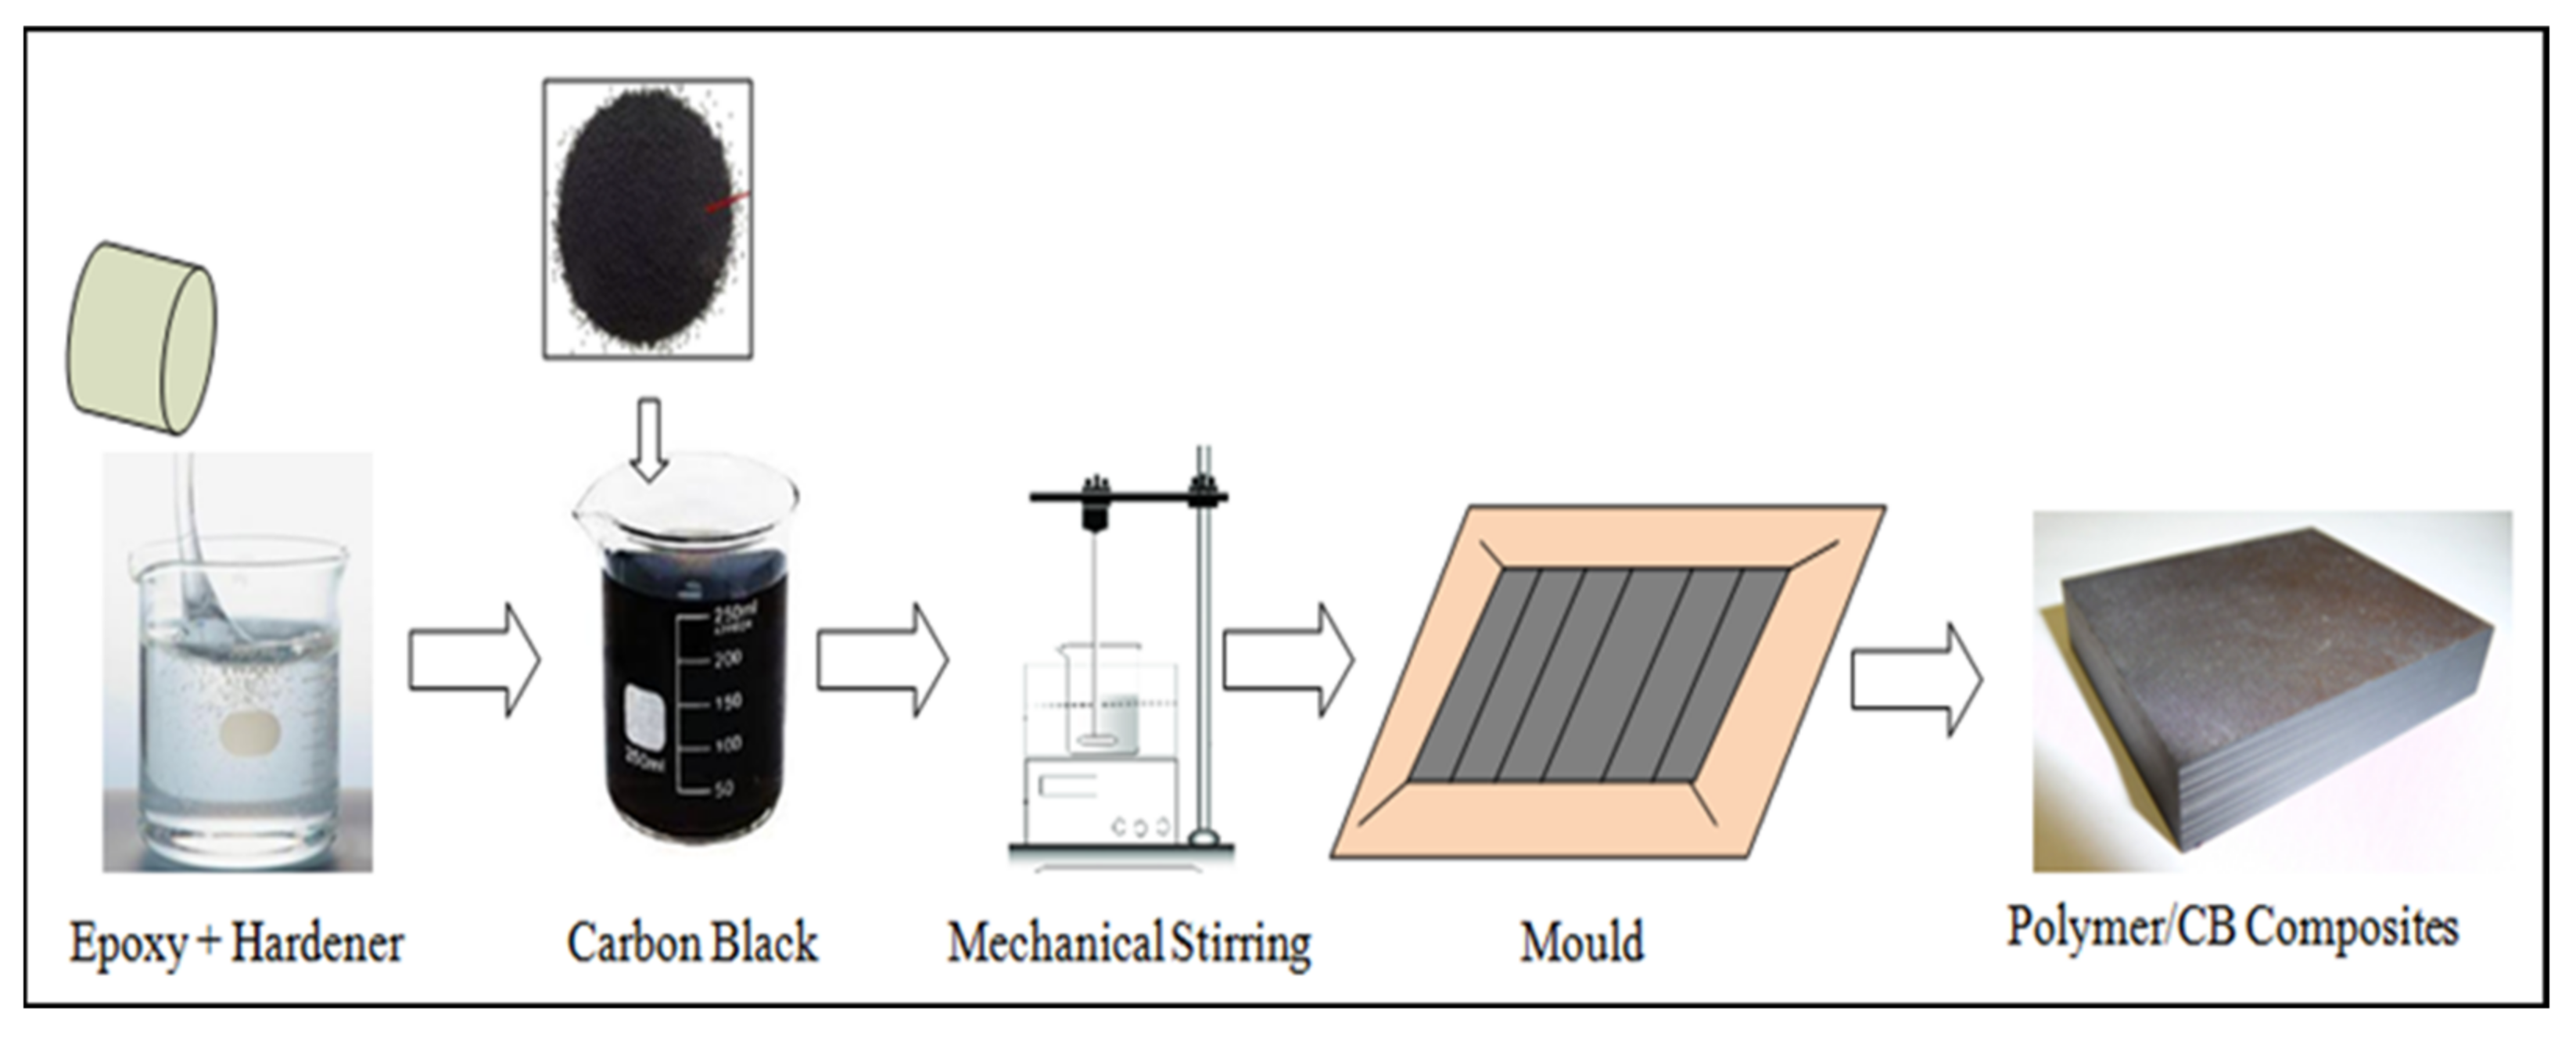
3.3. Synthesis of Polymer Nanocomposites

The mechanical properties of polymer–carbon nanocomposites largely depend on processing method and conditions. A variety of chemical and mechanical methods are employed to synthesize carbon nanoparticles and polymer composites [53]. Low-cost and easy processing methods, such as solvent processing and melt extrusion are extensively used to synthesize polymer nanocomposites at lab scale [54].

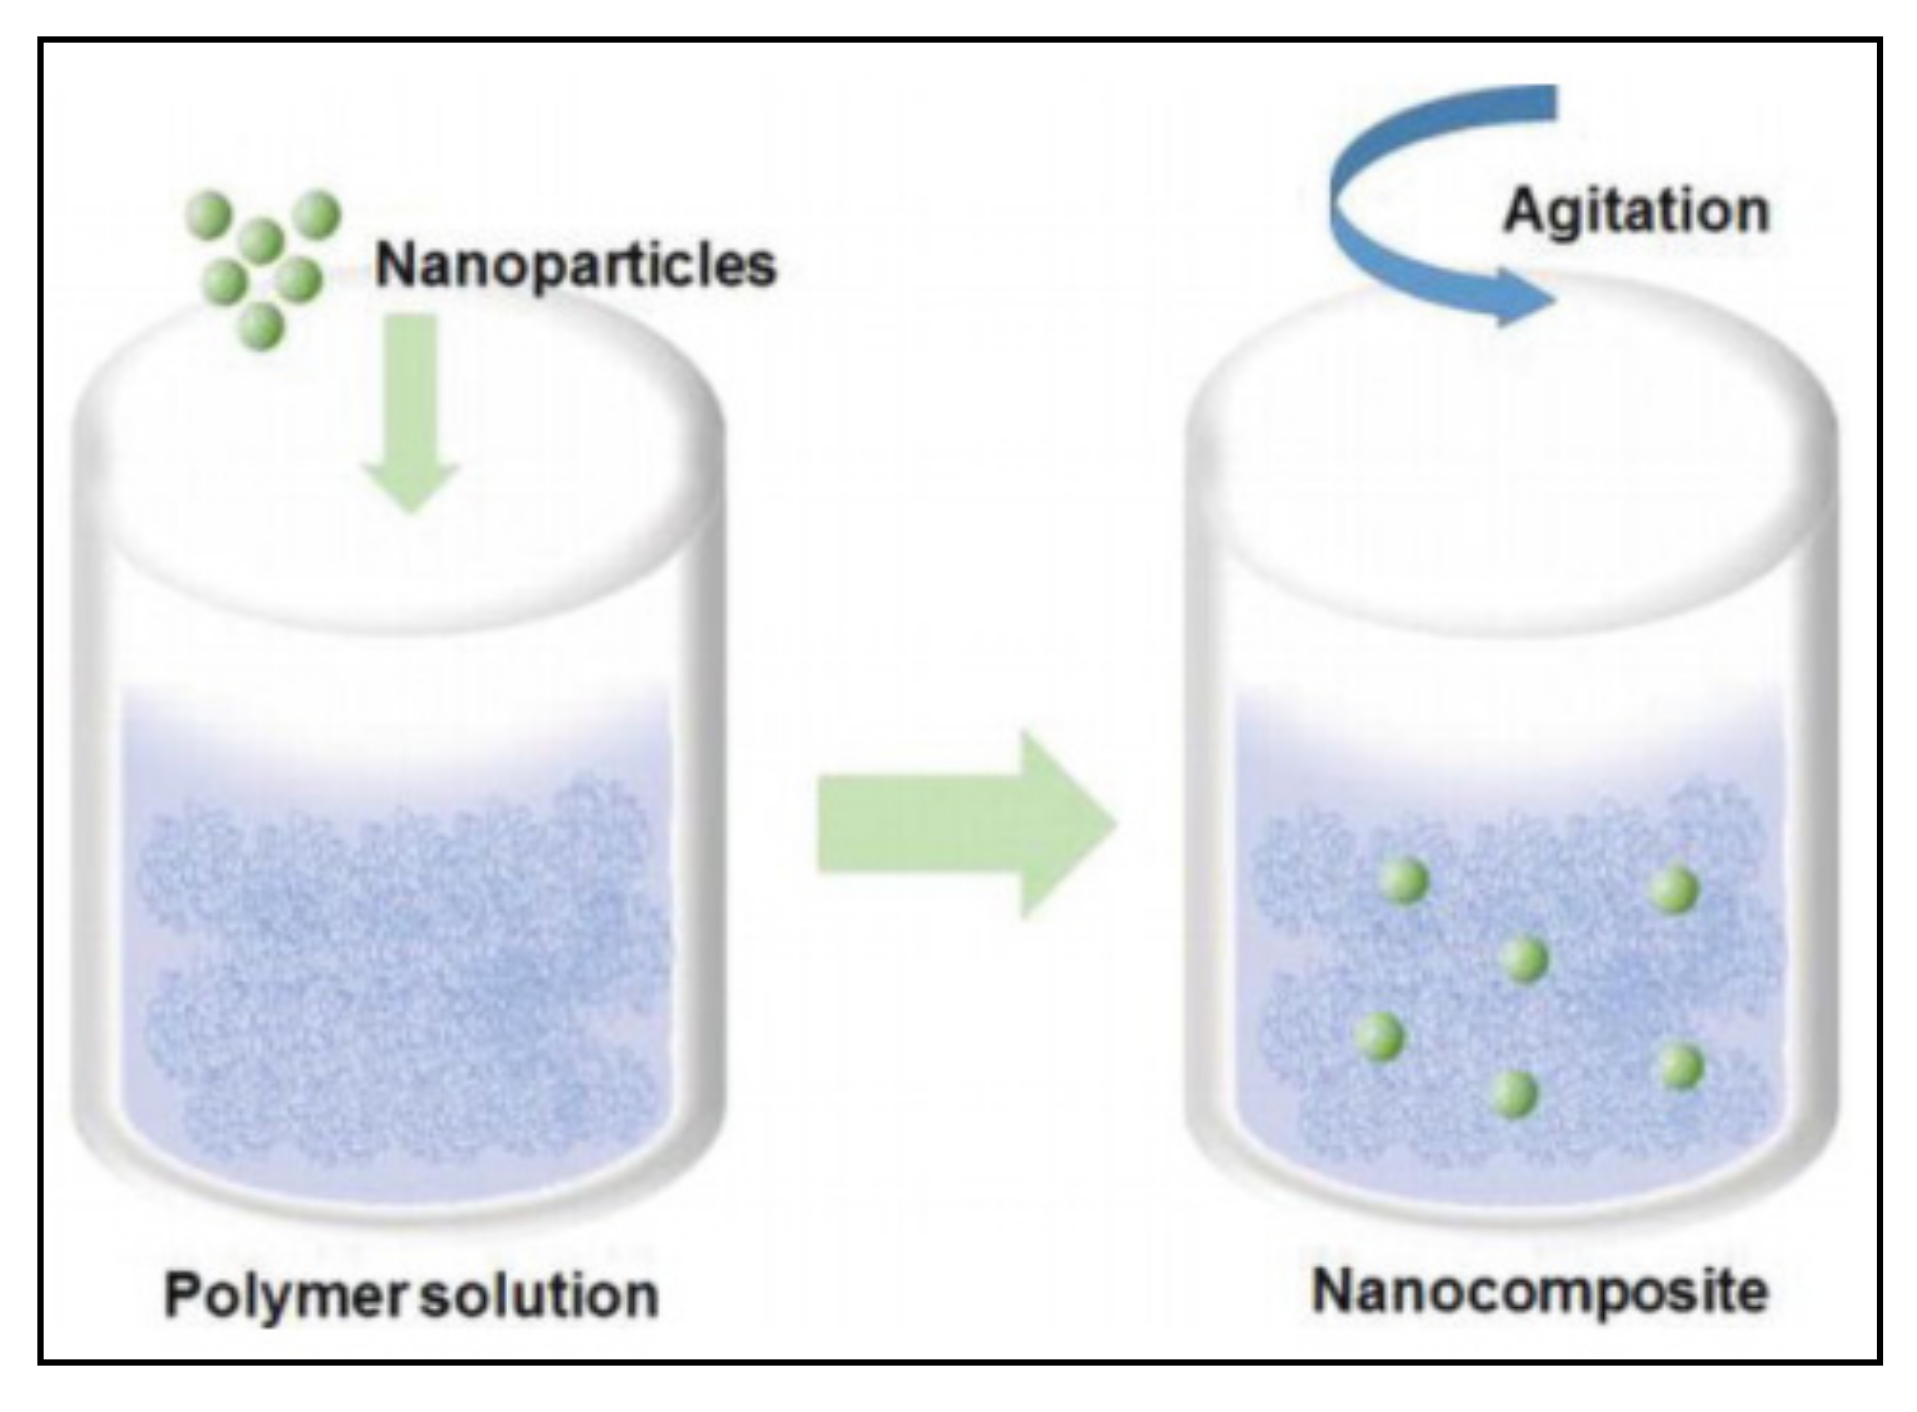
3.3.1. Solvent Processing

Solvent processing is the easiest method used to synthesize composites, using fewer toxic solvents, such as chloroform, acetone, alcohol, water, etc. In this method, nanoparticles are agitated through mechanical stirring or ultrasonication in a solvent to obtain the uniform dispersion, as shown in Figure 5. Followed by the agitation process, the solvent is evaporated and cast in the mould. Care must be taken to eliminate the solvent completely after mixing with polymer. The removal of organic solvents after the sonication process has adverse environmental effects, and necessary measures should be taken when carried out at large scale. Thermoset- and thermoplastic-based polymers, such as PMMA [55], polyvinyl alcohol [56], polyhydroxyaminoether [57], epoxy [58,59], polystyrene [60], nylon, polypropylene, polyurethane [61], etc., are used in the composite preparation process.
J. R Pothnis et al. [2] synthesized CNSs and epoxy nanocomposites using the solvent-processing method, as shown in Figure 6. In this process, CNSs particles are heated in an oven to remove the moisture contents. The measured quantity of nanoparticles is mixed with an acetone solution, and the resulting solution is sonicated to remove the agglomerations. Further, a known quantity of epoxy (LY5052) is added to the obtained mixture and is sonicated to obtain good dispersion of nanoparticles in the polymer matrix. Solvents are removed by constant heating, stirring, and degassing the mixture under vacuum conditions. Triethylene tetramine (TETA) hardener is added to the mixture, followed by degassing the mixture. Finally, the composite matrix is poured into an aluminium mould to produce the samples. The obtained samples are subjected to characterization after undergoing the curing process.

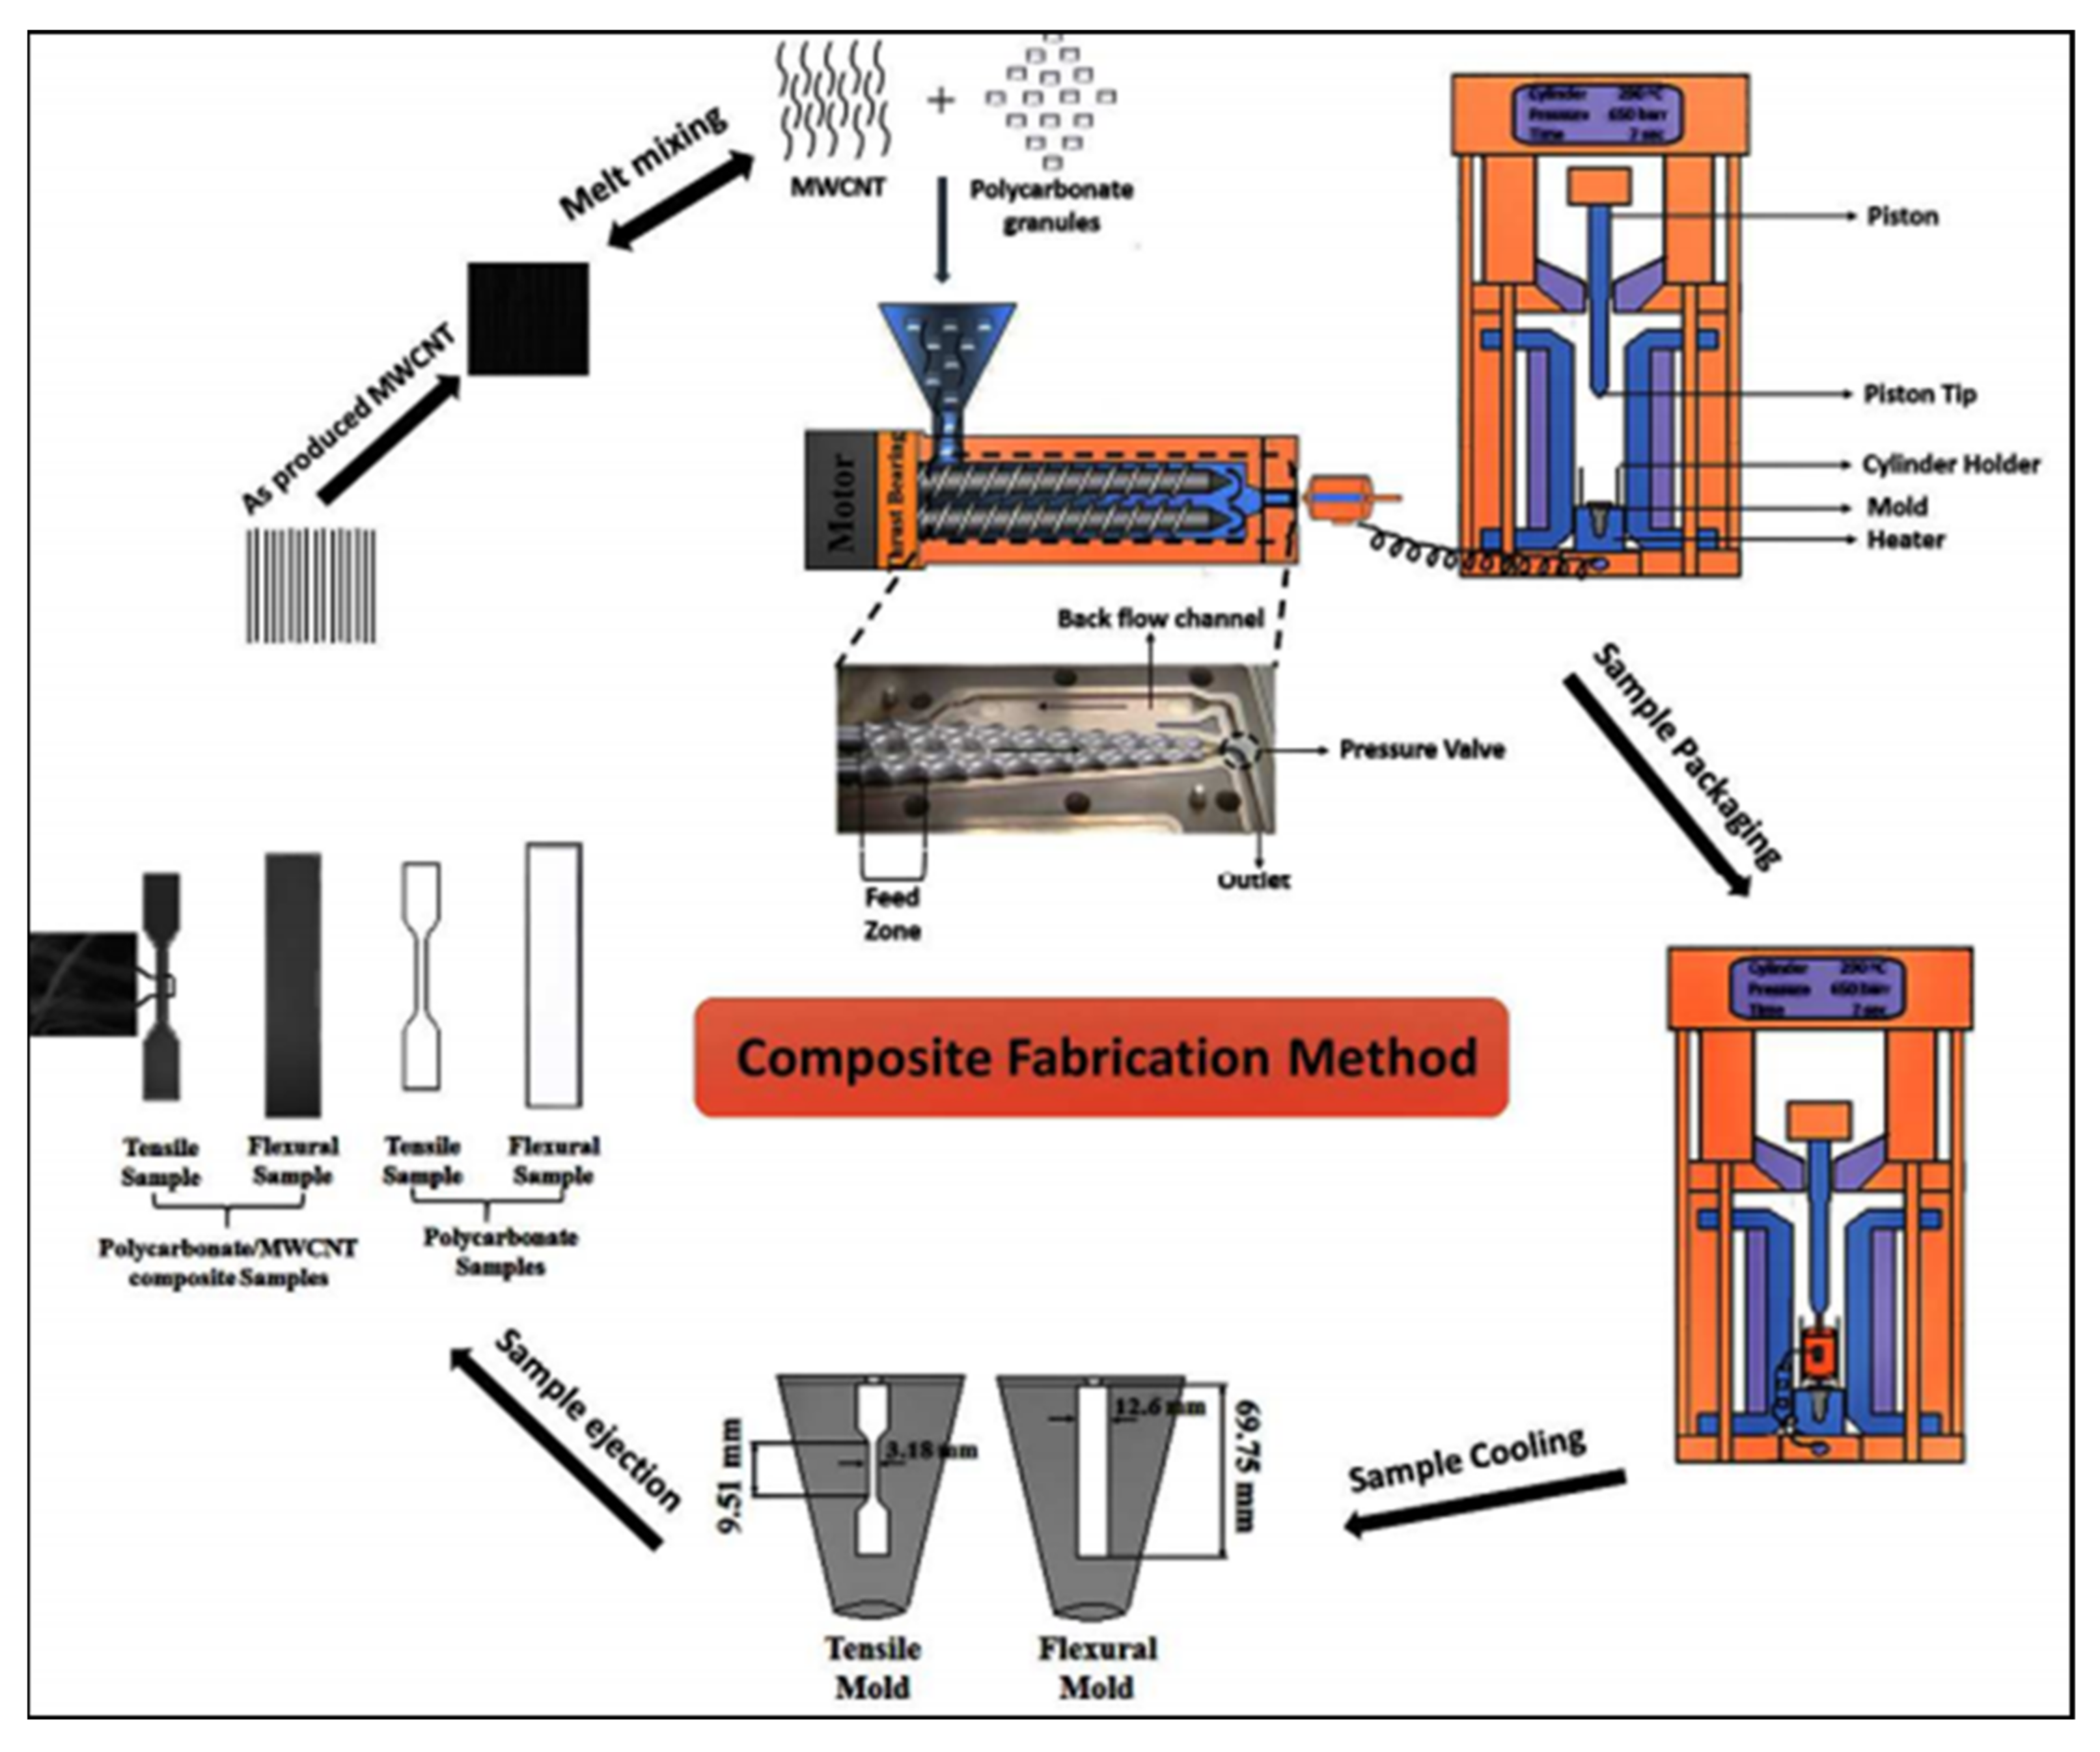
3.3.2. Melt Extrusion

Melt extrusion is an economical and environmentally friendly method that has an advantage compared to other methods since no solvent is required. The apparatus required for melt processing is the same as neat polymer processing equipment without nanomaterials. The composite material is obtained generally by a single-/twin-screw extruder, where the polymer and nanoparticles are heated to the glass transition temperature to form melt. The mixing chamber helps impart shear and elongation stress to the process, and hence, aids in breaking the filler aggregates and the formation of a uniform mixture. The polymer nanocomposite is further processed using injection moulding, profile extrusion, blow moulding, etc. The extrusion process improves the mechanical properties of composite materials [62,63].
Several polymers, such as LDPE, HDPE, PP, PS, PMMA, polyamide, polyester, and polycarbonate, are used in composite preparation using the melt extrusion process [64,65]. The nanoparticles can be easily formed in this melt processing compared to other methods. The major drawback is the formation of agglomerations, which requires precautionary measures. The operating temperatures in accordance with the polymer degradation temperature and the time required to disperse nanoparticles in polymer matrix should be selected properly [66].
Arun Baba et al. synthesized high-performance MWCNT-reinforced polycarbonate using a microtwin-screw extruder with backflow channel [67]. The polymer and filler components are mixed over a preferred time. The temperature of the compounder is 2500 °C, and proper dispersion is achieved by passing the material through a co-rotating screw bypass pathway. The rotation speed of the screw is kept at 100 rpm. The melted mixture is transferred to an injection moulding machine, through a die, followed by extrusion, and is injected into a mould by applying pressure through a cylindrical piston. The residence time of the mixture in the extruder can be increased with a backflow channel. which increases the uniform dispersion. The processing steps are depicted in Figure 7.
The tensile test provides the response of materials for applied tensile force. Some of the important properties of PNCs, such as tensile strength, Young’s modulus, and percentage of elongation, can be determined with tensile tests. Ultimate tensile strength (UTS), often called tensile strength, is the maximum stress that a specimen can withstand during the test. The highest point of the stress–strain curve drawn by a tensile test indicates the UTS. The PNC’s stiffness is evaluated with Young’s modulus or modulus of elasticity; this describes how a material can be easily bent or stretched. The ductility is measured with percentage of elongation by comparing the final length of the material to the original length.

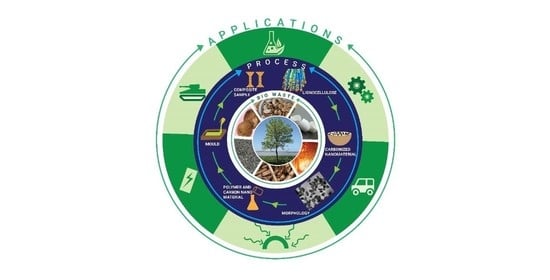
4. CNM-Reinforced Composites from Various Biowastes

Polymer nanocomposites derived from various biowaste materials, such as coconut shell, wood apple shell, egg shell, bamboo biochar, rice husk, sugarcane bagasse, groundnut shell, and oil palm, are discussed. The mechanical properties of PNCs reported by various research groups are consolidated.

4.1. Coconut Shell

4.1.1. Importance of Coconut Shell-Derived Nanoparticles

Coconut is an important food crop produced worldwide and is a palm family member. Predominantly, the Philippines, Indonesia, India, Sri Lanka, and Brazil are the top five coconut-producing countries [68]. Coconut shell (CS) is a non-edible part of a coconut, which is hard, lignocellulosic agrowaste. Annually, 90% of CS is underutilized and burnt in open air or disposed in waste ponds, thereby resulting in significant emissions of CO2 and methane [69]. Figure 8a gives us the chemical composition of CS.
Coconut shell powder, coconut shell charcoal, and coconut shell-activated carbon are the major products of CS. The total elemental carbon content of coconut shell is 49.86% after carbonization. The carbon material can be extracted by heating the shell in an inert atmosphere at a high temperature to burn off the volatile materials [70]. The chemical composition and formation of coconut shell biomass is shown in Figure 8a and Figure 8b respectively.
Carbon from CS has potential properties, such as its biodegradability, low density, high specific strength-to-weight ratio, environmentally friendliness, and low cost [71]. It also contains hydroxyl groups forming strong interfacial bonding with polymer matrices. Hence, these carbon materials are extensively used as an alternative filler for synthetic polymers in recent polymer technology.
Chibu O. Umerah et al. developed biodegradable plastic biowaste CS for 3D printing applications, indicating the reduced usage of non-biodegradable polymers [72]. The synthesis process of polymer reinforced with carbon nanoparticles derived from biowaste CS and the mechanical properties are discussed below.

4.1.2. Synthesis of Carbon Nanoparticles from Coconut Shell Powder

Figure 9 shows the synthesis process of carbon nanoparticles derived from biowaste CS using the pyrolysis method. To reduce the particle size, a ball-milling process is carried out for a duration of 10 h. Characterization studies of carbon nanoparticles before and after ball milling is carried out, and the samples are named CCSP and CCSP10, respectively.

4.1.3. Characterization of Carbon Nanoparticles Obtained from CS Powder

X-ray diffraction (XRD) studies of CCSP and CCSP10 are shown in Figure 10a. The carbon nanoparticles before the ball-milling process are amorphous in nature and exhibited weak peaks corresponding to (002) and (101) graphite planes of carbon nanoparticles. However, the ball-milling process resulted in a slight improvement of crystallinity, as well as a peak broadening of nanoparticles. Peak broadening confirms the reduction of particle size.
The presence of carbon and the degree of graphitization is confirmed from Raman studies and is shown in Figure 10b. The two disordered peaks in the D-band and G-band are due to the presence of polyaromatic hydrocarbons and graphitic carbon. The slight shift in the G-band for sample CCSP10 is due to strain induced in the particles after the ball-milling process, hence causing damage to the graphitic structure. Structural studies also show the presence of graphene oxide and hence, improvement in polymer electrical conduction.
SEM and TEM characterization were reported to analyse the microstructure of carbon nanoparticles, as shown in Figure 11. The carbon nanoparticles are irregular in shape and have a sheet-shaped structure before ball milling, as evident from Figure 11a. The ball-milling process shows a decreased particle size and evenly distributed structure, as shown in Figure 11b. The size of nanoparticles observed is in the range of 43 to 87 nm, and it is also confirmed from TEM analysis, as shown in Figure 11d.

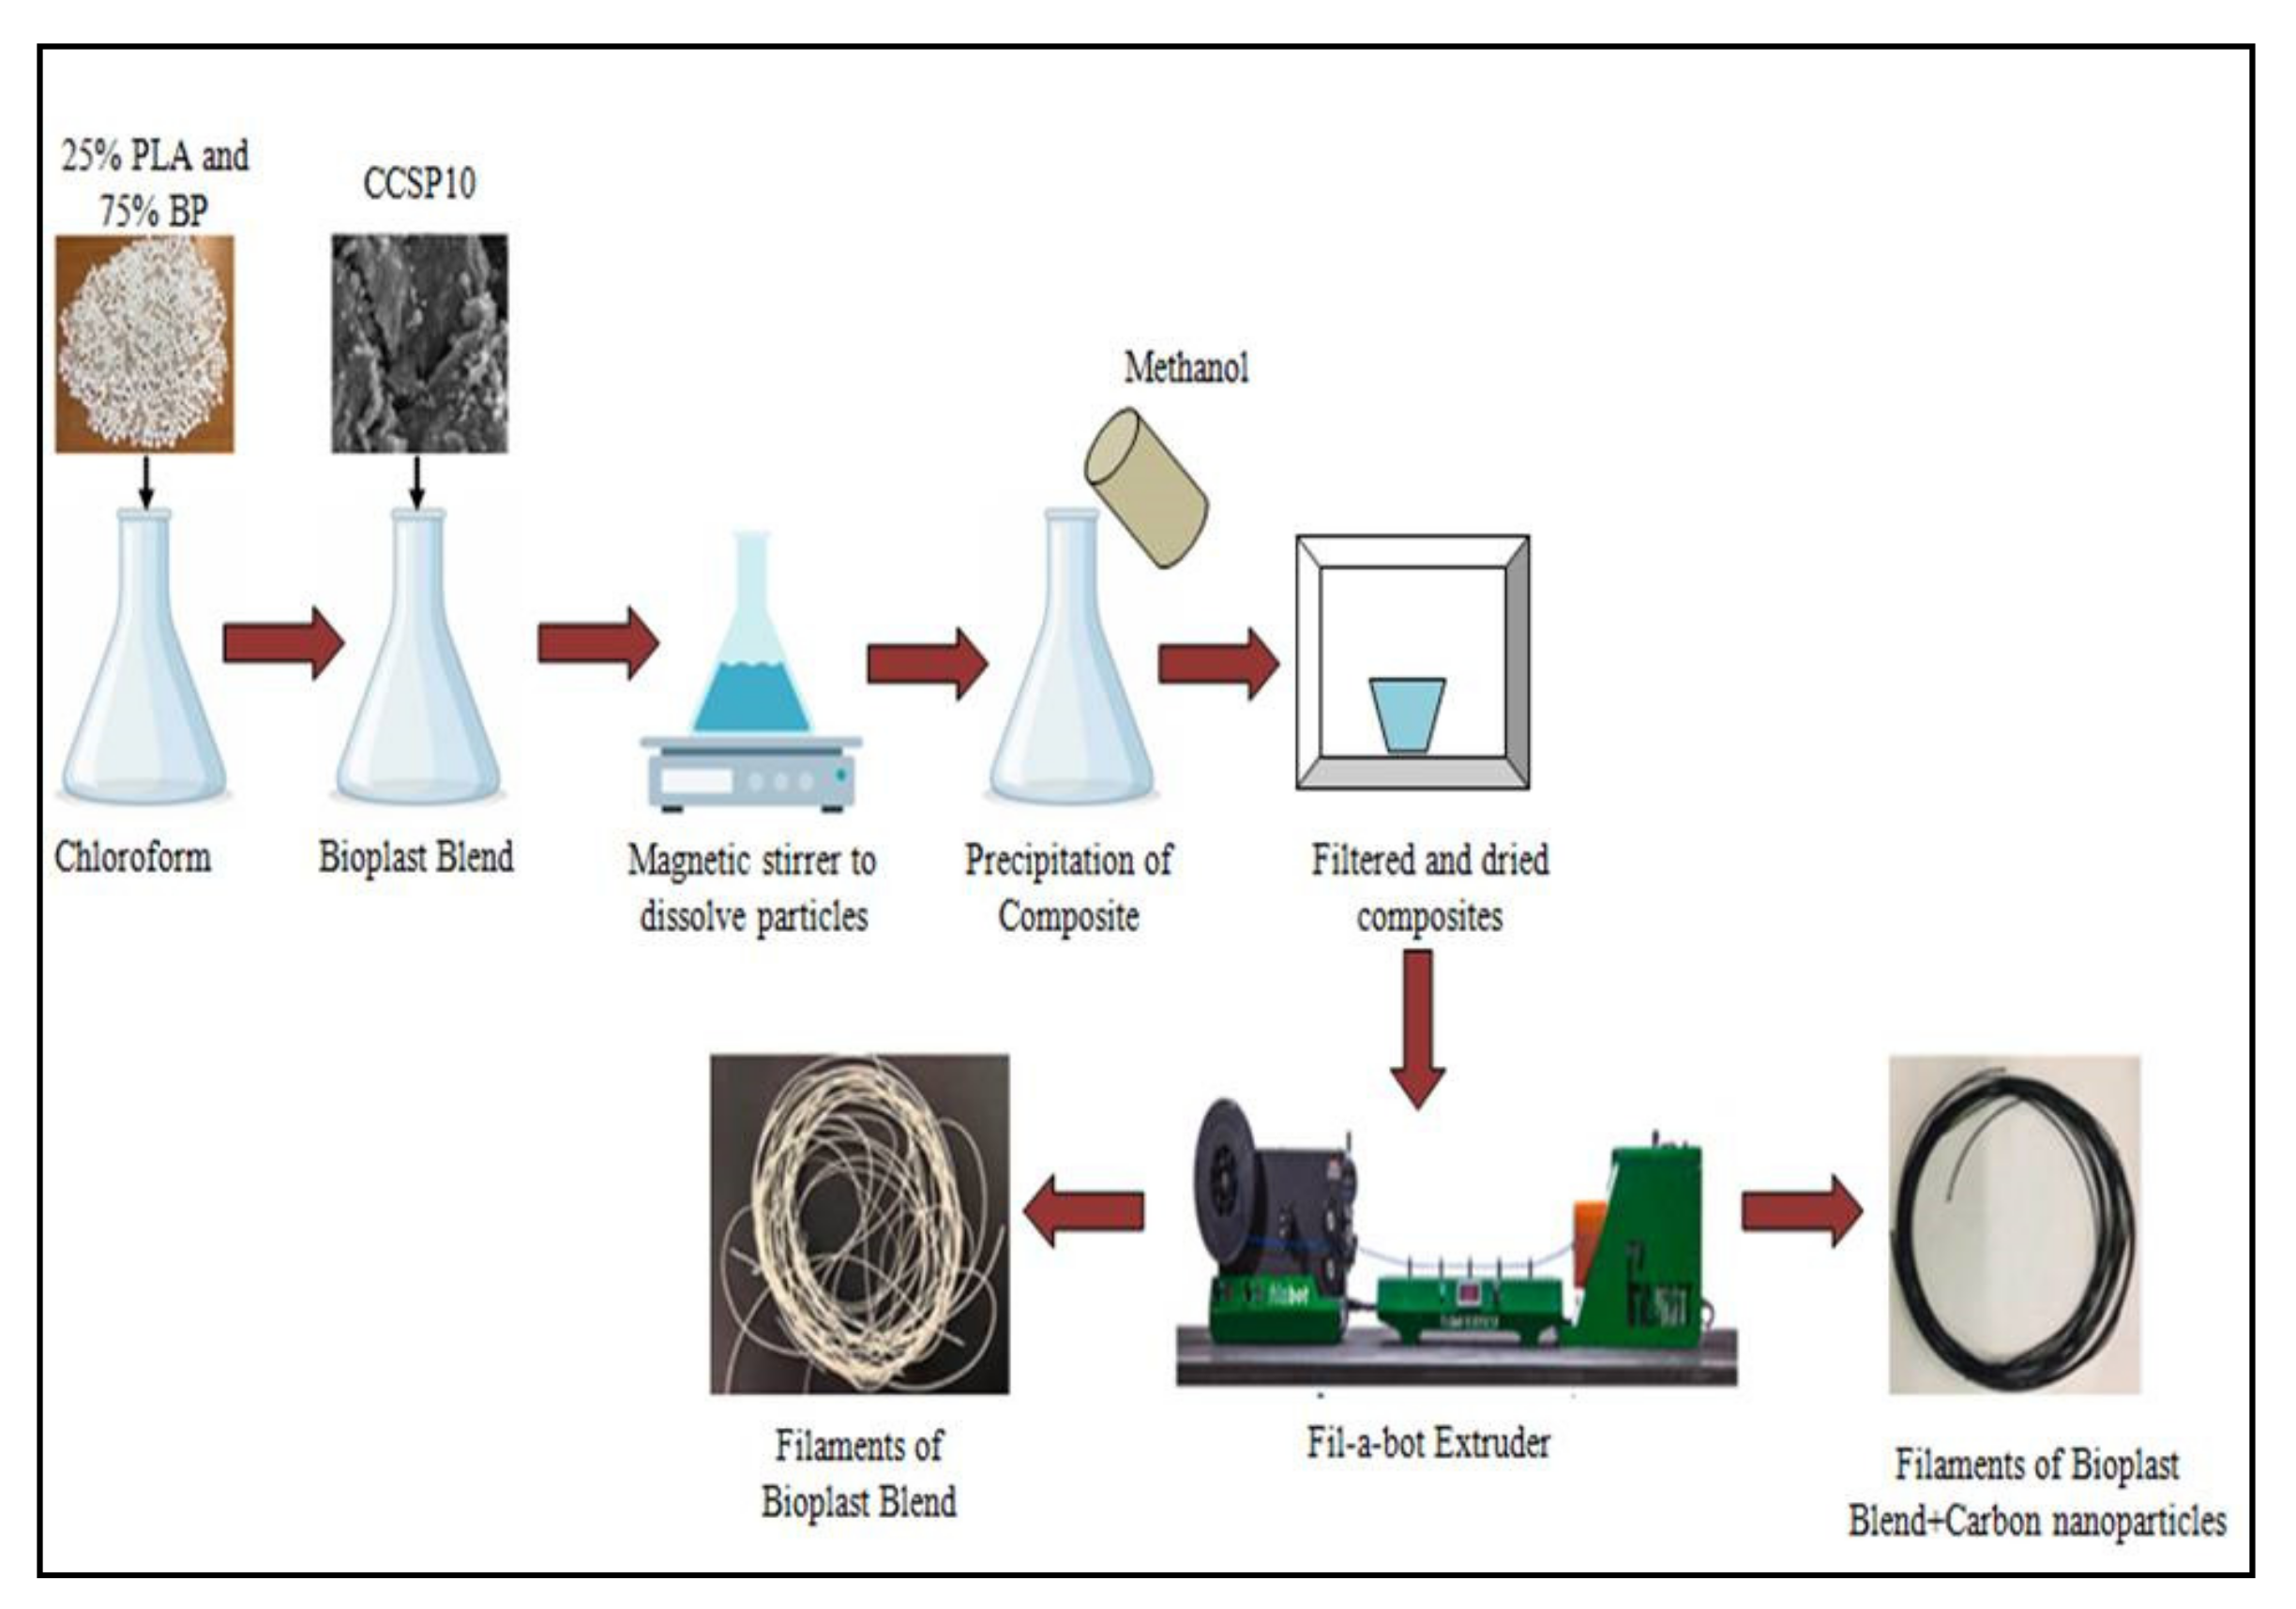
4.1.4. Synthesis of Carbon–Polymer Nanocomposites

From the above characterization studies, it is clear that ball-milled carbon nanoparticles (CCSP10) exhibit better properties and hence, are favourably considered for composites. The obtained CCSP10 is reinforced with 25% of polylactic acid (PLA biopolymer 3051D) and 75% of bioplast (BP GF 106/02). CCSP10 samples are loaded with 0.2 wt%, 0.6 wt%, and 1 wt% into a polymer solution. Figure 12 gives the graphical representation of the synthesis process of this nanocomposite. The filaments of neat bioplast (BP), bioplast blended with PLA (BPB), and nanocomposite materials (BPB + CCSP10) with 0.2 wt%, 0.6 wt%, and 1 wt% loading are extracted using a EX2 Filabot extruder for characterization.

4.1.5. Characterization of Nanocomposites

Thermogravimetric analysis (TGA) and differential scanning calorimetry (DSC) are carried out to record the temperature, mass, heat flow, and thermal characteristics of composites by heating samples under an inert atmosphere. The TGA shown in Figure 13a conveys that the blended composites are more thermally stable compared to neat BP. The BPB–CCSP composite materials yield higher residues due to higher thermal stability when compared to neat BP and BPB systems. The DSC analysis shows that the melting temperature (Tm) and glass transition temperature (Tg) of BPB significantly improves when compared to neat BP. The BPB–CCSP composites did not show any significant change in Tm and Tg compared to BPB; however, composites showed enhanced Tm and Tg compared to neat BP.
A tensile test is carried out to analyse the mechanical properties of the extruded composite material, and the same is shown in Figure 13b. Initially all systems show toe region due to an adjustment of the filament in the grips of test equipment. The tensile strength and modulus are enhanced for BPB–CCSP compared to BPB and BP. The tensile strength and modulus for the 0.6 wt% BP–CCSP composite shows the highest improvement of 80% and 5%, respectively, when compared to neat BP. The bio-based content in bioplast prohibits the cross linking of the particles of the polymer chain; hence, BPB–CCSP at 0.6 wt% shows reduced strain at Fmax. With the increase in wt% loading of CCSP, the mechanical properties decline due to agglomerations of nanoparticles.
The electrical conductivity test for different wt% loading revealed poor conductivity, as shown in Figure 13c. However, loading helps in a small increase of conductivity. From the above studies, it is observed that BPB–CCSP (0.6 wt% loading) exhibits better thermal and mechanical properties.
Extensive research work was carried out on coconut shell composites, synthesis, and characterization. Table 3 reports the synthesis of other composite materials by the hand lay-off method and measured mechanical properties.

4.2. Wood Apple Shell

4.2.1. Importance of Wood Apple Shell-Derived Nanoparticles

Wood apple trees are abundantly available native medicinal trees of India. The wood apple fruit consists of brown pulp and small white seeds covered by a hard wooden shell [81]. It is grown in Southeast Asian countries, such as India, Sri Lanka, Pakistan, Bangladesh, Burma, and Thailand. Wood apple shell (WAS) has no economic value, and shell disposal is not only costly, but also causes environmental hazards. WAS is a very hard material consisting of excess lignin and cellulose. Figure 14a gives the chemical composition of WAS [82,83].
The inexpensive WAS is used as precursor to generate activated charcoal. The shell particulates are used as an absorbent to remove iron from wastewater [84]. The carbon synthesized from WAS is also used for removal of Congo red dye from aqueous solutions [85]. Figure 18b shows the graphical representation of WAS biomass. WAS consists of high carbon, possessing strong mechanical strength and thermal stability. Hence, it can be used as an ideal filler to synthesize polymer composites.
Shakuntala Ojha et al. [86] synthesized carbon black from WAS and prepared epoxy–nanoparticles composites. The composite materials are characterized to analyse the mechanical properties of composite material. The synthesis process and characterization is discussed below.

4.2.2. Synthesis of Carbon Black from Wood Apple Shell Powder

The sequential synthesis process of carbon nanoparticle formation derived from WAS is depicted in Figure 15. The pyrolysis of WAS powder results in the formation of nanoparticles.

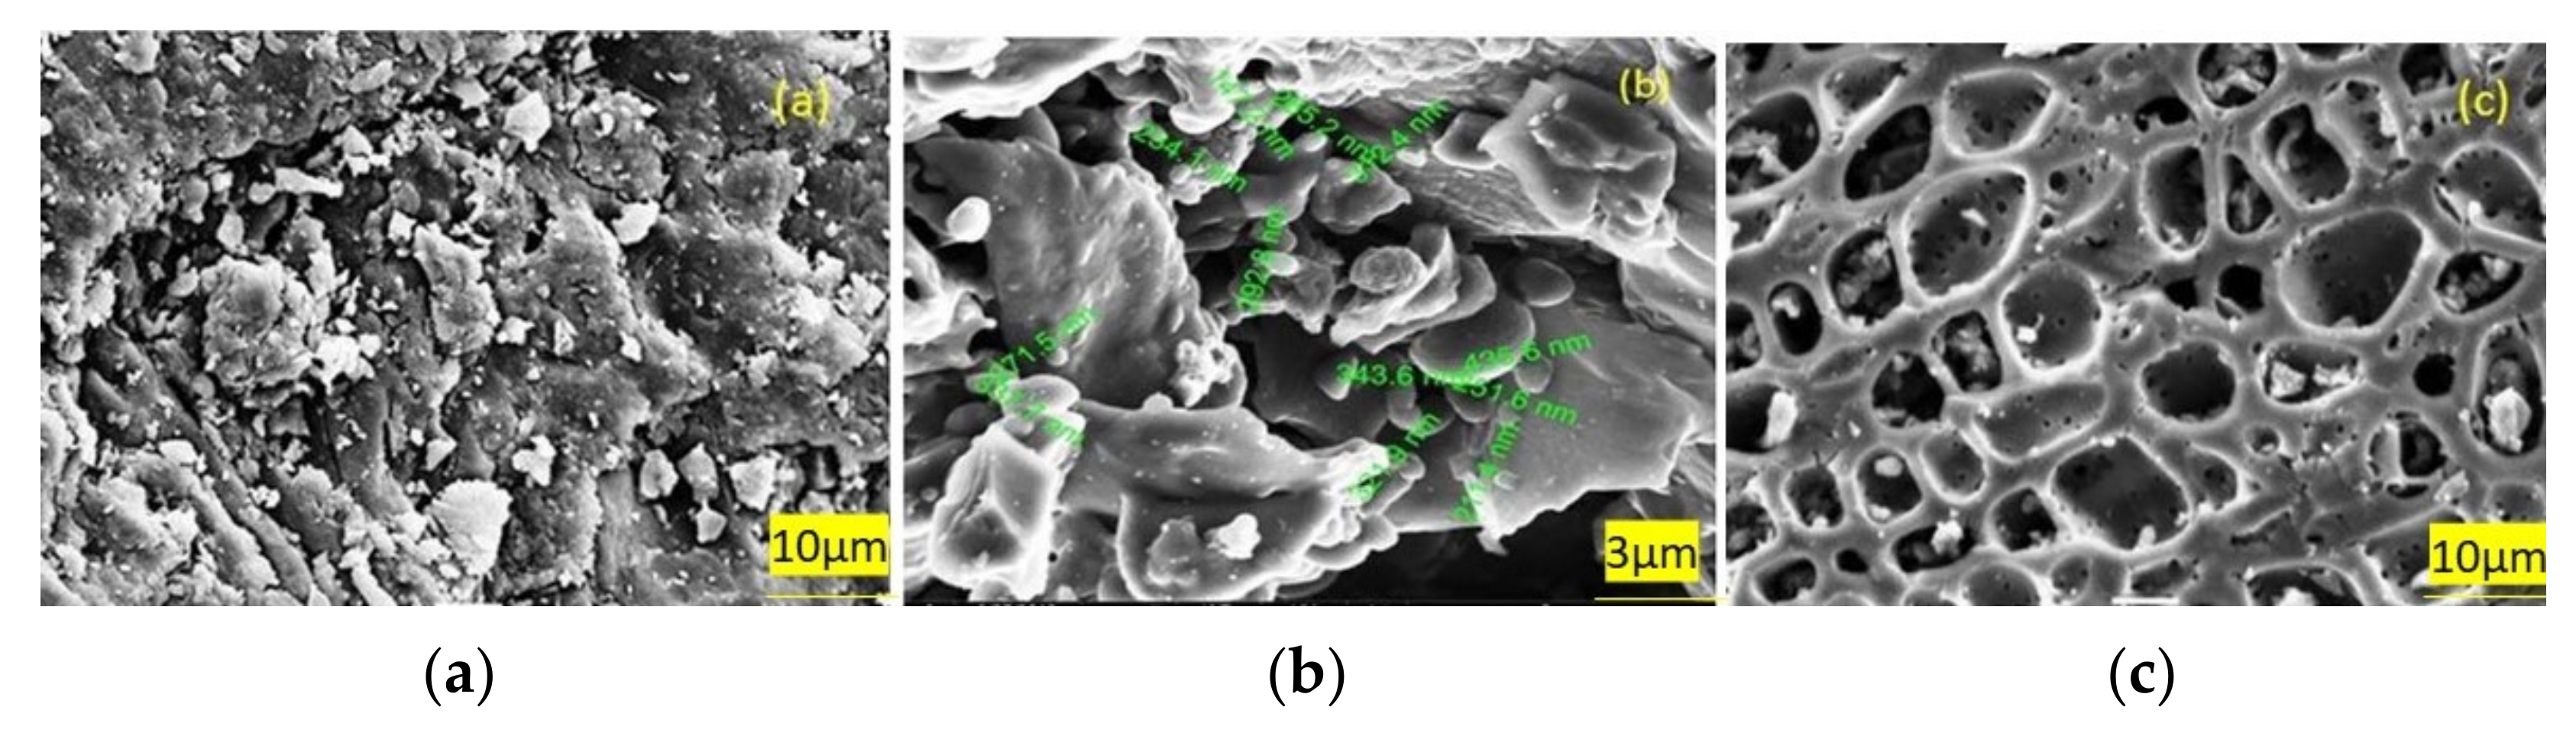
4.2.3. Characterization of Carbon Black Obtained from Wood Apple Shell

Proximate analysis is carried out to measure the percentage of carbon present in raw WAS powder and WAS powder subjected to carbonization temperature. The highest percentage of carbon is obtained when WAS powder undergoes pyrolysis treatment at 800 °C, as shown in Figure 16.
The morphology of WAS powder and carbon nanoparticles of WAS is shown in Figure 17. The surface of raw WAS powder is free from pores, whereas the WAS nanoparticles show a hollow structure with an increase in carbonization temperature.

4.2.4. Synthesis of Carbon–Polymer Nanocomposites

The carbon–polymer nanocomposite is prepared using the hand lay-up method. The obtained raw WAS powder and carbonized nanoparticles are reinforced with LY556 epoxy resin and HY951 hardener, resulting in the formation of nanocomposite. Figure 18 shows the synthesis process of CB–epoxy composites. Comparative studies of neat epoxy and filler loading wt% of 5, 10, 15, and 20 were reported.

4.2.5. Characterization of Nanocomposites

A microhardness test is carried out to ascertain the effect of filler concentration and carbonization temperature on hardness of the composite material. As shown in Table 4, the rigidness improved with an increase in filler loading, as well as pyrolysis temperature. The best hardness value is observed in 10 wt% carbon black loading in raw filler composites, and the maximum hardness is observed in 20 wt% filler at 800 °C. The hardness increases in all the composites because of the rise in carbonization temperature.
Ultimate tensile strength of the composite with 15% raw WAS particulates shows higher strength and can be enhanced further by increasing the carbon black content. Due to density variation in fillers, the maximum strength is obtained for 10 wt% loading. The optimum tensile strength obtained is 58.91 MPa for 10 wt% carbon black-filled composites (800 °C). With an increase in filler loading, the tensile strength is reduced due to weak interfacial interaction between the carbon black and polymer particles. The ultimate tensile strength is shown in Figure 19a. The highest Young’s modulus of 2.56 GPa is obtained for 10 wt% filler loading at 800 °C, as shown in Figure 19b. The highest flexural strength is obtained for 10 wt% filler loading at 800 °C, as shown in Figure 19c. The highest flexural modulus is obtained as 2.75 GPa for 15 wt% filler loading at 800 °C, as shown in Figure 19d.
From the above studies, it can be concluded that wt% loading and carbonization temperature play a significant role in enhancing the mechanical properties of nanocomposites. Table 5 reports the synthesis of other composite materials by the hand lay-off method and measured mechanical properties.

4.3. Bamboo

4.3.1. Importance of Bamboo Biochar-Derived Nanoparticles

Bamboo is the fastest-growing plant on Earth, belonging to the grass family, which can grow up to a height of 30 m. It is a huge biomass and sustainable resource that can grow in extreme climatic conditions. There are roughly 1000 species of bamboo found worldwide [90,91]. China, Indonesia, Vietnam, USA, Singapore, Brazil, Myanmar, and Thailand are large producers of bamboo. Annually about 40,000 tons of bamboo is produced worldwide, and the production is increasing gradually [92]. Cellulose, hemicellulose, and lignin are major chemical constituents of bamboo, which is shown in Figure 20a [93,94].
Bamboo has a wide variety of applications in household goods, flooring, fabrics, antibacterial and absorbent surgical tools, and composite reinforcement. Figure 20b shows the bamboo plant and pole’s attractive features, such as eco-friendliness, light weight, high specific strength, and non-hazardous nature, which researchers put to work in composite technology.
Bamboo charcoals (BC) are novel carbon-based particles that are not extensively used in composite polymers. BC particles are generally synthesized by carbonizing bamboo at high temperature. This results in porous micro-/nanoparticles, and the composites prepared from such carbon particles improve the mechanical properties of polymers [95]. Mohanad Mousa and Yu Dong investigated the effect of particle size of BC reinforced with polyvinyl alcohol (PVA) and reported the mechanical properties of the composite material [96].

4.3.2. Synthesis of Carbon Nanoparticles from Bamboo Biomass

Biochar is obtained by carbonizing ground and sieved pieces of bamboo poles. The carbonization is carried out in a nitrogen atmosphere at high temperature in the range of 1000–1500 °C. In this work, microdiameter bamboo charcoals (MBC) and nanodiameter particles (NBC) are purchased from nanomaterial industries.

4.3.3. Characterization of BC Particles Obtained from Bamboo Biomass

Figure 21 shows the distribution of particles on a steel substrate from an aqueous dispersion. AFM studies show that the average particle diameter of MBCs and NBCs are 406.8 nm and 69.43 nm, respectively. Uniform dispersion and disk, such as smaller particles, are formed for NBC particles.
FTIR spectra of MBCs and NBCs demonstrate the surface functionality and are shown in Figure 22a. The transmittance peaks at different wavelengths indicate C≡H stretching, C=C vibration in an aromatic system, C=O band for ionisable carboxyl groups, C-H bending (in plane and out of plane), and -OH peaks, which indicate lower moisture and alcohol contents. Figure 22b,c shows FTIR images of PVA–BC composites. As loading wt% increases, the band peaks shift to a lower wave number, which corresponds to large quantities of hydroxyl groups in PVA molecules. Strong adhesion of BC particles to PVA molecules results in the formation of hydrogen bonds. New bands detected in the range of 2800 cm1−3300 cm−1 for the 3–5% NBC composite shows stronger interfacial areas due to relatively high surface areas of NBCs.

4.3.4. Synthesis of Carbon–Polymer Nanocomposite Films

The solution-casting method is used to prepare the nanocomposite where polyvinyl alcohol (PVA) is used as the polymer. Ten grams of PVA is dissolved in 190 mL deionized water and stirred using a magnetic stirrer to dissolve completely. The obtained MBC particles are subjected to mechanical mixing followed by ultrasonication. The prepared solution is cast on a glass petri dish and allowed to dry in an air-circulated oven for about 40 h. Different nanocomposites are prepared with 0, 3, 5, and 10 wt% loading of MBC particles. Similarly, PVA–NBC composites are also prepared with different wt% loading, and comparative studies were reported.

4.3.5. Characterization of Nanocomposites

Table 6 gives us the mechanical properties of PVA and PVA–BC composites. The tensile moduli of NBC and MBC composites increases significantly by increasing the wt% loading. The maximum tensile moduli is observed at 10 wt% loading of BC particles, which is 123% and 100% more than neat PVA for NBC and MBC composites, respectively.
Tensile strength of PVA–NBC and PVA–MBC composite material showed enhancement up to 110% and 72%, respectively, with an increase in loading BC particles from 0 to 3 wt%. Further increases in loading show a reduction in tensile strength. The reduction in tensile strength is because of agglomerations due to weak Van der Waals interactions. However, the tensile strength at higher loading (>3 wt%) is more compared to neat PVA. It is observed that PVA–NBC composites are superior in tensile strength, as well as moduli properties, than PVA–MBC composites. The effective load transfer from filler to matrices is due to more uniform particle dispersion, smaller particle size, and large surface area.
Elongation at break and tensile toughness of the PVA–MBC and PVA–NBC composite decreases as particle loading increases from 0 to 10 wt% when compared to neat PVA. The elongation at break shows a greater decreasing trend in the PVA–MBC composite than the PVA–NBC. The decreasing pattern is not significant in tensile toughness, as shown in Figure 23.
The elastic moduli of PVA–BC composites is predicted by the Halpin–Tsai model and a combination of the Mori–Tanaka model and laminate theory in this work. The analysis shows well-aligned and randomly oriented states in the best modulation estimates. Several researchers synthesized the polymer composite by reinforcing micro- and nanobiochar particles derived from bamboo biomass. The characterization of these composites shows improved mechanical properties, and some of these works are listed in Table 7.

4.4. Rice Husk

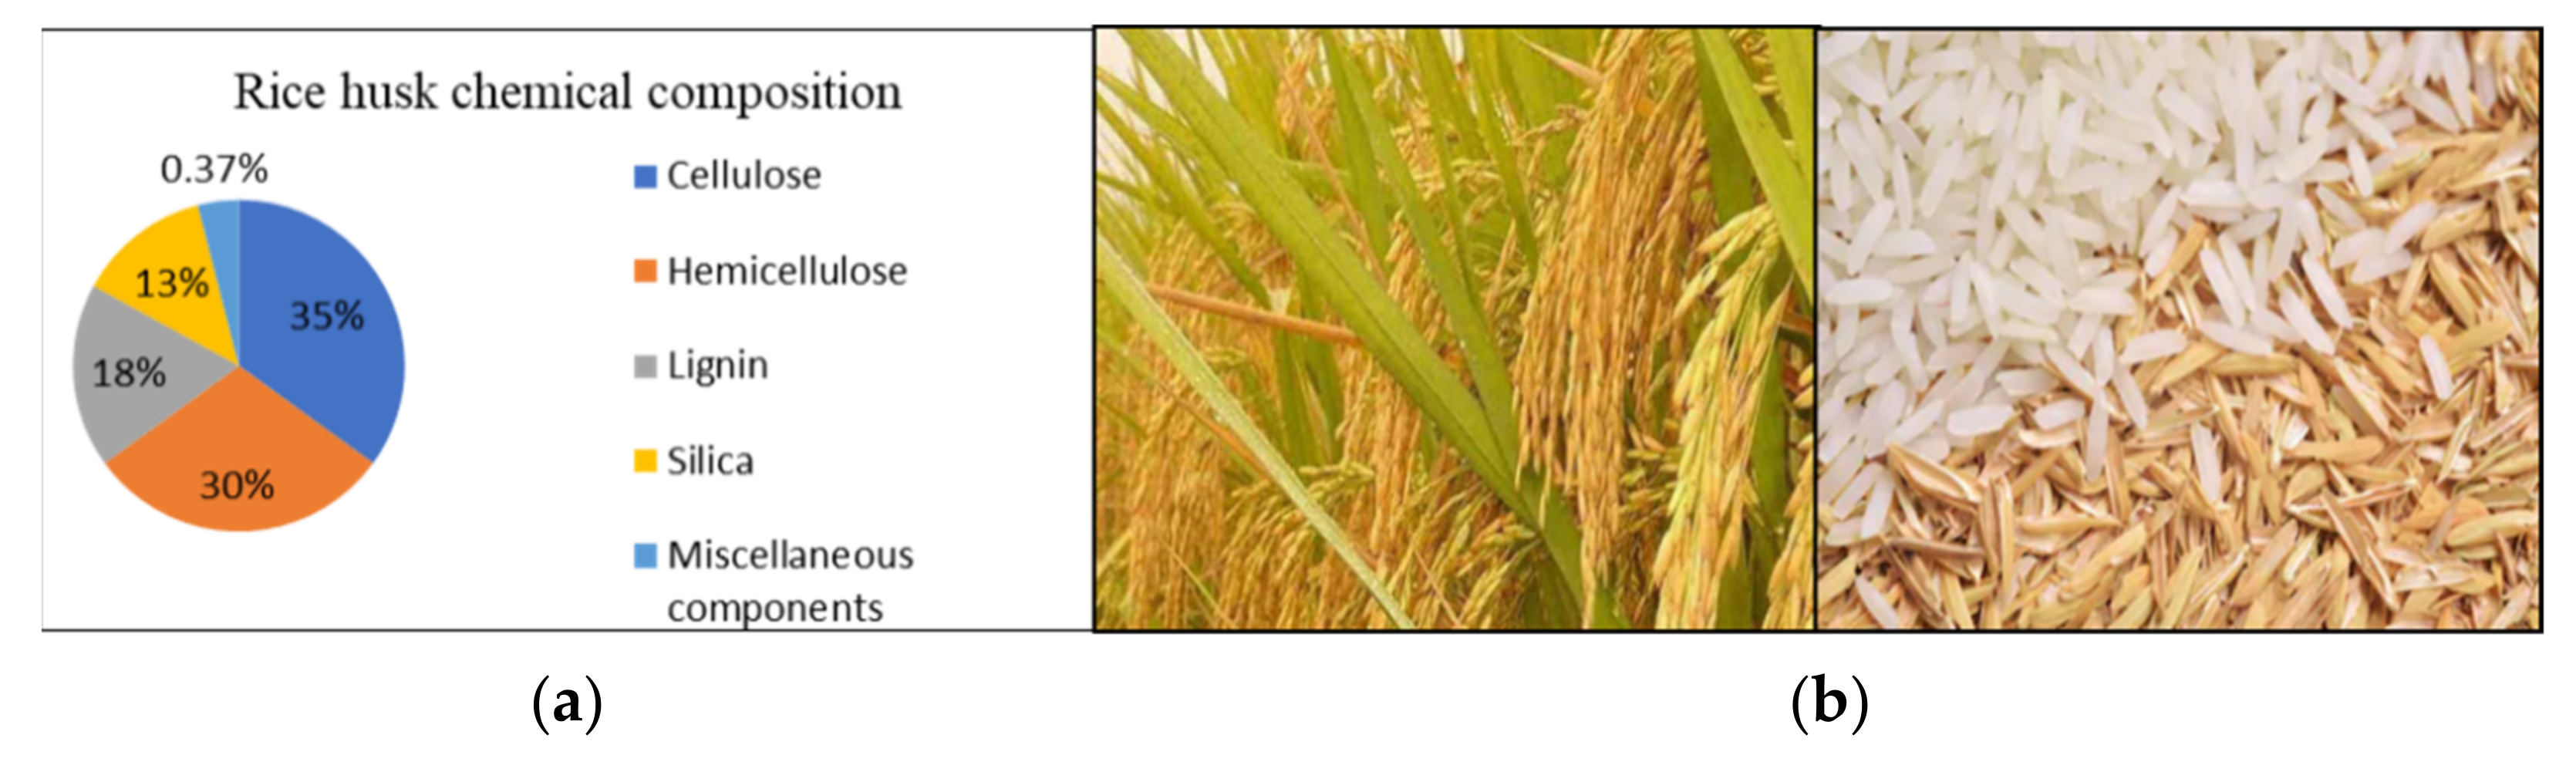
4.4.1. Importance of Rice Husk-Derived Nanoparticles

Rice is a major crop in the world that covers 1% of Earth’s surface. It is major source of food for billions of people across the world. Ninety percent of the total global rice production is from Asia [102,103]. World rice production in the year 2020 is estimated at 501.96 million metric tons. China, India, Bangladesh, Indonesia, Vietnam, and Thailand are the leading rice-producing countries in the world. Rice husk (RH) is the abundantly available protective covering of the rice kernel, which is separated from the rice grain during the milling process. The disposal of RH to the land causes environmental pollution, and burning rice husk in open air leads to the production of ash, fumes, and toxic gases, and hence, air pollution [104]. The major component of RH is lignocellulose and other chemical components, as shown in Figure 24a.
RH is basically an agrowaste, abundantly available, cheap, and rich in cellulose, hemicellulose, lignin, and silica, having low bulk density, toughness, and abrasiveness in nature [105,106]. Hence, RH is considered for a wide range of applications and is used in the preparation of combustible gases, absorbents, catalysts, activated carbon, and various chemical and silicon products. Figure 24b shows the rice plant and rice husk separated from the grains.
RH biochar is a carbon-rich, fine-grained charcoal produced from the pyrolysis of agrowaste at high temperature. RH biochar particles are used as filler for polymeric composites to study the effects on the physical, mechanical and thermal properties. S. Richard et. al. studied the particle size and particle-loading effect on RH-derived, biochar-reinforced polymer nanocomposites [107]. The characterization of biochar particles and composite matrices are discussed in following section.

4.4.2. Synthesis of Biochar from Rice Husk

The RH is thoroughly washed in distilled water and dried for few hours. The dried RH is pyrolyzed in a muffle furnace, and the obtained unevenly sized biochar powder is subjected to the ball-milling process to get variable-sized nanoparticles. Thus, biochar particles of average sizes of 510 nm, 430 nm, 230 nm, 140 nm, and 45 nm are obtained by ball milling the biochar from 6 h, 12 h, 18 h, 24 h and 30 h respectively. Figure 25a,b gives the nanoparticles derived from biowaste rice husk.

4.4.3. Characterization of Carbon Nanoparticles Obtained from RH Biochar

The morphological studies of RH biochar, which is ball milled for 30 h, is shown in Figure 26. The particle size is found to be close to 45 nm and spherical in structure.
The XRD pattern of RH biochar is shown in Figure 27a. XRD analysis shows the polyaromatic property of RH and turbostatic structural features of RH biochar. The crystallinity of RH is slightly poor. Spectroscopy analysis shown in Figure 27b confirms the presence of C-C, C-O, C=C, C=C, and C-H molecular bonds. These absorptions are due to the presence of carbohydrates in the RH.
The void fraction studies indicate the formation of voids and pores present in the composites. The void fraction of composites increases by increasing the filler loading from 0.5% to 2.5%. The void fraction in 45 nm biochar-filled nanocomposite is more than 510 nm filled biochar components. High void fractions cause adverse effects on the mechanical properties of composite material; hence, loading percentage is restricted to 2.5%.

4.4.4. Synthesis of Carbon–Polymer Nanocomposites

To fabricate the RH biochar–polymer composite, a resin-transfer moulding process is used with mould material made up of acrylic sheet. PVA is used as a mould-releasing agent, and a measured quantity of 510 nm biochar is mixed with a defined volume of unsaturated polyester resin mixed with 0.5% of cobalt napthalenate (accelerator) and 2% MEKP (hardener). The desiccated mixtures are poured to mould and left to cure at room temperature for about 24–26 h. The other composites with 430 nm, 230 nm, 140 nm, and 45 nm are prepared by similar procedure, and also the loading of fillers is varied by 0.5, 1, 1.5, 2, and 2.5 wt%. A neat resin sample is also prepared for comparative studies.

4.4.5. Characterization of Nanocomposites

The impact strength analysis of composite material is shown in Figure 28a. The impact strength of composites increases with the increase of the filler loading from 0 to 2.5 wt%. The impact strength is increased as the particle size of the biochar particles is reduced from 510 nm to 45 nm. This is also evident from the SEM images of fractured surfaces of neat polyester (smooth, glassy, and plainer) resin and biochar-reinforced composites (rough and course).
Tensile tests are performed to study the tensile properties of neat polyester and biochar-reinforced polyester composites. The tensile strength is reduced by introducing RH biochar fillers into polymer matrices and improved in 45 nm biochar particle-reinforced composites, as shown in Figure 28b. It was predicted that impeded interaction between the filler and polymer and the elastic property of polymer matrix are the reasons for decreased tensile strength. Hence, the composite materials are brittle compared to neat polyester. The dielectric constant increases with an increase in the filler concentration. This is due to an increase in total surface area of the filler and continuity of the composite structure.
It was recorded that the biochar derived from RH is used as precursor in many polymer composite synthesis processes and these fillers improve the mechanical properties of the composite material. The work carried out in this direction by other groups is listed in Table 8.

4.5. Sugarcane Bagasse

4.5.1. Importance of Sugarcane Bagasse Nanoparticles

Sugarcane bagasse (SCB) is residual fibrous matter obtained after crushing sugarcane and extracting its juice. It is an abundantly available agrowaste rich in carbon. Brazil is the world’s largest SCB-producing country; other SCB-producing countries are India, China, Thailand, Kenya, and Zimbabwe. Nearly 1.9 billion tons of sugarcane are processed to produce sugar, and 0.6 billion tons of SCB are produced worldwide every year [114,115]. SCB is basically used as combustible raw material to produce energy in sugar mill furnaces. Disposal in empty fields and incineration of SCB cause environmental pollution as it releases excess smoke. The chemical composition of SCB is shown in Figure 29a, and its properties make SCB fibre an excellent raw material for composite preparation [116].
Sugarcane and sugarcane bagasse are shown in Figure 29b. Sugarcane residues are used in many applications, such as preparation of cellulosic ethanol, paper, feedstock, biofuel, and alcohol [117,118,119].
SCB waste has special properties, such as abundance, low fabrication and chemical treatment cost, high quality, biodegradability, and recyclability. The cellulose content of bagasse fibres binds the polymer composites and transfers the load to fibre. The composites prepared in an appropriate way by reinforcing fillers, such as SCB ash, biochar, and carbon black derived from waste SCB, improves the mechanical properties [120]. Ferreira et al. synthesized polymer composites reinforced with carbon black derived from waste SCB [121]. The biochar from SCB is treated to reduce particle size, ash content, and surface polarity to produce potential carbon black. Hence, produced carbon black nanoparticles are used in polymer composite preparation. The synthesis process and characterization of composites is discussed in the sections below.

4.5.2. Synthesis of Carbon Black from Sugarcane Bagasse Waste

Sugarcane bagasse undergoes pyrolysis in an inert atmosphere, resulting in the formation of biochar. The obtained biochar is ball milled for about 72 h to reduce the particle size. The ball-milled particles undergo NaOH and HCL aqueous leaching and were named SBB-72h-ABL. The oxygenated functional groups generated during bubbling N2 are reduced by thermal annealing using isopropanol vapour. The annealed biochar was named rSBB-72h-ABL. Annealed samples at 900 °C only under N2 were also considered for comparison purpose and named SBB-72h-ABL(900).

4.5.3. Characterization of Carbon Black Produced from Sugarcane Bagasse

STEM images show the reduction in particle size of the biochar through the ball-milling process. The particle size reduces as the milling time increases from 6 h to 72 h. Figure 30 shows the particle size distribution of 72 h ball-milled biochar obtained from STEM images.
Ash and other inorganic components of treated SCB biochar are listed in Table 9. The acid–base-leached biochar particles show a 20% reduction in ash, 63% reduction in iron, and 20% reduction in silicon.
The biochar sample annealed under isopropanol vapour atmosphere shows increased ash content. This is due to the annealing process, which leads to carbonaceous structure rearrangement and loss.
The carbon quantitative data extracted from carbon high-resolution XPS spectra of different biochar particles is shown in Figure 31. There is no significant change in SBB-72 h and SBB-72 h-ABL samples as the leaching process reduces inorganic compounds by not changing the carbon content. The annealed samples show a reduction in oxygenated carbon content (C-O, C=O, O=C-O) due to a high annealing temperature. The XPS spectra of rSBB-72 h-ABL show the reduction of oxygenated carbon functionalities compared to samples annealed under only N2. The isopropanol annealing makes biochar a more polar additive that resembles properties of commercial carbon black. Such reduced polar carbon-filler materials have positive effects over mechanical composites of final composites.

4.5.4. Synthesis of Carbon–Polymer Nanocomposites

The nanocomposites are obtained by synthesizing carbon black with different particle sizes and by varying the filler weight percentage. The polyethylene (PE) matrix is combined with commercial carbon black (CB), SBB-72 h, and rSBB-72 h-ABL fillers with loading of 5 wt%. The carbon nanofillers are dried at 600 °C and mixed with polyethylene. A double-screw extruder is used to produce an extrusion of 200 gm of each sample followed by cooling with a water bath and pelletization.

4.5.5. Characterization of Nanocomposites

TGA analysis shows enhancement in thermal stability of CB polymer composites compared to neat polyethylene. Thermal degradation, fusion, and crystallization temperatures increases with increase in filler-loading percentage. They show the highest values for 5 wt% loaded CB–polyethylene composites.
Mechanical test results of composites with 5 wt% carbon black filler loading are shown in Figure 32. Maximum tension (τmax), rupture tension (τrup), and Young’s modulus (E) are considered for different carbon filler-material composites analysis.
The Young’s modulus of annealed CB particle-reinforced composites is higher than 72 h ball-milled biochar polymer composites. The mechanical properties of neat ethylene are conserved when much change in maximum tension (τmax), rupture tension (τrup) is not observed.
Other calorimetric and tomography studies show that annealing SCB biochar fillers have better colouring and attenuation properties when compared to the commercial carbon black. Various sugarcane bagasse-based carbon particles and fibre-reinforced polymer composite materials reported by other researchers are listed in Table 10.

4.6. Groundnut Shell

4.6.1. Importance of Groundnut Shell-Derived Nanoparticles

Groundnut is one of the most nutritious and the fourth largest oil seed in the world, which is grown underground and belongs to the Leguminosae family. Africa, USA, China, Nigeria, and India are the top groundnut-growing countries. Groundnut shell is the part left over after the removal of the seed from its pod. The shell accounts for nearly 20% of the weight of the dried groundnut. Nearly 10 million tons of groundnut shell are produced worldwide annually [129,130]. It is an abundantly produced agrowaste that biodegrades slowly when dumped into an open field. Burning or burying groundnut shell leads to environmental pollution. Figure 33a shows the chemical composition of groundnut shell [131].
The chemical composition of groundnut shell contains hemicellulose, which is a good moisture absorber, because cellulose acts as a cementing agent that binds individual cells together. The groundnut shell is commercially used as stock feed, food, and filler in fertilizers and in the production of various bioproducts, such as hydrogen, bioethanol, biodiesel, building materials, composite preparation, etc. [132]. Figure 33b shows the groundnut fruit and groundnut shell. Groundnut shell has ideal characteristics, such as low density, eco-friendliness, high strength, good binding capacity, and abundant availability, making it a good filler material in the preparation of polymer composite materials [133,134]. O. S. Olajide et al. synthesized polymer composite samples reinforced with nanoparticles derived from groundnut shell nanoparticles [135]. The synthesis process and characterization are discussed in following sections.

4.6.2. Synthesis of Carbon Nanoparticles from Groundnut Shell

Groundnut shell ash particles are formed by firing shells in an electric furnace at 1200 °C for about 5 h. The GS ash particles are ball milled to reduce the particle size. The carbon nanoparticles from GS are characterized to analyse the morphology and particle size.

4.6.3. Characterization of Carbon Nanoparticles Obtained from Groundnut Shell

TEM morphology shows that the synthesized nanoparticles are solid in nature but irregular in shape. The average particle size is 50–100 nm, and Figure 34a,b shows the particle size distribution by weight percentage.

4.6.4. Synthesis of Carbon–Polymer Nanocomposites

The polymer nanocomposites are synthesized by the extrusion method followed by injection moulding. The polylactic acid (PLA) polymer pellets and polyethylene glycol (PEG) compatibilizer are considered for the formation of the matrix, along with nanoparticles derived from GS. The composites are prepared by varying the filler loading, PEG concentration, annealing temperature, and annealing time. The nanoparticles, polymer, and compatibilizer are added into an extruder with a twin screw with the temperature ranging from 114 °C to 185 °C with cold granulation at the end of line. The obtained extrudates are palletized and dried in an oven. The pallets are injection moulded to produce standard dumbbell samples, as shown in Figure 35. The samples are later annealed at 60–80 °C to enhance the physical properties, such as tensile strength and modulus of the composite. The impact of various processing parameters on tensile strength of the composite are analysed based on Taguchi’s parameter design approach.

4.6.5. Characterization of Nanocomposites

Tensile strength was studied with the effect of process parameters at three different levels using Taguchi’s parameter design approach and is shown in Table 11.
The experimental results of tensile strength for different processing parameters are listed in Table 12. The optimal composite formulation is obtained by Taguchi’s parameter design model. The optimum parameter levels are found to be wt% of GS nanoparticles at L2, wt% of PEG at L1, and annealing temperature and annealing time at L3. The average tensile strength after the fracture of the optimum composite was 121 MPa. The ANOVA model predicted that GS nanoparticles (highest), annealing time, annealing temperature, and PEG (least) have great influence on the tensile strength. Finally, a regression model is designed that gives the tensile strength equation for composites. The experimental results are compared to predicted values from this regression model. Table 12 gives the predicted values through this model. The GS particle-reinforced nanocomposites showed 168% improvement in tensile strength compared to pure PLA for the optimum composite.
Young’s modulus is found to be higher for composite samples (2.30 GPa) when compared to neat PLA (2.22 GPa). Similarly, elongation at break for optimized PLA composite samples is higher than the neat PLA. The enhancement in Young’s modulus and elongation at break indicates that high stiffness strength of composites is due to reinforcement of GS nanoparticles.
The other research works based on groundnut shell micro- and nanoparticle-reinforced polymer composites are listed in Table 13.

4.7. Oil Palm Leaves

4.7.1. Importance of Oil Palm Leaves and Empty Fruit Bunch-Derived Nanoparticles

Oil palm is the world’s largest edible oil- and fat-producing tree, which yields more than nearly 50 million tons of palm oil annually. Oil palm trees are 20–30 m height and span 25–30 years of life economically [142,143]. The oil palm tree is cultivated in 42 countries; Indonesia and Malaysia are the largest palm oil-producing countries, which account for 84% of the world’s palm production [144]. Oil palm trees are a rich source of lignocelluloses. The lignocellulosic fibres can be extracted from the trunk, leaves, fronds, fruit mesocarp, and empty fruit bunches. One hectare of an oil palm plantation produces nearly 55 tons of fibrous dry biomass [145]. The chemical composition of oil palm fibrous biomass is shown in Figure 36.
Enormous amounts of waste are produced from oil palm plantations every year. The cellulosic material can be used for various purposes, such as timber, local soap production, fencing/shed preparation, fuel for boilers, and production of fertilizers. Dumping empty fruit bunches in the field causes environmental problems [146,147,148]. Figure 36b shows the oil palm tree and empty fruit bunches dumped in the land.
Oil palm fibres are abundant, eco-friendly, highly tough, and rich in cellulose content, which makes them a suitable precursor for the synthesis of polymer composites. There are many works on the synthesis of polymer composites reinforced with oil palm leaves, shells, and empty fruit bunches. J. R Pothnis et al. synthesized polymer nanocomposites reinforced with carbon nanoparticles derived from oil palm leaves [2]. The synthesis process and characterization of composite material is discussed below.

4.7.2. Synthesis of Carbon Nanoparticles from Oil Palm Leaves

The silica (SiO2) templates of oil palm leaves are utilized in the preparation of carbon nanospheres (CNS). The particles are obtained by a single-step pyrolysis process at temperatures of 500–600 °C in a tube furnace under a nitrogen atmosphere. The produced CNS consists of particle size and pore size ranging from 35–85 nm and 1.9–2 nm, respectively.

4.7.3. Characterization of Carbon Nanoparticles Obtained from Oil Palm Leaves

TEM images of carbon nanoparticles shown in Figure 37 reveal that the average particle size of synthesized CNS at a 500 °C carbonization temperature is 80 ± 5 nm and pore size is 1.9–2.00 nm. The average particle size and pore width of CNS produced at a 600 °C carbonization temperature is 35 ± 5 nm and 1.95–1.99 nm, respectively. At 700 °C, the particle size is larger and not uniform.
The elemental analysis of CNS shows higher a carbon percentage at the 600 °C carbonization temperature. The Brunauer–Emmett–Teller (BET) tests show that the synthesized CNS have very high micropore structures.
The XRD and Raman spectra of synthesized CNS are shown in Figure 38a and Figure 38b, respectively. X-ray diffraction analysis reveals the presence of the crystalline and amorphous form of carbon. Raman spectroscopy confirms the high percentage of crystalline graphite in synthesized CNS.

4.7.4. Synthesis of Carbon–Polymer Nanocomposites

The CNS–epoxy composites are prepared by solvent processing. The synthesized composite slabs are cured and cut using a water jet machine for characterization. Two different composite materials are prepared with 0.1 and 0.25 wt% filler loading.

4.7.5. Characterization of Nanocomposites

A tensile test is carried out to analyse the ultimate tensile strength, modulus, and % of elongation of the composite matrix. Figure 39 shows the stress–strain curve of composite materials compared to neat epoxy.
The composites prepared with 0.25 wt% CNS-reinforced composites show great improvement in ultimate tensile strength and Young’s modulus compared to neat epoxy without affecting ductility (strain), which is summarized in Table 14.
Toughness of 0.1 wt% and 0.25 wt% CNS show improvement of about 15% and 150%, respectively, compared to neat epoxy. The Young’s modulus for CNS–epoxy nanocomposites increases by 3.2% and 11% for 0.1 and 0.25 wt%, respectively. The damping capacity for 0.25 wt% CNS–epoxy decreases by 14% due to particle addition.
The distribution of CNS in the epoxy matrix, shown in Figure 40, confirms the effective dispersion of CNS in the polymer matrix, which leads to strong interfacial bonds between CNS and epoxy, as well as enhanced tensile properties of the composite matrix. The other works related to polymer composites reinforced with oil palm fibre particles from literature are listed in Table 15.

5. Conclusions and Future Perspectives

Sustainable growth of the world can be achieved by recycling waste material into useful resources without affecting the natural ecosystem. The biowaste generated in millions of tonnes must be reutilized in the conversion process of waste to wealth. The production of nanomaterials from biowastes for various valuable applications, such as catalysis, energy storage, fabrics and fibres, biomedics, ceramics, adhesives and plastics, and air and water purification, have attracted researchers in recent years. The pyrolysis process, which is used in most of the research works, is one of the eco-friendly ways to synthesise carbon nanomaterials. The carbon nanomaterials obtained from biowaste can be used as an excellent precursor for the synthesis of PNCs. Such PNCs show great improvement in mechanical, electrical, and optical properties. This article summarizes the synthesis of carbon nanomaterials, polymer nanocomposites, and characterizations of mechanical properties of PNCs, such as tensile strength, Young’s modulus, percentage of elongation, etc. The review also focuses on various biowaste-based precursors, their nanoproperties, and turning them into proper composites.
The PNCs synthesized from polymer material and carbon nanospheres derived from few biowaste materials, such as coconut shell, wood apple shell, bamboo biochar, sugarcane bagasse, groundnut shell, and oil palm, are reviewed in this article. The PNCs show improved mechanical properties by varying the loading percentage of carbon nanomaterials. Different synthesis processes, such as hand lay-up, solvent-processing, melt-blending, and hot and cold compression methods, are used. The PNCs synthesized from biowaste-derived, carbon nanoparticles and polymer matrix show good results in ultimate tensile strength, such as 58.6 MPa (oil palm leaves), 58.9 MPa (wood apple shell), 118 MPa (bamboo), and 114.87MPa (ground nut shell). The optimum tensile modulus is found to be 2.45 GPa (oil palm leaves), 4 GPa (coconut shell), 2.56 GPa (wood apple shell) and 4.56 GPa (bamboo).
Although lot of study was taken in this direction, optimization still needs to be done in several sectors, especially when it comes to tuning the composite properties, as one must tune the porosity, surface area, particle shape and size, pore diameter, etc. One can expect lot of improvements in the coming days in this area of research, where waste-to-wealth approach plays crucial role. Aerospace-related applications mainly require lightweight, high-strength composites which can withstand variation in temperature, and one needs to optimize the parameters suited to such applications. In a nutshell, many factors play a dominant role in composites made from biowaste-based, porous nanoparticles, and this review serves as a roadmap for those researchers who want to explore further.

Author Contributions

Conceptualization and supervision, G.H.; Data curation, writing, review and editing—B.H.T. and A.S.M. All authors have read and agreed to the published version of the manuscript.

Funding

This research was funded by DST-Nanomission, Grant number SR/NM/NT-1026/2017, TARE fellowship, Government of India, Grant number TAR/2020/000293 and TEQIP-III, grant no BMS/COE/TEQIP-III/2020-21/(ECE/01 and ECE/02).

Acknowledgments

The authors would like to acknowledge B.M.S. College of Engineering and CHRIST (Deemed to be University) for encouraging to write review articles.

Conflicts of Interest

The authors declare no conflict of interest.

References

  1. Bhattacharya, M. Polymer Nanocomposites—A Comparison between Carbon Nanotubes, Graphene, and Clay as Nanofillers. Materials 2016, 9, 262. [Google Scholar] [CrossRef]
  2. Pothnis, J.R.; Sridevi, M.; Supreeth, M.K.; Anilchandra, A.R.; Hegde, G.; Gururaja, S. Enhanced tensile properties of novel bio-waste synthesized carbon particle reinforced composites. Mater. Lett. 2019, 251, 110–113. [Google Scholar] [CrossRef]
  3. Fischer, H. Polymer nanocomposites: From fundamental research to specific applications. Mater. Sci. Eng. C. 2003, 23, 763–772. [Google Scholar] [CrossRef]
  4. Kurahatti, R.V.; Surendranathan, A.O.; Kori, S.A.; Nirbhay, S.; Ramesh Kumar, A.V.; Saurabh, S. Defence Applications of Polymer Nanocomposites. Def. Sci. J. 2010, 60, 551–563. [Google Scholar] [CrossRef] [Green Version]
  5. Ahmed, M.Y. Polymer Nanocomposites as a New Trend for Packaging Applications. Poly-Plast Technol. 2013, 52, 635–660. [Google Scholar]
  6. Hamer, U.; Marschner, B.; Brodowski, S.; Amelong, W. Interactive priming of black carbon and glucose mineralization. Org. Geochem. 2004, 35, 823–830. [Google Scholar] [CrossRef]
  7. Saha, D.; Li, Y.C.; Bi, Z.H.; Chen, J.H.; Keum, J.K.; Hensley, D.K.; Grappe, H.A.; Meyer, H.M.; Dai, S.; Paranthaman, M.P.; et al. Studies on supercapacitor electrode material from activated lignin-derived mesoporous carbon. Langmuir 2014, 30, 900–910. [Google Scholar] [CrossRef] [PubMed]
  8. Luna-Lama, F.; Rodriguez-Padronb, D.; Puente-Santiago, A.R.; Batista, M.J.M.; Caballero, A.; Balu, A.M.; Romero, A.A.; Luque, R. Non-porous carbonaceous materials derived from coffee waste grounds as highly sustainable anodes for lithium-ion batteries. J. Clean. Prod. 2019, 207, 411–417. [Google Scholar] [CrossRef]
  9. Yallappa, S.; Shivakumar, M.; Nagashree, K.L.; Dharmaprakash, M.S.; Vinu, A.; Gurumurthy, H. Electrochemical Determination of Nitrite Using Catalyst Free Mesoporous Carbon Nanoparticles from Bio Renewable Areca nut Seeds. J. Electrochem. Soc. 2018, 165, H614–H619. [Google Scholar] [CrossRef]
  10. Manohar, D.M.; Abhay, D.D.; Dhoble, S.J. Preparation of porous agro-waste-derived carbon from onion peel for supercapacitor application. J. Mater. Sci. 2020, 55, 4213–4224. [Google Scholar]
  11. Vinay, S.B.; Pandiyaraj, K.; Ganesan, S.; Ramya, P.B.; Neena, S.J.; Murugan, V.; Mahaveer, K.; Gurumurthy, H. Low cost, catalyst free, high performance supercapacitors based on porous nano carbon derived from agriculture waste. J. Energy Storage 2020, 32, 101829. [Google Scholar]
  12. Yinglin, Y.; Yiqi, W.; Qiaole, L.; Mangmang, S.; Chao, Z.; Liping, C.; Chaojiang, F.; Rong, Y.; Yunhua, X. Activated porous carbon materials with ultrahigh specific surface area derived from banana peels for high-performance lithium–sulfur batteries. J. Mater Sci. Mater Electron. 2018, 29, 11325–11335. [Google Scholar]
  13. Panpan, Z.; Xiaokang, W.; Lixi, W.; Jing, Z.; Zhi, S.; Xu, Q.; Mingxun, Y.; Qitu, Z. Walnut shell-derived nanoporous carbon@Fe3O4 composites for outstanding microwave absorption performance. J. Alloys Compd. 2019, 805, 1071–1080. [Google Scholar]
  14. Shuyang, Z.; Yuanchao, P.; Yuankun, W.; Bitao, D.; Shiyao, L.; Mingyan, L.; Shujiang, D. NiO nanosheets anchored on honeycomb porous carbon derived from wheat husk for symmetric supercapacitor with high performance. J. Alloys Compd. 2018, 735, 1722–1729. [Google Scholar]
  15. Mandira, P.A.; Rina, A.; Rekha, G.S.; Raja, R.; Laxmi, A.; Partha, B.; Raja, R.P.; Lok, K.S.; Katsuhiko, A. Nanoporous Activated Carbons Derived from Agro-Waste Corncob for Enhanced Electrochemical and Sensing Performance. Bull. Chem. Soc. Jpn. 2015, 88, 1108–1115. [Google Scholar]
  16. Sundaramurthy, I.; Thangavelu, M.; Mohammed, F.K.; Govindaswamy, R.; Thottapalli, P.S. Fabrication of prototype flexible semi conducting thin film with carbon nano particles and carbon nanotubes using fish scale collagen. Int. J. Innov. Res. Sci. Eng. Technol. 2014, 3, 10379–10387. [Google Scholar]
  17. Shan, L.; Chang, M.; Ming-Guo, M.; Jun-Feng, L. Recent Advances in Carbon Nanomaterials Derived from Biomass. Sci. Adv. Mater. 2019, 11, 5–17. [Google Scholar]
  18. Ayhan, D. Waste management, waste resource facilities and waste conversion processes. Energy Conv. Manag. 2011, 52, 1280–1287. [Google Scholar]
  19. Field, C.B.; Behrenfeld, M.J.; Randerson, J.T.; Falkowski, P. Primary production of the biosphere: Integrating terrestrial and oceanic components. Science 1998, 281, 237–240. [Google Scholar] [CrossRef] [Green Version]
  20. Klitkou Fevolden, A. From Waste to Value: Valorisation Pathways for Organic Waste Streams in Circular Bioeconomies, 1st ed.; Taylor & Francis: Oxfordshire, UK, 2019. [Google Scholar]
  21. Rodriguez-Padron, D.; Puente-Santiago, A.R.; Caballero, A.; Balu, A.M.; Romero, A.; Luque, R. Highly efficient direct oxygen electro-reduction by partially unfolded laccases immobilized on waste-derived magnetically separable nanoparticles. Nanoscale 2018, 10, 3961–3968. [Google Scholar] [CrossRef] [PubMed]
  22. Mohamad, N.N.; Lau, L.C.; Lee, K.T.; Mohamed, A.R. Synthesis of activated carbon from lignocellulosic biomass and its applications in air pollution control—A review. J. Environ. Chem. Eng. 2013, 1, 658–666. [Google Scholar] [CrossRef]
  23. Yang, S.I.; Wu, M.S.; Wu, C.Y. Application of biomass fast pyrolysis part I: Pyrolysis characteristics and products. Energy 2014, 66, 162–171. [Google Scholar] [CrossRef]
  24. Schmidt, H.P.; Anca-Couce, A.; Hagemann, N.; Werner, C.; Gerten, D.; Lucht, W.; Kammann, C. Pyrogenic carbon capture and storage. GCB Bioenergy 2018, 11, 573–591. [Google Scholar] [CrossRef] [Green Version]
  25. Yigang, Z.; Qing-Zhu, Y. Carbon and other light element contents in the Earth’s core based on first-principles molecular dynamics. Proc. Natl. Acad. Sci. USA 2012, 109, 19579–19583. [Google Scholar]
  26. Ioannidou, O.; Zabaniotou, A. Agricultural residues as precursors for activated carbon production—A review. Renew. Sustain. Energ. Rev. 2007, 11, 1966–2005. [Google Scholar] [CrossRef]
  27. Demirbas, A. Effects of temperature and particle size on biochar yield from pyrolysis of agricultural residues. J. Anal. Appl. Pyrolysis 2004, 72, 243–248. [Google Scholar] [CrossRef]
  28. Parmar, A.; Nema, P.K.; Agarwal, T. Biochar production from agro-food industry residues: A sustainable approach for soil and environmental management. Curr. Sci. 2014, 107, 1673–1682. [Google Scholar]
  29. Gonzalez-Garcia, P. Activated carbon from lignocellulosics precursors: A review of the synthesis methods, characterization techniques and applications. Renew. Sust. Energ. Rev. 2018, 82, 1393–1414. [Google Scholar] [CrossRef]
  30. Chunping, X.; Mahmoud, N.; Maurizio, S.; Zahra, I.; Rafael, L. Waste-to-wealth: Biowaste valorization into valuable bio (nano) materials. Chem. Soc. Rev. 2019, 48, 4791–4822. [Google Scholar]
  31. Pace, N.R. The universal nature of biochemistry. Proc. Natl. Acad. Sci. USA 2001, 98, 805–808. [Google Scholar] [CrossRef] [PubMed] [Green Version]
  32. Vilatela, J.J.; Eder, D. Nanocarbon composites and hybrids in sustainability: A review. ChemSusChem 2012, 5, 456–478. [Google Scholar] [CrossRef] [PubMed]
  33. Yallappa, S.; Shoriya, A.A.M.; Gurumurthy, H. Synthesis of a biocompatible nanoporous carbon and its conjugation with florescent dye for cellular imaging and targeted drug delivery to cancer cells. New Carbon Mater. 2018, 33, 162–172. [Google Scholar] [CrossRef]
  34. Gomaa, A.M.A.; Divyashree, A.; Supriya, S.; Kwok, F.C.; Anita, S.E.; Reddy, M.V.; Algarni, H.; Gurumurthy, H. Carbon nanospheres derived from Lablab purpureus for high performance supercapacitor electrodes: A green approach. Dalton Trans. 2017, 46, 14034–14044. [Google Scholar]
  35. Divyashree, A.; Shoriya, A.; Abdul, M.; Yallappa, S.; Chaitra, K.; Kathyayini, N.; Gurumurthy, H. Low cost, high performance supercapacitor electrode using coconut wastes: Eco-friendly approach. J. Energy Chem. 2016, 25, 880–887. [Google Scholar]
  36. Yallappa, S.; Deepthi, D.R.; Yashaswini, S.; Hamsanandini, R.; Chandraprasad, M.; Ashok Kumar, S.; Gurumurthy, H. Natural biowaste of Groundnut shell derived nano carbons: Synthesis, characterization and itsin vitro antibacterial activity. Nano Struct. Nano Objects 2017, 12, 84–90. [Google Scholar] [CrossRef]
  37. Akshaya, K.; Vinay, S.B.; Anitha, V.; Louis, G.; Gurumurthy, H. Non-Enzymatic Electrochemical Determination of Progesterone Using Carbon Nanospheres from Onion Peels Coated on Carbon Fiber Paper. J. Electrochem. Soc. 2019, 166, B1097–B1106. [Google Scholar]
  38. Shoriya, A.A.M.; Partha, R.; Korada, V.; Sharma, K.V.; Zainab, N.; Victor, M.; Ali, A.; Alshehri, A.S.M.; Yusuke, Y.; Gurumurthy, H. Catalyst-free synthesis of carbon nanospheres for potential biomedical applications: Waste to wealth approach. RSC Adv. 2015, 5, 24528–24533. [Google Scholar]
  39. Madhuri, A.B.; Pravin, H.W.; Rahul, V.K.; Mahesh, P.B.; Surajit, S. Eco-friendly biowaste-derived graphitic carbon as black pigment for conductive paint. Prog. Org. Coat. 2020, 147, 105872. [Google Scholar]
  40. Ankit, T.; Kumud, M.T.; Narendra, S.; Shashank, C.; Raju Kumar, G. Green synthesis of carbon quantum dots from lemon peel waste: Applications in sensing and photocatalysis. RSC Adv. 2016, 6, 72423–72432. [Google Scholar]
  41. Xing, H.X.; Zhang, F.; Lu, Y.G.; Zhai, B.; Zhai, B.R.; An, Q.D.; Yu, C.S. Facile synthesis of carbon nanoparticles/graphene composites derived from biomass resources and their application in lithium batteries. RSC Adv. 2016, 6, 79366. [Google Scholar] [CrossRef]
  42. Liu, F.F.; Liu, L.N.; Li, X.H.; Zeng, J.H.; Du, L.; Liao, S.J. Nitrogen self-doped carbon nanoparticles derived from spiral seaweeds for oxygen reduction reaction. RSC Adv. 2016, 6, 27535–27541. [Google Scholar] [CrossRef]
  43. Li, T.T.; Li, Y.H.; Wang, C.Y.; Gao, Z.D.; Song, Y.Y. Nitrogen-doped carbon nanospheres derived from cocoon silk as metal-free electrocatalyst for glucose sensing. Talanta 2015, 144, 1245–1251. [Google Scholar] [CrossRef]
  44. Fan, Y.; Shuaishuai, Z.; Yuqing, S.; Kui, C.; Jiangshan, L.; Daniel, C.W.T. Fabrication and characterization of hydrophilic corn stalk biochar-supported nanoscale zero-valent iron composites for efficient metal removal. Bioresour. Technol. 2018, 265, 490–497. [Google Scholar]
  45. Bhupendra, P.S.; Govind, P.; Aradhana, R.; Gurumurthy, H.; Pankaj, K.T.; Atul, S.; Rajiv, M. Investigation of dielectric and electro-optical properties of nematic liquid crystal with the suspension of biowaste-based porous carbon nanoparticles. Liq. Cryst. 2019, 46, 1808–1820. [Google Scholar]
  46. Pallabi, S.; Yong, S.O.; Ki-Hyun, K.; Eilhann, E.K.; Daniel, C.W.T. Synthesis of nanomaterials from various wastes and their new age applications. J. Clean. Prod. 2018, 197, 1190–1209. [Google Scholar]
  47. Schwenke, M.; Hoeppener, S.; Schubert, U.S. Synthesis and modification of carbon nanomaterials utilizing microwave heating. Adv. Mater. 2015, 27, 4113–4141. [Google Scholar] [CrossRef] [PubMed]
  48. Salisu, N.; Mohd Zobir, H.; Zulkarnain, Z.; Nor Azah, Y. Carbon-Based Nanomaterials/Allotropes: A Glimpse of Their Synthesis, Properties and Some Applications. Materials 2018, 11, 295. [Google Scholar]
  49. Kausar, A.; Ullah-Shah, M.; Khan, M.Y. An investigation on novel poly (thioureaamide) based nanocomposites reinforced with silica nanotubes. Polym.-Plast. Technol. Eng. 2014, 53, 223–228. [Google Scholar] [CrossRef]
  50. Cataldo, V.A.; Cavallaro, G.; Lazzara, G.; Milioto, S.; Parisi, F. Coffee grounds as filler for pectin: Green composites with competitive performances dependent on the UV irradiation. Carbohyd. Polym. 2017, 170, 198–205. [Google Scholar]
  51. Stefano, L. Polymer Clay Nano-composites. Polymers 2019, 11, 1445. [Google Scholar]
  52. Paul, D.R.; Robeson, L.M. Polymer nanotechnology: Nanocomposites. Polymer 2008, 49, 3187–3204. [Google Scholar] [CrossRef] [Green Version]
  53. Mitsuru, T. Development of Fabrication Methods of Filler/Polymer Nanocomposites: With Focus on Simple Melt-Compounding-Based Approach without Surface Modification of Nanofillers. Materials 2010, 3, 1593–1619. [Google Scholar]
  54. Maria, I.B.T.; Emerson, O.S.; Paulo, R.C.S.; Lívia, R.M. Nanostructured Materials—Fabrication to Applications; BoD: Norderstedt, Germany, 2017. [Google Scholar]
  55. Du, F.; Fischer, J.E.; Winey, K.I. Coagulation method for preparing single-walled carbon nanotube/poly(methyl methacrylate) composites and their modulus, electrical conductivity, and thermal stability. J. Polym. Sci. Pol. Phys. 2003, 41, 3333–3338. [Google Scholar] [CrossRef]
  56. Liu, L.; Barber, A.H.; Nuriel, S.; Wagner, H.D. Mechanical Properties of Functionalized Single-Walled Carbon-Nanotube/Poly(vinyl alcohol) Nanocomposites. Adv. Funct. Mater. 2005, 15, 975–980. [Google Scholar] [CrossRef]
  57. Jin, L.; Bower, C.; Zhou, O. Alignment of carbon nanotubes in a polymer matrix by mechanical stretching. Appl. Phys. Lett. 1998, 73, 1197–1199. [Google Scholar] [CrossRef]
  58. Jang, J.; Bae, J.; Yoon, S.H. A study on the effect of surface treatment of carbon nanotubes for liquid crystalline epoxide-carbon nanotube composites. J. Mater. Chem. 2003, 13, 676–681. [Google Scholar] [CrossRef]
  59. Spitalsky, Z.; Matejka, L.; Slouf, M.; Konyushenko, E.N.; Kovarova, J.; Zemek, J.; Kotek, J. Modification of carbon nanotubes and its effect on properties of carbon nanotube/epoxy nanocomposites. Polym. Compos. 2008, 30, 1378–1387. [Google Scholar] [CrossRef]
  60. Safadi, B.; Andrews, R.; Grulke, E.A. Multiwalled carbon nanotube polymer composites: Synthesis and characterization of thin films. J. Appl. Polym. Sci. 2002, 84, 2660–2669. [Google Scholar] [CrossRef]
  61. Kuilla, T.; Bhadra, S.; Yao, D.; Kim, N.H.; Bose, S.; Lee, J.H. Recent advances in graphene polymer composites. Prog. Polym. Sci. 2010, 35, 1350–1375. [Google Scholar] [CrossRef]
  62. Rina, C.; Hossein, Z. Hot-Melt Extrusion Technique: A Review. Iran. J. Pharm. Res. 2004, 3, 3–16. [Google Scholar]
  63. Villmow, T.; Potschke, P.; Pegel, S.; Haussler, L.; Kretzschmar, B. Influence of twin-screw extrusion conditions on the dispersion of multi-walled carbon nanotubes in poly(lactic acid) matrix. Polymer 2008, 49, 3500–3509. [Google Scholar] [CrossRef]
  64. Coleman, J.N.; Khan, U.; Gunko, Y.K. Mechanical Reinforcement of Polymers Using Carbon Nanotubes. Adv. Mater. 2006, 18, 637–640. [Google Scholar] [CrossRef]
  65. Byrne, M.T.; Gunko, Y.K. Recent Advances in Research on Carbon Nanotube-Polymer Composites. Adv. Mater. 2010, 22, 1672–1688. [Google Scholar] [CrossRef]
  66. Tavares, M.R.; De Menezes, L.R.; Nascimento, D.F.; Souza, D.H.S.; Reynaud, F.; Marques, M.F.V.; Tavares, M.I.B. Polymeric nanoparticles assembled with microfluidics for drug delivery across the blood-brain barrier. Eur. Phys. J. Spec. Top. 2016, 225, 779–795. [Google Scholar] [CrossRef]
  67. Arun, B.; Ravi, G.; Singh, B.P.; Singh, V.N.; Dhakate, S.R.; Mathur, R.B. Mechanical and Electrical Properties of High Performance MWCNT/Polycarbonate Composites Prepared by Industrial Viable Twin Screw Extruder with Back Flow Channel. RSC Adv. 2014, 4, 64649–64658. [Google Scholar]
  68. Abeysekara, M.G.D.; Waidyarathne, K.P. The Coconut Industry: A Review of Price Forecasting Modelling in Major Coconut Producing Countries. Coconut Res. Dev. J. 2020, 36, 17–26. [Google Scholar] [CrossRef]
  69. Udhayasankar, R.; Karthikeyan, B. A review on coconut shell reinforced composites. Int. J. Chem. Res. 2015, 8, 624–637. [Google Scholar]
  70. Limin, Y.; Qiongzhang, X.; Liwei, W.; Linlin, W.; Herbert, D.C.; Jie, Y.; Xin, H.J. CO2 absorption at nitrogen doped carbons prepared by K2CO3 activation of urea modified coconut shell. J. Colloid Interf. Sci. 2018, 511, 259–267. [Google Scholar]
  71. Salmah, H.; Koay, S.C.; Hakimah, O. Surface Modulation of Coconut Shell Powder Filled Polylactic Acid Biocomposites. J. Thermoplast. Compos. 2012, 26, 809–819. [Google Scholar] [CrossRef]
  72. Chibu, O.U.; Deepa, K.; Sydnei, H.; Shaik, J.; Vijaya, K.R. Synthesis of carbon from waste coconutshell and their application as filler in bioplast polymer filaments for 3D printing. Compos. Part B Eng. 2020, 202, 108428. [Google Scholar]
  73. Sanjay, K.; Chetan, M.P. Experimental and computational study of mechanical properties of nylon 6 nanocomposites reinforced with coconut shell nanoparticles. Mater. Today Commun. 2020, 24, 100981. [Google Scholar]
  74. Agunsoye, J.O.; Odumosu, A.K.; Dada, O. Novel epoxy-carbonized coconut shell nanoparticles composites for car bumper application. J. Adv. Manuf. Technol. 2019, 102, 893–899. [Google Scholar] [CrossRef]
  75. Uchechi, C.M.; Innocent, C.M.; Henry, C.O.; Udochukwu, M. Influence of filler loading on the mechanical and morphological properties of carbonized coconut shell particles reinforced polypropylene composites. J. Compos. Mater. 2019, 54, 397–407. [Google Scholar]
  76. Kishore, G.C.; Prasad, D.K.; Devireddy, S.B.R. Physical and thermal behaviour of areca and coconut shell powder reinforced epoxy composites. Mater. Today Proc. 2020, 26, 1402–1405. [Google Scholar] [CrossRef]
  77. Jagannathan, S.; Shanmuga, S.A.; Paulius, G. Evaluation of mechanical properties of biodegradable coconut shell/rice husk Powder polymer composites for light weight applications. Mater. Today Proc. 2020, 39, 1241–1247. [Google Scholar]
  78. Robert, A.O.; Kingsley, C.N.; Boniface, A.O. Effect of Alkaline Treatment on Mechanical and Thermal Properties of Coconut Shell Particulates Reinforced Epoxy Composite. Am. J. Chem. Mater. Sci. 2019, 6, 10–14. [Google Scholar]
  79. Durowaye, S.I.; Lawall, G.I.; Akande, M.A.; Durowaye, V.O. Mechanical Properties of Particulate Coconut Shell And palm Fruit Polyester Composites. Int. J. Mater. Eng. 2014, 4, 141–147. [Google Scholar]
  80. Kumar, M.; Rithin, K.; Raghuveer, B.; Sharun, K.; Yathiraj, R.; Shanmukh, K.; Shreeprakash, B. Study on Effect of Stirring Parameters on Tensile Properties of Coconut Shell Powder Reinforced Epoxy Matrix Composite. Appl. Mech. Mater. 2014, 592, 1180–1184. [Google Scholar] [CrossRef]
  81. Ashtaputrey, P.D.; Ashtaputrey, S.D. Preparation and Characterization of Activated Charcoal derived from Wood Apple Fruit Shell. J. Sci. Res. 2020, 64, 336–340. [Google Scholar] [CrossRef]
  82. Ojha, S.; Gujjala, R.; Acharya, S.K. Effect of Filler Loading on Mechanical and Tribological Properties of Wood Apple Shell Reinforced Epoxy Composite. Adv. Mater. Sci. Eng. 2014, 2014, 538651. [Google Scholar]
  83. Shakuntala, O.; Raghavendra, G.; Acharya, S.K. A Comparative Investigation of Bio Waste Filler (Wood Apple-Coconut) Reinforced Polymer Composites. Polym. Compos. 2013, 35, 180–185. [Google Scholar]
  84. Tatarchuk, T.; Bououdina, M.; Al-Najar, B.; Bitra, R.B. Green and Ecofriendly Materials for the Remediation of Inorganic and Organic Pollutants in Water. In A New Generation Material Graphene: Applications in Water Technology, 1st ed.; Mu, N., Ed.; Springer: Berlin, Germany, 2019; Chapter 4. [Google Scholar]
  85. Ahmad, R.; Kumar, R. Adsorptive removal of congo red dye from aqueous solution using bael shell carbon. Appl. Surf. Sci. 2010, 257, 1628–1633. [Google Scholar] [CrossRef]
  86. Shakuntala, O.; Samir, K.A.; Raghavendra, G. Mechanical Properties of Natural Carbon Black Reinforced Polymer Composites. J. Appl. Polym. Sci. 2015, 132, 41211. [Google Scholar]
  87. Vinay, M.; Anshuman, S. Epoxy/Wood Apple Shell Particulate Composite With Improved Mechanical Properties. Int. J. Eng. Res. Appl. 2014, 4, 142–145. [Google Scholar]
  88. Vinod, V.R.; Ashok, R.B.; Ganesh, U.L.; Srinivas, C.V.; Reur, S.C. Mechanical Characterization of Wood Apple and Coconut Shell Reinforced Hybrid Composites. AIP Conf. Proc. 2020, 2247, 040001. [Google Scholar]
  89. Mohankumararadhya, H.M.; Pramod, W.; Chandrashekar, A.; Yuvaraj, N. Studies on bio waste product particle reinforced polymer composites. AIP. Conf. Proc. 2020, 2274, 030047. [Google Scholar]
  90. Perminder, J.K.; Santosh, S.; Kamal, K.P.; Satya, N.N. Eco-Friendly Preservation of Bamboo Species: Traditional to Modern Techniques. Bioresources 2016, 11, 10604–10624. [Google Scholar]
  91. Higuchi, H. Biochemical studies of lignin formation III. Physiol. Plant. 1957, 10, 633–648. [Google Scholar] [CrossRef]
  92. Ajoy, K.S.; Subhash, A. Single bath process for imparting antimicrobial activity and ultraviolet protective property to bamboo viscose fabric. Cellulose 2009, 16, 923–928. [Google Scholar]
  93. Khalil, H.P.S.A.; Bhat, I.U.H.; Jawaid, M.; Zaidon, A.; Hermawan, D.; Hadi, Y.S. Bamboo fibre reinforced biocomposites: A review. Mater. Design 2012, 42, 353–368. [Google Scholar]
  94. Prakash, C. Handbook of Natural Fibres; Ryszard, K., Maria, M.-T., Eds.; Elsevier: Amsterdam, The Netherlands, 2020; Chapter 7. [Google Scholar]
  95. Liao, P.; Ismael, Z.M.; Zhang, W.; Yuan, S.; Tong, M.; Wang, K.; Bao, J. Adsorption of dyes from aqueous solutions by microwave modified bamboo charcoal. Chem. Eng. J. 2012, 195, 339–346. [Google Scholar] [CrossRef]
  96. Mohanad, M.; Dong, Y. Strong Polyvinyl Alcohol (PVA)/Bamboo Charcoal (BC) Nanocomposite Films with Particle Size Effect. ACS Sustain. Chem. Eng. 2018, 6, 467–479. [Google Scholar]
  97. Kulkarni, D.D.; Choi, I.; Singamaneni, S.S.; Tsukruk, V.V. Graphene oxide−polyelectrolyte nanomembranes. ACS Nano 2010, 4, 4667–4676. [Google Scholar] [CrossRef]
  98. Mei-po, H.; Kin-tak, L.; Hao, W.; David, H. Improvement on the properties of polylactic acid (PLA) using bamboo charcoal particles. Compos. Part B Eng. 2015, 81, 14–25. [Google Scholar]
  99. Cheng-Ming, T.; Yi-Hung, T.; Shan-Hui, H. Poly(vinyl alcohol) Nanocomposites Reinforced with Bamboo Charcoal Nanoparticles: Mineralization Behavior and Characterization. Materials 2015, 8, 4895–4911. [Google Scholar]
  100. Mohanad, M.; Dong, Y.; Ian, J.D. Eco-friendly polyvinyl alcohol (PVA)/bamboo charcoal (BC) nanocomposites with superior mechanical and thermal properties. Adv. Compos. Mater. 2018, 27, 499–509. [Google Scholar]
  101. Zhipei, Y.; Dagang, L. Highly filled bamboo charcoal powder reinforced ultra-high molecular weight polyethylene. Mater. Lett. 2014, 122, 121–124. [Google Scholar]
  102. Adam, F.; Appaturi, J.N.; Iqbal, A. The utilization of rice husk silica as a catalyst: Review and recent progress. Catal. Today 2012, 190, 2–14. [Google Scholar] [CrossRef]
  103. Nguu, V.N.; Aldo, F. Meeting the challenges of global rice production. Paddy Water Environ. 2006, 4, 1–9. [Google Scholar]
  104. Reza, A.; Azman, H.; Khaliq, M.; Zainoha, Z. Rice Husk Filled Polymer Composites. Int. J. Polym. Sci. 2015, 2015, 501471. [Google Scholar]
  105. Luduena, L.; Fasce, D.; Alvarez, V.A.; Stefani, P.M. Nanocellulose from rice husk following alkaline treatment to remove silica. BioResources 2011, 6, 1440–1453. [Google Scholar] [CrossRef]
  106. Premalal, H.G.B.; Ismail, H.; Baharin, A. Comparison of the mechanical properties of rice husk powder filled polypropylene composites with talc filled polypropylene composites. Polym. Test. 2002, 21, 833–839. [Google Scholar] [CrossRef]
  107. Richard, S.; Selwin, R.; Manikandan, V. Influence of Particle Size and Particle Loading on Mechanical and Dielectric Properties of Biochar Particulate Reinforced Polymer Nanocomposites. Int. J. Polym. Anal. Chem. 2016, 21, 462–477. [Google Scholar] [CrossRef]
  108. Beichen, X.; Xiaofeng, W.; Jiayang, S.; Duo, X.; Yanchao, Z.; Xiaoyang, L. A facile ball milling method to produce sustainable pyrolytic rice husk biofiller for reinforcement of rubber mechanical property. Ind. Crops Prod. 2019, 141, 111791. [Google Scholar]
  109. Sabzoi, N.; Ankit, J.; Sundus, S.Q.; Humair, A.B.; Siddiqui, M.T.H.; Mubarak, N.M.; Gregory, G.; Srinivasan, M.; Akshat, T.; Mohd Imran, A. Synthesis and characterization of polylactide/rice husk hydrochar composite. Sci. Rep. 2019, 9, 5445. [Google Scholar]
  110. Li, W.; Yong, G.; Yuxia, C.; Tong, C.; Shiliu, Z.; Tingting, Z.; Shengquan, L. Enhanced Mechanical and Water Absorption Properties of Rice Husk-Derived Nano-SiO2 Reinforced PHBV Composites. Polymer 2018, 10, 1022. [Google Scholar]
  111. Liangpeng, J.; Jingjing, F.; Lihong, L.; Peng, D. Wear and thermal behaviour of basalt fibre reinforced rice husk/polyvinyl chloride composites. J. Appl. Polym. Sci. 2020, 138, 50094. [Google Scholar]
  112. Hamdan, M.H.M.; Siregar, J.P.; Rejab, M.R.M.; Bachtiar, D.; Jamiluddin, J.; Tezara, C. Efect of Maleated Anhydride on Mechanical Properties of Rice Husk Filler Reinforced PLA Matrix Polymer Composite. Int. J. Precis. Eng. Manuf. -Green Technol. 2019, 6, 113–124. [Google Scholar] [CrossRef]
  113. Miguel, A.H.; Elizabeth, S. Mechanical, thermal, viscoelastic performance and product application of PP- rice husk Colombian biocomposites. Compos. Part B Eng. 2019, 176, 107135. [Google Scholar]
  114. Silva, C.C.; Melo, C.A.; Junior, F.H.S.; Moreira, A.B.; Ferreira, O.P.; Bisinoti, M.C. Effect of the reaction medium on the immobilization of nutrients in hydrochars obtained using sugarcane industry residues. Bioresour. Technol. 2017, 237, 213–221. [Google Scholar] [CrossRef] [Green Version]
  115. Narayan, K.S.; Gaspar, H.K.; Lawrence, E.D.; George, H.S. Silicon nutrition and sugarcane production: A review. J. Plant Nutr. 2008, 22, 1853–1903. [Google Scholar]
  116. Walfrido, A.P.; Carlos, A.L. Sugarcane energy use: Accounting of feedstock energy considering current agro-industrial trends and their feasibility. Int. J. Energy Environ. Eng. 2013, 4, 10. [Google Scholar]
  117. Hernandez-Salas, J.M.; Villa-Ramirez, M.S.; Veloz-Rendo, N.J.S.; Rivera-Hernandez, K.N.; Gonzalez-Cesar, R.A.; Plascencia-Espinosa, M.A. Comparative hydrolysis and fermentation of sugarcane and agave bagasse. Bioresour. Technol. 2009, 100, 1238–1245. [Google Scholar] [CrossRef]
  118. Pandey, A.; Soccol, C.R.; Nigam, P.; Soccol, V.T. Biotechnological potential of agro-industrial residues. I: Sugarcane bagasse. Bioresour. Technol. 2000, 74, 69–80. [Google Scholar] [CrossRef]
  119. Reddy, M.R.; Chandrasekharaiah, M.; Govindaiah, T.; Reddy, G.V.N. Effect of physical processing on the nutritive value of sugarcane bagasse in goats and sheep. Small Rumin. Res. 1993, 10, 25–31. [Google Scholar] [CrossRef]
  120. Balaji, A.; Karthikeyan, B.; Sundar Raj, C. Bagasse Fiber–The Future Biocomposite Material: A Review. Int. J. Chemtech. Res. 2015, 7, 223–233. [Google Scholar]
  121. Gabriela, F.F.; Mauricio, P.; Ana, C.F.; Widner, P.D.; Mathias, S. Tuning Sugarcane Bagasse Biochar into a Potential Carbon Black Substitute for Polyethylene Composites. J. Polym. Environ. 2019, 27, 1735–1745. [Google Scholar]
  122. Agunsoye, J.O.; Aigbodion, V.S. Bagasse filled recycled polyethylene bio composites: Morphological and mechanical properties study. Results Phys. 2013, 3, 187–194. [Google Scholar] [CrossRef] [Green Version]
  123. Fabio Friol, G.D.; Vitor Peixoto, K.D.; Giovani, B.T.; Guilherme, D.; Renivaldo, J.D.; Flavio, C.C.; Aldo Eloizo, J. Sugarcane bagasse fiber as semi-reinforcement filler in natural rubber composite sandals. J. Mater. Cycles Waste 2019, 21, 326–335. [Google Scholar]
  124. Manikandan, I.; Vijaykumar, G.; Gopalakrishna, K.; Narendra, R. Tensile and Flexural Properties of Polypropylene Composites Reinforced with Raw Bagasse. Sugar Tech 2018, 20, 454–463. [Google Scholar]
  125. Zuqiang, H.; Nan, W.; Yanjuan, Z.; Huayu, H.; Yuanwei, L. Effect of mechanical activation pretreatment on the properties of sugarcanebagasse/poly(vinyl chloride) composites. Compos. Compos. Part A Appl. Sci. Manuf. 2012, 43, 114–120. [Google Scholar]
  126. Motaung, T.E.; Linganiso, L.Z.; John, M. The effect of silane treated sugar cane bagasse on mechanical, thermal and crystallization studies of recycled polypropylene. Mater. Sci. Appl. 2015, 6, 724–733. [Google Scholar] [CrossRef] [Green Version]
  127. Subramonian, S.; Ali, A.; Amran, M.; Sivakumar, D.M. Effect of fiber loading on the mechanical properties of bagasse fiber-reinforced polypropylene composites. Adv. Mech. Eng. 2016, 8, 1–5. [Google Scholar] [CrossRef] [Green Version]
  128. Wang, L.; Tong, Z.; Ingram, L.O.; Qingzheng, C.; Siobhan, M. Green composites of poly (lactic acid) and sugarcane bagasse residues from bio-refinery processes. J. Polym. Environ. 2013, 21, 780–788. [Google Scholar] [CrossRef]
  129. Zheng, W.; Phoungthong, K.; Lu, F.; Shao, L.M.; He, P.J. Evaluation of a classification method for biodegradable solid wastes using anaerobic degradation parameters. Waste Manag. 2013, 33, 2632–2640. [Google Scholar] [CrossRef] [PubMed] [Green Version]
  130. Chinedu, O. Peanut Husk Filled Polyethylene Composites: Effects of Filler Content and Compatibilizer on Properties. J. Polym. Environ. 2015, 2015, 89289. [Google Scholar]
  131. Raju, G.U.; Kumarappa, S.; Gaitonde, V.N. Mechanical and Physical Characterization of Agricultural Waste Reinforced Polymer Composites. J. Mater. Environ. Sci. 2012, 3, 907–916. [Google Scholar]
  132. Pham, A.D.; Dharanipriya, P.; Bharath, K.V.; Shanmugavadivu, M. Groundnut shell—A beneficial bio-waste. Biocatal. Agric. Biotechnol. 2019, 20, 101206. [Google Scholar]
  133. Nor Fasihah, Z.; Hanafi, I. A Review on Peanut Shell Powder Reinforced Polymer Composites. Polym.-Plast. Technol. Mater. 2019, 58, 349–365. [Google Scholar]
  134. Thakur, V.K.; Thakur, M.K. Processing and Characterization of Natural Cellulose Fibers/Thermoset Polymer Composites. Carbohydr. Polym. 2014, 109, 102–117. [Google Scholar] [CrossRef]
  135. Olajide, O.S.; Yaro1, S.A.; Asuke, F.; Aponbiede, O. Experimental correlation between process parameters and tensile strength of polylactic acid/groundnut shell nanoparticle biocomposites. Int. J. Adv. Manuf. Technol. 2017, 93, 717–726. [Google Scholar] [CrossRef]
  136. Hwazen, S.F. Flexural and Impact Properties of Epoxy Composites Reinforced with Peanut Shell Particles. Eng. Technol. J. 2020, 38, 1026–1033. [Google Scholar]
  137. Prabina, K.P.; Srimant, K.M.; Priyadarshi, T.R.S.; Sameer, D.P. Effect of Groundnut Shell Particulate Content on Physical and Mechanical Behavior of Jute–Epoxy Hybrid Composite. J. Inst. Eng. India Ser. E 2020. [Google Scholar] [CrossRef]
  138. Samson, A.; Omotayo, T.; Emmanuel, A.; Oluwashina, G.; Sadiq, G.; Samuel, O. Mechanical characteristics of groundnut shell particle reinforced polylactide nano fibre. Materia 2016, 21, 482–491. [Google Scholar]
  139. Raju, G.U.; Kumarappa, S. Experimental study on mechanical properties of groundnut shell particle reinforced epoxy composites. J. Reinf. Plast. Compos. 2016, 30, 1029–1037. [Google Scholar] [CrossRef]
  140. Sareena, C.; Ramesan, M.T.; Purushothaman, E. Utilization of Peanut Shell Powder as a Novel Filler in Natural Rubber. J. Appl. Polym. Sci. 2012, 125, 2322–2334. [Google Scholar] [CrossRef]
  141. Onuegbu, G.C.; Nwanonenyi, S.C.; Obidiegwu, M.U. The Effect of Pulverised Ground Nut Husk on Some Mechanical Properties of Polypropylene Composites. Int. J. Eng. Sci. 2013, 2, 79–83. [Google Scholar]
  142. Ng, Y.G.; Bahri, M.T.S.; Syah, M.Y.I.; Mori, I.; Hashim, Z. Ergonomics Observation: Harvesting Tasks at Oil Palm Plantation. J. Occup. Health 2013, 55, 405–414. [Google Scholar]
  143. Edem, D.O. Palm oil: Biochemical, physiological, nutritional, hematological, and toxicological aspects: A review. Plant Food Hum. Nutr. 2002, 57, 319–341. [Google Scholar] [CrossRef]
  144. Khalil, H.P.S.A.; Siti, M.A.; Ridzuan, R.; Kamarudin, H.; Khairul, A. Chemical composition, morphological characteristics, and cell wall structure of malaysian oil palm fibers. Polym.-Plast. Technol. Eng. 2008, 47, 273–280. [Google Scholar] [CrossRef]
  145. Shinoj, S.; Visvanathan, R.; Panigrahic, S.; Kochubabu, M. Oil palm fiber (OPF) and its composites: A review. Ind. Crops Prod. 2011, 33, 7–22. [Google Scholar] [CrossRef]
  146. Ferdous Alam, A.S.A.; Er, A.C.; Halima, B. Malaysian oil palm industry: Prospect and problem. J. Food Agric. Environ. 2015, 13, 143–148. [Google Scholar]
  147. Izah, S.C.; Angaye, T.C.; Ohimain, E.I. Environmental Impacts of Oil Palm Processing in Nigeria. Biotechnol. Res. 2016, 2, 132–141. [Google Scholar]
  148. Emily, B.F.; Matthew, J.S.; Alexandra, M.; Finn, D.; Carsten, A.B.; Paul, F.D.; Ben, P. How will oil palm expansion affect biodiversity. Trends Ecol. Evolut. 2008, 23, 538–545. [Google Scholar]
  149. Anuj, K.; Gurumurthy, H.; Manaf, S.A.B.A.; Ngaini, Z.; Sharma, K.V. Catalyst free silica templated porous carbon nanoparticles from bio-waste materials. Chem. Commun. 2014, 50, 12702–12705. [Google Scholar]
  150. Saba, N.; Jawaid, M.; Alothman, O.Y.; Zeyad, A. Evaluation of dynamic properties of nano oil palm empty fruit bunch filler/epoxy composites. J. Mater. Res. 2018, 8, 1470–1475. [Google Scholar] [CrossRef]
  151. Yern, C.C.; Ashiqur, R.; Kuan, Y.C.; Nazatul, L.S.; Cheng, H.C. Preparation and characterization of Polyvinyl Alcohol based composites Reinforced with Nanocellulose and Nanosilica. BioResources 2015, 10, 3364–3377. [Google Scholar]
  152. Rosamah, E.; Hossain, M.S.; Abdul Kalil, H.P.S.; Wan Nadirah, W.O.; Dungani, R.; Nur Amiranajwa, A.S.; Suraya, N.L.M.; Fizree, H.M.; Mohd Omar, A.K. Properties enhancement using oil palm shell nanoparticles of fibers reinforced polyester hybrid composites. Adv. Compos. Mater. 2016, 26, 259. [Google Scholar]
  153. Naheeb, S.; Paridah, M.T.; Khalina, A.; Ibrahim, N.A. Fabrication of Epoxy Composites from Oil Palm Nano Fillers, Mechanical and Morphological Properties. BioResources 2016, 11, 7721–7736. [Google Scholar]
  154. Abu, B.; Hassan., A.; Yusof, A.M. Effect of Oil Palm Empty Fruit Bunch and Acrylic Impact Modifier on Mechanical Properties and Processability of Unplasticized Poly(Vinyl Chloride) Composites. Polym.-Plast. Technol. Eng. 2014, 44, 1125–1137. [Google Scholar]
  155. Jing, L.C.; Yern, C.C.; Seng, N.G.; Shaifulazuar, R.; Sabariah, J. Effects of Oil Palm Empty Fruit Bunch Fiber on Electrical Mechanical Properties of conductive Filler Reinforced Polymer Composites. BioResources 2016, 11, 913–998. [Google Scholar]
  156. Saba, N.; Paridah, M.T.; Abdan, K.; Ibrahim, N.A. Effect of oil palm nano filler on mechanical and morphological properties of kenaf reinforced epoxy composites. Constr. Build. Mater. 2016, 123, 15–26. [Google Scholar] [CrossRef]
  157. Ibrahim, M.S.; Sapuan, S.M.; Faieza, A.A. Mechanical and Thermal Properties of Composites from Unsaturated Polyester Filled With Oil Palm Ash. J. Mech. Eng. Sci. 2012, 2, 133–147. [Google Scholar] [CrossRef]
Figure 1. Scopus data for the last five years by typing the keywords “bio”, “nano”, and “polymer composites”. One can see the growing interest in terms of the number of publications by (a) subject (b) countries, (c) percentage of papers by year.
Catalysts 11 01485 g001
Figure 2. Classifications of biowaste in various sectors, i.e., food processing, agriculture, industry, forests, sewage, and animals.
Catalysts 11 01485 g002
Figure 3. Allotropes of carbon nanomaterials ranging from 0D to 1D, 2D, and 3D.
Catalysts 11 01485 g003
Figure 4. Applications of carbon nanomaterials in various fields [30].
Catalysts 11 01485 g004
Figure 5. Polymer nanocomposite by solvent method [54].
Catalysts 11 01485 g005
Figure 6. Polymer nanocomposite synthesis process [2].
Catalysts 11 01485 g006
Figure 7. Synthesis of polymer nanocomposites by twin extrusion and injection moulding [67].
Catalysts 11 01485 g007
Figure 8. (a) Coconut shell chemical composition and (b) formation of coconut shell biomass [69].
Catalysts 11 01485 g008
Figure 9. Synthesis of carbon nanoparticles from CS powder.
Catalysts 11 01485 g009
Figure 10. (a) XRD of CCSP and CCSP10 and (b) Raman spectrometry of CCSP and CCSP10 [72].
Catalysts 11 01485 g010
Figure 11. (a) SEM micrograph of CCSP, (b) CCSP10, (c) magnified view of CCSP10, and (d) TEM micrograph of CCSP10 [72].
Catalysts 11 01485 g011
Figure 12. Synthetic procedure for nanocomposites.
Catalysts 11 01485 g012
Figure 13. (a) TGA of BPB–CCSP composites, (b) tensile properties of different systems, and (c) electrical conductivity of composites [72].
Catalysts 11 01485 g013
Figure 14. (a) Wood apple shell chemical composition and (b) formation of wood apple shell biomass.
Catalysts 11 01485 g014
Figure 15. Synthesis process of carbon black from wood apple shell waste.
Catalysts 11 01485 g015
Figure 16. Proximate analysis of wood apple shell powder [86].
Catalysts 11 01485 g016
Figure 17. SEM images of (a) raw WAS powder, (b) carbon black of WAS powder (600 °C), and (c) carbon black of WAS powder (800 °C) [86].
Catalysts 11 01485 g017
Figure 18. Synthesis of polymer–CB nanocomposites.
Catalysts 11 01485 g018
Figure 19. Effect of filler loading and carbonization temperature of composites on (a) ultimate tensile strength, (b) tensile modulus, (c) flexural strength, and (d) flexural modulus [86].
Catalysts 11 01485 g019
Figure 20. (a) Bamboo fibre chemical composition (b) bamboo plant and pole.
Catalysts 11 01485 g020
Figure 21. Atomic force microscope images of (a,c) NBCs and (b,d) MBCs at different magnifications [96].
Catalysts 11 01485 g021
Figure 22. FTIR spectra of (a) NBCs and MBCs particles, (b) PVA–NBC nanocomposites, and (c) PVA–MBC nanocomposites [96].
Catalysts 11 01485 g022
Figure 23. (a) Tensile modulus and tensile strength and (b) elongation at break and tensile toughness of PVA–NBC and PVA–MBC composites [96].
Catalysts 11 01485 g023
Figure 24. (a) Rice husk chemical composition and (b) rice plant, grain, and husk.
Catalysts 11 01485 g024
Figure 25. (a) Rice husk and (b) biochar from rice husk [107].
Catalysts 11 01485 g025
Figure 26. Topography of biochar particles [107].
Catalysts 11 01485 g026
Figure 27. (a) XRD pattern of rice husk biochar and (b) FTIR of rice husk biochar [107].
Catalysts 11 01485 g027
Figure 28. (a) Impact strength of composite material and (b) tensile test results of composite material [107].
Catalysts 11 01485 g028
Figure 29. (a) Sugarcane bagasse chemical composition and (b) sugarcane and bagasse.
Catalysts 11 01485 g029
Figure 30. Particle size of 72 h ball-milled biochar derived from SCB [121].
Catalysts 11 01485 g030
Figure 31. Carbon quantitative data of treated biochar samples [121].
Catalysts 11 01485 g031
Figure 32. Mechanical test results of polymer composites: (a) neat polyethylene, (b) PE-commercial CB-ABL 5% (c) PE-SBB 72 h-ABL 5%, and (d) PE-rSBB-72 h-ABL 5% [121].
Catalysts 11 01485 g032
Figure 33. (a) Groundnut shell chemical composition (b) groundnut and shell.
Catalysts 11 01485 g033
Figure 34. (a) TEM images of GS nanoparticles and (b) particle size distribution by weight loss (%) [135].
Catalysts 11 01485 g034
Figure 35. PLA–GSP nanocomposite samples [135].
Catalysts 11 01485 g035
Figure 36. (a) Oil palm tree chemical composition and (b) oil palm tree and empty fruit bunches of oil palm dumped on land.
Catalysts 11 01485 g036
Figure 37. TEM images of CNS at (a) 500 °C and (b) 600 °C carbonization temperatures [149].
Catalysts 11 01485 g037
Figure 38. (a) XRD and (b) Raman spectra of synthesized CNS [2].
Catalysts 11 01485 g038
Figure 39. Stress–strain curve of composite materials and neat epoxy [2].
Catalysts 11 01485 g039
Figure 40. Dispersion of CNS particles: (a) 0.1 wt% CNS–epoxy and (b) 0.25 wt% CNS–epoxy composite with agglomerations of 125 nm (indicated by arrow) [2].
Catalysts 11 01485 g040
Table 1. Summary of lignocellulose precursors for the synthesis of activated carbon [29].
StemShellsStonesFibresPeelsSeedsHusksWasteOthersWoods
Oil palmWalnutDindeKapokOrangeGuavaRiceTobaccoCorncobChestnut
GrapeAlmondOliveHempPomeloAlbizia lebbeckRyeVine shootsCelluloseChinese fir
Date palmCoconutDateFlaxBananaChoerospondiasMoringaStarch richEnteromorpha proliferaEucalyptus
CottonPeanutPeachKenafDurianCottonOleiferaBananaVetiver rootsBeech
WheatHazelnutApricotCottonRambutanElaeagnusBarleyPineappleEuphorbia rigidaProsopis ruscifolia
PlumOil palmAvocadoAgaveOnionGrapeSky fruitSoybean oil cakeCarrageenanPine
FlaxPine nutCherryCoirGarlicPongam CoffeeAgarWood apple
Arundo donaxPhaseolus aureusAguajeOpuntia ficus-indicaWatermelonCicer Apple pulpJacaranda mimosifolia fruitPinus sylvestris
VetchPalm kernelAreca PapayaArietinum Palm kernel Finish wood
Crofton weedFlamboyant pods Sisal Accacia fumosa ShellCorkAlmond tree
LinnPistachio Cannabissativa Sesame Coir pitchGelatinePruning
Pomegranate Longan Oil cakePaulownia flowerJatropha wood
Groundnut WalnutVetiver rootsOrange
Apricot Potato wastePalm flowerTamarind
Ceiba pentandra Plum pulpCorn starch
Coffee TeaWillow catkins
Wood apple Chicken droppings
Sago
Lemna minor
Table 2. Carbon nanomaterials synthesized from biowaste and their applications.
BiowasteCarbon NanomaterialApplicationsReferences
Oil palm leavesCarbon nanospherePolymer nanocomposites and targeted drug delivery[33]
Lablab purpureusCarbon nanosphereSupercapacitors[34]
Coconut wasteCarbon nanosphereEnergy storage[35]
Groundnut shellNanocarbonsAntimicrobial activity[36]
Onion peelCarbon nanosphereElectrochemical sensors[37]
Sago hampusCarbon nanosphereCell imaging[38]
Cow dungCarbon blackConductive paint[39]
Lemon peelCarbon quantum dotsSensors and photocatalysts[40]
Sodium alginateCarbon nanoparticlesLithium–ion batteries[41]
Spiral seaweedCarbon nanoparticlesOxygen reduction[42]
Cocoon silkCarbon nanosphereGlucose sensing[43]
Corn cobNanobiocharWastewater treatment[44]
Oil palm leavesCarbon nanoparticlesNematic liquid crystals[45]
Table 3. Synthesis and characterization of coconut shell composites.
Sl No.Polymer MatrixCarbon MaterialMethodMechanical and Thermal TestReference
1Nylon 6Carbon nanoparticles (35–100 nm)Hand lay-off3 wt% composites showed
Young’s modulus of 4.21 GPa (58% increase) and tensile strength of 87.43 MPa (30% increase)
[73]
2Epoxy LY556Carbon nanoparticles (about 50 nm)Hand lay-off25 wt% composite showed tensile stress of 338.75 MPa and flexural strength of 156 MPa[74]
3Homopolymer (HPP) Carbon particles (63 um, 150 um, 300 um, 425 um)Hand lay-offTensile strength, tensile modulus, flexural strength improved as loading wt% increased at 0, 10, 20, 30, 40%, but elongation at break and modulus of resilience decreased[75]
4Epoxy LY556Carbon shell and areca nut powderHand lay-upWater absorption capacity increased from fibre loading[76]
5Vinyl ester (VE) and super vinyl ester (SVE)Fibres of coconut shell powder and rice husk powderHand lay-upTensile strength increased for 10% loading and decreased for higher wt% loading; flexural strength increased for 15% loading, then decreased for higher loading[77]
6Epoxy resin Coconut shell particles (200 um, 300 um, 500 um)Hand lay-upFlexural strength 32.54 MPa
Impact strength 42.57 MPa
[78]
7Unsaturated polyester resinCoconut shell particlesHand lay-upTensile strength 70 MPa
Flexural strength 30 MPa
Flexural modulus 1700 MPa
Hardness 200 BHN
Impact strength 4.5 J
[79]
8Lapox B-11 epoxyCoconut shell particles (<150 um)Hand lay-upTensile strength 33.3 MPa[80]
Table 4. Hardness values of WAS carbon black and polymer composites [86].
Filler (wt%)Raw (MPa)Carbon Black 400 °C (MPa)Carbon Black 600 °C (MPa)Carbon Black 800 °C (MPa)
523.5823.9224.2624.85
1025.3025.9026.1026.50
1524.5526.5026.7026.90
2023.6025.3027.3027.50
Table 5. Synthesis and characterization of wood apple shell composites.
Sl No.Polymer MatrixCarbon MaterialMethodMechanical and Thermal TestReference
1Epoxy resin (AY 103)Wood apple shell powderHand lay-upTensile strength increased from 16 MPa to 42 MPa, flexural strength increased from 35 MPa to 65 MPa, hardness increased from 12 HV to 32 HV in 30 wt% loading of wood apple shell powder compared to neat epoxy[87]
2Lapox L-12 epoxyWood apple shell and coconut powderHand lay-up15 wt% coconut shell and wood apple shell powder composites showed good tensile and compressive properties, 3 wt% coconut shell and 27 wt% wood apple shell-loaded composites showed better flexural properties
Only 30 wt% wood apple shell-loading showed good results for impact strength tests
[88]
3Lapox L-12 epoxyWood apple shell and coconut powderHand lay-upHybrid composites showed better tensile and flexural properties, tensile strength of 42 MPa, flexural strength of 9 MPa[89]
Table 6. Mechanical properties of PVA and PVA–BC composites [96].
SampleTensile Modulus
(GPa)
Tensile Strength
(MPa)
Elongation at Break
(%)
Toughness
(MJ/m3)
PVA2.08 ± 0.2170.32 ± 2.914.6 ± 0.655.84 ± 0.21
PVA–MBC 3 wt%3.54 ± 0.52120.64 ± 4.36.93 ± 0.724.86 ± 0.2
PVA–MBC 5 wt%4.03 ± 0.3995.06 ± 3.15.98 ± 0.583.1 ± 0.25
PVA–MBC 10 wt%4.16 ± 0.4180.69 ± 4.44.85 ± 0.471.96 ± 0.19
PVA–MBC 3 wt%3.55 ± 0.16147.94 ± 3.910.14 ± 0.295.2 ± 0.11
PVA–MBC 5 wt%4.09 ± 0.25118.73 ± 4.87.22 ± 0.453.52 ± 0.11
PVA–MBC 10 wt%4.63 ± 0.1896.34 ± 4.14.96 ± 0.422.45 ± 0.13
Table 7. Synthesis characterization of polymer nanocomposites from bamboo particles.
Sl No.Polymer MatrixCarbon MaterialMethodMechanical and Thermal TestReference
1Polylactic acidBamboo charcoal (size 10 µm)Melt extrusion and injection mouldingTensile strength, flexural strength, and ductility index of composites increased by 43%, 99%, and 52%, respectively, compared to neat PLA[97]
2Polylactic acidBamboo charcoal (size 107.4 ± 9.8 nm)-Tensile strength (19.09 MPa) and elongation at break (369%) of 1 wt% nanofiller loaded composite were greater[98]
3Polylactic acidBamboo charcoal (size 700–800 nm)Solution casting 3 wt% loaded composite showed 70.2% and 71.6% enhancement in tensile modulus and tensile strength compared to neat PVA[99]
4Polylactic acidBamboo charcoal (size 20–76 nm and 18–65 nm)Solution castingElastic modulus 24 ± 4.2 GPa for semicrystalline phase (20–76 nm BC) and 11.4 ± 3.1 GPa for amorphous phase (18–65 nm BC)[100]
5UHMWPE-polyethyleneBamboo charcoal (size 10–50 µm)Melt blending and extrusionTensile strength increased from 18.7 to 61.2 MPa for 80 wt% loading of bamboo charcoal[101]
Table 8. Synthesis characterization of polymer nanocomposites from rice husk.
Sl No.Polymer MatrixCarbon MaterialMethodMechanical and Thermal TestReference
1Natural rubber (RSS1)Pyrolyzed rice husk particles (microsized)Composite vulcanizates prepared by hot pressing Reduction in particle size improved tensile strength by 44%, modulus by 18%, and tear strength by 9% compared to unmilled particles[108]
2PolylactideRice husk hydrocharMelt processingTensile modulus of composite enhanced from 2.63 GPa to 4.24 GPa for 15% reinforcement, storage modulus and loss modulus also effected by reinforcement[109]
3PHBVRice husk nano SiO2Hot press moulding Tensile strength increased by 33.65% and flexural strength increased by 15.54% compared to pure PHBV[110]
4Polyvinyl chlorideRice husk (149 µm) and basalt fibreMelt extrusion Structural strength is found to decrease with higher basalt fibre content, wear resistance and thermal stability enhanced[111]
5Polylactic acidRice husk powderHot and cold compression Tensile strength was not increased significantly, tensile modulus showed significant enhancement[112]
6PolypropyleneRice husk particles (0.420 mm)Extrusion and injection mouldingTensile strength increased up to 63% and flexural modulus increased up to 75% compared to neat PP[113]
Table 9. Ash and inorganic compounds of treated SCB biochar particles [121].
CompoundsSBB-72 hSBB-72 h-ABLrSBB-72 h-ABL
Ash (wt%)41.2233.3041.84
Si (wt%)10.648.7210.55
Fe (wt%)5.241.912.5
Al (wt%)2.391.922.3
Ti (wt%)0.870.740.93
K (wt%)0.760.130.16
Others (wt%)1.290.871.1
Table 10. Synthesis and characterization of sugarcane bagasse composites.
Sl No.Polymer MatrixCarbon MaterialMethodMechanical and Thermal TestReference
1RLDPF Carbonized and uncarbonized SCB particlesExtrusionTensile and bending strength increased about 20% for uncarbonized reinforced composites and 30% for carbonized reinforced composites[122]
2Natural rubberUntreated and alkali-treated SCB fibre Open chamber mixingAlkali-treated SCB fibres enhanced tensile strength by 98% and decreased hardness by 20%[123]
3PolypropyleneRaw SCB powderCompression mouldingTensile strength up to 14 MPa and flexural strength up to 2.5 GPa were obtained for composites[124]
4Polyvinyl chlorideMechanically treated SCB High-speed mixing and compression mouldingFlexural strength and tensile strength of reinforced composites were 33.4 MPa and 27 MPa, respectively[125]
5PolypropyleneSugarcane bagasseMelt extrusion followed by injection mouldingInteraction of sugarcane bagasse polymer improved with addition of silane, which resulted in enhancement of mechanical properties and crystallinity of polymer[126]
6PolypropyleneBagasse fibreHot pressingTensile strength decreased with addition of fibre compared to neat PP, flexural modulus increased with addition of sugarcane bagasse[127]
7PLASugarcane bagasseCo-rotating twin-screw extruderPresence of 2 wt% filler loading preheated residue exhibited maximum strength properties[128]
Table 11. Process parameters at different levels [135].
Process Parameter CodeProcess ParametersLevel 1Level 2Level 3
AWt% of GS nanoparticles102030
BWt% of PEG4812
CAnnealing temperature (°C)6080100
DAnnealing time (h)246
Table 12. Composite manufacturing parameters with formulation [135].
Exp. No.ABCDTensile Strength (MPa)
(Experimental)
Tensile Strength (MPa)
(Predicted Using ANOVA Model)
S110460259.9062.09
S210880465.7074.83
S310121006107.696.28
S4204806114.87111.58
S52080100277.8077.40
S6201260486.4490.14
S7304100464.2851.45
S830860658.2872.90
S9301280240.5038.71
Table 13. Synthesis and characterization of groundnut shell composites.
Sl No.Polymer MatrixCarbon MaterialMethodMechanical and Thermal TestReference
1Epoxy resin (EUXIT 50 KI)Groundnut shell powder microparticlesHand lay-upFlexural strength changed from 140 MPa to 160 MPa, flexural modulus changed from 2 GPa to 7.79 GPa, impact strength improved from 2.5 KJ/m2 to 7 KJ/m2, fracture toughness improved from 2.23 MPa.m1/2 to 7.07 MPa.m1/2[136]
2Epoxy resin (LY556)Groundnut shell powder microparticlesHand lay-upTensile strength was maximum for 15 wt% filler loading, about 23 MPa; flexural strength was maximum for 15 wt% filler loading composite, about 53 MPa; hardness increased as filler loading wt% increased[137]
3Polylactic acidGroundnut shell powder microparticlesSolvent mixingNanofibres with 5 wt% untreated GS particles showed ultimate tensile strength of 0.85 MPa[138]
4Epoxy resinGroundnut shell particles (mm)Hand lay-upHighest tensile strength, tensile modulus, and impact strength obtained for groundnut shell particles and epoxy proportion 60:40 and 0.55 mm particle size[139]
5Natural rubberGroundnut shell microparticlesCompression mouldingComposites reinforced with 0–45 µm particle showed good mechanical properties[140]
6PolypropyleneGroundnut shell microparticlesMelt extrusionHighest tensile strength of 17 MPa obtained for 6 wt% and 0.2 µm filler loaded composites, tensile modulus and flexural strength was high for 6 wt% and 0.2 µm particles[141]
Table 14. Tensile properties of CNS–epoxy composites [2].
Tensile PropertiesNeat Epoxy0.1% CNS–Epoxy0.25% CNS–Epoxy
Ultimate tensile strength (MPa)44.53 ± 3.145.64 ± 0.5358.6 ± 4.5
Modulus (GPa)2.28 ± 0.052.2 ± 0.0482.45 ± 0.035
Elongation (%)2.52 ± 0.132.55 ± 0.123.58 ± 0.52
Table 15. Synthesis and characterization of oil palm composites.
Sl No.Polymer MatrixCarbon MaterialMethodMechanical and Thermal TestReference
1Epoxy resin (DER 331)Oil palm empty fruit bunch nanofibresHand lay-upStorage modulus, loss modulus, and damping factor showed highest values for addition of 3 wt% nanofillers[150]
2Polyvinyl alcoholOil palm empty fruit bunch fibre-derived nanocelluloseSolution castingTensile strength and tensile modulus improved as filler loading enhanced until 5 wt%[151]
3PolyesterOil palm shell nanoparticlesHand lay-up3 wt% filler loaded composites showed physical, mechanical, and thermal properties[152]
4EpoxyOil palm empty fruit bunch nanofibresHand lay-up3% reinforced composites showed enhanced tensile and impact properties[153]
5Polyvinyl chlorideOil palm empty fruit bunch fibre-derived nanocelluloseHot pressingFlexural modulus increased and impact strength and flexural strength decreased [154]
6PolyethyleneOil palm empty fruit bunch fibresMelt blending and compression mouldingTensile strength increased by 95% by 20% fibre loading[155]
7EpoxyOil palm empty fruit bunch nanofibresHand lay-up3% fibre-loaded kenaf epoxy composites improved mechanical and morphological properties[156]
8PolyesterOil palm ashHand lay-upFlexural and tensile properties enhanced by increasing filler content in polymer matrix[157]
Publisher’s Note: MDPI stays neutral with regard to jurisdictional claims in published maps and institutional affiliations.

