Article

In Situ Growth of Exsolved Nanoparticles under Varying rWGS Reaction Conditions—A Catalysis and Near Ambient Pressure-XPS Study

1
TU Wien, Institute of Materials Chemistry, Getreidemarkt 9/165-PC, 1060 Vienna, Austria
2
TU Wien, USTEM, Wiedner Hauptstr. 8-10/E057-02, 1040 Vienna, Austria
*
Author to whom correspondence should be addressed.
Co-first authors.
Catalysts 2021, 11(12), 1484; https://doi.org/10.3390/catal11121484
Submission received: 10 November 2021 / Revised: 1 December 2021 / Accepted: 2 December 2021 / Published: 3 December 2021

Abstract

:
Perovskite-type oxides are highly flexible materials that show properties that are beneficial for application in reverse water-gas shift processes (rWGS). Due to their stable nature, the ability to incorporate catalytically active dopants in their lattice structure, and the corresponding feature of nanoparticle exsolution, they are promising candidates for a materials design approach. On an industrial level, the rWGS has proven to be an excellent choice for the efficient utilisation of CO2 as an abundant and renewable carbon source, reflected by the current research on novel and improved catalyst materials. In the current study, a correlation between rWGS reaction environments (CO2 to H2 ratios and temperature), surface morphology, and catalytic activity of three perovskite catalysts (Nd0.6Ca0.4Fe0.9Co0.1O3-δ, Nd0.6Ca0.4Fe0.97Co0.03O3-δ, and Nd0.6Ca0.4Fe0.97Ni0.03O3-δ) is investigated, combining catalytic measurements with SEM and NAP-XPS. The materials were found to react dynamically to the conditions showing both activation due to in situ nanoparticle exsolution and deactivation via CaCO3 formation. This phenomenon could be influenced by choice of material and conditions: less reductive conditions (larger CO2 to H2 or lower temperature) lead to smaller exsolved particles and reduced carbonate formation. However, the B-site doping was also important; only with 10% Co-doping, a predominant activation could be achieved.

Graphical Abstract

1. Introduction

A major challenge of this century is the replacement of fossil fuels with renewable alternatives. Along this line, the role of CO2 with its major contribution to the greenhouse effect is changing from unwanted waste to a sustainable carbon source which is readily available. However, catalytic activation is essential since, due to the stable nature of the molecule [1], a rather high energy input is still required. The combination of primary renewable energy (e.g., wind, solar, geothermal, etc.) with catalytic transformation of CO2 into storable fuels offers a way to setup closed carbon cycles, reducing emissions of “additional” CO2, and, subsequently, mitigate global warming [2]. Methanol and synthetic hydrocarbons are prominent examples for the transformation of CO2 into storable fuels on an industrial level [3,4].
Catalytic reactions which are capable of efficiently converting CO2 to synthetic fuels (or their precursors, e.g., CO) are syngas synthesis from methane dry reforming (MDR) [5], direct hydrogenation of CO2, and reverse water-gas shift reaction (rWGS) [6]. One of the major drawbacks of MDR are sintering and coke formation due to the relatively high operation temperatures [7]. Regarding methanol synthesis, direct CO2 hydrogenation is thermodynamically more favourable than rWGS [8]; however, 20% higher methanol yields are reported when using rWGS and CO (as indirect route) [6]. In addition, rWGS is an important process in high CO2 feed Fischer-Tropsch reactors [9] and a key step in the selective methanation of CO2 [10]. This makes rWGS an essential reaction for the utilisation of CO2.
The rWGS reaction is an endothermic equilibrium process, preferentially performed at high temperatures (cf. Equation (1)). Methanation is the favoured pathway at lower temperatures [6] and the equilibrium lies on the side of the water-gas shift reaction (i.e., reverse of Equation (1)).
H 2 + CO 2     CO + H 2 O               Δ r H ° 298 = 42.1   kJ   mol 1
Due to the high interest in rWGS, numerous studies have focused on improving existing rWGS catalysts or finding and designing new ones. Metal catalysts, for instance platinum [11], rhodium [12], or copper [13] on supports are intensively investigated materials. While copper-based catalysts offer advantages such as reduced operating temperature and lower prevalence of methanation, supported platinum catalysts exhibit higher CO2 conversion. Platinum, however, displays lower selectivity towards CO and is more cost intensive [6]. Alternatively, cobalt- [14] and nickel-based [15] materials, as well as bimetallic systems [16] were studied. One of the most crucial factors for large scale industrial applications is the utilisation of cheap and abundant catalyst materials, as high cost is a major constraint of using noble metals [17,18]. Pastor-Perez et al. reported high CO2 conversions and full CO selectivity at various reaction conditions for doped FeCu catalysts [19]. Wang et al. found high catalytic activity for the catalytic system Ni/CeO2, which could be attributed to finely dispersed Ni combined with oxygen vacancies in the lattice of the oxide support [15]. In addition, the effect of promoting elements was investigated extensively, e.g., Chwen et al. [20] studied the beneficial effect of potassium doping on catalytic activity. Due to their cheap and abundant nature, multiple studies have assessed the performance of perovskite-based rWGS catalysts: Daza et al., for instance, investigated cobalt-based perovskites [21], while Kim et al. evaluated barium zirconate-based materials [22]. In terms of industrial applications, iron-based catalysts are among the most promising materials with the advantages of high oxygen mobility and thermal stability [23,24]. Furthermore, the enhanced oxygen mobility of reducible oxides prevents coking in rWGS [25].
Perovskite-type catalysts open up innumerable possibilities for catalyst design due to the broad compositional flexibility (different A and B cations can be combined in the lattice) and the many doping options of both A- and/or B-site with catalytically highly active elements [26]. Additionally, a solid basic knowledge exists for many perovskites, especially as their application is popular in a wide range of fields (e.g., catalysis, fuel cell technology, solid state electrochemistry) [27,28,29,30,31,32,33]. Many perovskites are tailored to applications at high temperatures (solid oxide fuel cells operate between 600 °C and 900 °C), resulting in excellent thermal stability.
A further outstanding ability of perovskites that attracts much attention, especially in the catalysis community, is nanoparticle exsolution [34]. In reducing reaction environments, either via reductive pre-treatment or under reaction conditions, lattice cations are reduced and start to migrate to the surface where they form metallic nanoparticles. In the case of doped perovskites, the more easily reducible cations are preferentially exsolved [26]. Doping the host lattice with catalytically highly active elements opens the possibility of in situ growth of active nanoparticles on the surface [28]. Compared to standard catalyst preparation methods, exsolution leads to more finely dispersed particles [34,35,36] which exhibit improved sintering stability during catalytic reactions [37]. Thus, perovskites offer a solution to a major issue of most rWGS catalysts: severe reduction of active surface area, and, subsequently, catalytic activity that is caused by continuing particle growth at high temperatures [17].
For the aforementioned reasons, the materials that were chosen for the present study were perovskite oxides with an iron-based B-site (stability and oxygen mobility) and cobalt- or nickel-doping (easily reducible and catalytically active elements); Nd0.6Ca0.4Fe0.9Co0.1O3-δ, Nd0.6Ca0.4Fe0.97Co0.03O3-δ, and Nd0.6Ca0.4Fe0.97Ni0.03O3-δ were used. The main reason for the use of Nd compared to the otherwise similar, but cheaper La, was the overlap of La and Ni signals in X-ray photoelectron spectroscopy (XPS), which would complicate the intended characterisation with this method. The doping of the A-site with Ca improves the defect properties of the materials (oxygen vacancies, oxidation states of the B-site cations), which is beneficial for catalysis [38].
The solid-state electrochemistry community intensively investigated mechanisms for nanoparticle exsolution from perovskites [34,39,40,41,42,43,44,45,46], but mainly with a focus on reductive treatment (e.g., in H2). There is still a shortage of studies on in situ growth of nanoparticles under reducing reaction conditions. Therefore, the influence of the gas composition of the rWGS reaction (i.e., different ratios of CO2 and H2) on the exsolution properties and the material surface structure, as well as the effect of temperature and the role of different B-site doping have been investigated, combining catalytic characterisation, scanning electron microscopy (SEM) and near ambient pressure-XPS (NAP-XPS).

2. Results and Discussion

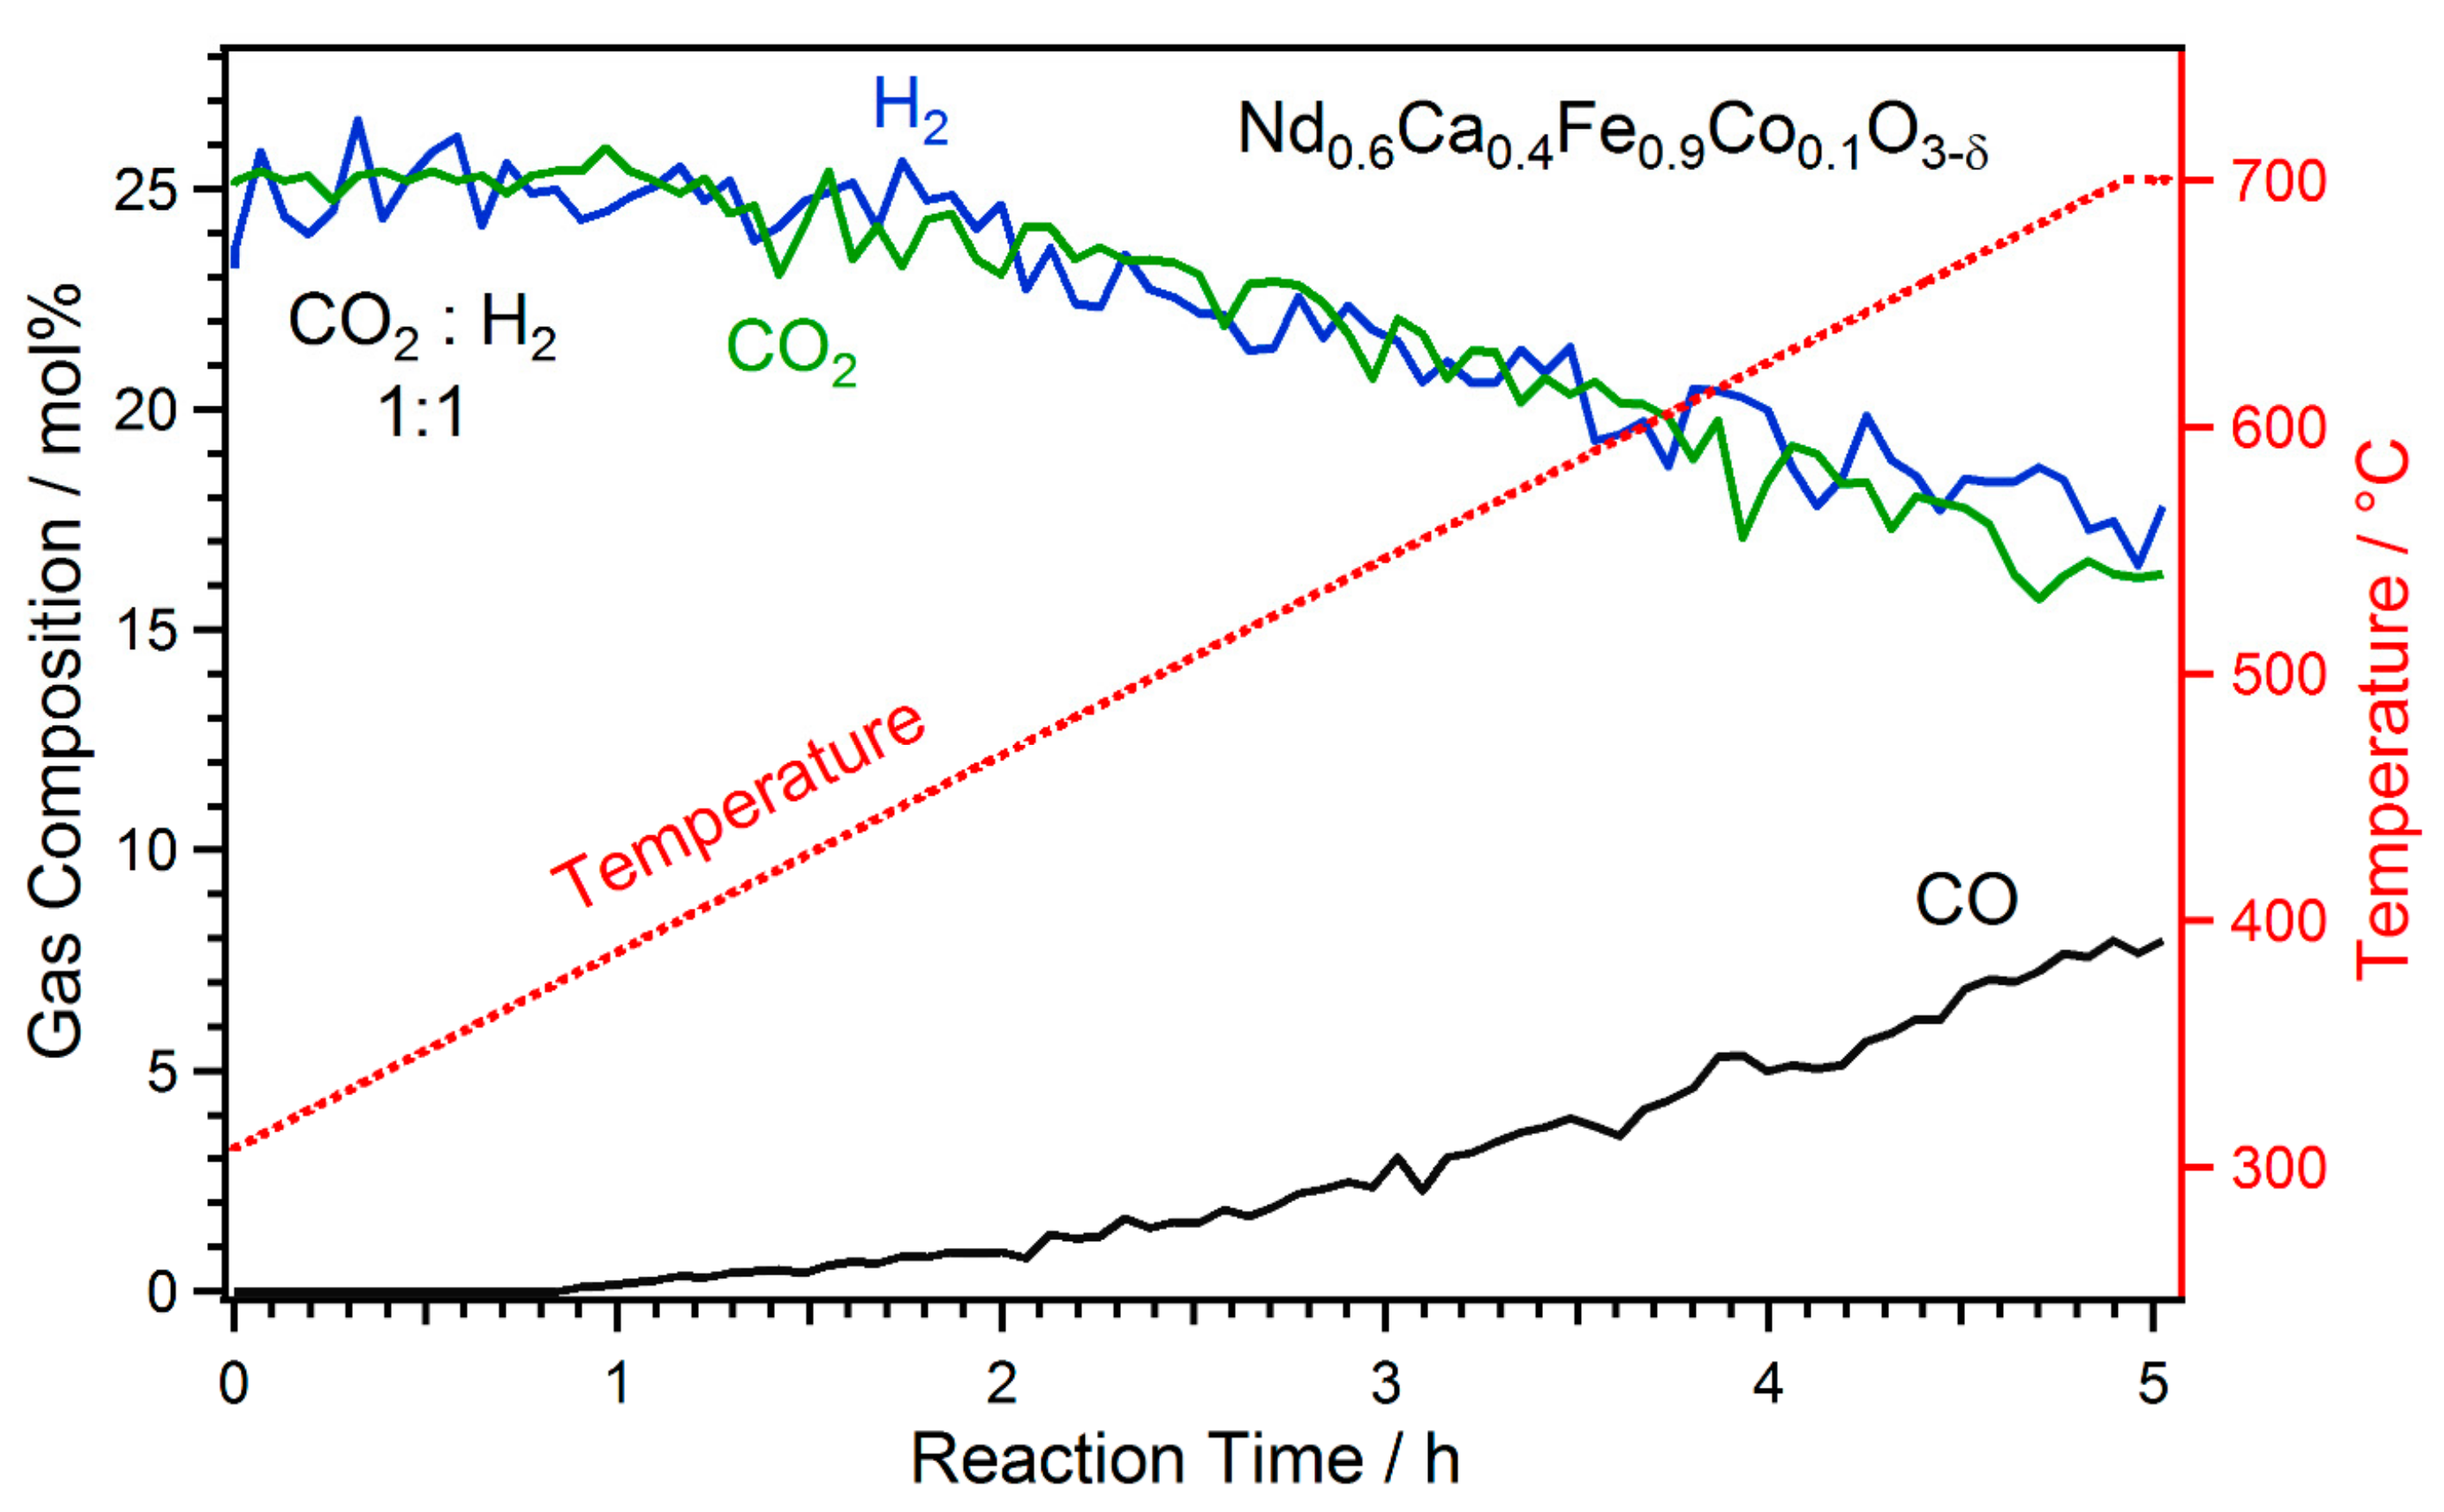
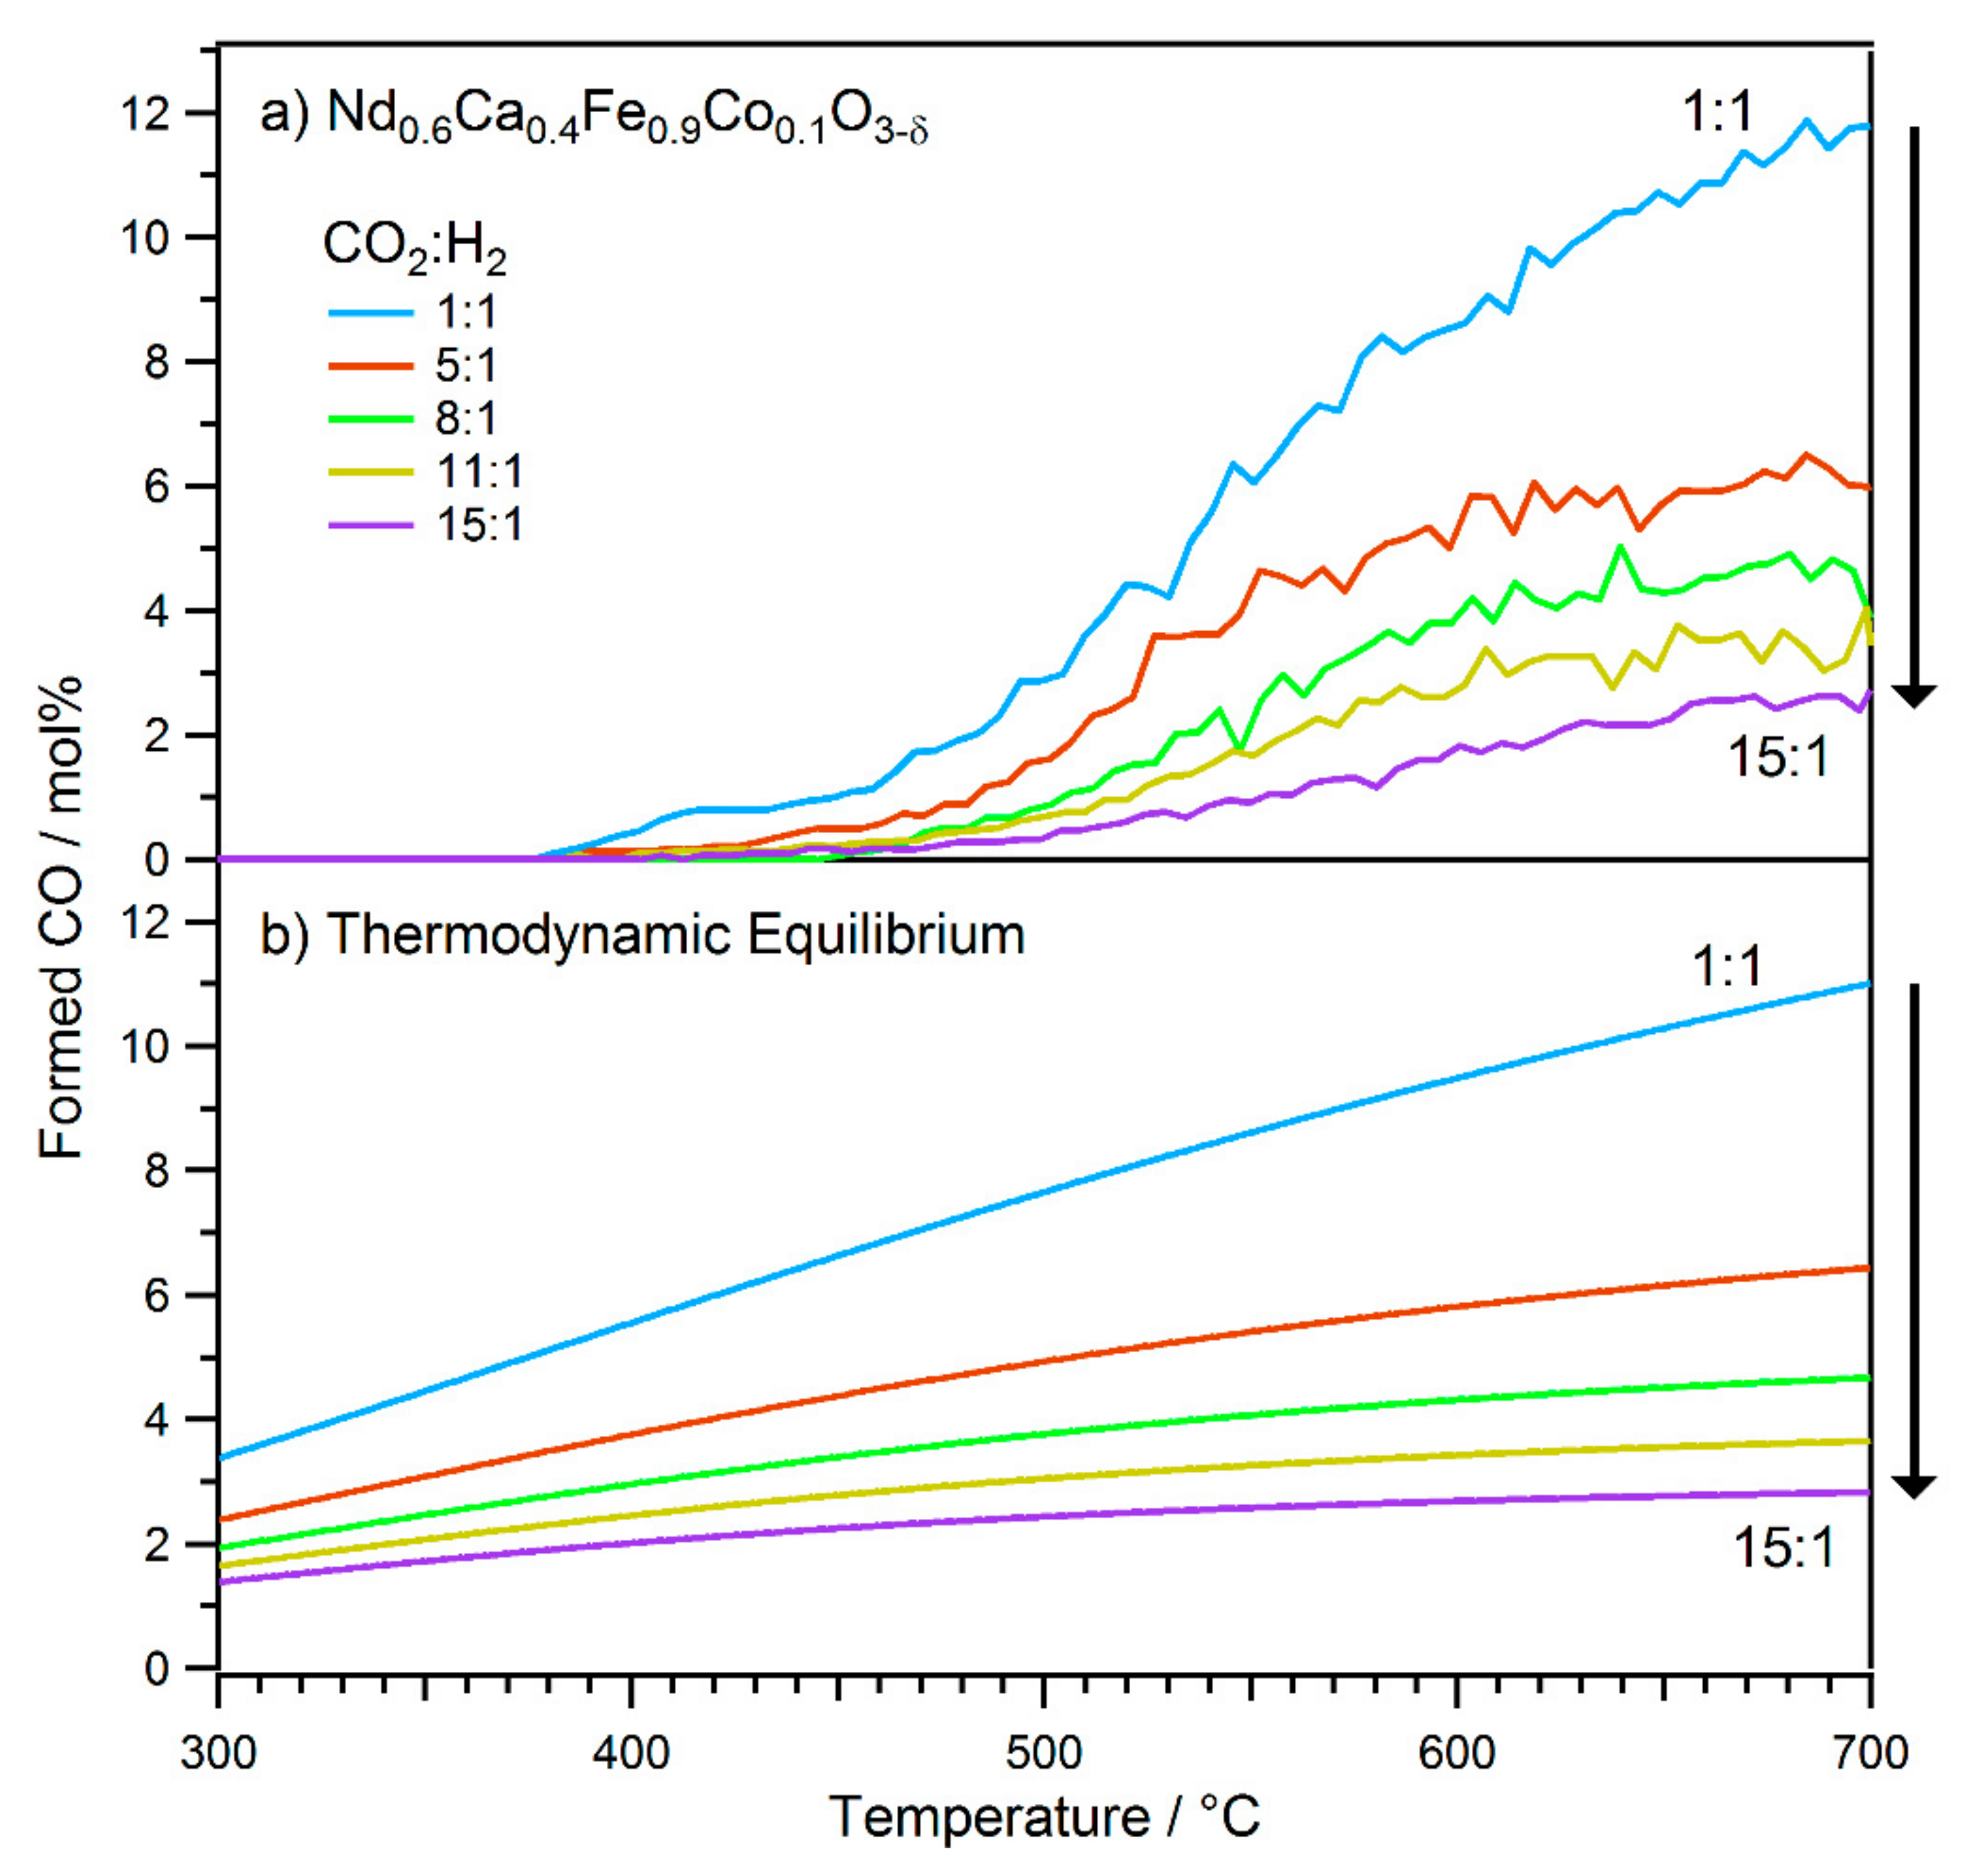
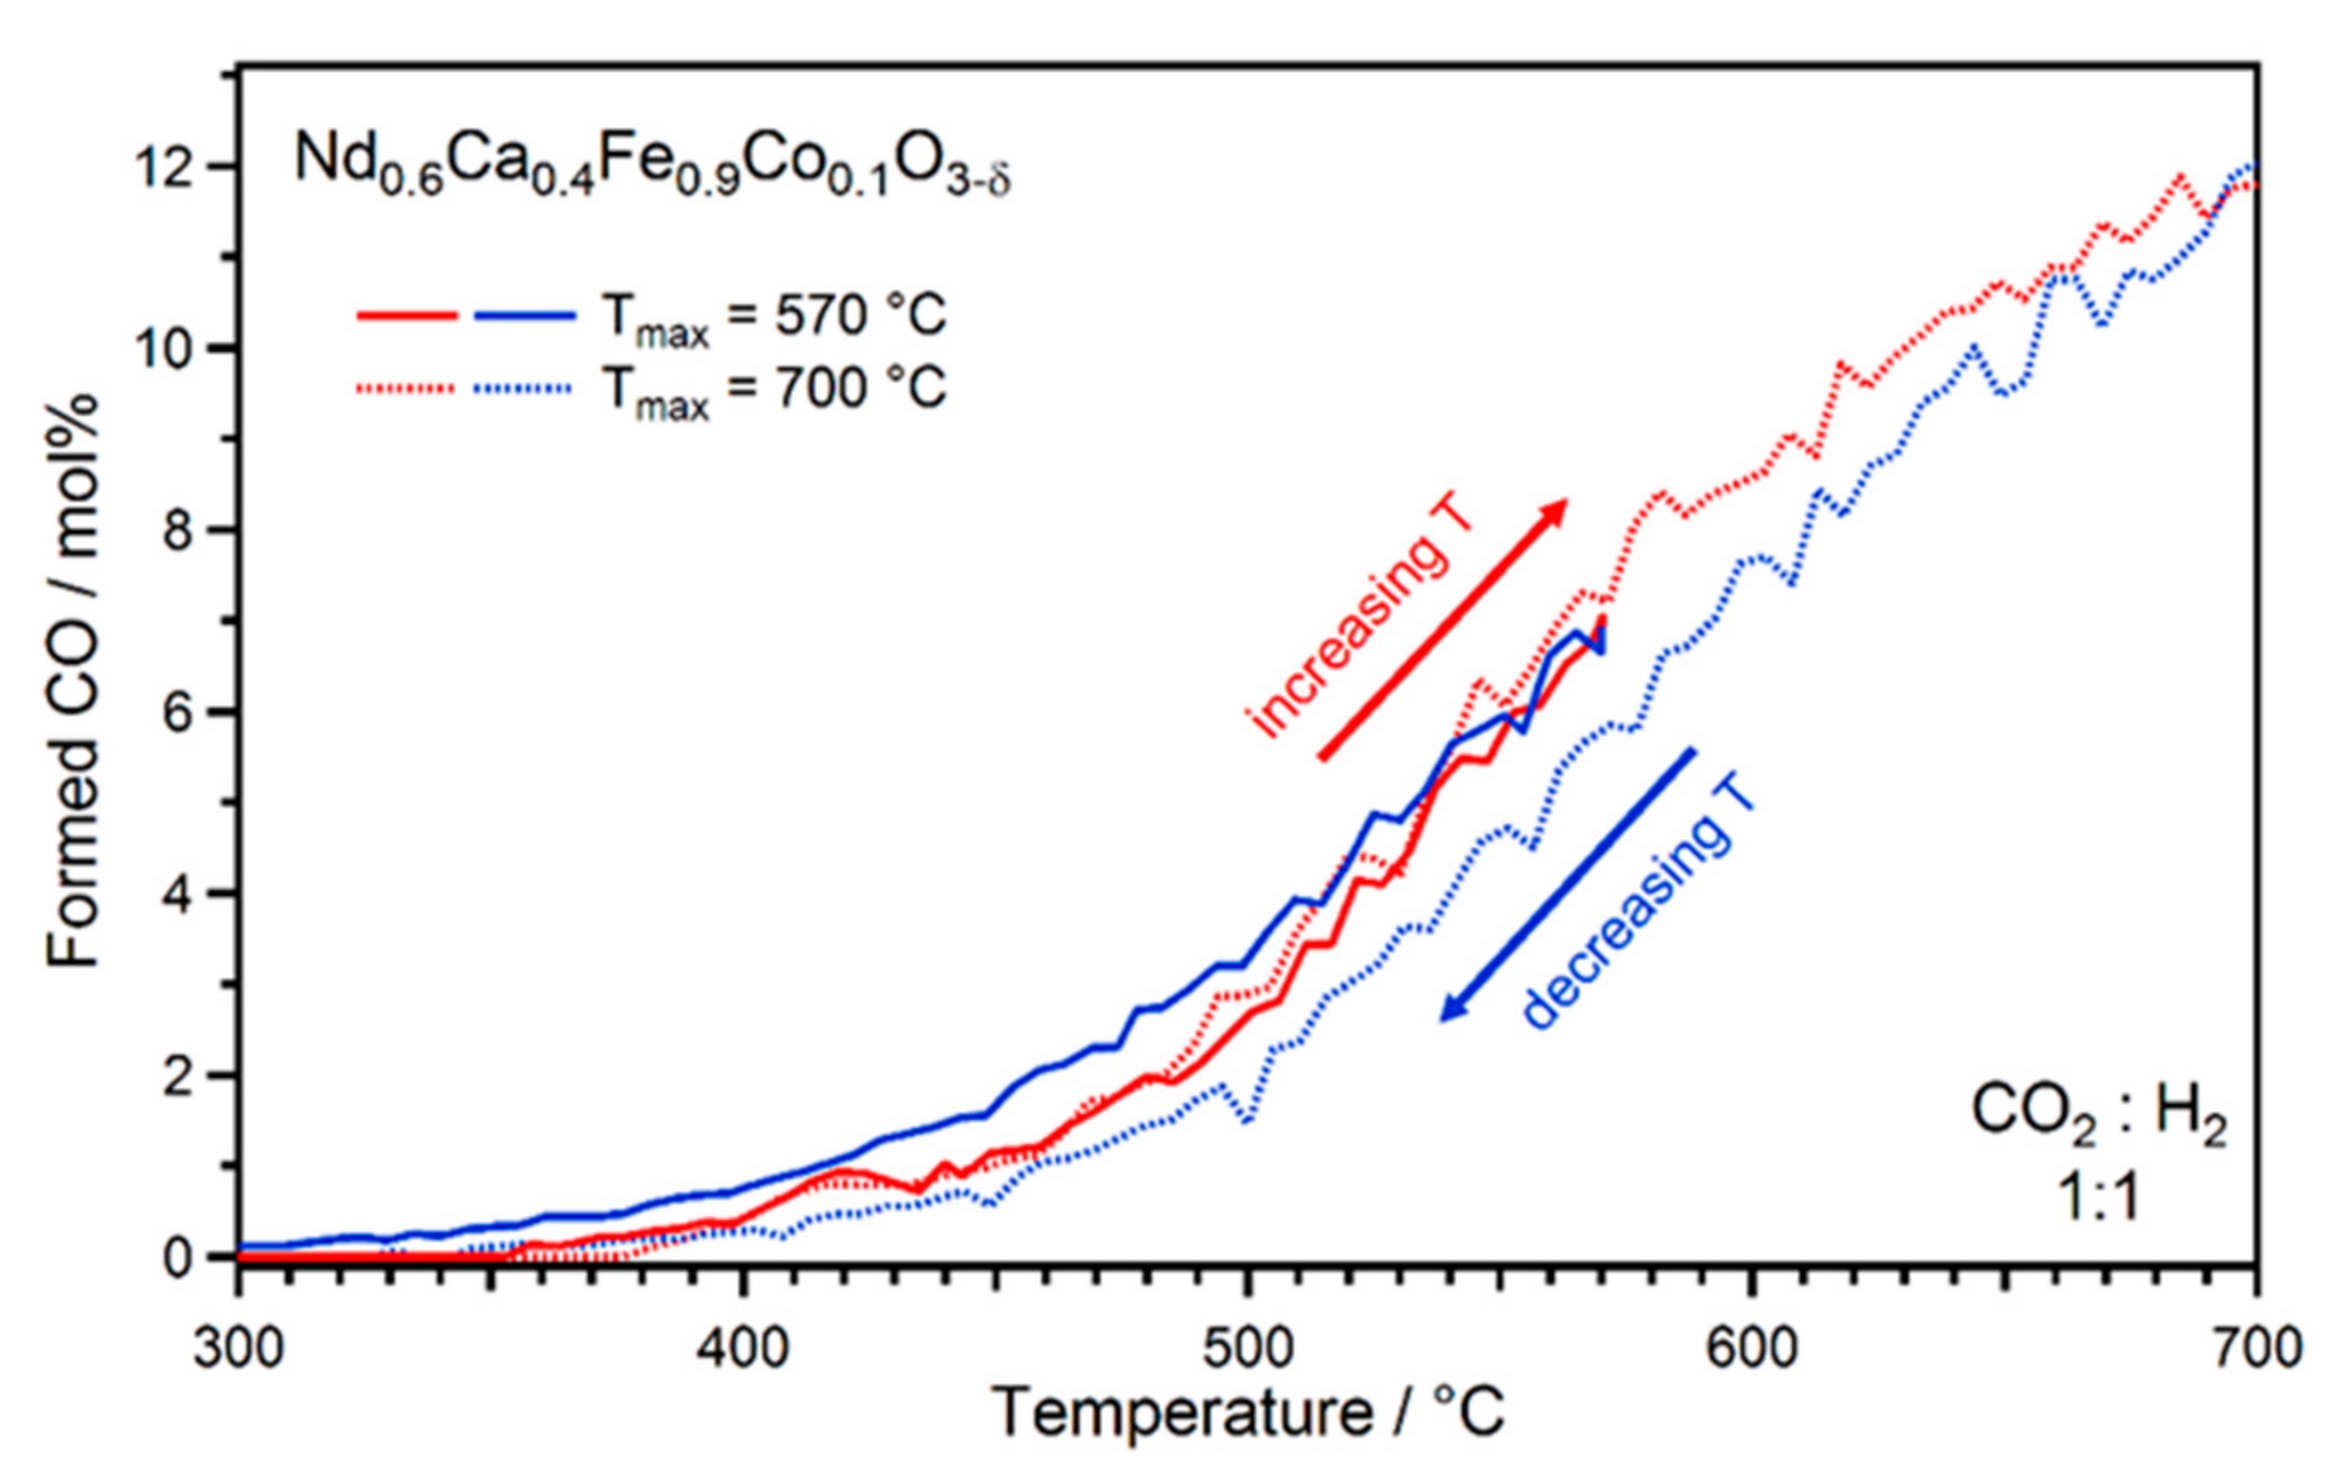
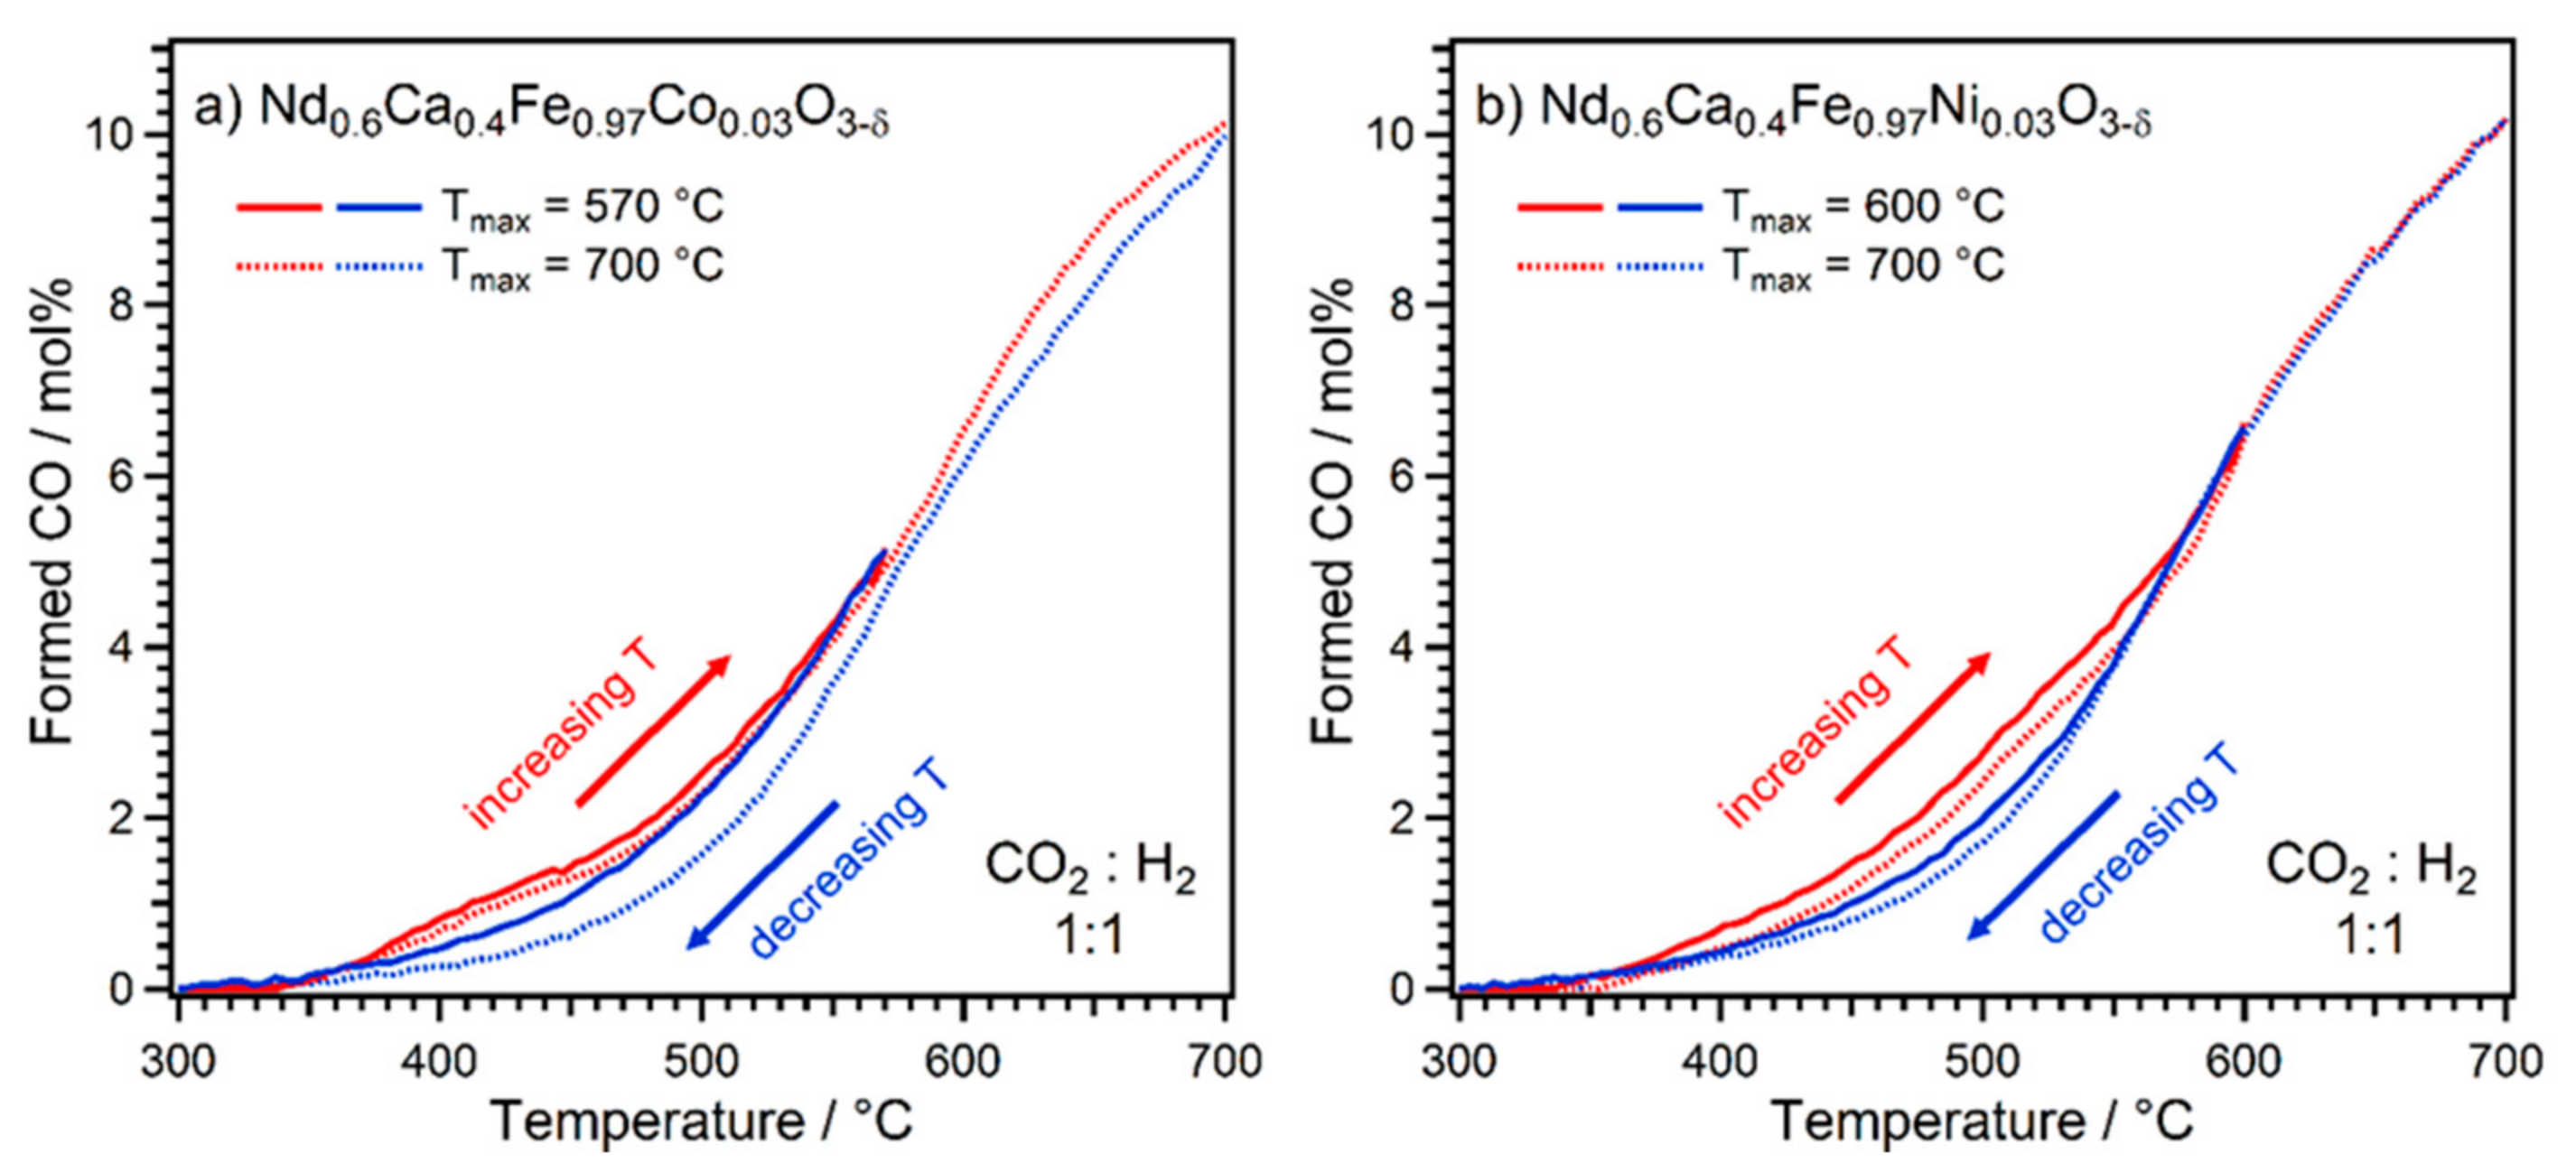
2.1. Exsolution Induced by rWGS

For all of the catalytic measurements, after initial oxidation (guaranteeing identical starting conditions), the gas environment was changed to reaction conditions after the system was cooled down to 300 °C in O2. Subsequently, the temperature program for the respective experiment was initiated. For the first set of experiments, Nd0.6Ca0.4Fe0.9Co0.1O3-δ was used and the CO2 to H2 ratio was varied between 1:1 and 15:1 (in all cases 50% Ar were added as carrier gas). During the reactions, the temperature was increased with a linear heating ramp of 80 °C h−1. Figure 1 depicts the obtained catalytic data in the temperature range of 300 °C to 700 °C for rWGS with a 1:1 ratio of CO2 and H2. Here, only ~5 mg of catalyst were used, resulting in low conversions and no thermodynamic limitations.
The onset of CO formation could be observed at 375 °C with a slowly increasing rate. In the temperature region from 500 °C to 600 °C the CO formation rate increase steepened, which was caused by nanoparticles forming on the surface [26]. A decrease of the reactants CO2 and H2 was evident alongside the increasing CO formation.
During the actual measurement series, the experiment that is described above was performed repeatedly, each time using fresh catalyst (~20 mg catalyst, including pre-oxidation), and a different ratio of CO2 to H2. The results are summarised in Figure 2 (top), where they are shown compared with the calculated thermodynamic equilibrium values (Figure 2, bottom).
All of the measurements revealed similar behaviour compared to the run with reduced catalyst amount (Figure 1). There was no initial CO formation and an onset around 400 °C, followed by a slow increase of the detected CO amount with temperature. Between ~500 °C and ~600 °C, the slopes steepened, which can be interpreted as an activation process of the catalyst due to nanoparticle exsolution again. In the final temperature range (~600 °C to ~700 °C), the curves flattened due to thermodynamic limitations of the rWGS reaction. In fact, for all educt gas mixtures, the product compositions at 700 °C corresponded to the rWGS equilibrium conditions. Here, the thermodynamic limit was reached even though the amount of used catalyst was small. In accordance with these thermodynamic boundaries, with increasing partial pressure of CO2 (and subsequent decreasing H2 partial pressure), the amount of formed CO at 700 °C decreased. The most pronounced drop in CO formation was observed between the ratios 1:1 and 5:1 due to the high difference in partial pressure between the ratios. When increasing the CO2 partial pressure further, the differences in equilibrium composition and thus CO formation at 700 °C were smaller.
A further difference was found when looking at the activation process. This steepening of the curve began at lower temperatures for mixtures with a higher H2 content, and, consequently, led to the equilibrium conditions being reached at lower temperatures as well (visible by the flattening of the curve). As has been shown by Gines et al., the kinetics of the rWGS strongly depends on the CO2/H2 ratio [47]. Dissociative CO2 adsorption is the rate-limiting step for H2-rich conditions, whereas in the case of H2-lean conditions, the formation of water is rate limiting for redox mechanisms. Consequently, the reaction order changes with the partial pressure of the reactants as well [47]. In the case of the investigated perovskite, decreasing the partial pressure of H2 led to reduced water formation and, as a consequence, to a lower number of oxygen vacancies at the surface (as adsorbed hydrogen reacts with surface oxygen of the perovskite lattice, leaving vacancies behind) [21]. These vacancies have been found to be the active site for CO2 activation and subsequent CO formation [48]. The higher number of oxygen vacancies in a more H2-rich mixture is the reason for the observed activation at lower temperatures, as this vacancy formation is also the first step towards B-site element exsolution. The activation is then a consequence of better H2 activation at exsolved Co sites and a high amount of oxygen vacancies for CO2 activation. The onset temperatures for CO formation were found between 400 °C and 450 °C for most CO2/H2 ratios, but no clear trend could be observed here.
The focus of this investigation was to determine whether exsolution indeed continues to occur with decreasing H2 partial pressure. For this purpose, SEM images after the catalytic reactions were recorded. Figure 3 highlights the obtained results for the CO2 to H2 ratios of 1:1 and 15:1, showcasing two different sample positions in each case and including histograms of the particle size distribution for a selected area (red cut-out). Image processing was restricted to regions of the images with homogeneous background brightness. More images and particle analyses are presented in the Supplementary Materials (Figure S1 and Table S1). In general, as the powder samples were not completely homogeneous, different surface morphologies with different particle coverages were present within the same sample. Nonetheless, the trends that are discussed here are still justified considering all obtained images.
For both gas ratios, the formation of nanoparticles by exsolution could be observed (bright particles in Figure 3b−d,f). Particle analyses (histograms in Figure 3e,g) gave mean particle diameters of 38 nm and 30 nm, as well as particle coverages of 44 and 48 particles per µm2 for the 1:1 and 15:1 ratios, respectively. Both histograms indicate mostly log-normal (right-skewed) distributions.
These particles result from the exsolution of the B-site dopant (Co), as could be shown in previous work [26]. Astonishingly (and contrary to the expectations), nanoparticle exsolution could be triggered even at low H2 partial pressures due to the easy reducibility of the B-site dopant. However, the particle analyses showed that in the milder reducing conditions at a gas ratio of 15:1 the resulting particles were smaller and more densely distributed (a very dense particle coverage of the surface is visible in Figure 3c). The occurrence of nanoparticles for all of the gas ratios justifies the aforementioned interpretation of the activation process due to exsolution. It makes the investigated material particularly interesting for industrial applications as exsolution can be achieved over a wide range of reactant gas compositions (i.e., from H2-rich to H2-lean conditions).
Furthermore, the surface morphology has changed after the reaction, as evidenced by bigger crystallites on the surface in Figure 3b,c. EDX point scans (not shown) revealed that these crystallites can be attributed to the formation of CaCO3 during rWGS reaction. This CaCO3 occurred at all gas ratios. The Ca segregation is a consequence of the imbalance between A- and B-site cations in the perovskite lattice after exsolution of the B-site element as it re-establishes stoichiometry. Unlike the perovskite surface, the CaCO3 was not covered with nanoparticles, thus it effectively reduced the available highly active surface area.
To further prove that the formed nanoparticles were enhancing the rWGS activity, a set of double ramp experiments was conducted on Nd0.6Ca0.4Fe0.9Co0.1O3-δ with a CO2 to H2 ratio of 1:1 (and again 50% Ar). First, the catalytic activity of the material was monitored during a linear ramp from 300 °C to 700 °C (using a heating rate of 80 °C h−1) and a second temperature ramp cooling back down to 300 °C, as displayed in Figure 4 (dotted lines). Assuming an enhancement of the rWGS activity by exsolved nanoparticles (as soon as in situ exsolution occurred at high reaction temperatures with sufficient cation mobility), a hysteresis should be visible, i.e., the activity should be shifted to higher values during cooling. Should the formed nanoparticles not affect the activity, no differences would be expected between heating and cooling. However, the results clearly show lower activities during cooling. Structural changes of the surface, which are visible in Figure 3b, are the reason for the lower activity upon cool-down. In particular, the formation of the bigger CaCO3 crystallites reduced the active surface area and, consequently, the catalytic activity. Both the formation of an exsolved metallic bcc phase and of CaCO3 could be proven with X-ray diffraction (XRD, Figure S3) measurements after the experiment.
To avoid these pronounced changes of the catalyst surface at high temperatures, a second experiment was performed with a lower end temperature of 570 °C. It is known from previous experiments that this temperature is sufficient for nanoparticle exsolution, while other surface changes should still be relatively minor [38]. Indeed, the results in Figure 4 (full lines) corroborate this, again showing a hysteresis when lowering the reaction temperature. However, in this case higher activities were found after nanoparticle exsolution. Furthermore, XRD measurements after the cooling ramp (Figure S3) revealed reduced amounts of both the metallic bcc phase and CaCO3 compared to the ramp up to 700 °C. With this experiment, the promoting effect of nanoparticles that were formed in situ could be confirmed. An overview of such enhancement of catalytic activity is also given in the work of Zhang et al. [49].
After the double ramp experiments, SEM imaging was again conducted to check for the formation of nanoparticles. In Figure 5 (Figure S2, for more images), finely dispersed nanoparticles on the surface were indeed visible. Furthermore, particle analysis (Table S2 gives further details) revealed a mean particle diameter of 14 nm with a maximum of 34 nm and a surface coverage of 77 particles per µm2. These particles were smaller and more densely distributed compared to those that were observed before for a 1:1 ratio, after the ramp up to 700 °C (Figure 3, mean diameter of 38 nm and 44 particles per µm2). No formation of bigger CaCO3 crystallites or other structural surface modifications were observed for this second experiment. Therefore, the exsolution conditions were preferable at the lower temperature.
To gain further insights into the influence of B-site doping, the double ramp experiments with a gas ratio of 1:1 were repeated with the two perovskites Nd0.6Ca0.4Fe0.97Co0.03O3-δ and Nd0.6Ca0.4Fe0.97Ni0.03O3-δ, which have a reduced amount of 3% B-site dopant (Figure 6). In the case of the Co-doped material, the same maximum end temperatures were chosen as with 10% doping. For the Ni-doped perovskite, an end temperature of 600 °C was used (instead of 570 °C), as the preliminary experiments indicated that higher temperatures are necessary to trigger sufficient exsolution.
Surprisingly, decreased B-site doping appeared to lead to deactivation in all of the cases upon cool-down. A possible explanation for this different behaviour can be based on the two observed processes (nanoparticle exsolution and CaCO3 formation) counteracting each other. In the material with the higher doping amount, more pronounced exsolution can occur which subsequently outweighs the deactivation if the conditions (end temperature) are chosen properly. For the materials with 3% doping, the activation due to exsolution is not sufficient to compensate the deactivation via CaCO3 formation.
Additional differences between the Co- and Ni-doping were observed as well.
For Co, the end temperature made a clear difference. The activity during cool-down was lower at all temperatures compared to the heating ramp when going up to 700 °C, indicating ongoing deactivation at high temperatures. Consequently, the difference between heating and cooling was larger in the lower temperature range, compared to the ramp with an end temperature of 570 °C. For the latter, the deactivation was only very small. This is supported by the XRD results after the experiment (Figure S4), which showed the same phases as for the material with 10% doping, and more of them after the double ramp with a higher end temperature. However, the 110 reflex of the bcc phase was slightly shifted compared to the case of 10% doping. This is an indication of a more Fe-rich alloy forming with 3% doping, which explains the less pronounced activation effect, as Fe is less catalytically active towards rWGS than Co.
In the case of Ni doping, the end temperature did not play a significant role; the two ramps show almost identical CO formation. Furthermore, the heating and cooling ramps in the range between 600 °C and 700 °C overlapped exactly. In the case of Ni-doping, XRD after the ramps (Figure S5) revealed, aside from CaCO3 formation, a metallic fcc (main component Ni) and a metallic bcc phase (main component Fe). The amounts of these phases did not differ a lot after the two double ramp experiments with different end temperatures, in accordance with the observed similar catalytic activity. These results indicate that Nd0.6Ca0.4Fe0.97Ni0.03O3-δ is relatively stable under rWGS conditions in the temperature range between 600 °C and 700 °C.

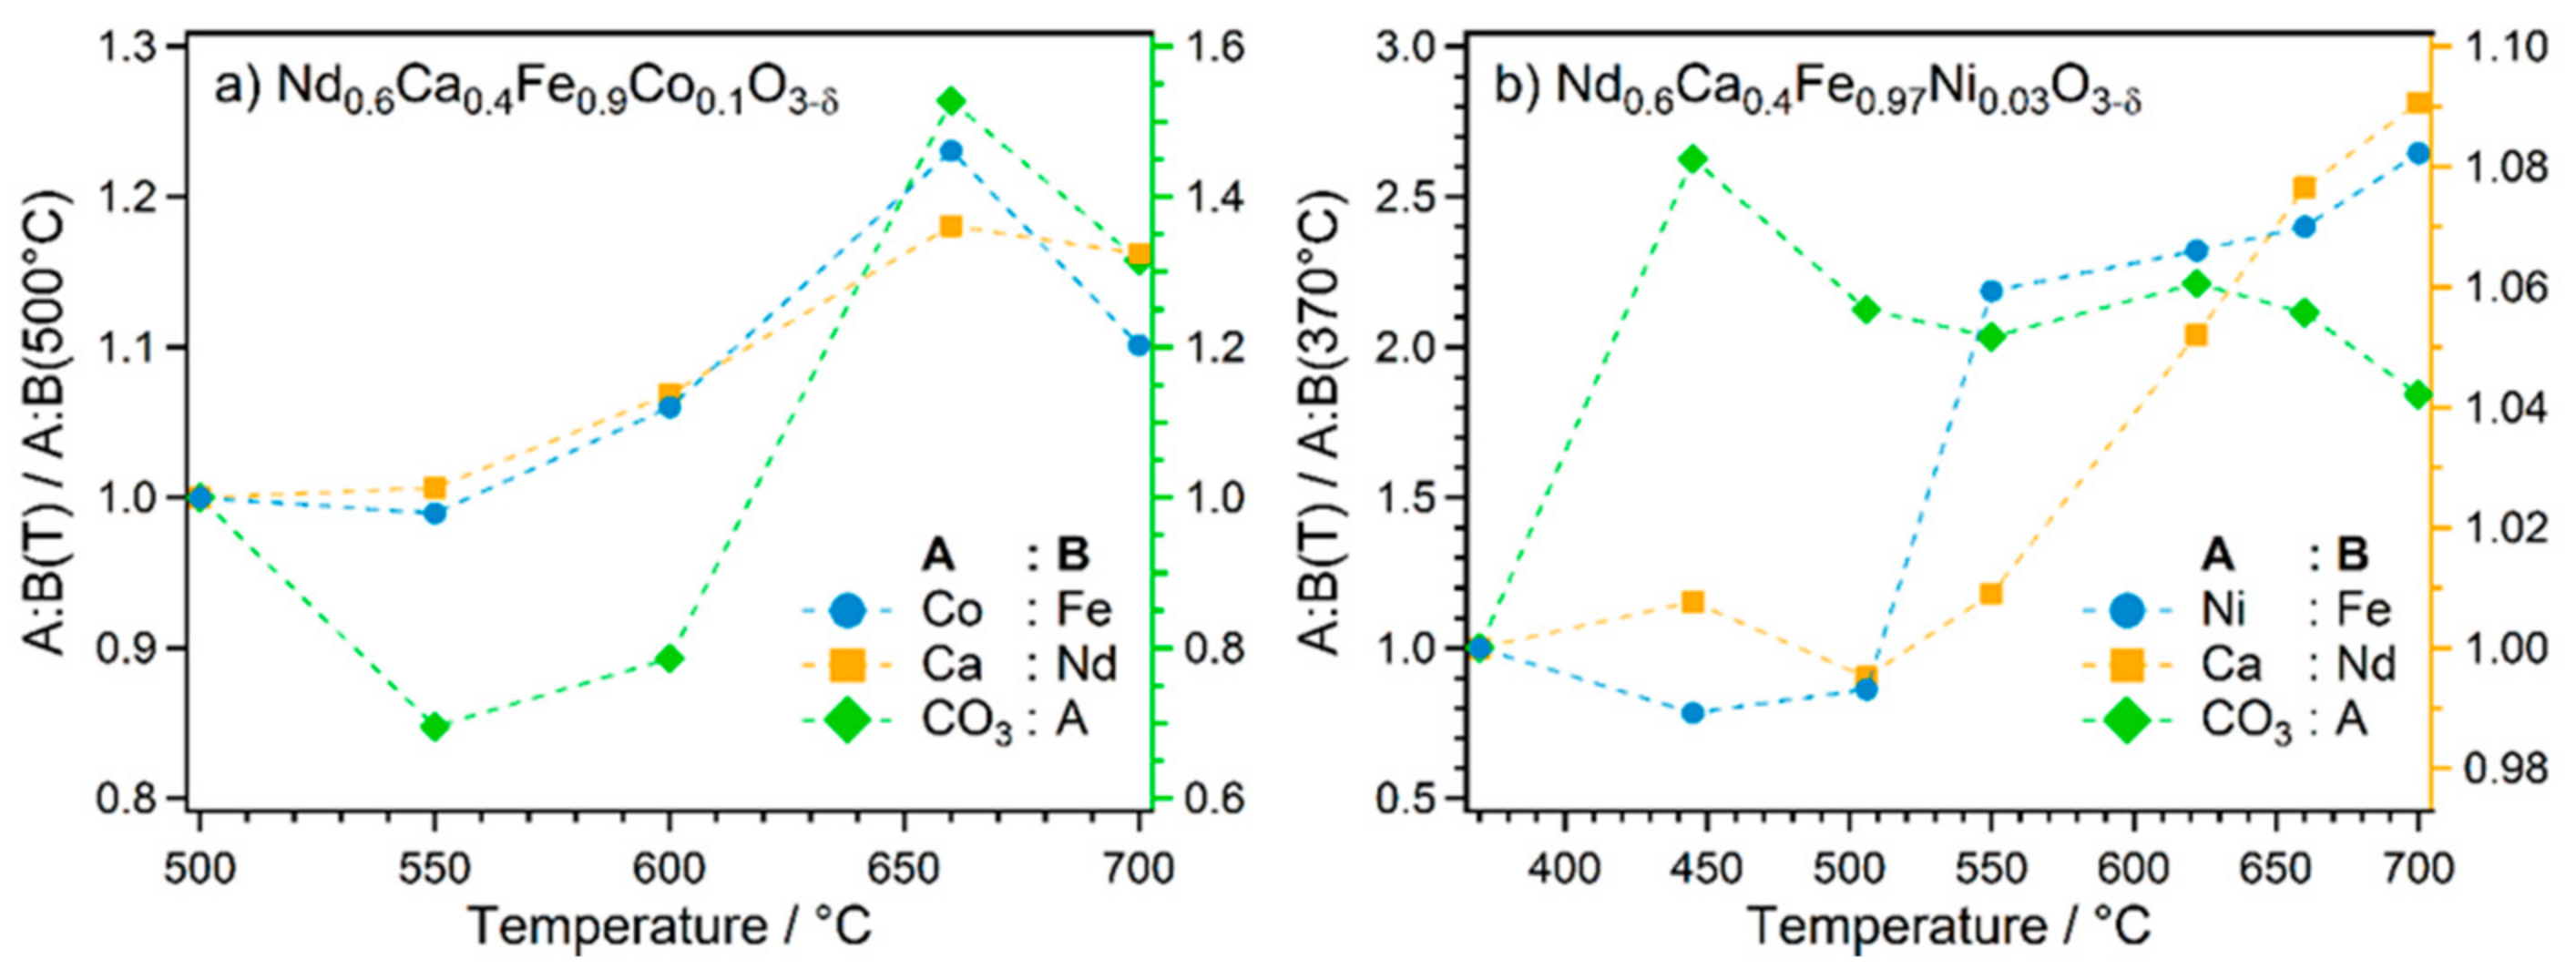
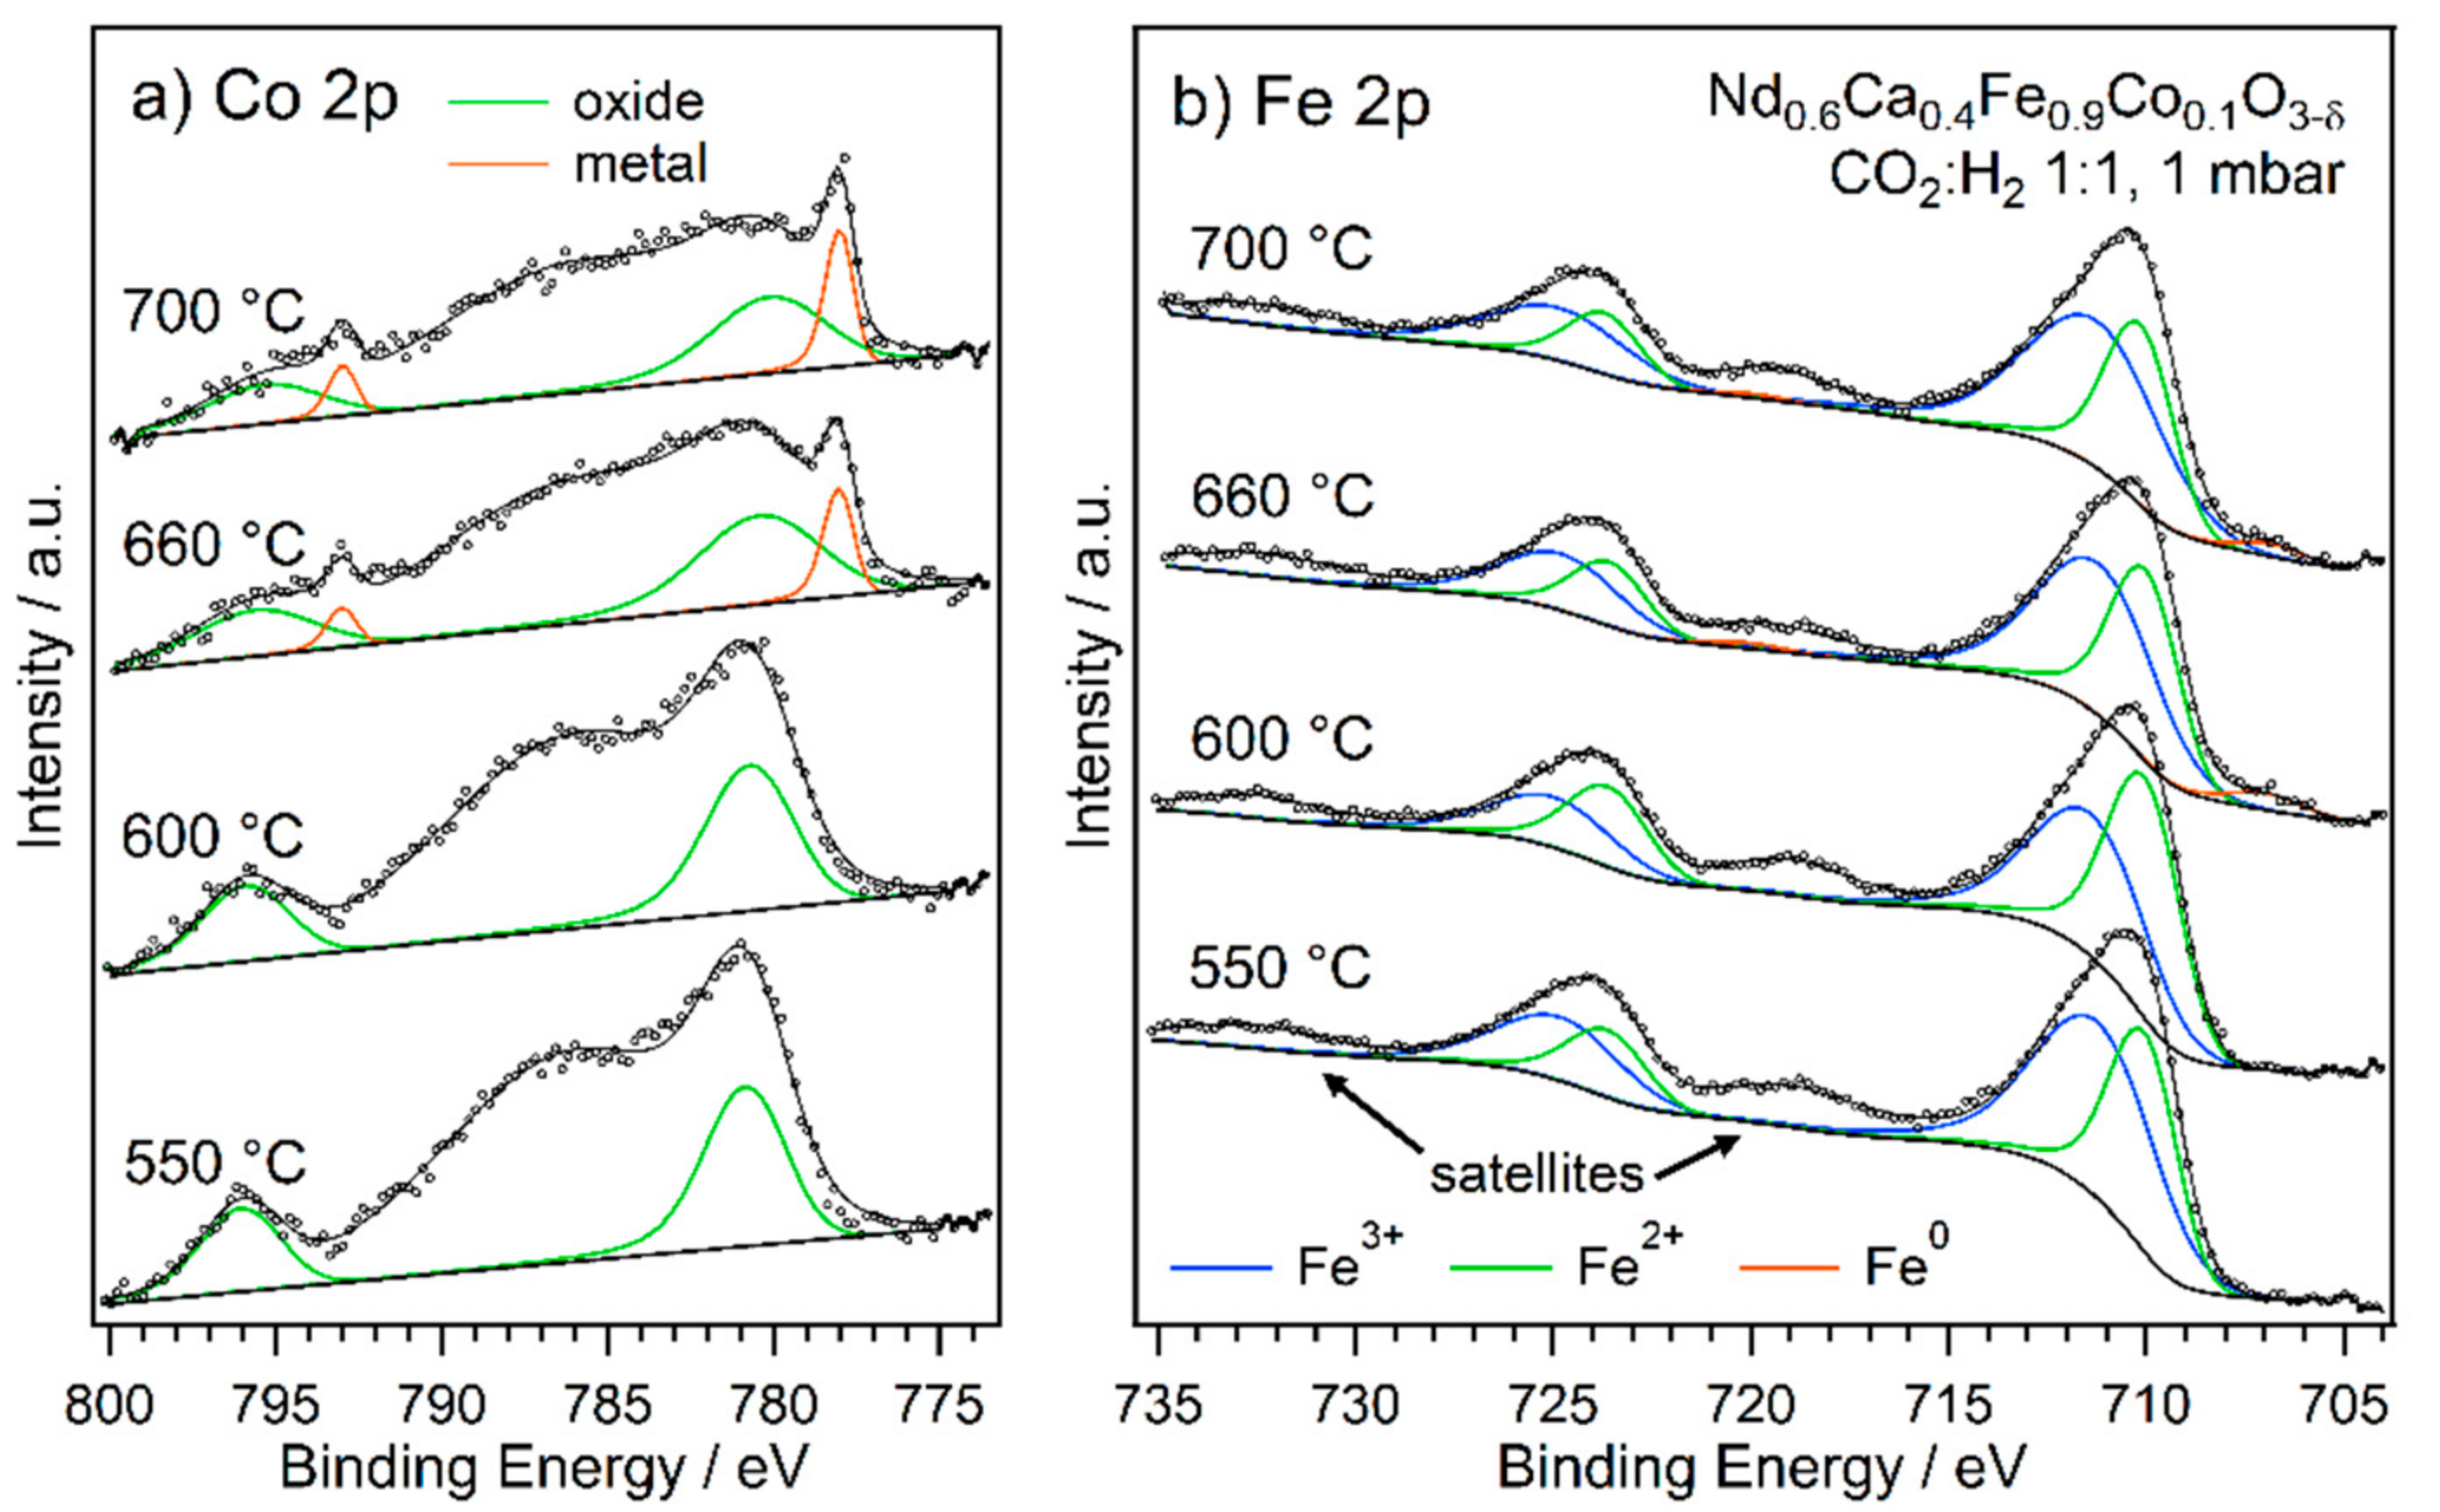
2.2. Exsolution Followed by NAP-XPS

To obtain further insights into the exsolution process during rWGS reactions and the role of the chemical potential of the reaction environment (which is defined by the ratio of CO2 and H2, temperature, and pressure), two types of NAP-XPS experiments were conducted:
(i)
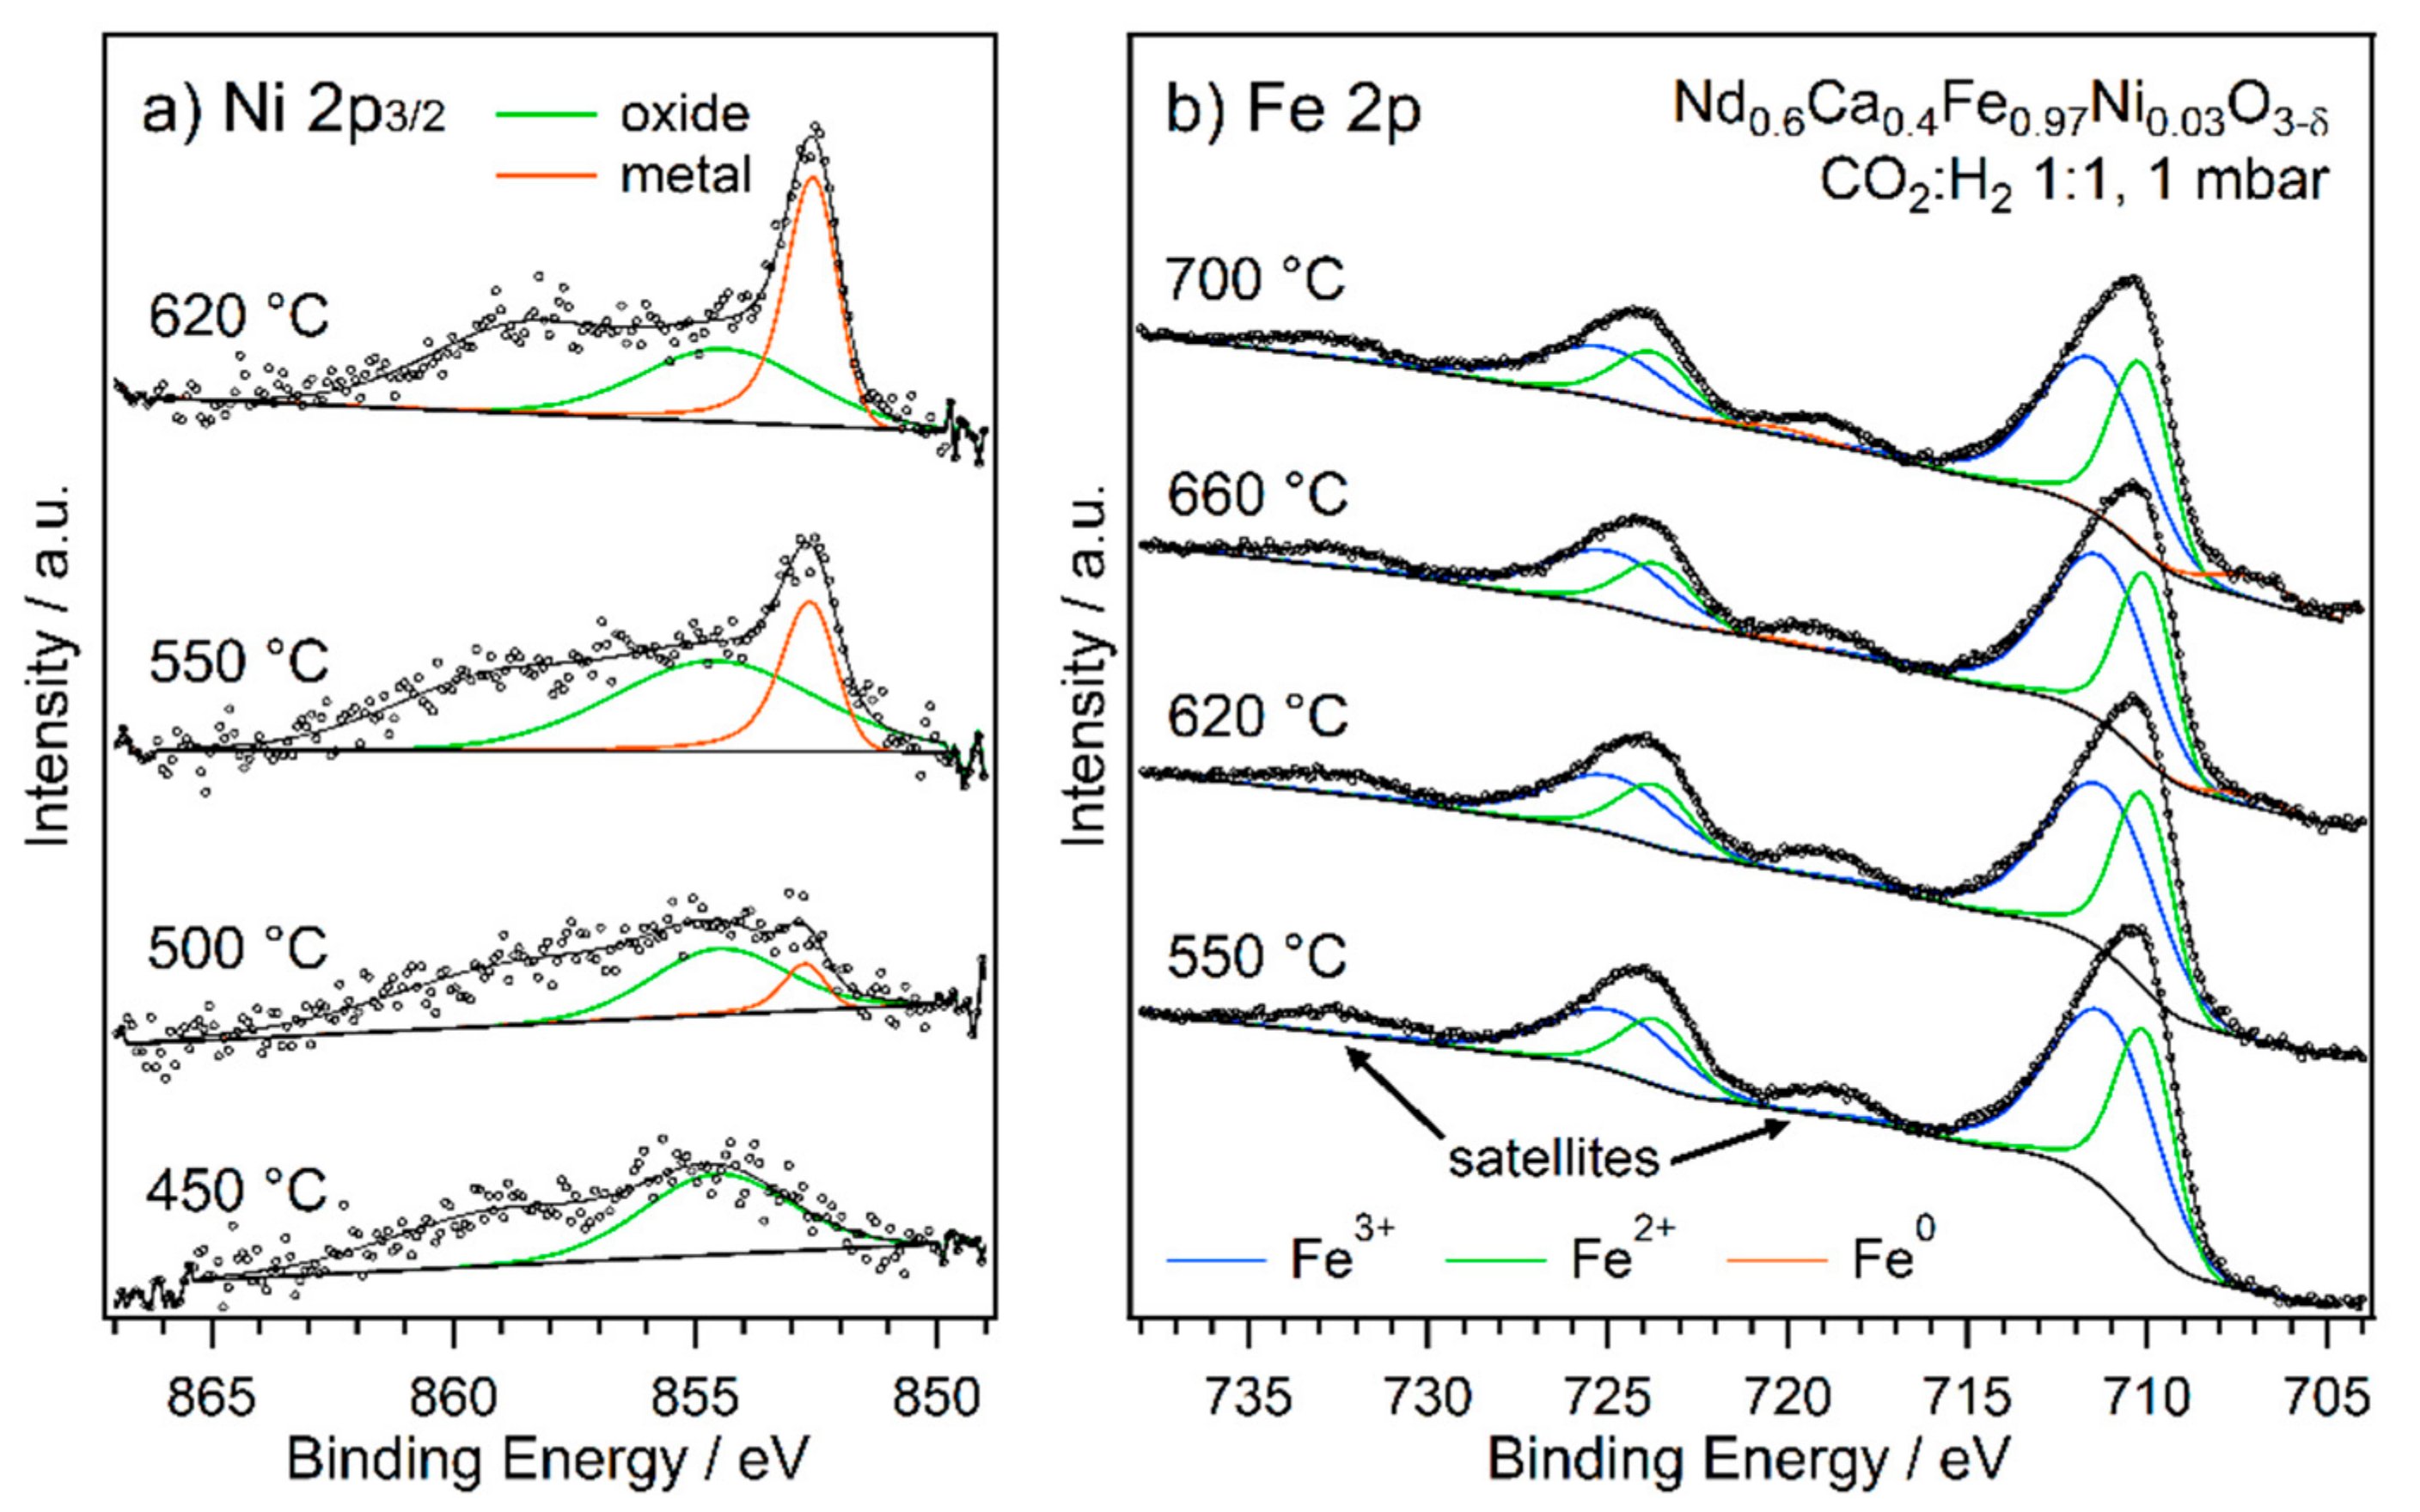
The first type was performed with Nd0.6Ca0.4Fe0.9Co0.1O3-δ and Nd0.6Ca0.4Fe0.97Ni0.03O3-δ, mimicking the catalytic test runs in an rWGS atmosphere with a CO2 to H2 ratio of 1:1. Thus, the respective sample was first oxidised in O2 (1 mbar) at 600 °C. After cooling down and switching to the reaction atmosphere (CO2:H2 = 1:1, 1 mbar), the temperature was increased in steps. At each temperature step, a set of XPS spectra was obtained.
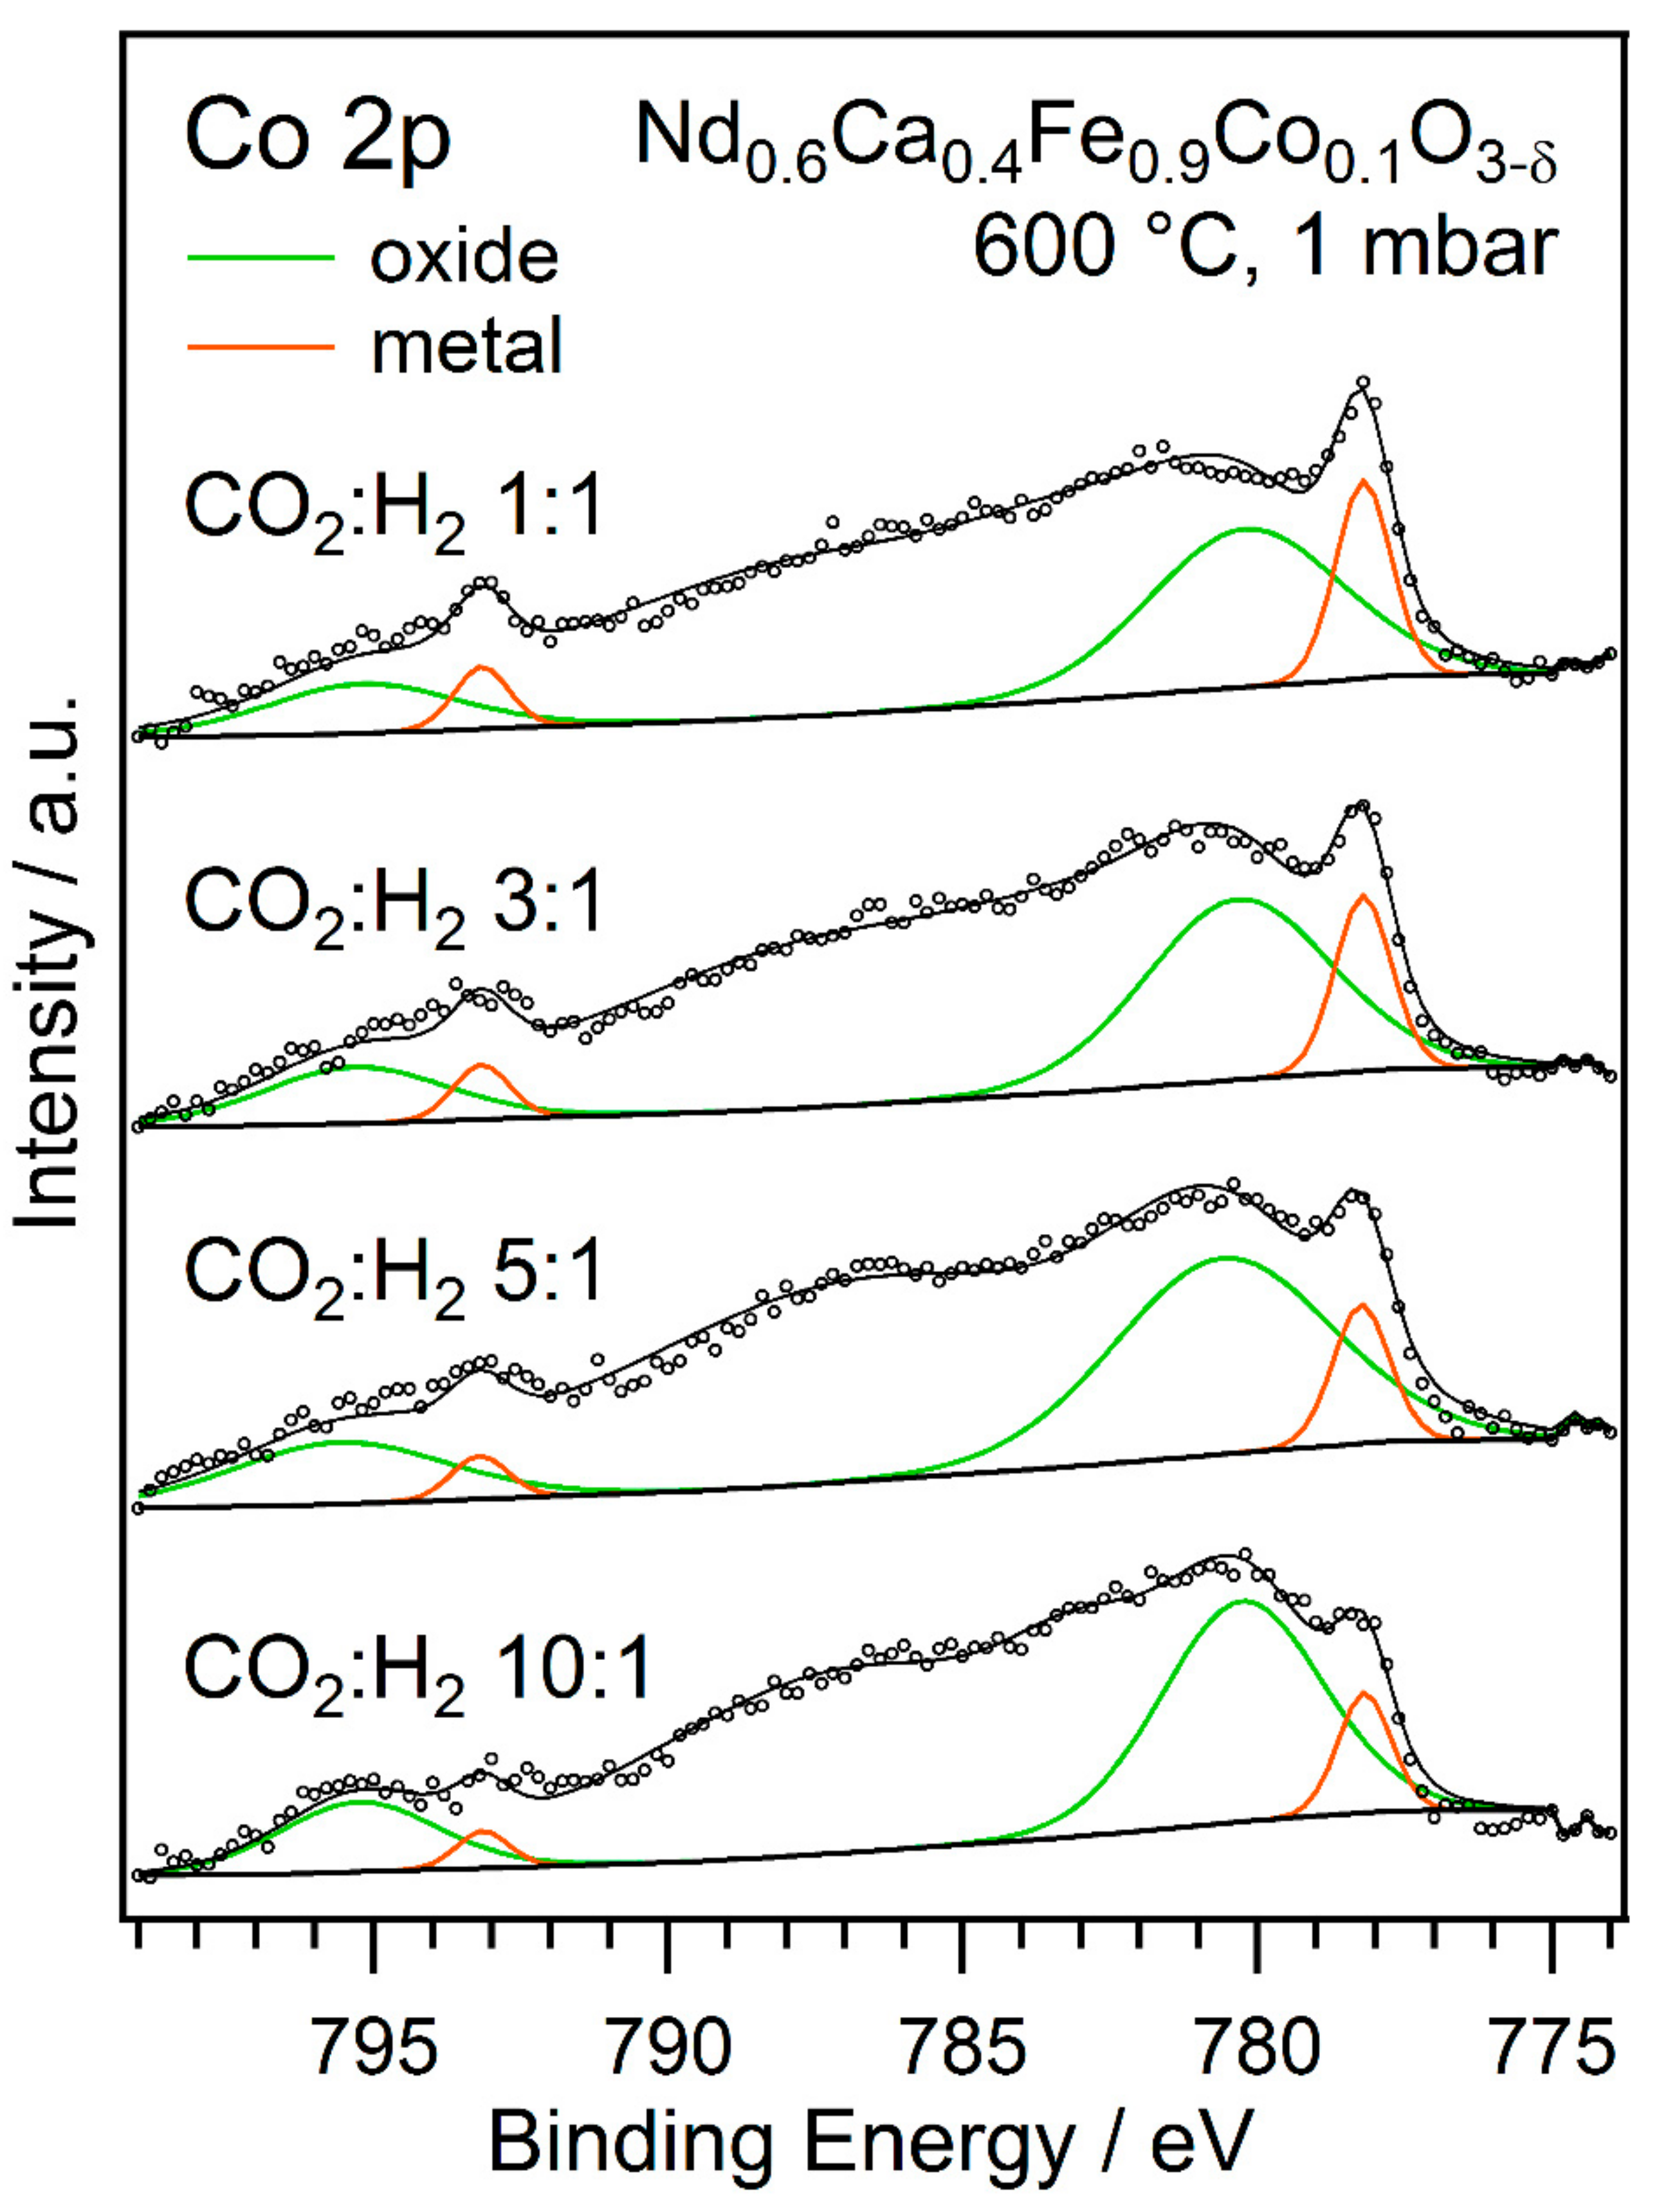
(ii)
For the second type of experiment, the temperature was held constant while different gas ratios were tested. Here, for each measurement block, a fresh thin film sample of Nd0.6Ca0.4Fe0.9Co0.1O3-δ was prepared and oxidised in O2 (1 mbar) at 600 °C to ensure the same starting conditions. Then, the respective gas mixtures (1 mbar total pressure) were applied to the measurement chamber at room temperature, and the sample was heated to 600 °C (due to laser heating this took only 2–3 min). A set of XPS spectra was recorded at these conditions. A total of four different gas ratios for CO2 to H2 were tested this way (10:1, 5:1, 3:1, and 1:1).
It has to be noted that when measuring XPS with an Al-Kα source, the Co 2p, Ni 2p, and Fe 2p regions overlap heavily with Auger signals of Fe and Co (LMM). Furthermore, the Co and Ni signals are very weak due to the low doping amounts that are present in the samples, and both signals have rich satellite contributions. To improve the quality of the fit of the Co 2p and Ni 2p regions, the positions of the Fe LMM Auger peaks were obtained from the measurements of the B-site undoped Nd0.6Ca0.4FeO3-δ and included in the Co 2p and Ni 2p fits. Some assumptions and simplifications were still necessary (e.g., regarding the background) and only a very crude estimation of the Co and Ni components was possible. For these reasons, the errors of the fit results are somewhat higher than usual [50]. Nonetheless, these fits still allow qualitative conclusions. For clarity, the underlying estimated Auger and satellite peaks were omitted in the shown spectra.
Figure 7 and Figure 8 show the evolution of Co and Fe, or Ni and Fe at increasing temperature for Nd0.6Ca0.4Fe0.9Co0.1O3-δ and Nd0.6Ca0.4Fe0.97Ni0.03O3-δ, respectively. The signals at 777.9 eV and around 780 eV in Figure 7 correspond to metallic Co and Co-oxide, respectively. These values for the binding energies agree with observations for Co exsolution from CoFeAlOx spinels that was reported by Zeng et al. [51]. Similarly, the contributions at 852.5 eV and around 854.5 eV could be assigned to metallic Ni and Ni-oxide, respectively, and agree with literature as well [52]. The mentioned difficulties during fitting made it impossible to differentiate any further oxidation states. Therefore, the oxide peaks probably consisted of both 3+ and 2+ cations, which could also explain their relative broadness and their very slight shift to lower binding energies at higher temperatures (by partial reduction of 3+ to 2+ cations).
The overlap with the Auger peak is not as severe for the Fe 2p spectra, as the signal was stronger. Therefore, in both figures, they could be fitted well using two distinct peaks at around 709.9 eV and 711.0 eV (Fe 2p3/2) for the oxide contributions which can be attributed to Fe2+ and Fe3+, respectively. Additionally, there were satellites (around 719 eV for Fe 2p3/2) and a metallic species at 706.8 eV. Again, these values agree with literature [52], although the oxide peak was much more complex in reality. However, the resolution limits of our lab-based NAP-XPS system did not allow for a more detailed fit.
Not only the fit, but also the overall line shapes revealed the evolution of metallic species in the case of all three transition metals. In Nd0.6Ca0.4Fe0.9Co0.1O3-δ, both Co and Fe were only present as oxides up to a temperature of 600 °C. At the next step of 660 °C, both showed a metallic contribution indicating exsolution of metallic nanoparticles. The contribution of metallic Co continued to grow with respect to the oxide at 700 °C. This high temperature is surprising, considering nanoparticle exsolution was evident at 570 °C in the catalytic experiments in combination with SEM. This discrepancy might be related to different pressures for the catalytic testing (atmospheric pressure) and the NAP-XPS measurements (1 mbar). Another explanation could be that the exsolved nanoparticles were present as Co1-xFexO at lower temperatures. This phase was observed in in situ XRD experiments in a previous study [53] and would not be distinguishable from Co in the perovskite lattice utilising only NAP-XPS. According to the same XRD results, the metallic phase at high temperatures is a bcc phase (agreeing with the XRD results in Figure S3, as discussed in Section 2.1), hinting towards a FeCo alloy (pure Co metal would be expected to exist in an fcc structure at those temperatures). Taking the peak areas of the metallic contributions and the photoionisation cross-sections of the energy levels into account, the composition of such a metallic phase was estimated to be 55% Co at 660 °C and 69% Co at 700 °C, compared to 10% Co on the B-site of the pristine perovskite. Although there is a very high uncertainty to these values (peak fit, only cross-section as sensitivity factor), they indicate the preferential exsolution of Co as it is more easily reducible.
In contrast to Co, Ni metal appears at a much lower temperature in Nd0.6Ca0.4Fe0.97Ni0.03O3-δ. A small metal contribution was visible at 500 °C, and the metal signal continued to grow, being clearly observable within the peak at 550 °C. The Fe signal showed the same behaviour as in the Co-doped sample, with a metal contribution appearing from 660 °C onward. According to XRD results (Figure S5), there are two exsolved metal phases, fcc (main component Ni) and bcc (main component Fe).
Aside from the B-side elements, detailed spectra of Nd 4d, Ca 2p, O 1s, and C 1s were obtained and fitted. Those species displayed less obvious changes with temperature compared to the transition metals. One observation was the formation of CaCO3 for both of the samples that was visible in all respective spectra (Ca 2p, C 1s, O 1s). For further quantitative analysis, the peak areas were compared. Specifically, the ratios of two elements were calculated relative to the respective ratio at the lowest temperature of the series. Thus, many contributions to the sensitivity factor for the XPS signals were cancelled out (e.g., photoionisation cross-section, transmission function, mean-free path, sample morphology), hence providing a tool to track relative changes of the surface composition. The results are shown in Figure 9.
For both samples, the ratio of the dopant to Fe increased with the temperature. This surface enrichment of the dopant element is further proof of the selective exsolution of the dopant. In the case of Co-doping, the increase was less pronounced; furthermore, the trend reversed at 700 °C. However, one has to keep in mind the very high uncertainty of the peak fitting which propagates to the calculated ratios, thus the apparent trend reversal may be caused by potentially large uncertainties. Also, the lowest temperature of this series was 500 °C—which is a temperature where some surface aggregation probably already took place, which is why there was no strong increase. In contrast, the Ni-doped sample showed a much more significant increase of Ni with respect to Fe between 500 °C and 550 °C (the Ni to Fe ratio more than doubles). This coincided with the clear evolution of the metallic species in the spectra, being a much stronger indication of exsolution. This was also the temperature range where the curve in Figure 6b steepened, agreeing with the proposed activation due to exsolution.
The two A-site cations were compared as well. For both samples, the Ca to Nd ratio increased continuously with temperature starting from 500 °C. The change was not very pronounced, but significant considering that the peak fitting was more accurate for these elements than for the transition metals. This result indicates a surface enrichment of Ca. Such enrichment of an alkaline earth metal dopant in perovskites under reducing conditions is a common phenomenon [54]. It is also related to the observed CaCO3 formation.
The last displayed ratio relates the area of the carbonate contribution to the C 1s signal to the sum of the total A-site peaks (Ca 2p and Nd 4d, weighted by photoionisation cross-sections). Thus, this ratio gives information about carbonate formation. For the Ni-doped material, there was an initial increase between 370 °C and 450 °C, followed by a slower decline after 500 °C. Similar to the XRD results (Figure S5), there was no increased carbonate formation at higher temperatures. The drop after the initial formation could be explained by the fact that carbonate is a possible intermediate for rWGS [11]. Therefore, this species might be diminished once increased rWGS activity occurs at higher temperatures, as observed in the catalytic experiments (Figure 6b). The lowest temperature of the series with the Co-doped material lay in the range after the initial increase. Consequently, the observed trend started with a decline of the carbonate. However, in this case another strong increase between 600 °C and 660 °C was observed, coinciding with the evolution of metallic Co and Fe, and in agreement with similar observations with XRD (Figure S4). This indicates that the carbonate formation is accelerated in the high temperature range, either through the presence of a metallic phase or due to the ongoing exsolution (enabled by the higher doping amount, with a consequently higher cation imbalance). The observations corroborate the interpretation of intensified carbonate formation being responsible for the stronger catalyst deactivation at higher temperatures (Figure 4). However, comparison of the absolute ratios of the C 1s carbonate to the A-site peaks at 700 °C—0.054 for the Co-doped material and 0.077 for the Ni-doped material—revealed that despite the increase at high temperatures in the case of Co-doping, carbonate formation was still more pronounced in the presence of Ni—even more so at low temperatures. The different behaviour of the two samples agrees with the results of the catalytic measurements in Figure 6, where the maximum temperature of the double ramp experiments did play a role in the case of Co-doping, but not for Ni.
The obtained spectra of the Co 2p region for the experiments with varying gas phase ratios are displayed in Figure 10. Metallic Co and Co-oxide can be identified in a similar manner to the spectra in Figure 7. The formation of metallic Co corresponding to nanoparticle exsolution could be observed for all rWGS reactant gas ratios. The contribution of metallic Co to the peak follows a clear trend: with increasing CO2 partial pressure and, therefore, less-reducing reaction conditions, the amount of metallic Co on the catalyst surface decreased. Using the ratio between the metallic Co and Co-oxide contributions to analyse the Co 2p peak, revealed a drop from about 25% metallic Co for the 1:1 reaction mixture to only roughly 15% for the 10:1 ratio. These results show how the reaction atmosphere influences the surface species. This can be utilised to optimise the catalytic performance.
Interestingly, the spectrum that was obtained in this series for the 1:1 gas ratio does not fully match the one collected at 600 °C during the experiment with increasing temperature. A possible explanation lies in the different experiment design. While in the temperature series, the temperature was carefully and slowly increased, the temperature was rapidly raised to 600 °C during the measurements with varying gas ratios. It is not unlikely that, in this case, the temperature exceeded 600 °C briefly (by up to 20 °C), before stabilising at the set point. According to the temperature series, the switching point for evolution of metallic Co is between 600 °C and 660 °C. Thus, this switching point might have been reached for a short time—long enough to cause a partial reduction of Co. Similar experiments have shown the perovskite system—and the exsolution process—is quite sensitive to temperature. Nonetheless, the measurements within the series of changed gas ratios, all with equivalent heating procedure, are comparable with each other.

2.3. Summary and Discussion
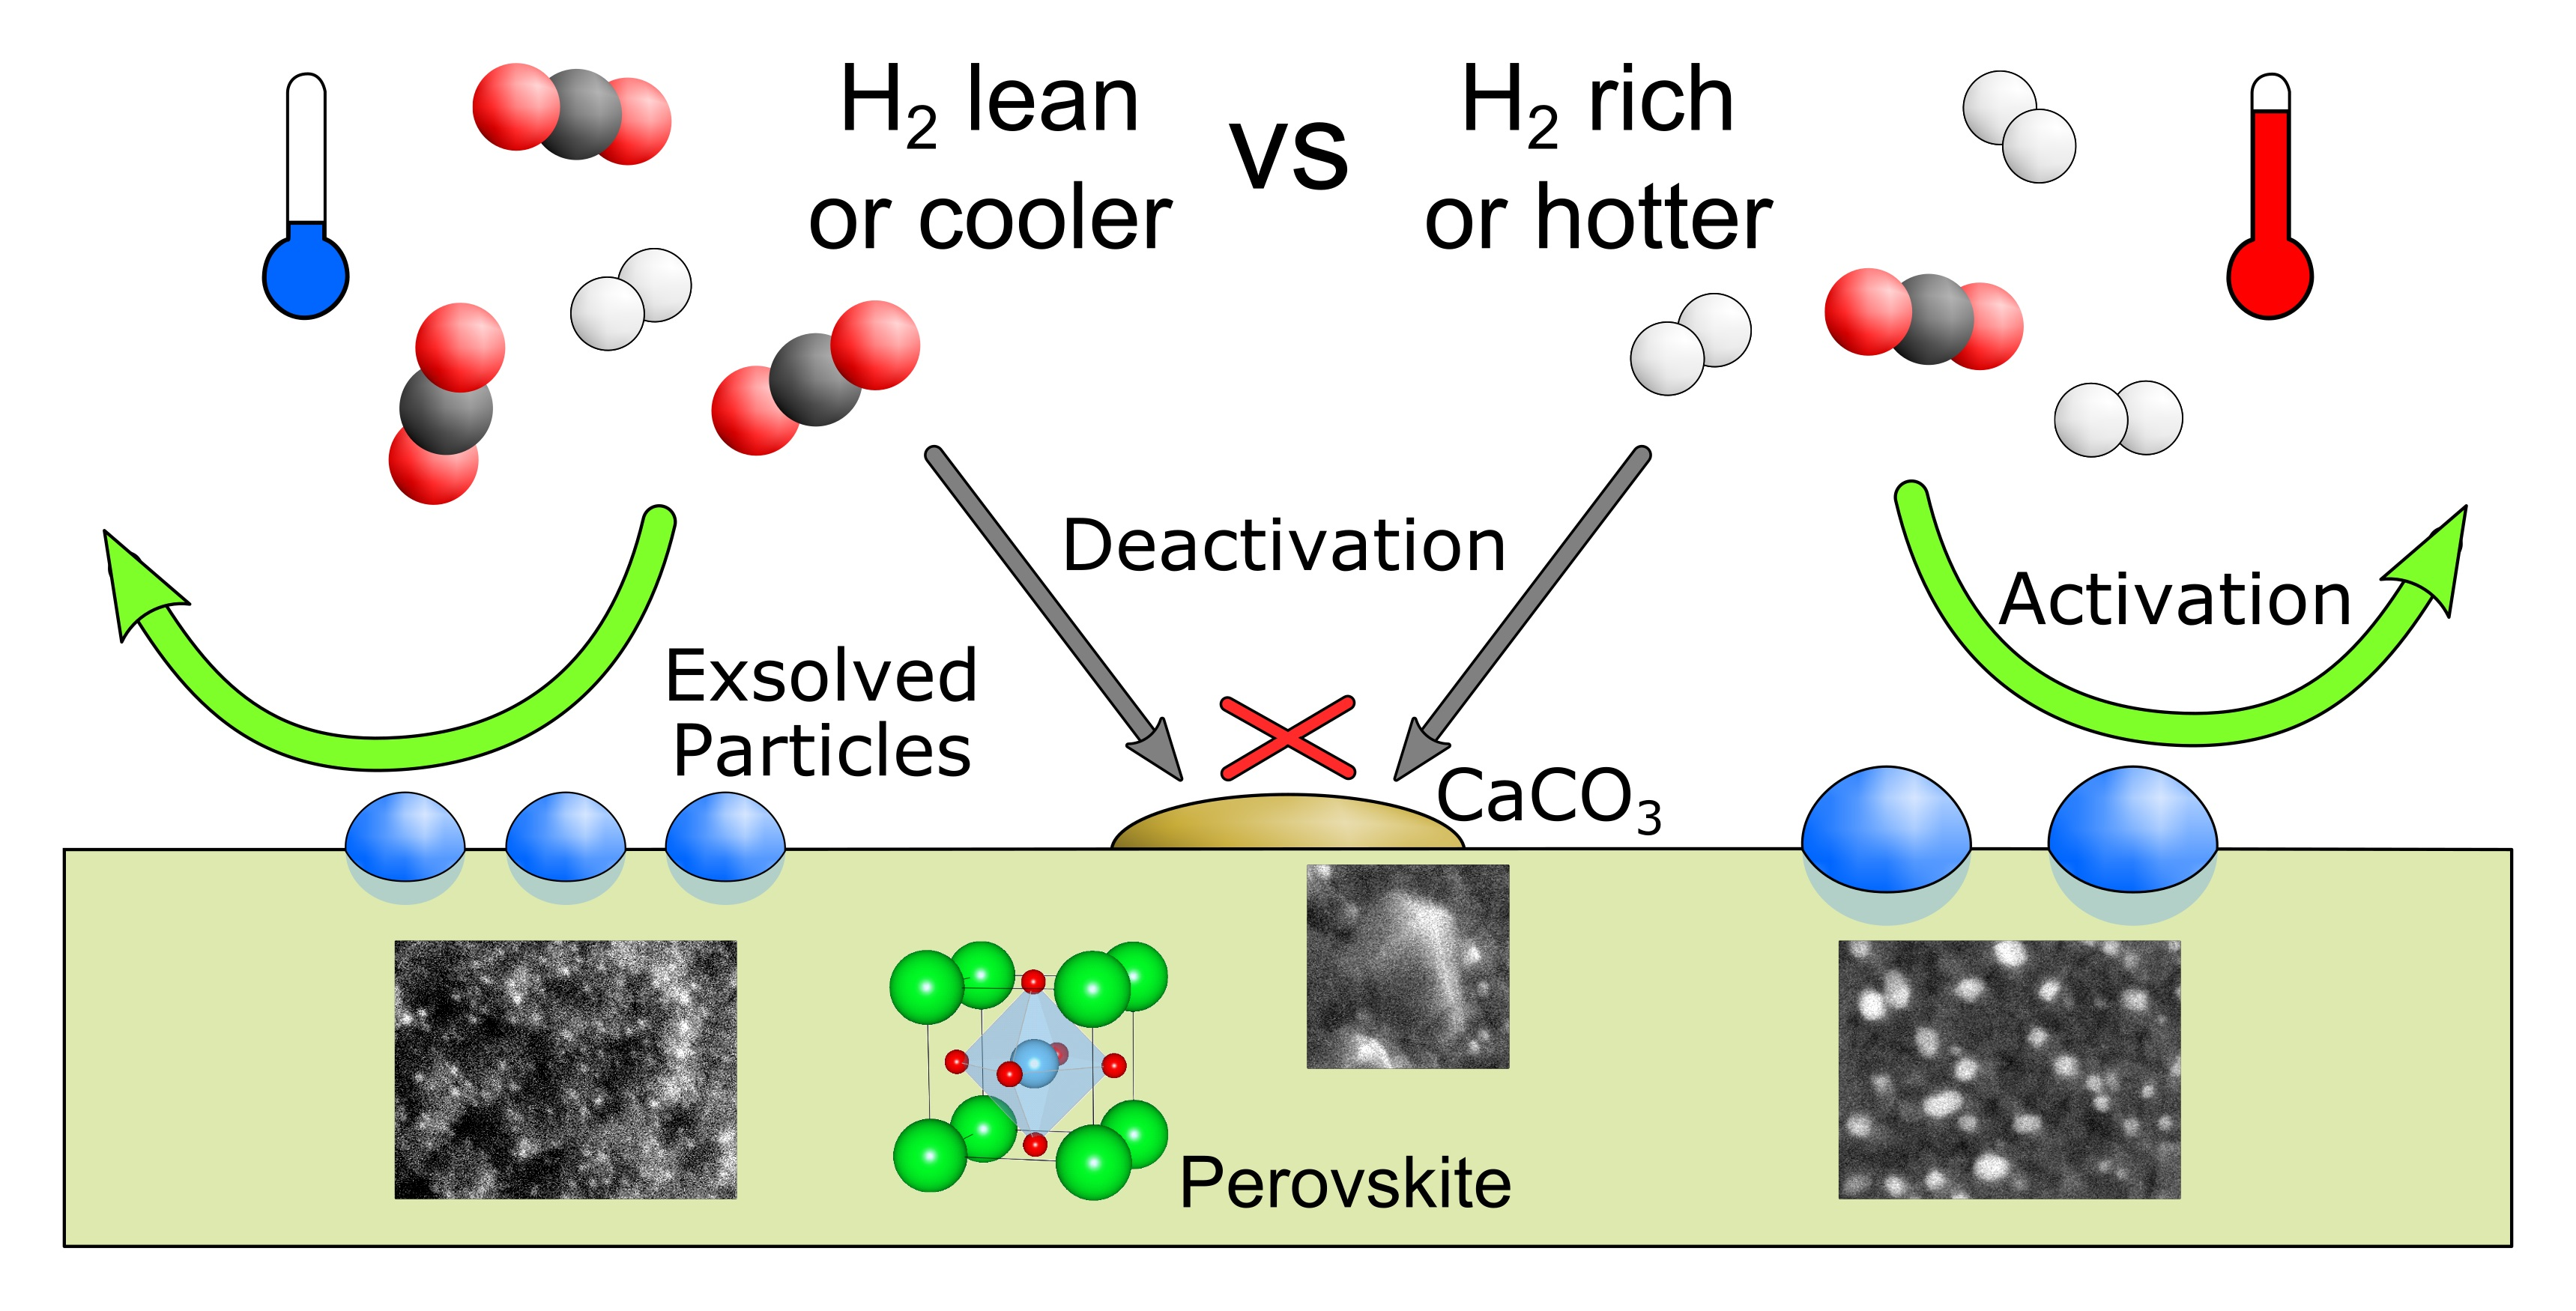
Co- and Ni-doped perovskites have been investigated under varying rWGS conditions, with a special focus on the in situ exsolution of nanoparticles. The studied parameters included the gas phase composition (ratio of CO2 to H2), the temperature, and the doping element and amount. In general, two concurring mechanisms defining the catalyst performance were found:
(i)
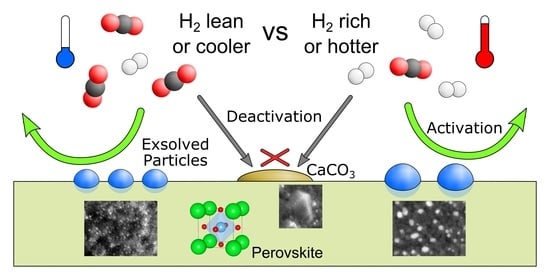
The exsolution of nanoparticles that at least predominantly consisted of the catalytically active dopant element. The particle composition, the high surface area of the small particles, and their good anchoring within the perovskite support led to an activation effect on catalytic conversion.
(ii)
The formation of CaCO3 covering the catalyst surface and blocking active sites. This caused deactivation.
The role of the gas phase composition was tested on Nd0.6Ca0.4Fe0.9Co0.1O3-δ. Exsolution of the nanoparticles could be triggered with all of the tested ratios of CO2 to H2 (between 1:1 and 15:1). It was found that higher CO2 partial pressure (and consequently lower H2 partial pressure), meaning less-reducing atmosphere, resulted in smaller and more densely distributed nanoparticles and activation at higher temperatures. This indicates exsolution only at higher temperatures (from catalytic measurements), and a smaller part of the surface Co in a metallic state compared to Co-oxide (from XPS spectra). The resulting particle distribution at higher CO2 partial pressures should be beneficial for catalytic activity; however, the more the gas ratio deviates from the stoichiometric 1:1 ratio, the more conversion is thermodynamically limited.
For the same material, it was found that by utilising double ramp experiments that the reaction temperature can be used to determine which of the two mentioned mechanisms dominates. A lower temperature (570 °C) resulted in smaller particles and a denser surface coverage; XPS (and previous in situ XRD results) indicated a Co1-xFexO nature. Furthermore, there was less carbonate, leading to overall activation. Going to higher temperatures (700 °C) resulted in larger particles; XPS hinted at a metallic CoFe alloy. Coinciding with the evolution of the metallic phase, carbonate formation was more pronounced. All these changes lead to the deactivation being predominant.
In summary, the particle distribution could be controlled via both the gas atmosphere and temperature; milder reducing conditions (lower H2 partial pressure or lower temperature) gave smaller and more densely distributed particles. This observation can be related to the exsolution mechanism that was proposed by Gao et al. [55], which considers the four mechanistic steps: diffusion, reduction, nucleation, and growth. Specifically, milder reducing conditions seem to favour nucleation before growth, producing more and smaller particles. An overview about further discussed mechanisms is given in the review article by Kwon et al. [56].
The nature of the nanoparticles was different for the two used dopant elements (found with XPS and XRD). While Co-doping resulted in the above-mentioned Co1-xFexO at lower temperature and metallic FeCo (bcc) at higher temperature (observed from 660 °C), Ni-doping causes a metallic Ni phase (fcc) to form from 500 °C and a metallic Fe phase (bcc) to form starting from 660 °C. A co-exsolution of Fe and Co or Fe and Ni was reported for similar systems, as listed in the review article by Kwon et al. [56]. However, in contrast to our findings for the Fe-Ni system, the simultaneous exsolution and formation of an alloy was discovered in these studies.
Another difference were ongoing particle growth and reactivity changes in the Co-doped systems above 600 °C, while there were less pronounced changes with Ni-doping. As discussed by Neagu et al. [44], the exsolution process is limited by the availability of the reducible B-site cation. This is not the case in our materials as also the main B-site component Fe can exsolve. However, this limitation very well exists for the fcc phase (which contains mostly Ni), while the growth of the FeCo bcc phase is not limited. Rather, it changes its composition from Co-rich to Fe-rich after no more Co is available. This change results in catalytically less active particles as Fe is less active towards rWGS than Co.
Also, the doping influences the formation of CaCO3 (observed with XPS and XRD), which is a consequence of B-site exsolution to re-establish stoichiometry. For Co-doping, it is lower, and shows an increase, going hand in hand with the ongoing exsolution. For Ni, carbonate formation is, in general, more pronounced but not increasing at high temperatures. Thus, the influence of temperature on the balance between the activating and the deactivating mechanism is lower compared to Co-doping.
Various doping amounts were tested for Co-doping. A difference was observed regarding the level of activation due to exsolution. While for 10%-doping, an activation was achieved at a temperature of 570 °C in a 1:1 rWGS atmosphere, for 3%-doping exhibits deactivation. Apparently, the lower amount of Co resulted in less, or less active (less Co content due to the above-mentioned limitation), exsolved particles, not being able to counteract the deactivation mechanism.

3. Materials and Methods

The synthesis of the perovskite powders was done via the Pechini method [57], which was described in detail in previous work [26]. The cations for each material were provided in the respective stoichiometric ratios using the following chemicals as starting materials: Nd2O3 (99.9%, Strategic Elements, Deggendorf, Germany), CaCO3 (99.95%, Sigma-Aldrich, St. Louis, MO, USA), Fe (99.5%, Sigma-Aldrich, St. Louis, MO, USA), Co(NO3)3·6H2O (99.999%, Sigma-Aldrich, St. Louis, MO, USA) and Ni(NO3)3·6H2O (98%, Alfa Aesar, Haverhill, MA, USA). After weighing accordingly, the compounds were dissolved either in H2O (doubly distilled) or in HNO3 (doubly distilled, 65%, Merck, Darmstadt, Germany). By adding citric acid (99.9998% trace metals pure, Fluka, Honeywell International, Charlotte, NC, USA) in a molar ratio of 1.2 with respect to the cations, cation complexes were formed. The H2O was evaporated, and a residual gel was formed which was brought to self-ignition via heating. The last step was the calcination of the obtained powder for three hours at 800 °C.
A Quanta 250 FEGSEM (FEI Company, Hillsboro, OR, USA) microscope was used for the SEM experiments. To achieve sufficient surface-sensitivity, the images were recorded with an acceleration voltage of 5 kV and secondary electrons were collected with an Octane Elite X-ray detector (EDAX Inc, Mahwah, NJ, USA).
Image processing was performed using Fiji (ImageJ, Version: ImageJ 2.1.0/1.53c; Java 1.8.0_172 [64-bit]) [58]. Each picture was calibrated and cropped, after which a scale bar was added. Particle analysis involved pre-processing steps (conversion from RGB to RGB-stack, filtering of the image, enhancing contrast and brightness, removing noise), identifying the particles, determination of their projected areas (via the calibrated pixel area), and finally calculation of an equivalent particle diameter (corresponding to a circle with equal total area). Particle identification was done using a threshold to differentiate between darker background and brighter particles and included finding the optimal method for threshold setting. The region of interest was chosen in such a way that homogeneous brightness of the background throughout the cropped image was achieved to enable proper particle identification. For traceability, a macro for each SEM image was recorded in the background [59].
Processing and visualisation of the particle analysis data as histograms were performed in a Jupyter environment (Python 3.7.10). The particle size analysis was limited by the resolution of the microscope and the image pixel size. Therefore, particle areas that were smaller than 1.5 times the average pixel size were removed before calculation of the histograms as no clear distinction between particle and pixel noise could be made. The bin widths of the histograms were determined using the Freedman-Diaconis method (Python package Astropy [60,61]), based on all particles under different conditions at a temperature of 700 °C. This was done to obtain the same number of bins and equal bin sizes among the individual distributions.
Catalytic tests at atmospheric pressure for the rWGS reaction (cf. Equation (1)) were performed in a 6 mm tubular flow reactor (quartz glass, inner diameter 4 mm). A micro gas chromatograph (Micro-GC, Fusion 3000A, Inficon, Bad Ragaz, Switzerland) was used for online gas analysis with a sampling interval of 3 to 4 min. Total flows of 12 mL min-1 were set, comprising of varying CO2 and H2 flows (6 mL min−1 in total) and 6 mL min−1 of Ar as carrier gas (all gases obtained from Messer Group GmbH, Bad Soden, Germany). A possible minor contribution of the reactor was assessed in a blank test and amounted to ~0.5 mol% for CO at 600 °C. As this activity was small and not a problem for the comparative study, it was disregarded. Small quantities of pristine catalyst powders (~20 mg) were inserted directly into the reactor (supported on quartz wool) for the reactions. The amounts of catalyst material for the respective experiments had to be chosen this low to stay below the thermodynamic limit of the rWGS reaction for all but the highest temperatures. Nonetheless, the limit came into effect at some point for most of the measurements due to the high activity of the catalysts. However, using even smaller amounts of sample would result in larger experimental inaccuracies, making it difficult to compare catalytic experiments at varying conditions. Therefore, the used amount was not further reduced except for one run (using ~5 mg, Figure 1) to demonstrate the effect of the used catalyst mass. The thermal control of the reactor was realised with a PID controller (EMSR EUROTHERM GmbH, Vienna, Austria) that was coupled to a K-type thermocouple that was directly embedded in the catalyst bed. To facilitate the same starting conditions for all of the tests, each catalyst was oxidised for 30 min in O2 (p = 1 bar) at 600 °C prior to the catalytic tests. That way, all of the tests could be performed on fully oxidised perovskites.
As mentioned above, the conversion is thermodynamically limited. To compare the catalytic results to these limits, the gas composition in case of equilibrium conditions was calculated for the various starting compositions dependent on the temperature. At the starting point, thermodynamic data of the four participating gas molecules (cf. Equation (1)) was taken from the NIST Chemistry WebBook [62]. The reference specifically provides values for the standard enthalpies of formation Δ H f and the standard molar entropies S as functions of temperature for the various gases. From these, the standard enthalpy of reaction Δ r H and the standard entropy change of reaction Δ r S for rWGS for each temperature, and, subsequently, the Gibbs free energy of reaction Δ r G and the equilibrium constant K were calculated. Applying the constraint that half of the atmosphere is the inert Ar, and a given starting ratio of CO2 and H2 of a   : 1 , the mole fractions shown in Table 1 follow an arbitrary amount of the educts has reacted. In case the equilibrium has been reached, Equation (2) thus holds
K = y 2 1 + a 2 1 y 2 1 + a a y 2 1 + a   = y 2 1 y a y  
This results in a quadratic equation for y. Solving Equation (2) for y gives
y = K a + 1 K 2 a + 1 2 4 K K 1 a 2 K 1
and the corresponding mole fraction of CO according to Table 1, which can be multiplied by 100 to get the concentration of CO in mol%.
Detailed basic characterisation of pristine Nd0.6Ca0.4Fe0.9Co0.1O3-δ and Nd0.6Ca0.4Fe0.97Co0.03O3-δ (e.g., by XRD) was already conducted in earlier studies [26,38,63].
In situ NAP-XPS measurements were performed on a custom lab-based system (SPECS GmbH, Berlin, Germany). The sample stage that was utilised for the catalytic experiments is described in detail in [50]. The thin film samples (Nd0.6Ca0.4Fe0.9Co0.1O3-δ and Nd0.6Ca0.4Fe0.97Ni0.03O3-δ) were prepared by pulsed laser deposition (details see also in [50]). Monochromatic Al-Kα radiation was used to obtain NAP-XPS spectra.
Calibration and peak fitting, including background subtraction, were performed with the CasaXPS software (Casa Software Ltd., Teignmouth, UK). Binding energies were calibrated setting the main O 1s peak to 529.4 eV. Due to the absence of a pronounced Fermi edge, the latter could not be utilised. The chosen calibrated value agrees with literature values of similar materials [64] but is still somewhat arbitrary. However, although there might be a systematic error in the absolute binding energies, the method is suitable to follow relative changes during the experiments, as this O 1s species (related to perovskite lattice oxygen) is very easy to fit and expected to remain constant at varying conditions. To fit line shapes, Gauss-Lorenz sum functions (GLS in CasaXPS) or, if necessary, Lorentzian Asymmetric functions (LA in CasaXPS) were used.

4. Conclusions

The present study gives insight into the dynamic response of the perovskites to the rWGS reaction environment and how exsolution can be influenced by choosing material compositions and reaction parameters. Nanoparticles, exsolved in situ under reaction conditions, improve the catalytic performance of the materials. However, this activation is counteracted by the formation of CaCO3 covering the surface.
For the activation to be effective, the B-site doping must be adjusted. A predominant activation was only observed with sufficient Co-doping (10%), while Ni doping (Co is more active towards rWGS) and reduced Co-doping of 3% (due to more or larger particles, or a more Co-rich exsolved phase in case of the higher doping amount) did not lead to an activation effect. Additionally, the reaction temperature was important. A catalytic ramp experiment up to a temperature of 570 °C revealed an overall activation, while going up to 700 °C led to larger and less densely distributed particles and more CaCO3, resulting in an overall deactivation.
These results are an important basis for optimising the catalytic performance—either by improving the activation via exsolved nanoparticles or by reducing the deactivation due to carbonate formation. Therefore, the investigated catalysts are promising candidates for application in CO2 utilisation via the rWGS reaction, especially because of their flexible design properties.
Even though many studies have investigated materials that are capable of exsolution and its corresponding enhancement of the activity of the different materials [34,35,36,39,40,41,42,43,44,45,46], more in-depth evaluations of catalytic applicability are still rare. For industrial applications, stable catalytic performance in various reactant gas compositions (different CO2 to H2 ratios) is crucial. This is particularly important since the gas composition of the reaction environment changes over the catalyst bed in a reactor [65]. With this study, it could be demonstrated that exsolution-enhanced catalysis is possible over a broad range of gas mixtures and temperatures for the rWGS reaction.

Supplementary Materials

The following are available online at https://www.mdpi.com/article/10.3390/catal11121484/s1, Figure S1: Left: SEM images of Nd0.6Ca0.4Fe0.9Co0.1O3-δ after ramp experiments up to 700 °C with three different CO2 to H2 ratios of the reaction atmosphere. Different positions of the same samples are shown (for each sample consecutively denoted with letters). Right: The corresponding histograms of the sampled areas (red cut-outs) of the respective SEM image on the left. Additional details about the particle analyses and the determined particle distributions are given in Table S1, Figure S2: SEM images of Nd0.6Ca0.4Fe0.9Co0.1O3-δ after double ramp catalytic tests with an end temperature of 570 °C. The two images (a and b) represent different positions of the same sample. The formation of finely dispersed nanoparticles on the surface was visible, but no formation of CaCO3 crystallites could be observed. The cut-outs (marked red) were used for detailed particle analysis, results are shown in Table S2, Figure S3: XRD pattern of Nd0.6Ca0.4Fe0.9Co0.1O3-δ before (blue) and after the rWGS double ramp experiments (orange and red for ramp end temperatures of 570 °C and 700 °C, respectively). After both experiments, a metallic FeCo bcc phase and CaCO3 were present, both more prominent in the experiment with a higher end temperature of 700 °C. Unlike in the samples with 3 % doping, there is only a very small contribution of a brownmillerite phase (ordered oxygen vacancies) in the pristine sample, which vanishes after the experiment, Figure S4: XRD pattern of Nd0.6Ca0.4Fe0.97Co0.03O3-δ before (blue) and after the rWGS double ramp experiments (orange and red for ramp end temperatures of 570 °C and 700 °C, respectively). After both experiments, a metallic FeCo bcc phase and CaCO3 were present, both more prominent in the experiment with a higher end temperature of 700 °C. A brownmillerite phase (ordered oxygen vacancies) in the pristine sample vanishes after the experiment, Figure S5: XRD pattern of Nd0.6Ca0.4Fe0.97Ni0.03O3-δ before (blue) and after the rWGS double ramp experiments (orange and red for ramp end temperatures of 600 °C and 700 °C, respectively). After both experiments, two metallic FeNi phases formed, a bcc phase (main component Fe) and an fcc phase (main component Ni). CaCO3 was present as well. A brownmillerite phase (ordered oxygen vacancies) in the pristine sample vanishes after the experiment. Table S1: Parameter summary that was obtained from the particle analyses that were conducted on the SEM images of Nd0.6Ca0.4Fe0.9Co0.1O3-δ after rWGS with varying CO2 to H2 ratios, and statistical measures of the determined particle distributions. The respective images and histograms are displayed in Figure S1, Table S2: Overview of the particle analysis for the sample Nd0.6Ca0.4Fe0.9Co0.1O3-δ after double ramp experiments with end temperature 570 °C (respective images and cut-outs are displayed in Figure S2). Larger particles were excluded from the calculation of the mean particle diameter dp. The maximal included dp is given, as well as the overall maximal found dp (given in brackets) in the respective cut-out.

Author Contributions

Conceptualisation, L.L., C.R. and T.R.; methodology, L.L, S.L. and C.R.; validation, L.L., R.R., H.D. and F.S.; formal analysis, L.L., R.R., H.D., F.S. and T.R.; investigation, J.H., L.L., S.L. and F.S.; resources, S.L. and C.R.; data curation, J.H., L.L., R.R., H.D. and T.R..; writing—original draft preparation, J.H. and L.L.; writing—review and editing, J.H., L.L., T.R. and C.R.; visualisation, J.H., L.L. and H.D.; supervision, C.R.; project administration, C.R.; funding acquisition, C.R. All authors have read and agreed to the published version of the manuscript.

Funding

This project has received funding from the European Research Council (ERC) under the European Union’s Horizon 2020 research and innovation programme (grant agreement n° 755744/ERC—Starting Grant TUCAS).

Data Availability Statement

The data that were presented in this study are available on request from the corresponding author.

Conflicts of Interest

The authors declare no conflict of interest.

References

  1. Yu, K.M.K.; Curcic, I.; Gabriel, J.; Tsang, S.C.E. Recent Advances in CO2 Capture and Utilization. Chemsuschem 2008, 1, 893–899. [Google Scholar] [CrossRef]
  2. Falkowski, P.; Scholes, R.J.; Boyle, E.; Canadell, J.; Canfield, D.; Elser, J.; Gruber, N.; Hibbard, K.; Hogberg, P.; Linder, S.; et al. The global carbon cycle: A test of our knowledge of earth as a system. Science 2000, 290, 291–296. [Google Scholar] [CrossRef] [Green Version]
  3. Aresta, M.; Dibenedetto, A. Utilisation of CO2 as a chemical feedstock: Opportunities and challenges. Dalton Trans. 2007, 36, 2975–2992. [Google Scholar] [CrossRef]
  4. Centi, G.; Quadrelli, E.A.; Perathoner, S. Catalysis for CO2 conversion: A key technology for rapid introduction of renewable energy in the value chain of chemical industries. Energy Environ. Sci. 2013, 6, 1711–1731. [Google Scholar] [CrossRef]
  5. Mayr, L.; Shi, X.R.; Kopfle, N.; Milligan, C.A.; Zemlyanov, D.Y.; Knop-Gericke, A.; Havecker, M.; Klotzer, B.; Penner, S. Chemical vapor deposition-prepared sub-nanometer Zr clusters on Pd surfaces: Promotion of methane dry reforming. Phys. Chem. Chem. Phys. 2016, 18, 31586–31599. [Google Scholar] [CrossRef] [Green Version]
  6. Daza, Y.A.; Kuhn, J.N. CO2 conversion by reverse water gas shift catalysis: Comparison of catalysts, mechanisms and their consequences for CO2 conversion to liquid fuels. RSC Adv. 2016, 6, 49675–49691. [Google Scholar] [CrossRef]
  7. Rameshan, C.; Li, H.; Anic, K.; Roiaz, M.; Pramhaas, V.; Rameshan, R.; Blume, R.; Haevecker, M.; Knudsen, J.; Knop-Gericke, A.; et al. In situ NAP-XPS spectroscopy during methane dry reforming on ZrO2/Pt(111) inverse model catalyst. J. Phys. Condens. Matter 2018, 30, 264007. [Google Scholar] [CrossRef] [PubMed]
  8. Behrens, M. Promoting the Synthesis of Methanol: Understanding the Requirements for an Industrial Catalyst for the Conversion of CO2. Angew. Chem. -Int. Ed. 2016, 55, 14906–14908. [Google Scholar] [CrossRef] [PubMed]
  9. Riedel, T.; Claeys, M.; Schulz, H.; Schaub, G.; Nam, S.S.; Jun, K.W.; Choi, M.J.; Kishan, G.; Lee, K.W. Comparative study of Fischer-Tropsch synthesis with H2/CO and H2/CO2 syngas using Fe- and Co-based catalysts. Appl. Catal. A Gen. 1999, 186, 201–213. [Google Scholar] [CrossRef]
  10. Panagiotopoulou, P.; Kondarides, D.I.; Verykios, X.E. Mechanistic aspects of the selective methanation of CO over Ru/TiO2 catalyst. Catal. Today 2012, 181, 138–147. [Google Scholar] [CrossRef]
  11. Goguet, A.; Meunier, F.C.; Tibiletti, D.; Breen, J.P.; Burch, R. Spectrokinetic investigation of reverse water-gas-shift reaction intermediates over a Pt/CeO2 catalyst. J. Phys. Chem. B 2004, 108, 20240–20246. [Google Scholar] [CrossRef] [Green Version]
  12. Matsubu, J.C.; Yang, V.N.; Christopher, P. Isolated Metal Active Site Concentration and Stability Control Catalytic CO2 Reduction Selectivity. J. Am. Chem. Soc. 2015, 137, 3076–3084. [Google Scholar] [CrossRef]
  13. Galvan, C.A.; Schumann, J.; Behrens, M.; Fierro, J.L.G.; Schlogl, R.; Frei, E. Reverse water-gas shift reaction at the Cu/ZnO interface: Influence of the Cu/Zn ratio on structure-activity correlations. Appl. Catal. B Environ. 2016, 195, 104–111. [Google Scholar] [CrossRef]
  14. Wang, L.H.; Liu, H.; Chen, Y.; Yang, S.Q. Reverse water-gas shift reaction over co-precipitated Co-CeO2 catalysts: Effect of Co content on selectivity and carbon formation. Int. J. Hydrog. Energy 2017, 42, 3682–3689. [Google Scholar] [CrossRef]
  15. Wang, L.H.; Liu, H.; Liu, Y.; Chen, Y.; Yang, S.Q. Effect of precipitants on Ni-CeO2 catalysts prepared by a co-precipitation method for the reverse water-gas shift reaction. J. Rare Earths 2013, 31, 969–974. [Google Scholar] [CrossRef]
  16. Collins, S.E.; Delgado, J.J.; Mira, C.; Calvino, J.J.; Bernal, S.; Chiavassa, D.L.; Baltanas, M.A.; Bonivardi, A.L. The role of Pd-Ga bimetallic particles in the bifunctional mechanism of selective methanol synthesis via CO2 hydrogenation on a Pd/Ga2O3 catalyst. J. Catal. 2012, 292, 90–98. [Google Scholar] [CrossRef]
  17. Liu, L.N.; Das, S.; Chen, T.J.; Dewangan, N.; Ashok, J.; Xi, S.B.; Borgna, A.; Li, Z.W.; Kawi, S. Low temperature catalytic reverse water-gas shift reaction over perovskite catalysts in DBD plasma. Appl. Catal. B Environ. 2020, 265, 118573. [Google Scholar] [CrossRef]
  18. Lorenz, H.; Zhao, Q.; Turner, S.; Lebedev, O.I.; van Tendeloo, G.; Kloetzer, B.; Rameshan, C.; Penner, S. Preparation and structural characterization of SnO2 and GeO2 methanol steam reforming thin film model catalysts by (HR)TEM. Mater. Chem. Phys. 2010, 122, 623–629. [Google Scholar] [CrossRef] [Green Version]
  19. Pastor-Perez, L.; Baibars, F.; Le Sache, E.; Arellano-Garcia, H.; Gu, S.; Reina, T.R. CO2 valorisation via Reverse Water-Gas Shift reaction using advanced Cs doped Fe-Cu/Al2O3 catalysts. J. CO2 Util. 2017, 21, 423–428. [Google Scholar] [CrossRef] [Green Version]
  20. Chen, C.S.; Cheng, W.H.; Lin, S.S. Study of reverse water gas shift reaction by TPD, TPR and CO2 hydrogenation over potassium-promoted Cu/SiO2 catalyst. Appl. Catal. A Gen. 2003, 238, 55–67. [Google Scholar] [CrossRef]
  21. Daza, Y.A.; Maiti, D.; Kent, R.A.; Bhethanabotla, V.R.; Kuhn, J.N. Isothermal reverse water gas shift chemical looping on La0.75Sr0.25Co1-YFeYO3 perovskite-type oxides. Catal. Today 2015, 258, 691–698. [Google Scholar] [CrossRef]
  22. Kim, D.H.; Park, J.L.; Park, E.J.; Kim, Y.D.; Uhm, S. Dopant Effect of Barium Zirconate-Based Perovskite-Type Catalysts for the Intermediate-Temperature Reverse Water Gas Shift Reaction. ACS Catal. 2014, 4, 3117–3122. [Google Scholar] [CrossRef]
  23. Bligaard, T.; Norskov, J.K.; Dahl, S.; Matthiesen, J.; Christensen, C.H.; Sehested, J. The Bronsted-Evans-Polanyi relation and the volcano curve in heterogeneous catalysis. J. Catal. 2004, 224, 206–217. [Google Scholar] [CrossRef]
  24. Pastor-Perez, L.; Shah, M.; le Sache, E.; Reina, T.R. Improving Fe/Al2O3 Catalysts for the Reverse Water-Gas Shift Reaction: On the Effect of Cs as Activity/Selectivity Promoter. Catalysts 2018, 8, 608. [Google Scholar] [CrossRef] [Green Version]
  25. Jurkovic, D.L.; Pohar, A.; Dasireddy, V.; Likozar, B. Effect of Copper-based Catalyst Support on Reverse Water-Gas Shift Reaction (RWGS) Activity for CO2 Reduction. Chem. Eng. Technol. 2017, 40, 973–980. [Google Scholar] [CrossRef]
  26. Lindenthal, L.; Rameshan, R.; Summerer, H.; Ruh, T.; Popovic, J.; Nenning, A.; Löffler, S.; Opitz, A.K.; Blaha, P.; Rameshan, C. Modifying the Surface Structure of Perovskite-Based Catalysts by Nanoparticle Exsolution. Catalysts 2020, 10, 268. [Google Scholar] [CrossRef] [Green Version]
  27. Hwang, J.; Rao, R.R.; Giordano, L.; Katayama, Y.; Yu, Y.; Shao-Horn, Y. Perovskites in catalysis and electrocatalysis. Science 2017, 358, 751–756. [Google Scholar] [CrossRef] [PubMed] [Green Version]
  28. Nishihata, Y.; Mizuki, J.; Akao, T.; Tanaka, H.; Uenishi, M.; Kimura, M.; Okamoto, T.; Hamada, N. Self-regeneration of a Pd-perovskite catalyst for automotive emissions control. Nature 2002, 418, 164–167. [Google Scholar] [CrossRef]
  29. Shin, T.H.; Myung, J.H.; Verbraeken, M.; Kim, G.; Irvine, J.T.S. Oxygen deficient layered double perovskite as an active cathode for CO2 electrolysis using a solid oxide conductor. Faraday Discuss. 2015, 182, 227–239. [Google Scholar] [CrossRef] [Green Version]
  30. Stöger, B.; Hieckel, M.; Mittendorfer, F.; Wang, Z.M.; Fobes, D.; Peng, J.; Mao, Z.Q.; Schmid, M.; Redinger, J.; Diebold, U. High Chemical Activity of a Perovskite Surface: Reaction of CO with Sr3Ru2O7. Phys. Rev. Lett. 2014, 113, 116101. [Google Scholar] [CrossRef] [PubMed] [Green Version]
  31. Katz, M.B.; Zhang, S.Y.; Duan, Y.W.; Wang, H.J.; Fang, M.H.; Zhang, K.; Li, B.H.; Graham, G.W.; Pan, X.Q. Reversible precipitation/dissolution of precious-metal clusters in perovskite-based catalyst materials: Bulk versus surface re-dispersion. J. Catal. 2012, 293, 145–148. [Google Scholar] [CrossRef]
  32. Thalinger, R.; Opitz, A.K.; Kogler, S.; Heggen, M.; Stroppa, D.; Schmidmair, D.; Tappert, R.; Fleig, J.; Klotzer, B.; Penner, S. Water-Gas Shift and Methane Reactivity on Reducible Perovskite-Type Oxides. J. Phys. Chem. C 2015, 119, 11739–11753. [Google Scholar] [CrossRef] [PubMed] [Green Version]
  33. Mueller, D.N.; Machala, M.L.; Bluhm, H.; Chueh, W.C. Redox activity of surface oxygen anions in oxygen-deficient perovskite oxides during electrochemical reactions. Nat. Commun. 2015, 6, 1–8. [Google Scholar] [CrossRef] [PubMed] [Green Version]
  34. Neagu, D.; Tsekouras, G.; Miller, D.N.; Menard, H.; Irvine, J.T.S. In situ growth of nanoparticles through control of non-stoichiometry. Nat. Chem. 2013, 5, 916–923. [Google Scholar] [CrossRef] [Green Version]
  35. Sun, Y.F.; Li, J.H.; Zeng, Y.M.; Amirkhiz, B.S.; Wang, M.N.; Behnamian, Y.; Luo, J.L. A-site deficient perovskite: The parent for in situ exsolution of highly, regenerable nano-particles as SOFC anodes. J. Mater. Chem. A 2015, 3, 11048–11056. [Google Scholar] [CrossRef]
  36. Papargyriou, D.; Irvine, J.T.S. Nickel nanocatalyst exsolution from (La,Sr) (Cr,M,Ni)O3 (M=Mn,Fe) perovskites for the fuel oxidation layer of Oxygen Transport Membranes. Solid State Ion. 2016, 288, 120–123. [Google Scholar] [CrossRef] [Green Version]
  37. Neagu, D.; Oh, T.S.; Miller, D.N.; Menard, H.; Bukhari, S.M.; Gamble, S.R.; Gorte, R.J.; Vohs, J.M.; Irvine, J.T.S. Nano-socketed nickel particles with enhanced coking resistance grown in situ by redox exsolution. Nat. Commun. 2015, 6, 1–8. [Google Scholar] [CrossRef] [PubMed] [Green Version]
  38. Lindenthal, L.; Ruh, T.; Rameshan, R.; Summerer, H.; Nenning, A.; Herzig, C.; Loffler, S.; Limbeck, A.; Opitz, A.K.; Blaha, P.; et al. Ca-doped rare earth perovskite materials for tailored exsolution of metal nanoparticles. Acta Crystallogr. Sect. B 2020, 76, 1055–1070. [Google Scholar] [CrossRef] [PubMed]
  39. Oh, T.S.; Rahani, E.K.; Neagu, D.; Irvine, J.T.S.; Shenoy, V.B.; Gorte, R.J.; Vohs, J.M. Evidence and Model for Strain-Driven Release of Metal Nanocatalysts from Perovskites during Exsolution. J. Phys. Chem. Lett. 2015, 6, 5106–5110. [Google Scholar] [CrossRef] [Green Version]
  40. Haag, J.M.; Barnett, S.A.; Richardson, J.W.; Poeppelmeier, K.R. Structural and Chemical Evolution of the SOFC Anode La0.30Sr0.70Fe0.70Cr0.30O3-δ upon Reduction and Oxidation: An in Situ Neutron Diffraction Study. Chem. Mater. 2010, 22, 3283–3289. [Google Scholar] [CrossRef]
  41. Gotsch, T.; Schlicker, L.; Bekheet, M.F.; Doran, A.; Grunbacher, M.; Praty, C.; Tada, M.; Matsui, H.; Ishiguro, N.; Gurlo, A.; et al. Structural investigations of La0.6Sr0.4FeO3-δ under reducing conditions: Kinetic and thermodynamic limitations for phase transformations and iron exsolution phenomena. RSC Adv. 2018, 8, 3120–3131. [Google Scholar] [CrossRef] [Green Version]
  42. Katz, M.B.; Graham, G.W.; Duan, Y.W.; Liu, H.; Adamo, C.; Schlom, D.G.; Pan, X.Q. Self-Regeneration of Pd-LaFeO3 Catalysts: New Insight from Atomic-Resolution Electron Microscopy. J. Am. Chem. Soc. 2011, 133, 18090–18093. [Google Scholar] [CrossRef]
  43. Lv, H.F.; Lin, L.; Zhang, X.M.; Song, Y.F.; Matsumoto, H.; Zeng, C.B.; Ta, N.; Liu, W.; Gao, D.F.; Wang, G.X.; et al. In Situ Investigation of Reversible Exsolution/Dissolution of CoFe Alloy Nanoparticles in a Co-Doped Sr2Fe1.5Mo0.5O6-δ Cathode for CO2 Electrolysis. Adv. Mater. 2020, 32, 1906193. [Google Scholar] [CrossRef]
  44. Neagu, D.; Kyriakou, V.; Roiban, I.L.; Aouine, M.; Tang, C.Y.; Caravaca, A.; Kousi, K.; Schreur-Piet, I.; Metcalfe, I.S.; Vernoux, P.; et al. In Situ Observation of Nanoparticle Exsolution from Perovskite Oxides: From Atomic Scale Mechanistic Insight to Nanostructure Tailoring. ACS Nano 2019, 13, 12996–13005. [Google Scholar] [CrossRef]
  45. Jo, Y.R.; Koo, B.; Seo, M.J.; Kim, J.K.; Lee, S.; Kim, K.; Han, J.W.; Jung, W.; Kim, B.J. Growth Kinetics of Individual Co Particles Ex-solved on SrTi0.75Co0.25O3-δ Polycrystalline Perovskite Thin Films. J. Am. Chem. Soc. 2019, 141, 6690–6697. [Google Scholar] [CrossRef]
  46. Lu, J.H.; Zhu, C.L.; Pan, C.C.; Lin, W.L.; Lemmon, J.P.; Chen, F.L.; Li, C.S.; Xie, K. Highly efficient electrochemical reforming of CH4/CO2 in a solid oxide electrolyser. Sci. Adv. 2018, 4, eaar5100. [Google Scholar] [CrossRef] [PubMed] [Green Version]
  47. Gines, M.J.L.; Marchi, A.J.; Apesteguia, C.R. Kinetic study of the reverse water-gas shift reaction over CuO/ZnO/Al2O3 catalysts. Appl. Catal. A Gen. 1997, 154, 155–171. [Google Scholar] [CrossRef]
  48. Opitz, A.K.; Nenning, A.; Rameshan, C.; Kubicek, M.; Goetsch, T.; Blume, R.; Haevecker, M.; Knop-Gericke, A.; Rupprechter, G.; Kloetzer, B.; et al. Surface Chemistry of Perovskite-Type Electrodes During High Temperature CO2 Electrolysis Investigated by Operando Photoelectron Spectroscopy. ACS Appl. Mater. Interfaces 2017, 9, 35847–35860. [Google Scholar] [CrossRef] [PubMed]
  49. Zhang, J.W.; Gao, M.R.; Luo, J.L. In Situ Exsolved Metal Nanoparticles: A Smart Approach for Optimization of Catalysts. Chem. Mater. 2020, 32, 5424–5441. [Google Scholar] [CrossRef]
  50. Rameshan, R.; Nenning, A.; Raschhofer, J.; Lindenthal, L.; Ruh, T.; Summerer, H.; Opitz, A.K.; Huber, T.M.; Rameshan, C. Novel Sample-Stage for Combined Near Ambient Pressure X-ray Photoelectron Spectroscopy, Catalytic Characterization and Electrochemical Impedance Spectroscopy. Crystals 2020, 10, 947. [Google Scholar] [CrossRef]
  51. Zeng, D.W.; Qiu, Y.; Peng, S.; Chen, C.; Zeng, J.M.; Zhang, S.; Xiao, R. Enhanced hydrogen production performance through controllable redox exsolution within CoFeAlOx spinel oxygen carrier materials. J. Mater. Chem. A 2018, 6, 11306–11316. [Google Scholar] [CrossRef]
  52. Biesinger, M.C.; Payne, B.P.; Grosvenor, A.P.; Lau, L.W.M.; Gerson, A.R.; Smart, R.S.C. Resolving surface chemical states in XPS analysis of first row transition metals, oxides and hydroxides: Cr, Mn, Fe, Co and Ni. Appl. Surf. Sci. 2011, 257, 2717–2730. [Google Scholar] [CrossRef]
  53. Lindenthal, L.; Popovic, J.; Rameshan, R.; Huber, J.; Schrenk, F.; Ruh, T.; Nenning, A.; Löffler, S.; Opitz, A.K.; Rameshan, C. Novel perovskite catalysts for CO2 utilization—Exsolution enhanced reverse water-gas shift activity. Appl. Catal. B Environ. 2021, 292, 120183. [Google Scholar] [CrossRef]
  54. Sambalova, O.; Billeter, E.; Mann, J.; Miyayama, T.; Burnat, D.; Heel, A.; Bleiner, D.; Borgschulte, A. Hard and soft X-ray photoelectron spectroscopy for selective probing of surface and bulk chemical compositions in a perovskite-type Ni catalyst. Surf. Interface Anal. 2020, 52, 811–817. [Google Scholar] [CrossRef]
  55. Gao, Y.; Chen, D.; Saccoccio, M.; Lu, Z.; Ciucci, F. From material design to mechanism study: Nanoscale Ni exsolution on a highly active A-site deficient anode material for solid oxide fuel cells. Nano Energy 2016, 27, 499–508. [Google Scholar] [CrossRef]
  56. Kwon, O.; Joo, S.; Choi, S.; Sengodan, S.; Kim, G. Review on exsolution and its driving forces in perovskites. J. Phys. Energy 2020, 2, 032001. [Google Scholar] [CrossRef]
  57. Pechini, M.P. Method of Preparing Lead and Alkaline Earth Titanates and Niobates and Coating Method Using the Same to Form a Capacitor. U.S. Patent 3,330,697, 11 July 1967. [Google Scholar]
  58. Schindelin, J.; Arganda-Carreras, I.; Frise, E.; Kaynig, V.; Longair, M.; Pietzsch, T.; Preibisch, S.; Rueden, C.; Saalfeld, S.; Schmid, B.; et al. Fiji: An open-source platform for biological-image analysis. Nat. Methods 2012, 9, 676–682. [Google Scholar] [CrossRef] [PubMed] [Green Version]
  59. Cromey, D.W. Avoiding Twisted Pixels: Ethical Guidelines for the Appropriate Use and Manipulation of Scientific Digital Images. Sci. Eng. Ethics 2010, 16, 639–667. [Google Scholar] [CrossRef] [PubMed]
  60. Price-Whelan, A.M.; Sipocz, B.M.; Gunther, H.M.; Lim, P.L.; Crawford, S.M.; Conseil, S.; Shupe, D.L.; Craig, M.W.; Dencheva, N.; Ginsburg, A.; et al. The Astropy Project: Building an Open-science Project and Status of the v2.0 Core Package. Astron. J. 2018, 156, 123. [Google Scholar] [CrossRef]
  61. Robitaille, T.P.; Tollerud, E.J.; Greenfield, P.; Droettboom, M.; Bray, E.; Aldcroft, T.; Davis, M.; Ginsburg, A.; Price-Whelan, A.M.; Kerzendorf, W.E.; et al. Astropy: A community Python package for astronomy. Astron. Astrophys. 2013, 558, A33. [Google Scholar] [CrossRef]
  62. Burges, D.R., Jr. Thermochemical Data. In NIST Chemistry WebBook, NIST Standard Reference Database Number 69; Linstrom, P.J., Mallard, W.G., Eds.; National Institute of Standards and Technology: Gaithersburg, MD, USA, 2018. [Google Scholar] [CrossRef]
  63. Lindenthal, L.; Buchinger, R.; Drexler, H.; Schrenk, F.; Ruh, T.; Rameshan, C. Exsolution Catalysts—Increasing Metal Efficiency. Encyclopedia 2021, 1, 249–260. [Google Scholar] [CrossRef]
  64. Wang, Y.; Yan, X.; Chen, J.; Deng, J.; Yu, R.; Xing, X. Shape controllable synthesis of NdFeO3 micro single crystals by a hydrothermal route. CrystEngComm 2014, 16, 858–862. [Google Scholar] [CrossRef]
  65. Lerou, J.J.; Froment, G.F. Velocity, Temperature and Conversion Profiles in Fixed-Bed Catalytic Reactors. Chem. Eng. Sci. 1977, 32, 853–861. [Google Scholar] [CrossRef]
Figure 1. rWGS reaction with a CO2 to H2 ratio of 1:1 on Nd0.6Ca0.4Fe0.9Co0.1O3-δ. A temperature ramp between 300 °C and 700 °C with a linear increase of 80 °C h−1 was carried out. CO formation started around 375 °C. With increasing temperature, CO formation increased to a maximum of ~8 mol% at 700 °C. This experiment was performed with a reduced amount of catalyst (~5 mg) to stay below the thermodynamic limit.
Catalysts 11 01484 g001
Figure 2. Comparison of different CO2 to H2 ratios (from 1:1 to 15:1) that were used in rWGS reactions. (a) Experimental results of the reaction on Nd0.6Ca0.4Fe0.9Co0.1O3-δ. In all experiments, the temperature was increased using a linear ramp of 80 °C h−1 between 300 °C and 700 °C. With decreasing H2 content, less CO was formed during reaction. (b) Calculated equilibrium concentrations of CO, marking the thermodynamic limit.
Catalysts 11 01484 g002
Figure 3. SEM images of Nd0.6Ca0.4Fe0.9Co0.1O3-δ: (a) pristine perovskite after calcination; (b,d) after reaction using a CO2 to H2 ratio of 1:1; (c,f) after reaction using a CO2 to H2 ratio of 15:1. After both experiments, nanoparticle formation could be observed. In (b,c), CaCO3 formation can be seen. For the marked areas in (d,f), particle analyses were performed with the results being shown as histograms in (e,g), respectively.
Catalysts 11 01484 g003
Figure 4. CO formation during two different double ramp rWGS experiments on Nd0.6Ca0.4Fe0.9Co0.1O3-δ. Two different hysteresis loops could be observed. When increasing the reaction temperature up to 700 °C (dotted lines), reduced activities were observed during cooling (due to the formation of CaCO3 at high temperatures), whereas stopping at 570 °C (full lines) resulted in a higher activity during cooling. The increased activity during the second double ramp was caused by the formed nanoparticles on the surface, which were present in the first double ramp as well but were counteracted by the deactivation via blocking of active surface by CaCO3 formation.
Catalysts 11 01484 g004
Figure 5. SEM image of Nd0.6Ca0.4Fe0.9Co0.1O3-δ after the double ramp experiment with an end temperature of 570 °C. Finely dispersed nanoparticles were visible on the surface, but no formation of CaCO3 crystallites could be observed.
Catalysts 11 01484 g005
Figure 6. CO formation during double ramp rWGS experiments on (a) Nd0.6Ca0.4Fe0.97Co0.03O3-δ (maximum temperatures 570 °C and 700 °C) and (b) Nd0.6Ca0.4Fe0.97Ni0.03O3-δ (maximum temperature 600 °C and 700 °C). In all cases, a similar hysteresis loop could be observed, where reduced activities were observed during cooling (due to formation of CaCO3 at high temperatures).
Catalysts 11 01484 g006
Figure 7. NAP-XPS spectra of the (a) Co 2p and (b) Fe 2p regions of Nd0.6Ca0.4Fe0.9Co0.1O3-δ in rWGS atmosphere with a CO2 to H2 ratio of 1:1 at increasing temperatures. Both species are initially present as oxides, but a metallic component starts to become visible from 660 °C. While approximately stable for Fe, it is growing for Co. Overlapping Auger peaks and satellites have been omitted for clarity.
Catalysts 11 01484 g007
Figure 8. NAP-XPS spectra of the (a) Ni 2p and (b) Fe 2p regions of Nd0.6Ca0.4Fe0.97Ni0.03O3-δ in rWGS atmosphere with a CO2 to H2 ratio of 1:1 at increasing temperatures. While a metallic component starts to evolve for Ni already at 500 °C, metallic Fe is only visible from 660 °C on. For both elements, the metallic contribution increases with higher temperatures. Overlapping Auger peaks and satellites have been omitted for clarity.
Catalysts 11 01484 g008
Figure 9. Elemental trends during the NAP-XPS experiments at increasing temperature for (a) Nd0.6Ca0.4Fe0.9Co0.1O3-δ and (b) Nd0.6Ca0.4Fe0.97Ni0.03O3-δ. The presented values are the ratios of the respective peak areas relative to the ratio at the lowest temperature. Note that the right axis with a different scaling is used for the CO3:A ratio in (a), and for the Ca:Nd ratio in (b).
Catalysts 11 01484 g009
Figure 10. Co 2p NAP-XPS signals that were obtained during rWGS at 600 °C with different ratios of CO2 to H2. Metallic Co and Co-oxide contributions can be identified. The ratio of metallic Co to Co-oxide increases with lower CO2 (and higher H2 partial pressure), indicating a higher amount of reduced Co at the surface.
Catalysts 11 01484 g010
Table 1. Mole fractions in the gas stream with a CO2 to H2 ratio of a : 1 in the initial mixture and after an arbitrary amount of the educts reacted.
CO2H2COH2O
Initial
a 2 1 + a
1 2 1 + a
00
Reacted
a y 2 1 + a
1 y 2 1 + a
y 2 1 + a
y 2 1 + a
Publisher’s Note: MDPI stays neutral with regard to jurisdictional claims in published maps and institutional affiliations.

