Article

Photodegradation of Carbol Fuchsin Dye Using an Fe2−xCuxZr2−xWxO7 Photocatalyst under Visible-Light Irradiation

1
Hamdi Mango Center for Scientific Research, The University of Jordan, Amman 11942, Jordan
2
Nanotechnology Center, The University of Jordan, Amman 11942, Jordan
3
Department of Basic Sciences, Faculty of Arts and Sciences, Al-Ahliyya Amman University, Amman 19328, Jordan
4
National Research Centre, Inorganic Chemistry Department, Cairo 12622, Egypt
5
National Research Center, Water Pollution Control Department, Cairo 12622, Egypt
6
Chemistry Department, School of Science, The University of Jordan, Amman 11942, Jordan
*
Authors to whom correspondence should be addressed.
These authors contributed equally to the manuscript.
Catalysts 2021, 11(12), 1473; https://doi.org/10.3390/catal11121473
Submission received: 6 August 2021 / Revised: 12 November 2021 / Accepted: 24 November 2021 / Published: 1 December 2021

Abstract

:
Fe2−xCuxZr2−xWxO7 (x: 0, 0.05, 0.015) nanoparticles were synthesized following the Pechini method and characterized via X-ray diffraction (XRD), transmission electron microscopy (TEM), and diffuse reflectance spectroscopy (DRS) measurements to be used as photocatalysts in colored water remediation. All of the prepared materials were crystallized in a cubic fluorite phase as the major phase. The band gap was reduced upon doping with W6+ and Cu2+ from 1.96 eV to 1.47 eV for Fe1.85Cu0.15Zr1.85W0.15O7. Carbol fuchsin (CF) dye was used to determine the photocatalytic degradation efficiency of the prepared catalysts. Degradation efficiency was directly proportional to the dopant’s concentration. Complete removal of 20 mg/L CF was achieved under optimal conditions (pH 9, and catalyst loading of 1.5 g/L) using Fe1.85Cu0.15Zr1.85W0.15O7. The degradation rate followed pseudo-first-order kinetics. The reusability for photocatalysts was tested five times, decreasing its efficiency by 4% after the fifth cycle, which indicates that the prepared Fe1.85Cu0.15Zr1.85W0.15O7 photocatalyst is a promising novel photocatalyst due to its superior efficiency in dye photodegradation.

1. Introduction

Water can be contaminated by various industrial effluents, such as dyes, detergents, phenol compounds, heavy metals, and many others. The tremendous demand for textile products causes an accumulation of dye products in wastewater, with the World Bank estimating that 17–20% of these pollutants derive from the textile industry. These pollutants have long-lasting consequences on the environment, since dyes are stable compounds that last for a long time [1].
Dyes are organic colorants that are generally made up of water-soluble materials, and which have been used increasingly in industries all over the world [2]. Carbol fuchsin (CF) dye is one of the pollutants that are found in industrial wastewater [3]. CF is a mixture of phenol and basic fuchsin (BF), which is a common red dye that is widely used for dying different materials—such as leather, paper, and cotton—and for biological staining [4].
Dye-contaminated water is generally treated using cation-exchange membranes [5], electrochemical degradation [6,7] adsorption/precipitation processes [8], and photocatalytic degradation [9,10,11,12,13,14,15].
Recently, photocatalytic degradation has gained much attention as a proper method for water treatment because of its ability to degrade complex organic dyes into simple products. Photocatalysts are not directly involved in the oxidation reaction; however, it is known that the main reactions involved in photocatalytic degradations are the electron–hole interfacial redox reactions, which are generated when the photocatalyst is subjected to light of sufficient energy [13]; they create high levels of oxidizing species (OH, O2−) that cause complex organic molecules to degrade in the presence of light due to the difference in potential between oxidizing species and the organic matter [11,16]. Different types of photocatalysts have been used for dye degradation in wastewater, such as metals and metal oxides [2,17,18], carbon-based nanostructures [19,20], semiconductors [21,22], and metal–organic frameworks (MOFs) [23,24,25,26].
Photocatalytic degradation depends on the type and the concentration of the pollutants, the pH of the solution, the catalyst type, the composition and loading, and the intensity of light. To obtain an efficient treatment for polluted water, it is essential to understand the effects of these parameters on the degradation process [14]. Carbol fuchsin (CF) degradation was recently examined using metal oxide photocatalysts [3] (doped and undoped ferric oxide (Fe3O4)); they achieved 97% degradation using the doped catalyst under optimal conditions. In another recent study [27], La-doped Bi2O3 was used for the degradation of CF, achieving 89% degradation of CF under optimal conditions.
Metal oxides with the chemical formula A2B2O7 are crystallized in pyrochlore or defect fluorite structures, depending on the radius ratio (rA/rB) of the A and B cations, where the A site is occupied by a larger trivalent cation (usually a rare-earth element) while the B site is occupied by a smaller tetravalent cation (typically transition metals). When (rA/rB) is in the range of 1.46–1.78, a pyrochlore structure is obtained, while a defect fluorite structure is obtained at the upper or lower limits of this range [28]. Many studies are concerned with metal oxide photocatalysts (with the chemical formula A2B2O7 crystallized in a pyrochlore structure) for dye photodegradation. Some examples include Ln2Ce2O7 (Ln = Nd, Pr, or Eu) for the degradation of methylene blue (MB) dye [29], YLnTi2O7 (Ln = Nd, Sm, Eu, or Gd) for the degradation of MB [30], K2Ta2O6 for the degradation of rhodamine B [31], and Y2Ti2O7−xNx for the degradation of MB, rhodamine B, and 4-chlorophenol [32]. Less attention is given to metal oxides with the chemical formula A2B2O7 in the defect fluorite phase. Few studies are concerned with defect-fluorite A2B2O7 metal oxides as photocatalysts, such as the Ga2Zr2−xWxO7 system used for crystal violet degradation [33]. The Fe2Zr2−xWxO7 system is used for the photocatalytic degradation of methylene blue (MB) dye [28]. More light should be shed on A2B2O7 metal oxides with a defect fluorite structure, because of their impressive performance in the photocatalytic degradation of dyes. In the present framework, Cu was selected as a co-dopant because the differences in the ionic radii and oxidation states of Cu2+ and Fe3+ ions allow for the study of the effects of co-doping on the structural properties and photocatalytic activity of the Fe2Zr2−xWxO7 system. Furthermore, the effects of time, catalyst dose, pH, and initial dye concentration on the photocatalytic activity of the prepared system for the degradation of carbol fuchsin dye as a water contaminant model under visible-light irradiation were studied.

2. Results and Discussion

2.1. Photocatalysis Characterizations

All catalysts were prepared using the Pechini method. Table 1 shows the names and compositions of the prepared catalysts.

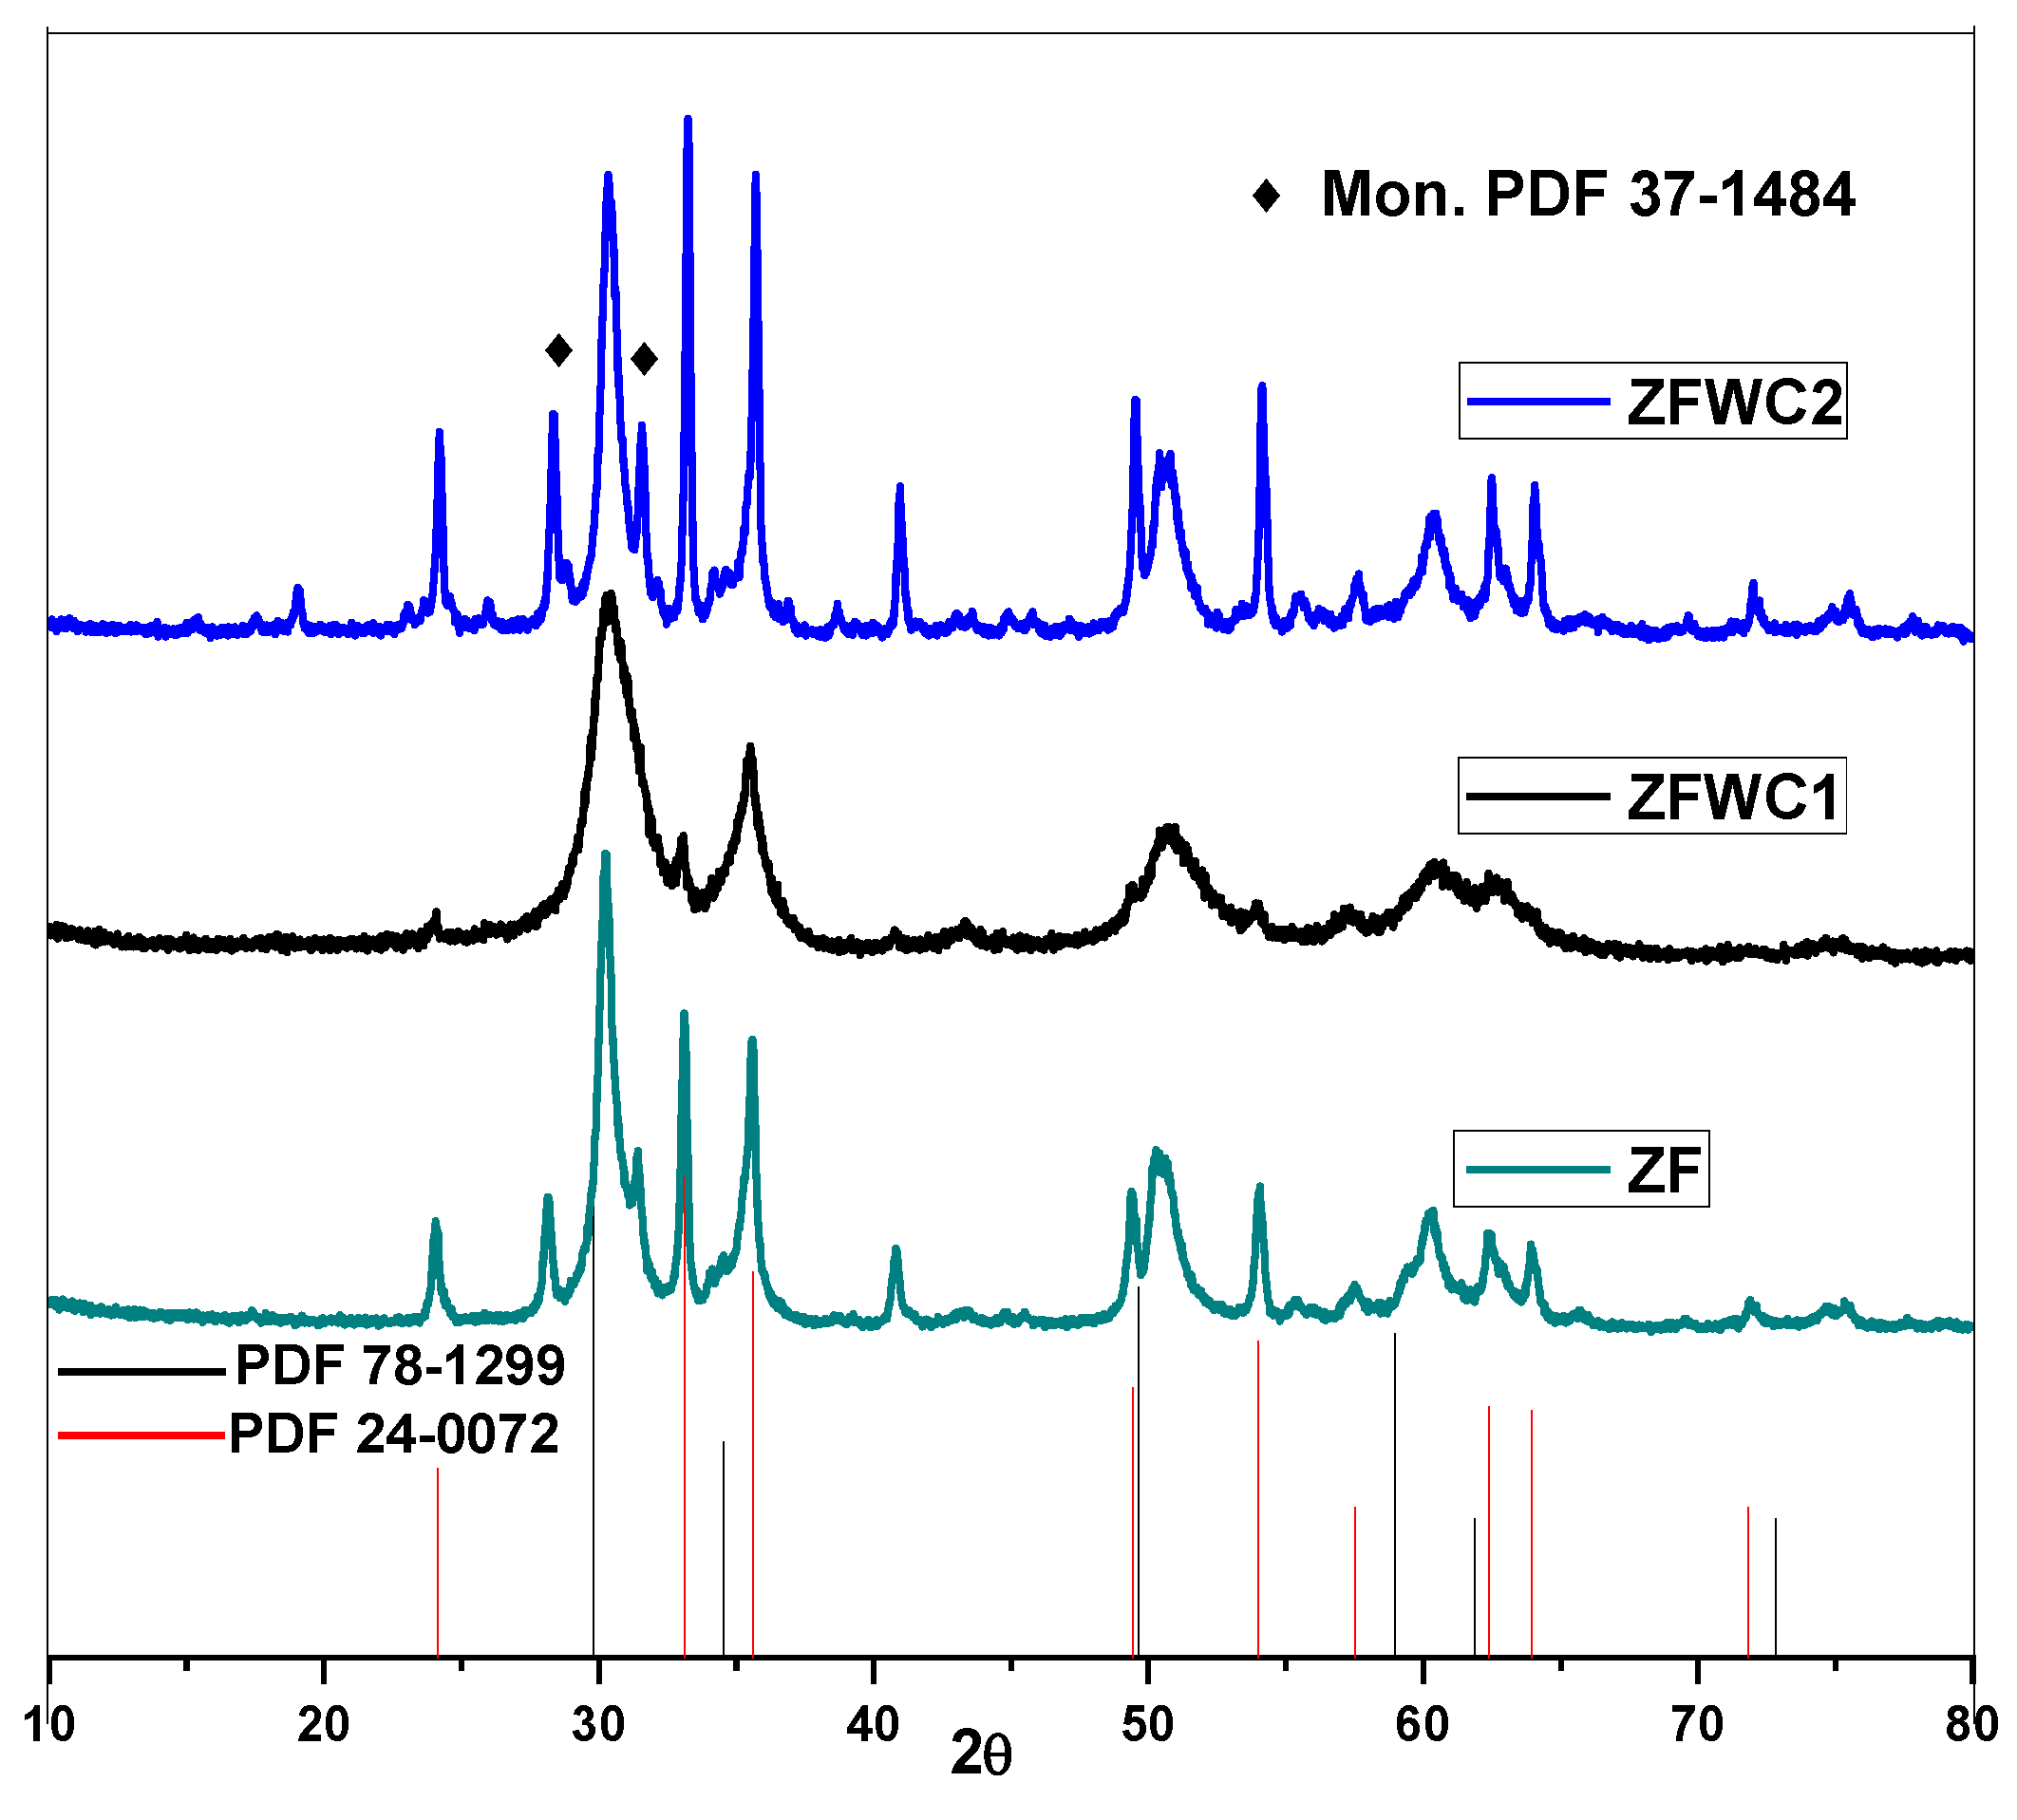
2.1.1. X-ray Diffraction

XRD patterns of ZF, ZFWC1, and ZFWC2 are shown in Figure 1. Fe2Zr2O7 was crystallized in a cubic fluorite phase (according to the best-matched card (PDF 78-1299) for Er0.5Zr0.5O1.75) as the major phase, along with a mixture of minor phases, consisting of a rhombohedral phase of Fe2O3 (PDF24-0072) and a monoclinic phase of ZrO2 (PDF 37-1484) [34].
Regarding W- and Cu-co-doped Fe2Zr2O7 samples, the ZFWC1 sample was crystallized in a major phase of cubic fluorite (PDF 78-1299) and a minor rhombohedral phase of Fe2O3 (PDF 24-0072). A mixture of phases was detected for ZFWC2; a major phase of cubic fluorite (PDF 78-1299) as well as minor phases of rhombohedral Fe2O3 (PDF 24-0072) and monoclinic ZrO2 (PDF 37-1484). The samples were shifted to a lower theta value compared to Er0.5Zr0.5O1.75 peaks. This can be attributed to the difference in the ionic radii between Fe3+ ions (ionic radius ls = 55 pm) and Er3+ ions (ionic radius = 89 pm). Similar results were found by Nasr [35], who prepared Ga−xCuxZr2−xWxO7 photocatalysts.
All samples were found to be in the nano-sized range (5–15 nm). There were slight variations in the calculated parameters for the different prepared catalysts, which first decreased and then increased upon co-doping (i.e., the co-doping starts to be effective as the concentration of Cu and W increases). The Zr4+ ions (ionic radius = 72 pm) are expected to be substituted by the smaller W6+ ions (ionic radius = 60 pm) [35], while the Fe3+ ions (ionic radius ls = 55 pm) are expected to be substituted by the larger Cu2+ ions (ionic radius = 73 pm) [36]. The increase in the parameters as the concentrations of Cu and W increase might be due to the difference between the ionic radii of Zr4+ and W6+ ions being smaller than that between Fe3+ and Cu2+ ions (Table 2).

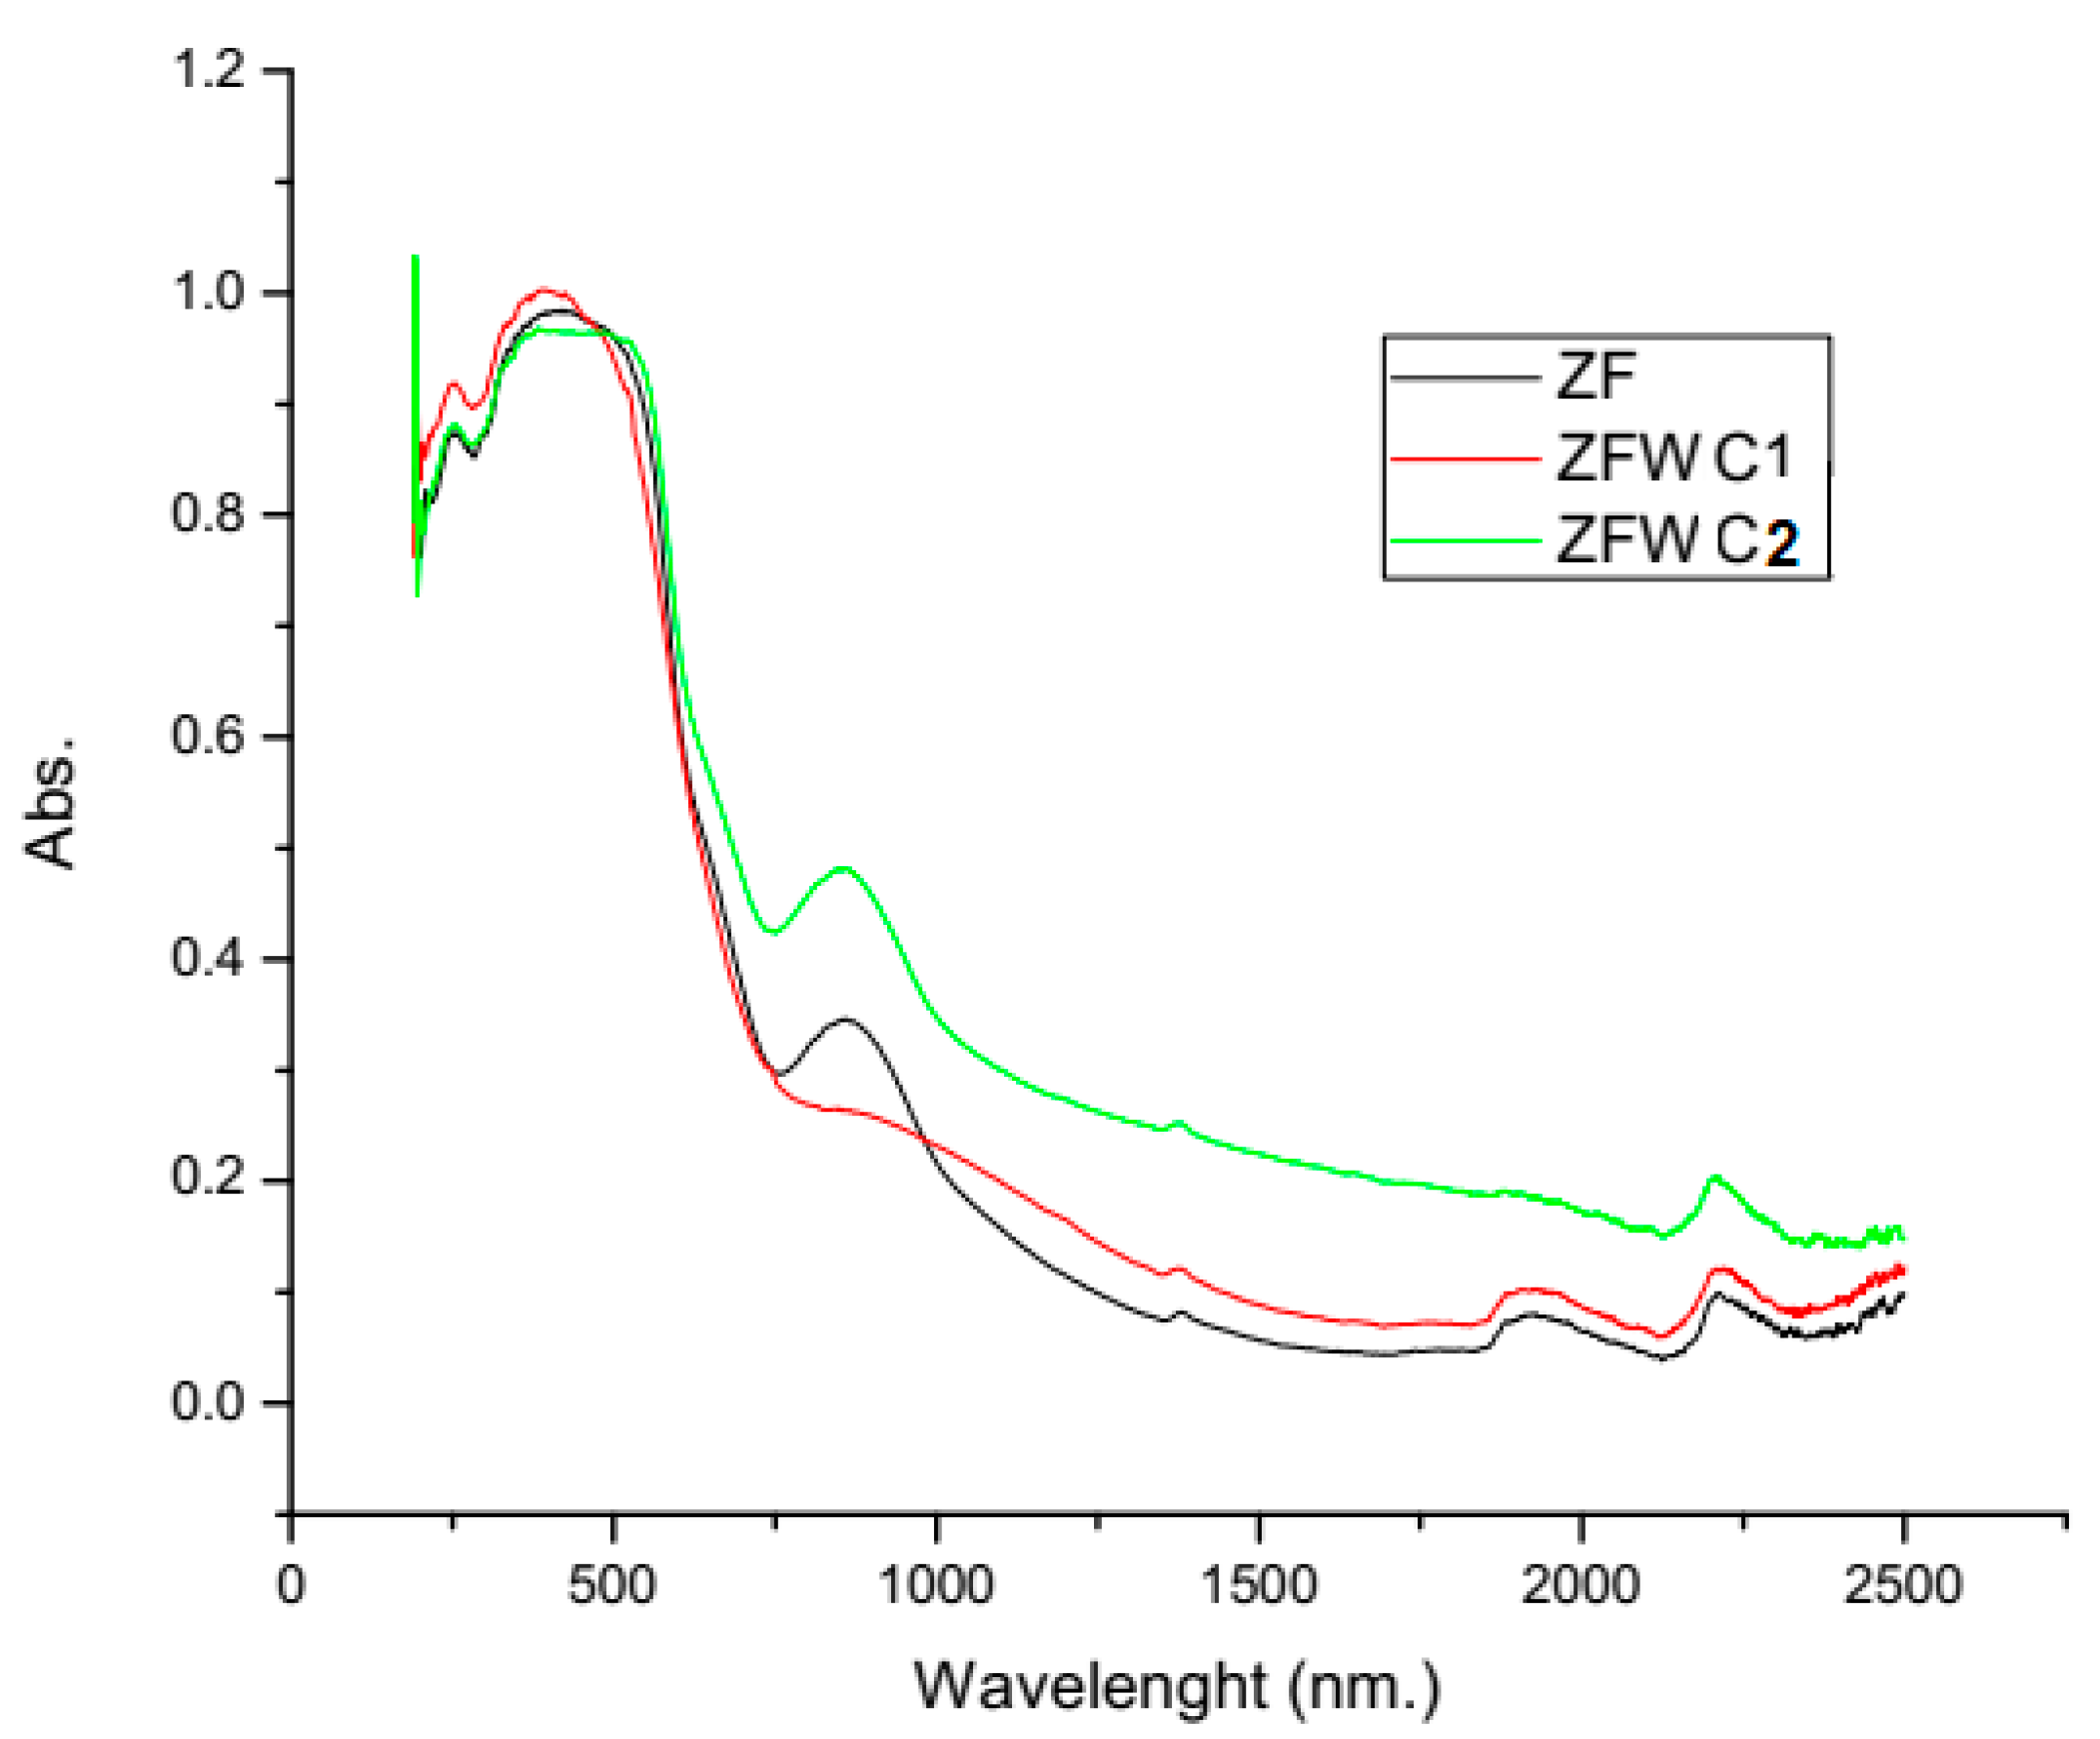
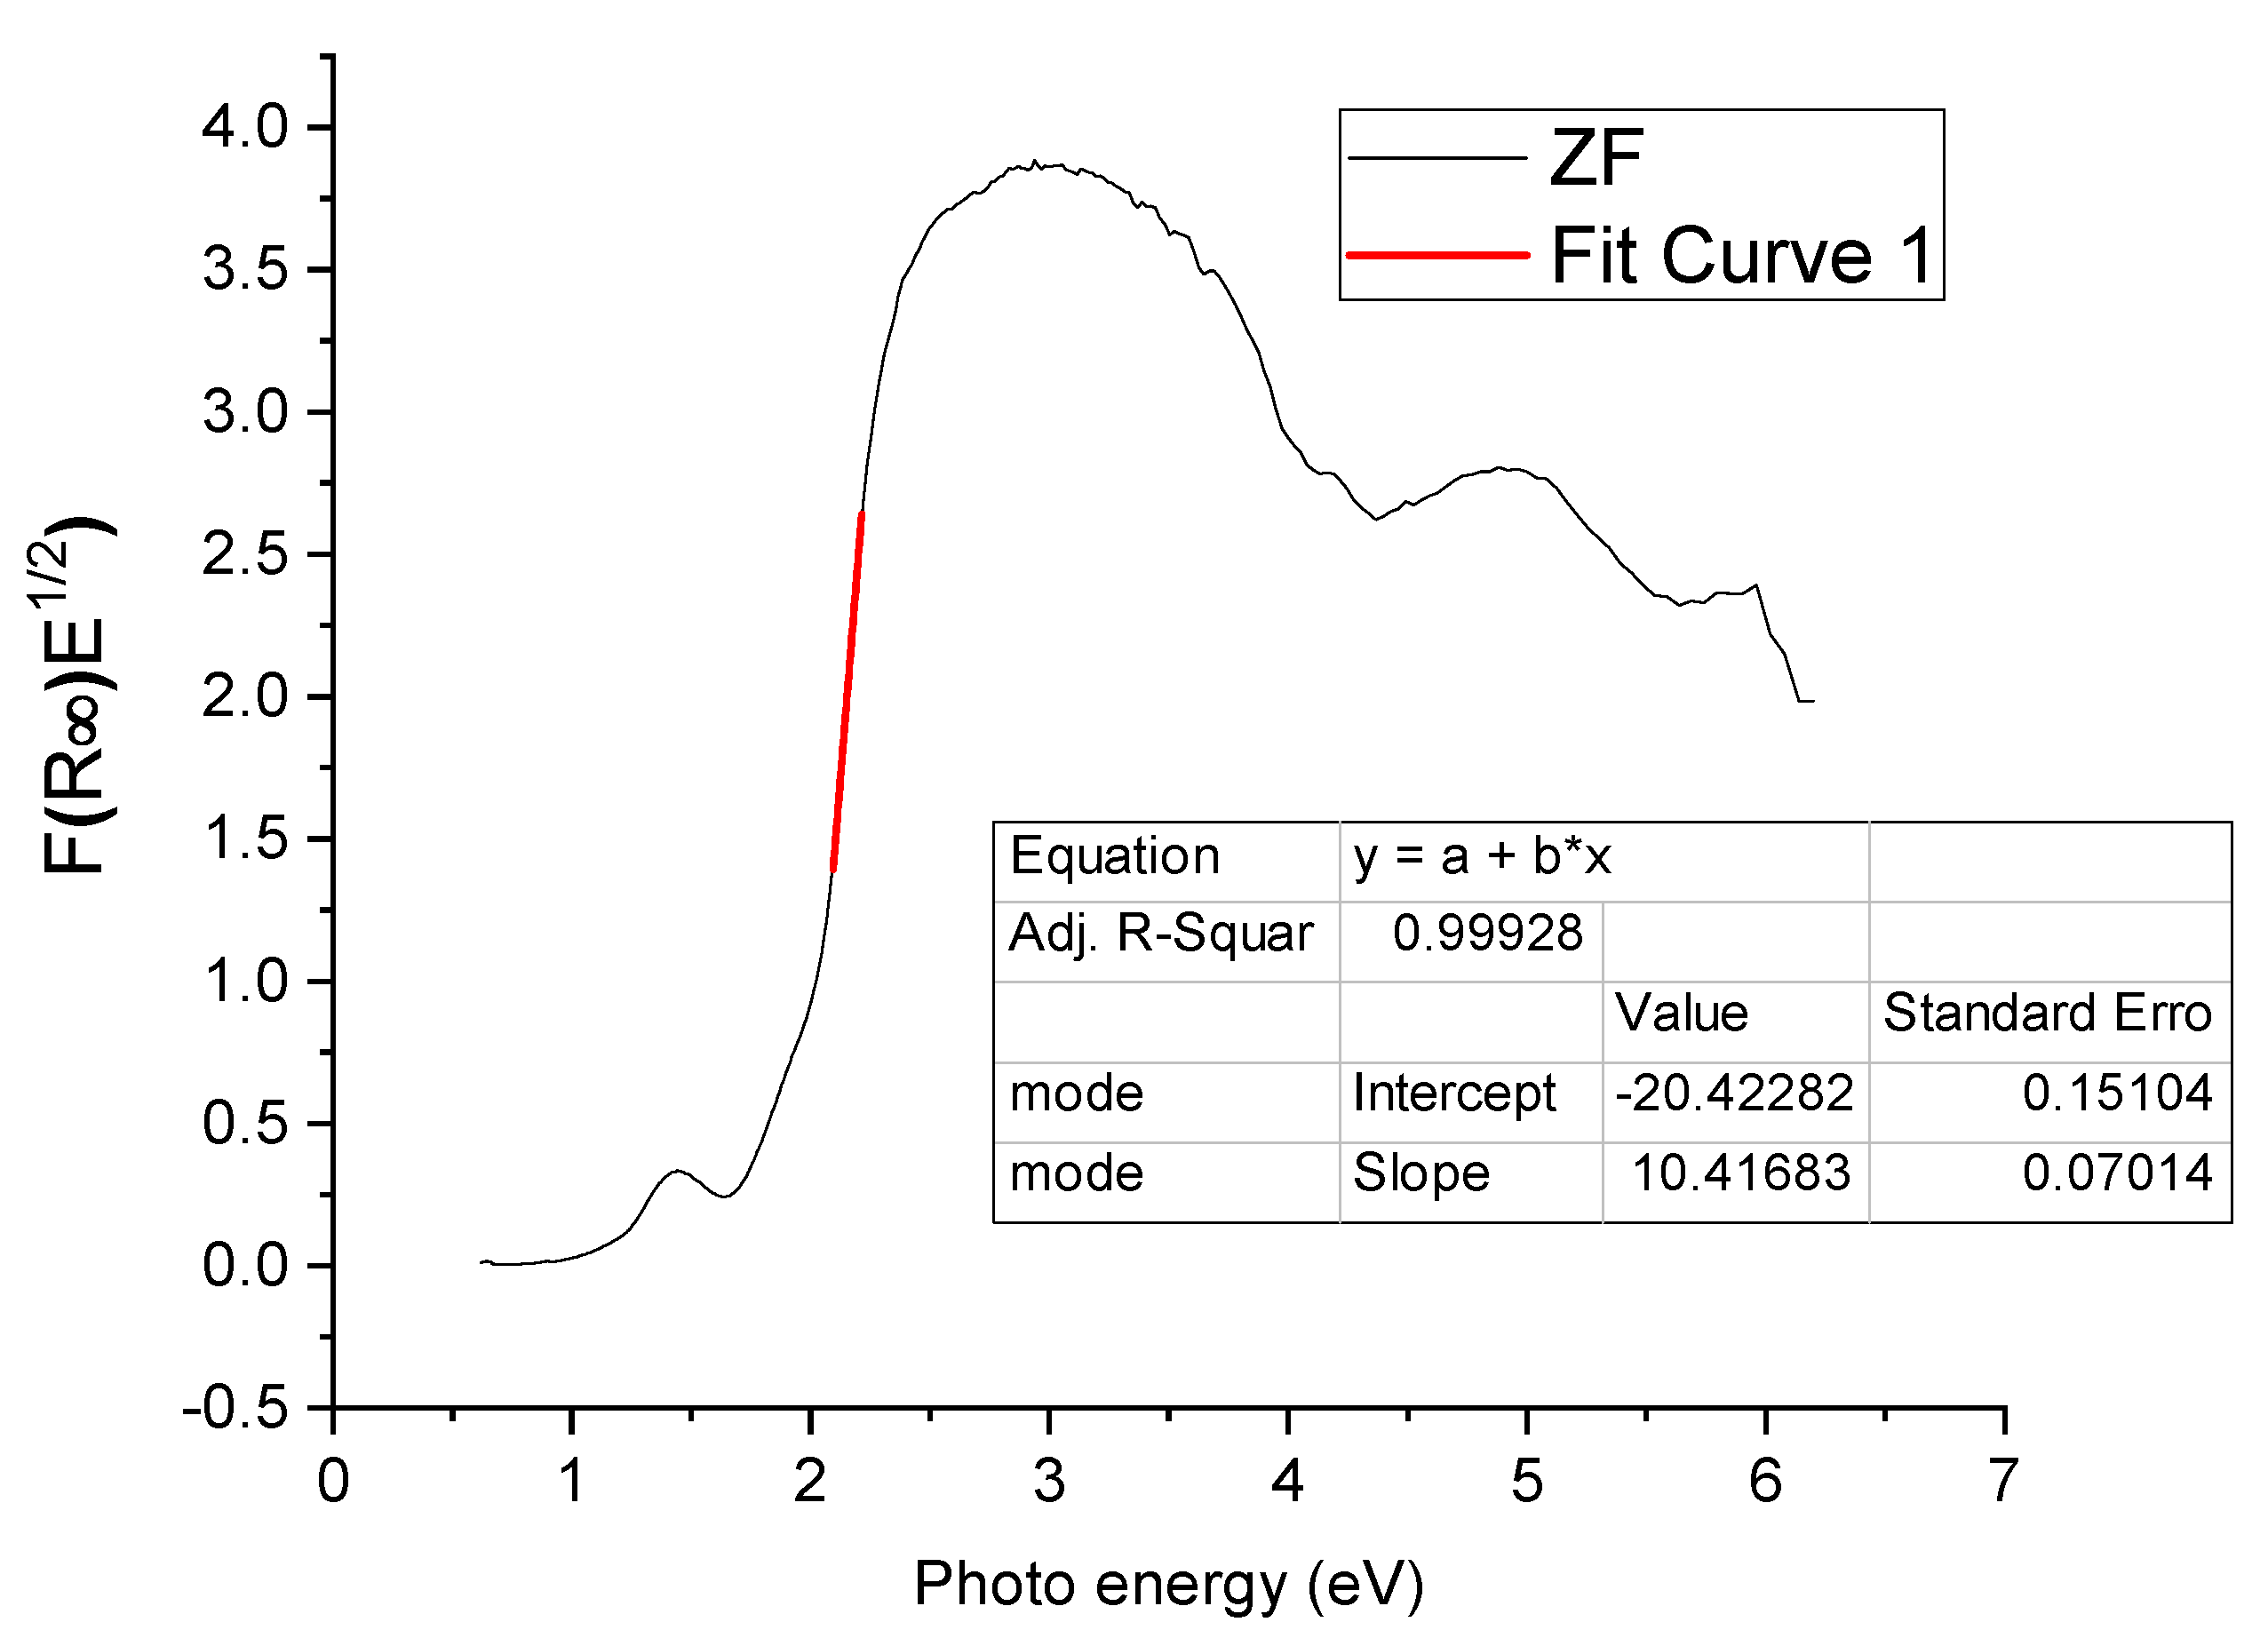
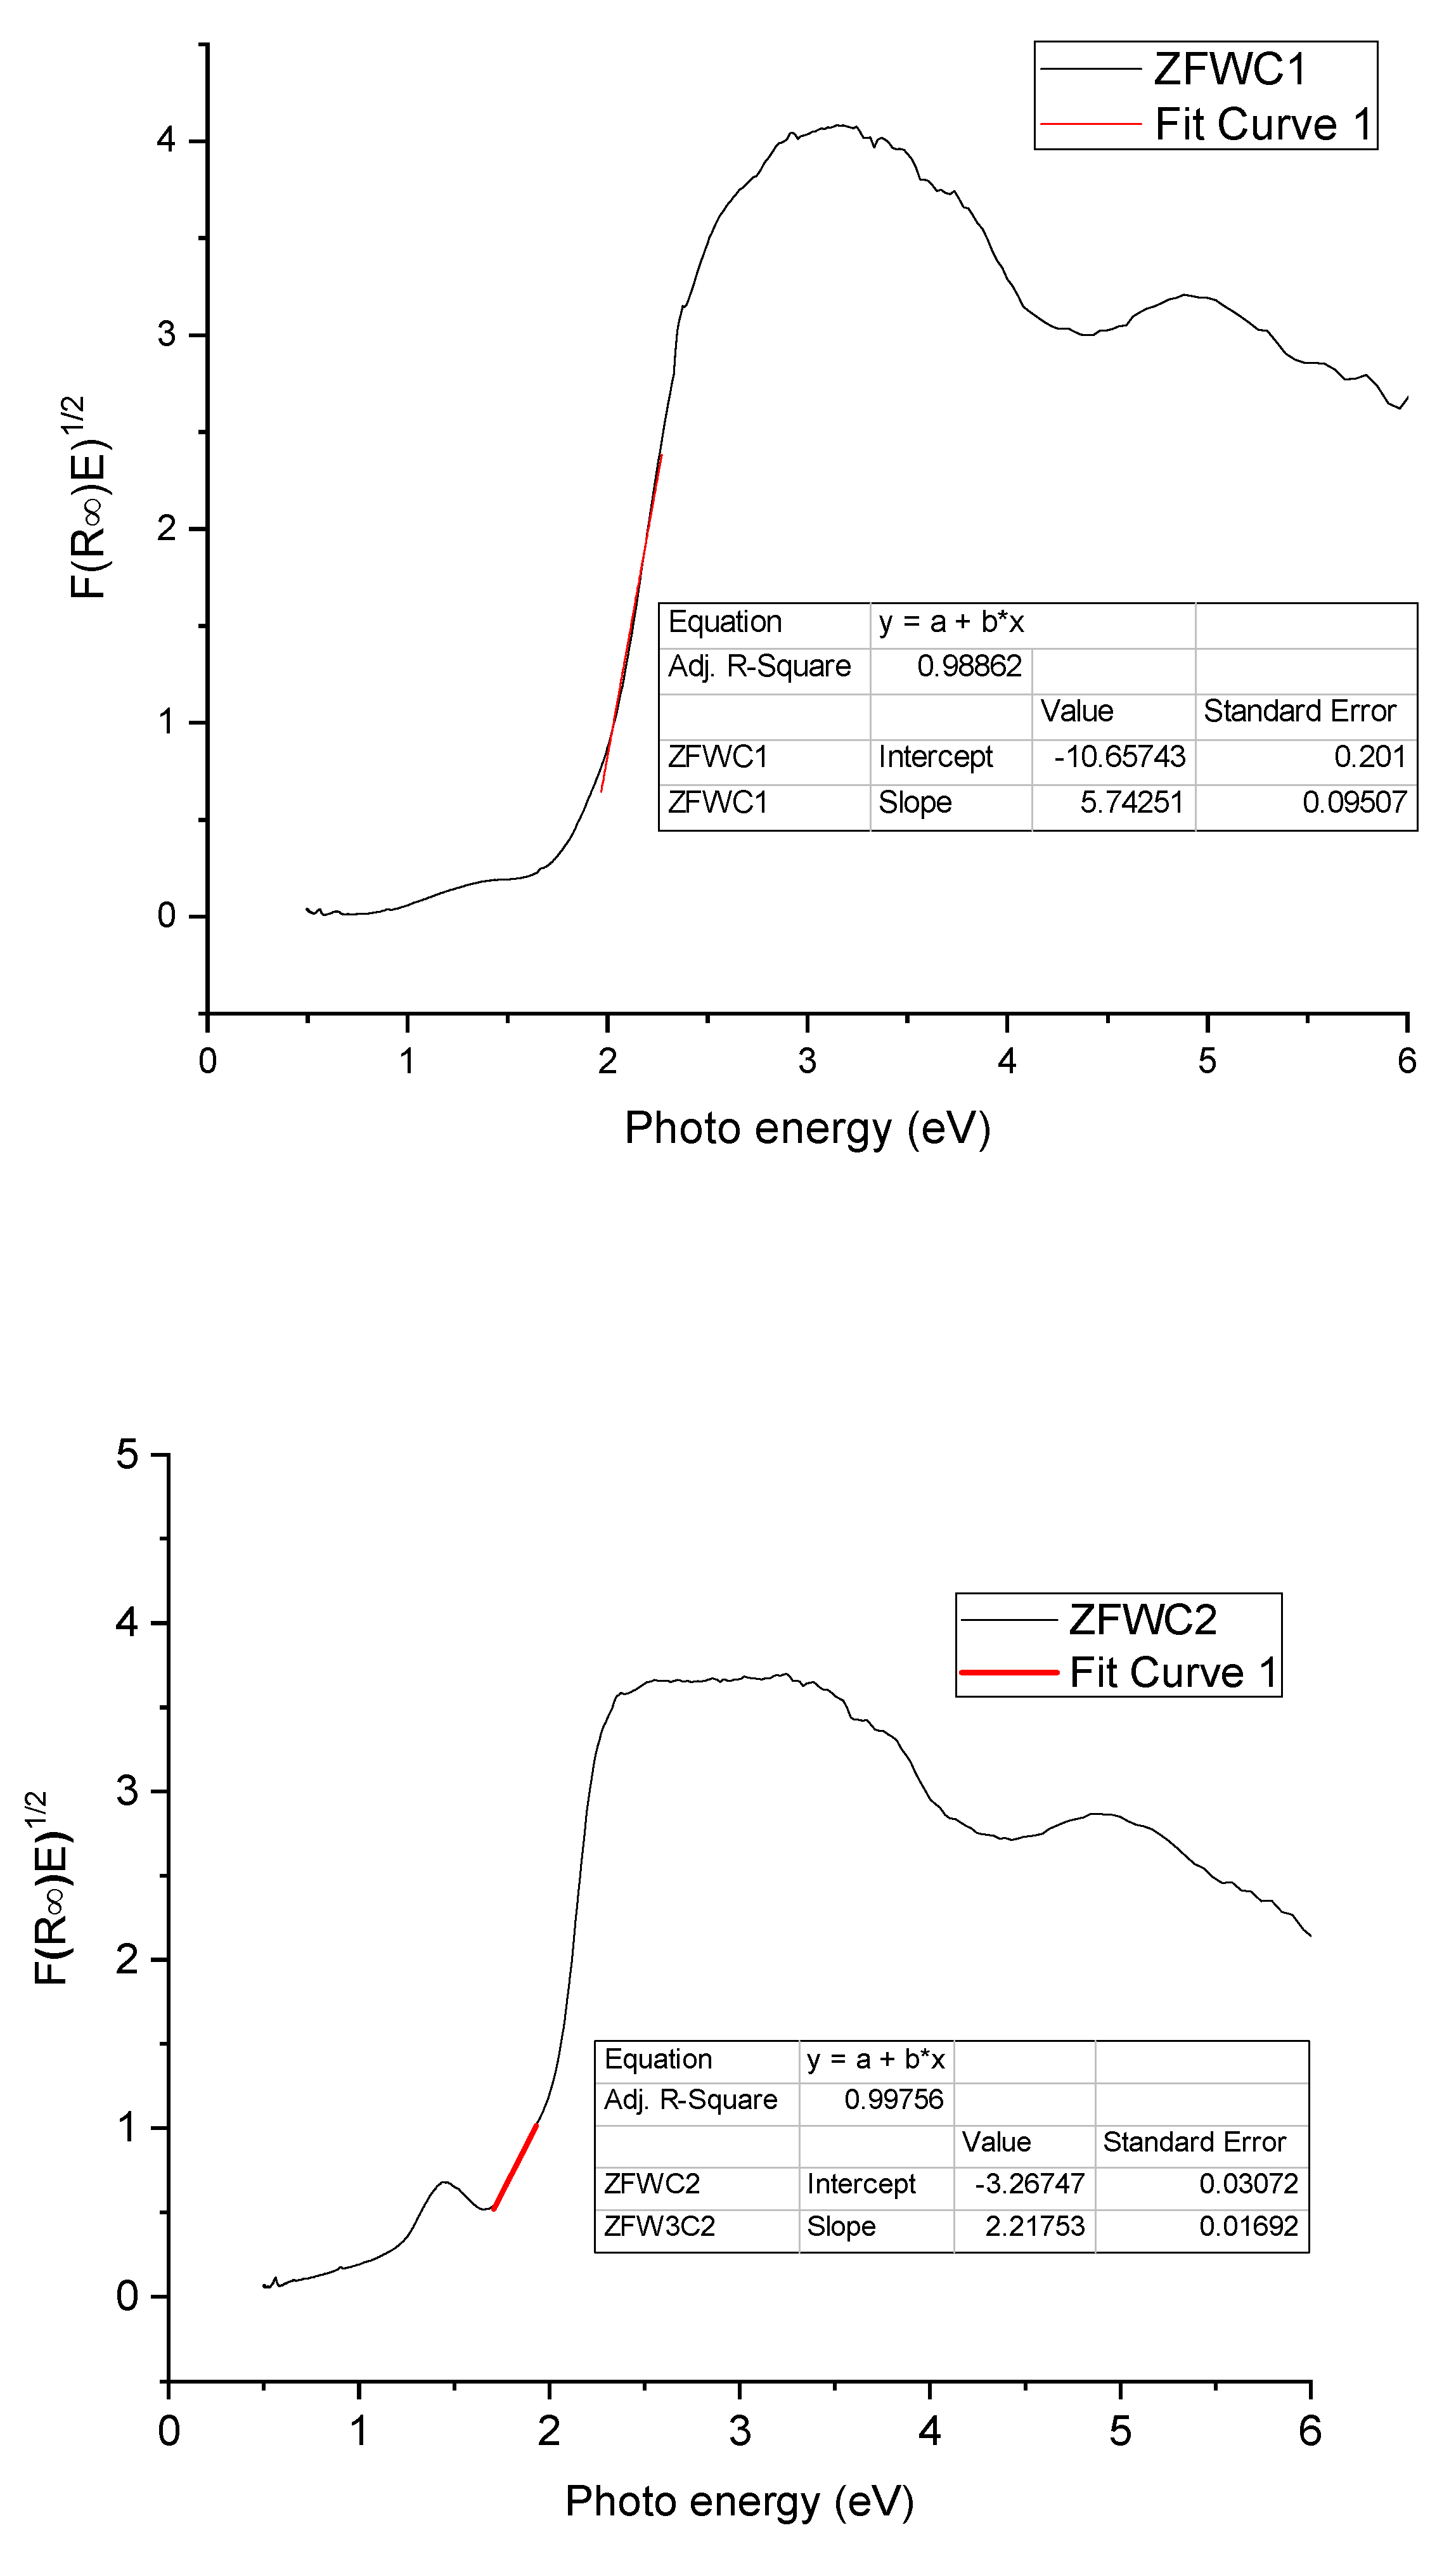
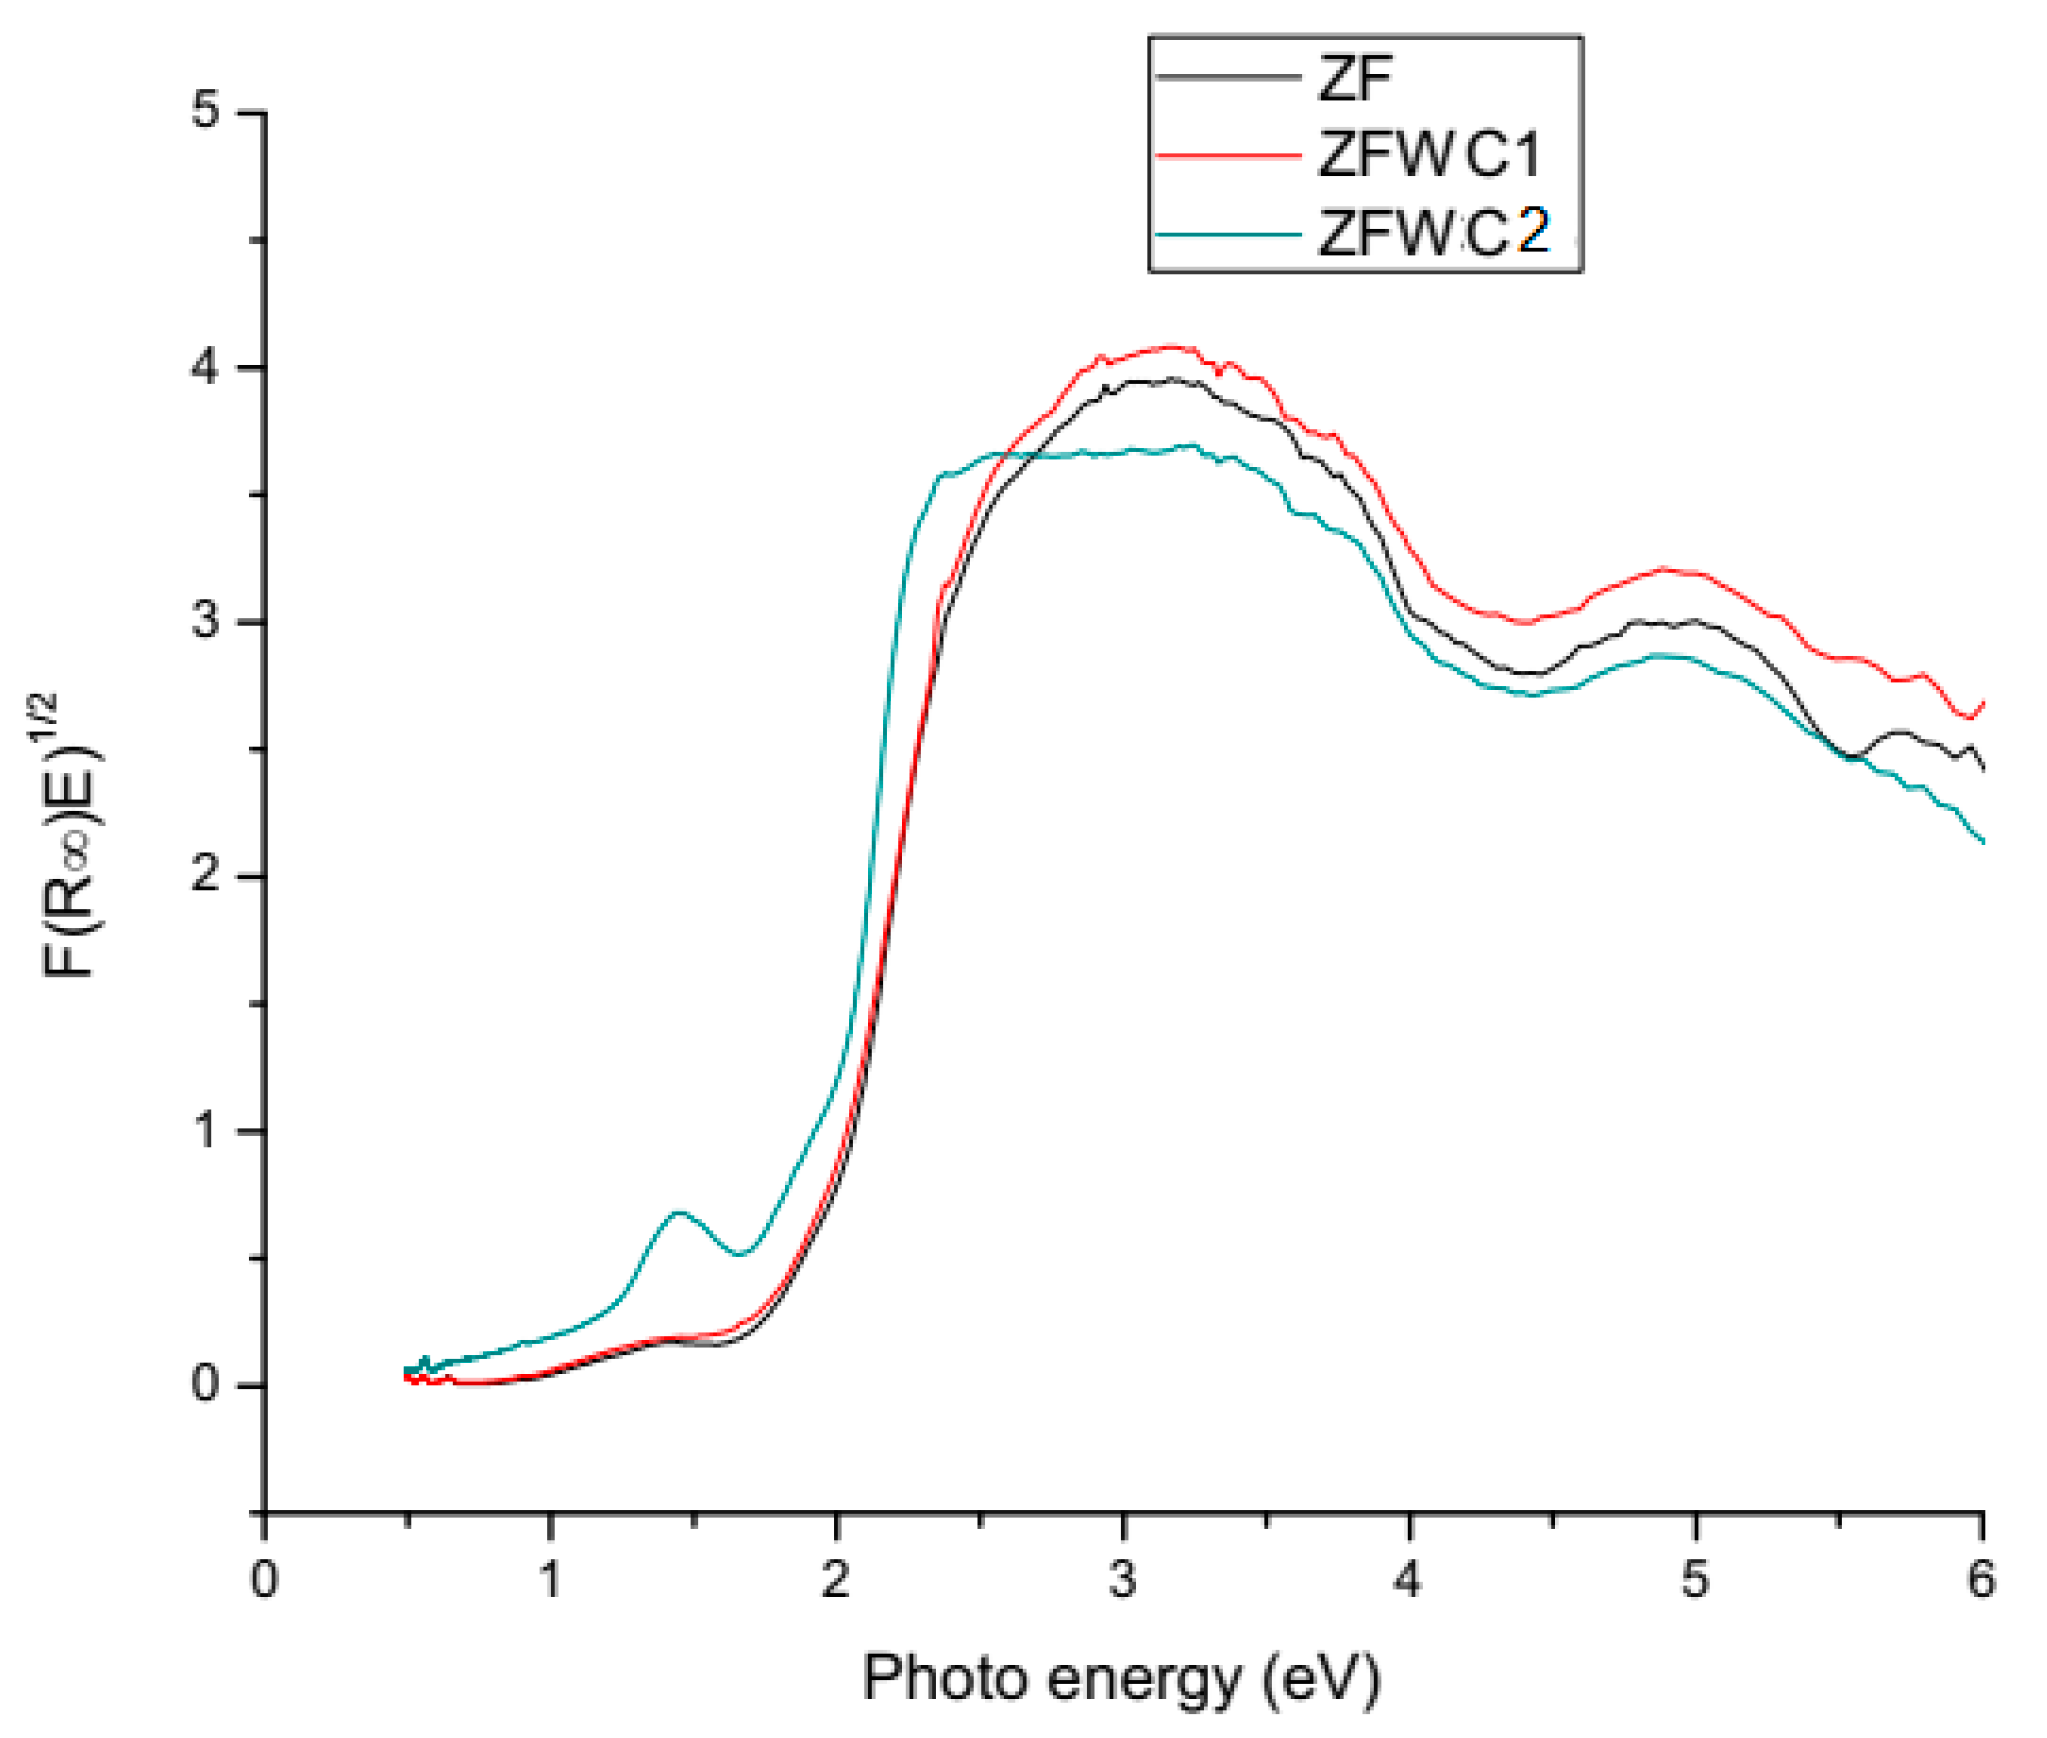
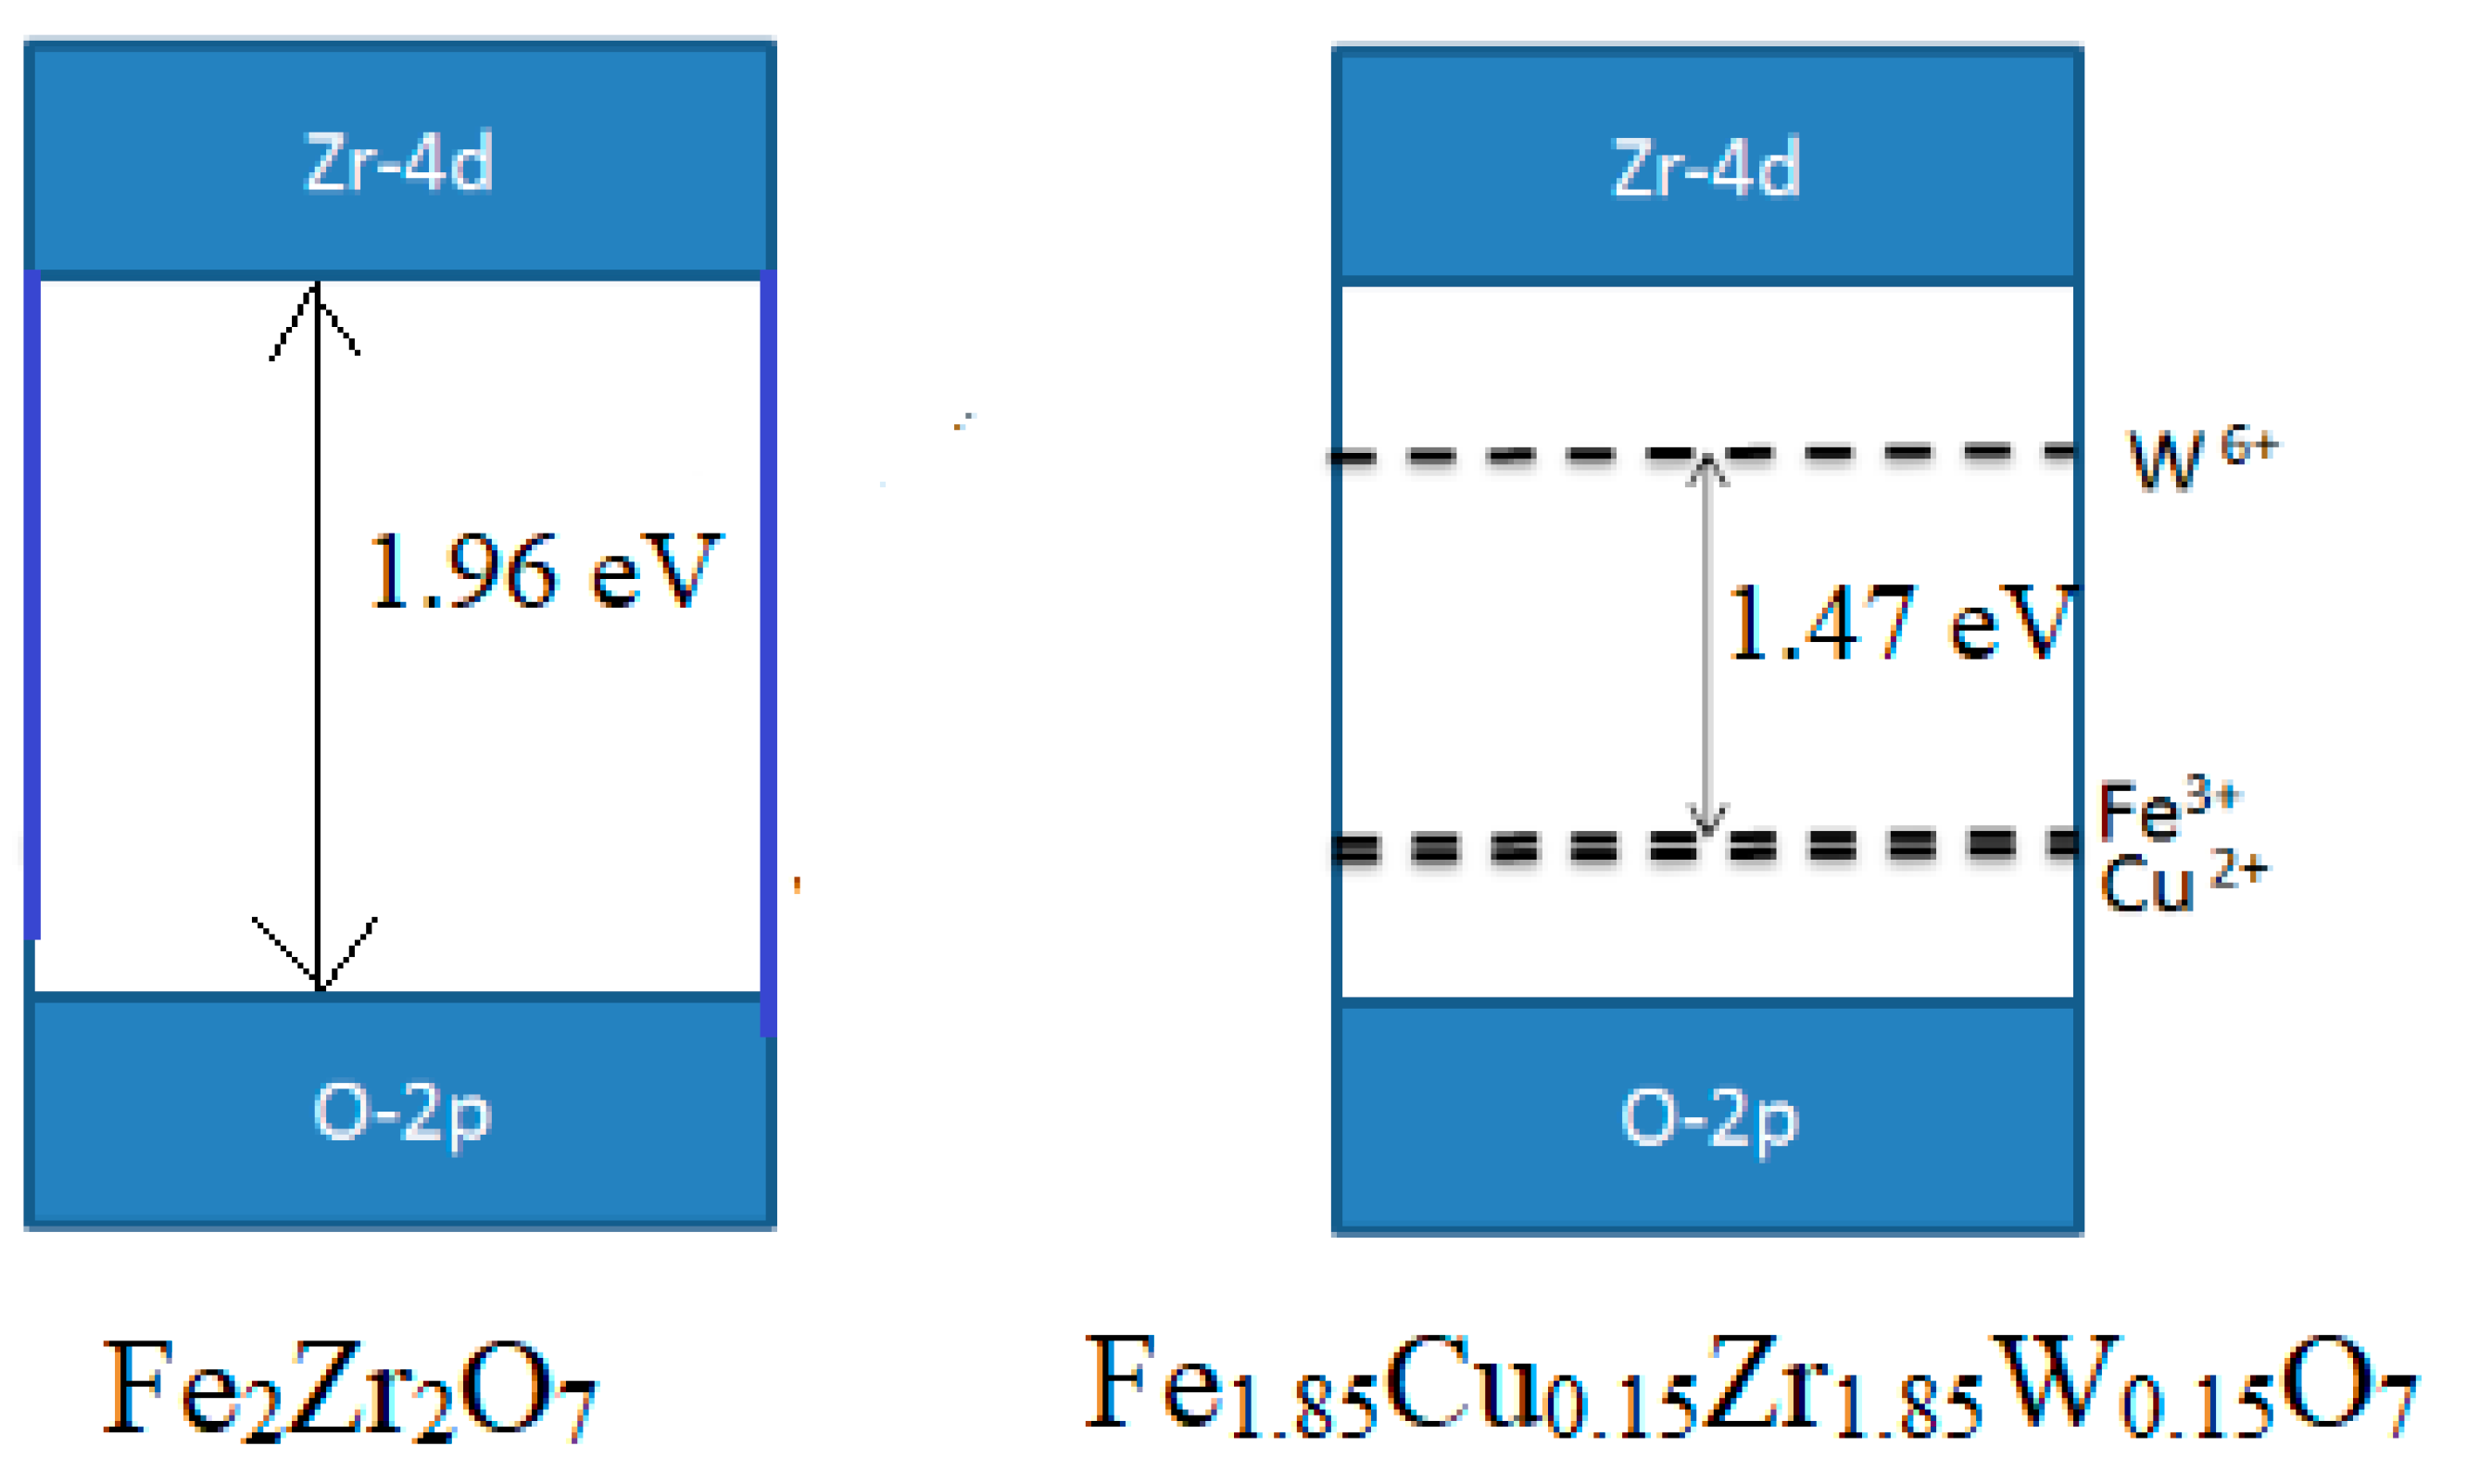
2.1.2. Diffuse Reflectance Spectroscopy (DRS)

The optical properties of the prepared photocatalysts were characterized using DRS. Figure 2 shows that the absorption edge decreased upon doping with the lowest values found for ZFWC2 (974 nm). The band gap (BG) value was obtained by plotting F(R∞)E)1/2 versus photo energy, and then a linear fit was used to detect BG based on the Kubelka–Munk theory [37]. The BG values were obtained using the plots in Figure 3 and Figure 4, and their values are shown in Table 3. As can be seen, ZF had a BG of 1.96 eV, while the Cu and W co-doping decreased the BG, with sample ZFWC2 having the lowest value of 1.47 eV. This indicates that the visible light range is the working range for the prepared catalysts. The reason for the decrease in the band gap upon increasing the concentrations of Cu and W might be due to the W forming an energy level below the conduction band, while Cu and Fe formed energy levels above the valence band (Figure 5). When co-doping Ga2Zr2O7 with W and Cu, similar results were obtained by Nasr [35], who attributed this to the formation of new energy levels.

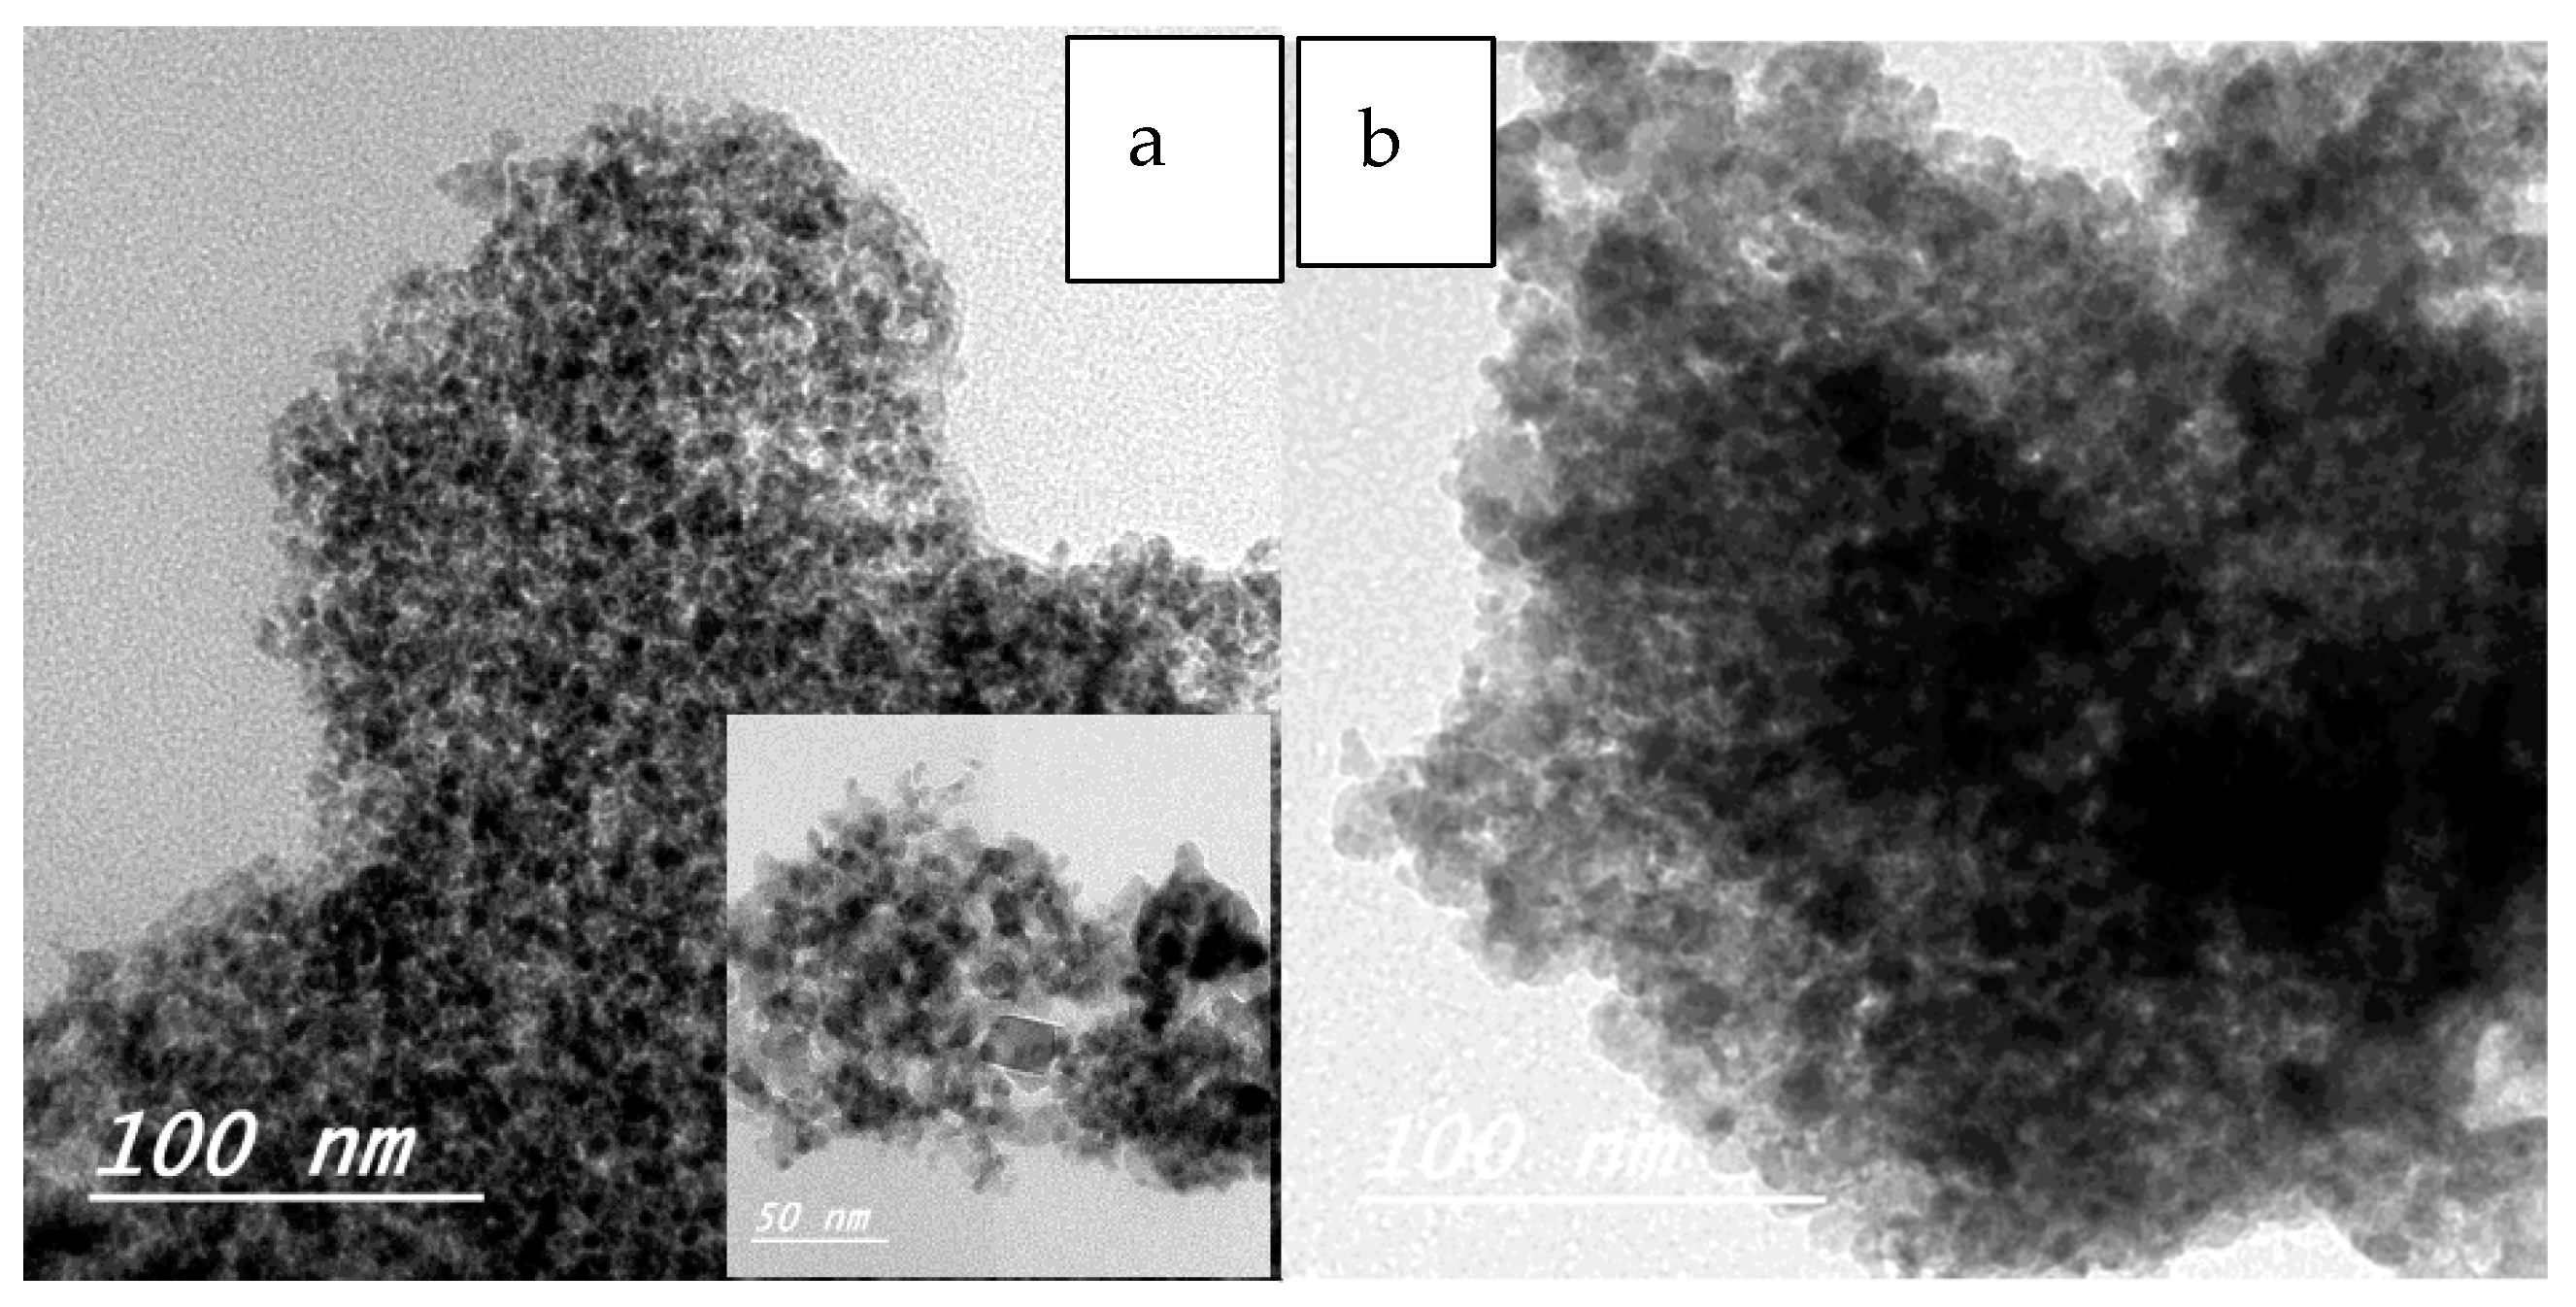
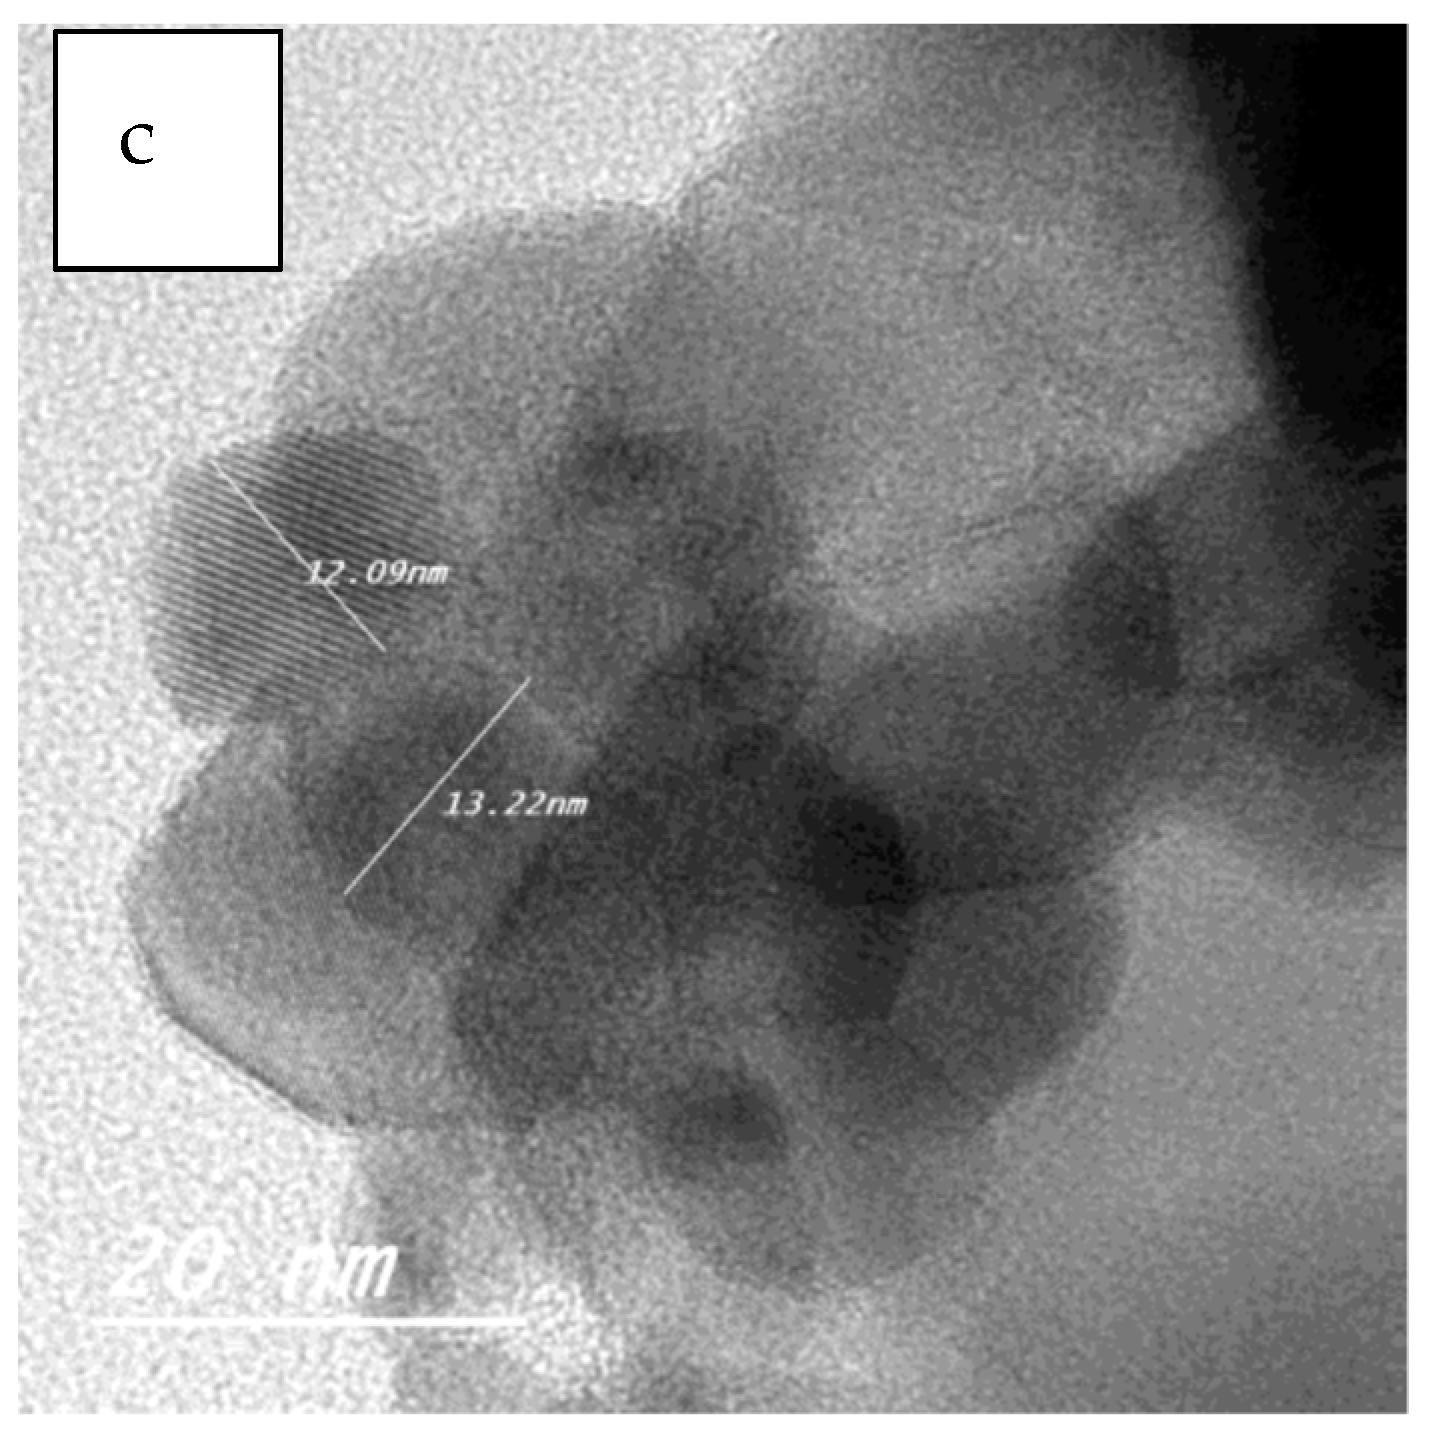
2.1.3. Transmission Electron Microscopy (TEM)

All samples were in the nano-sized range (Table 4). W and Cu co-doping did not significantly affect the particle size for the Fe2−xCuxZr2−xWxO7 system (Figure 6).

2.2. Photocatalytic Degradation of Dye

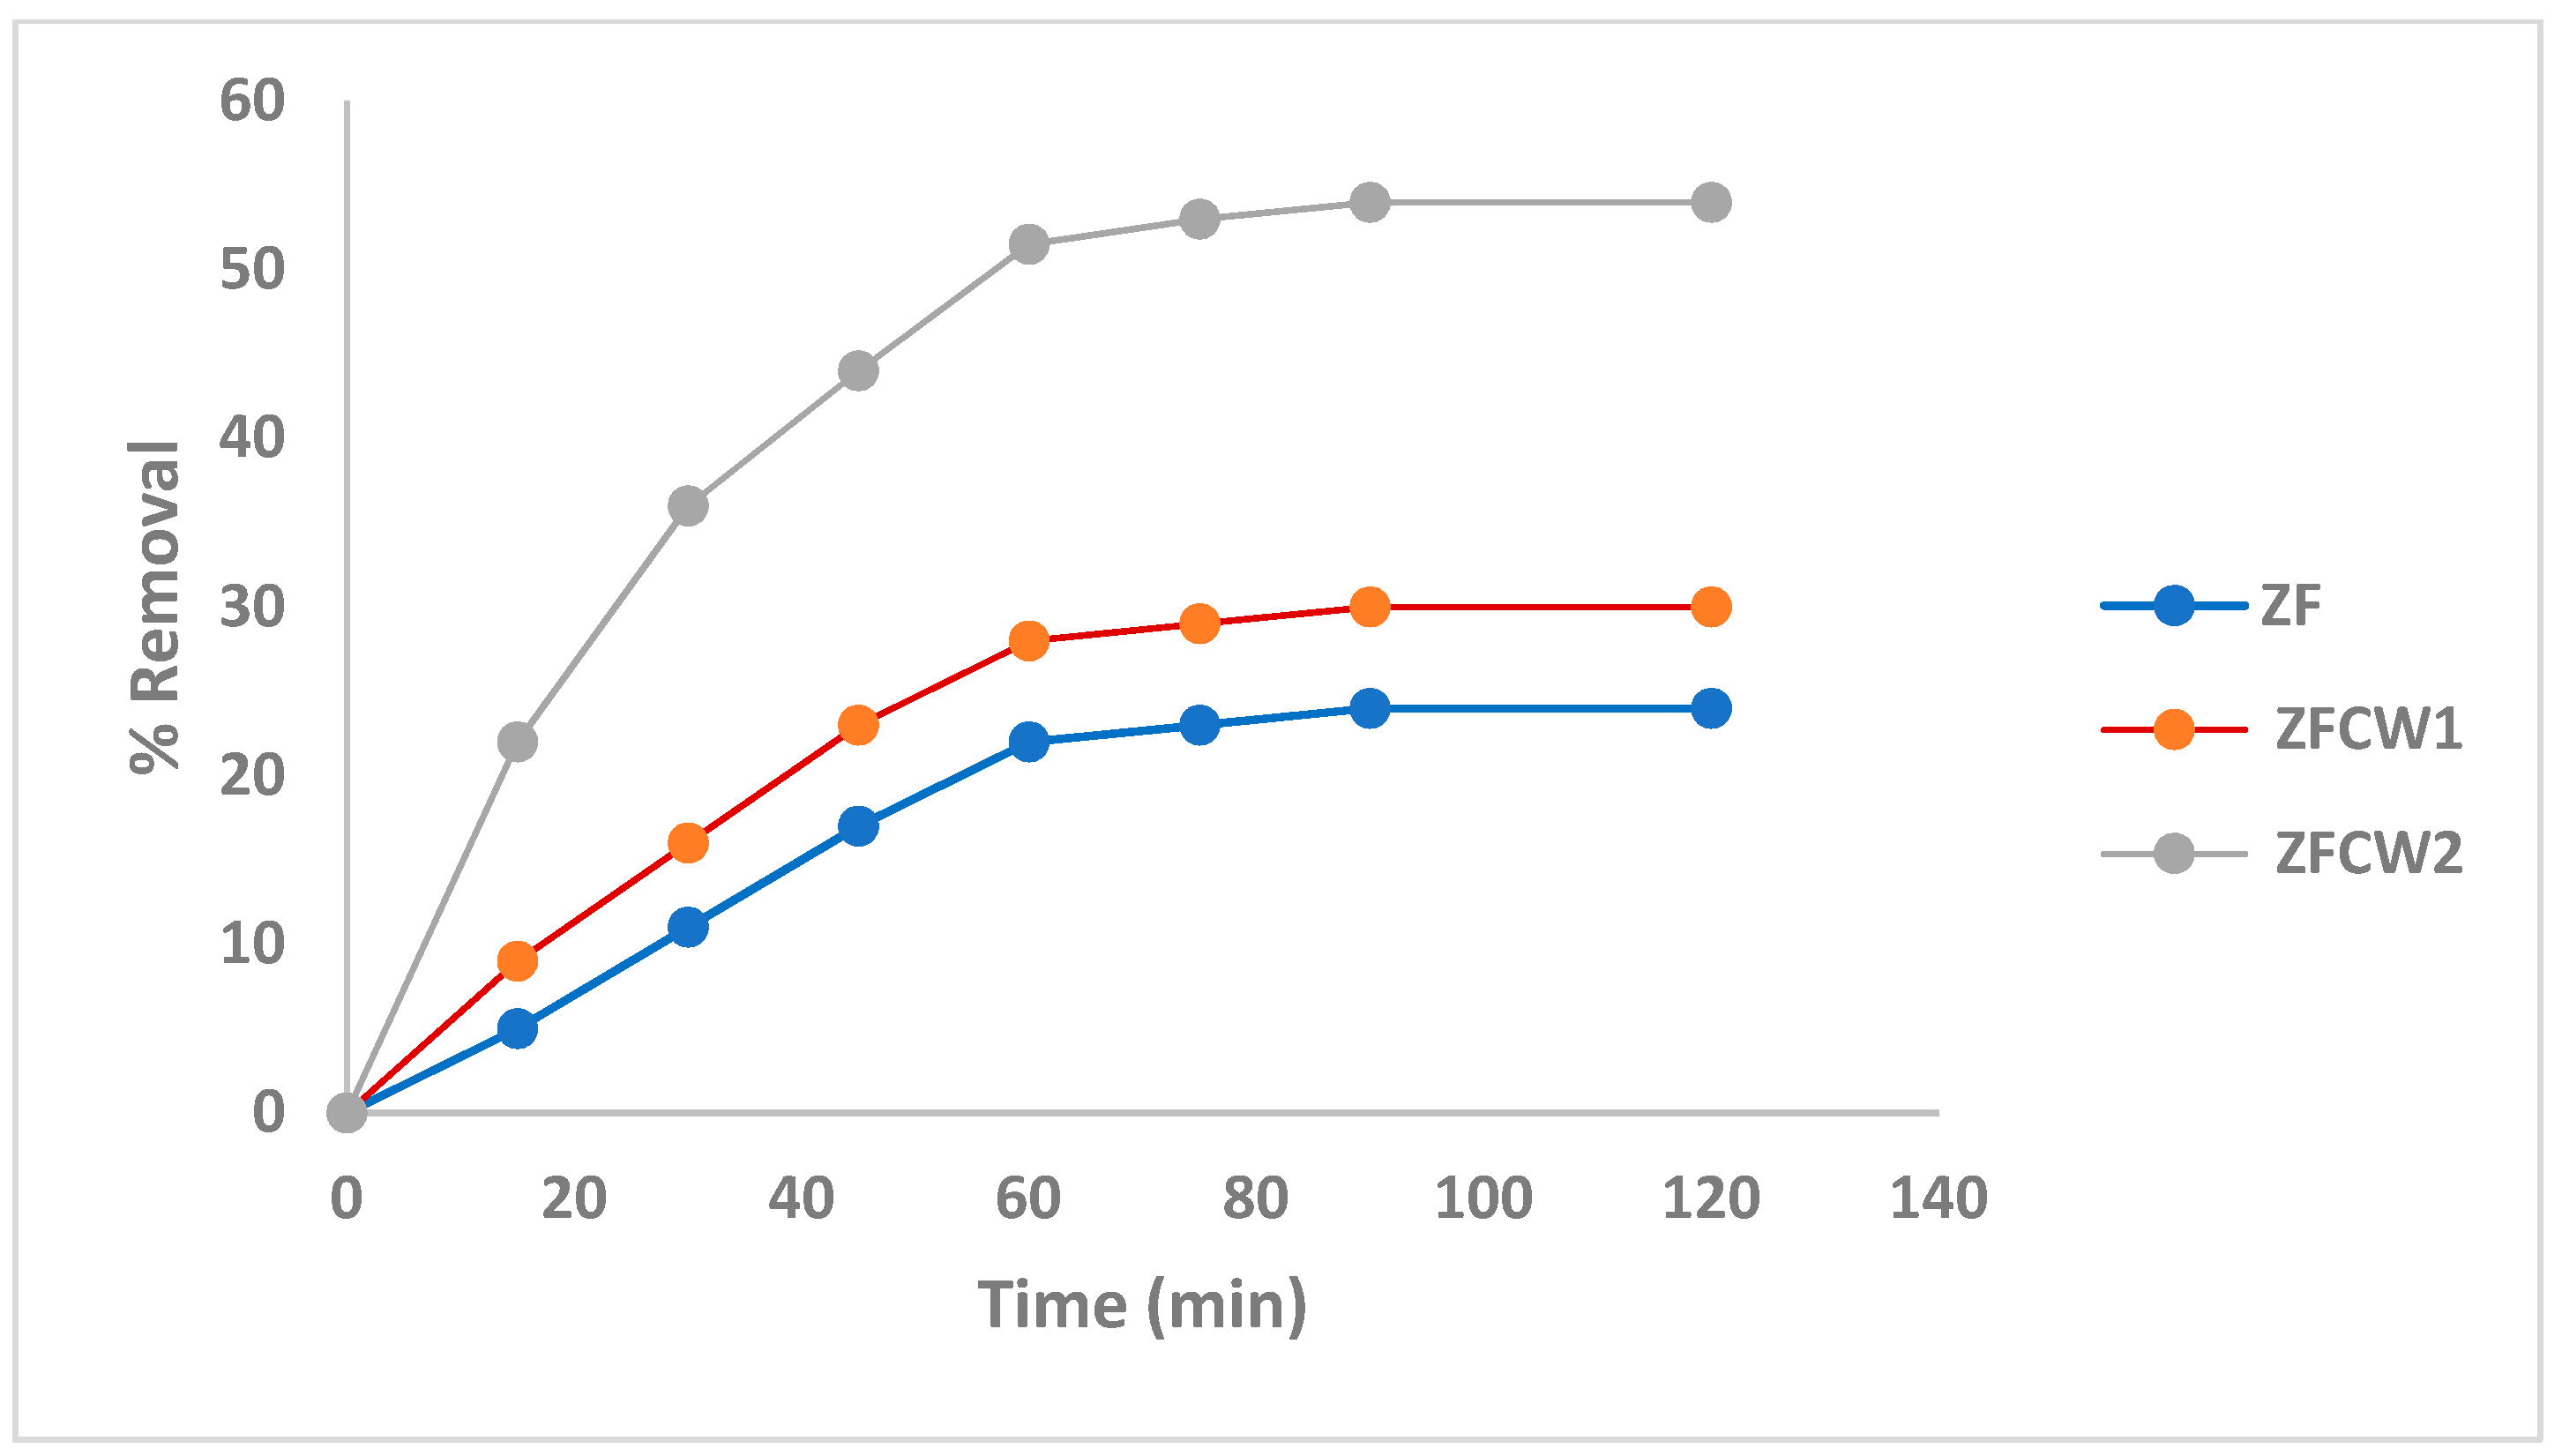
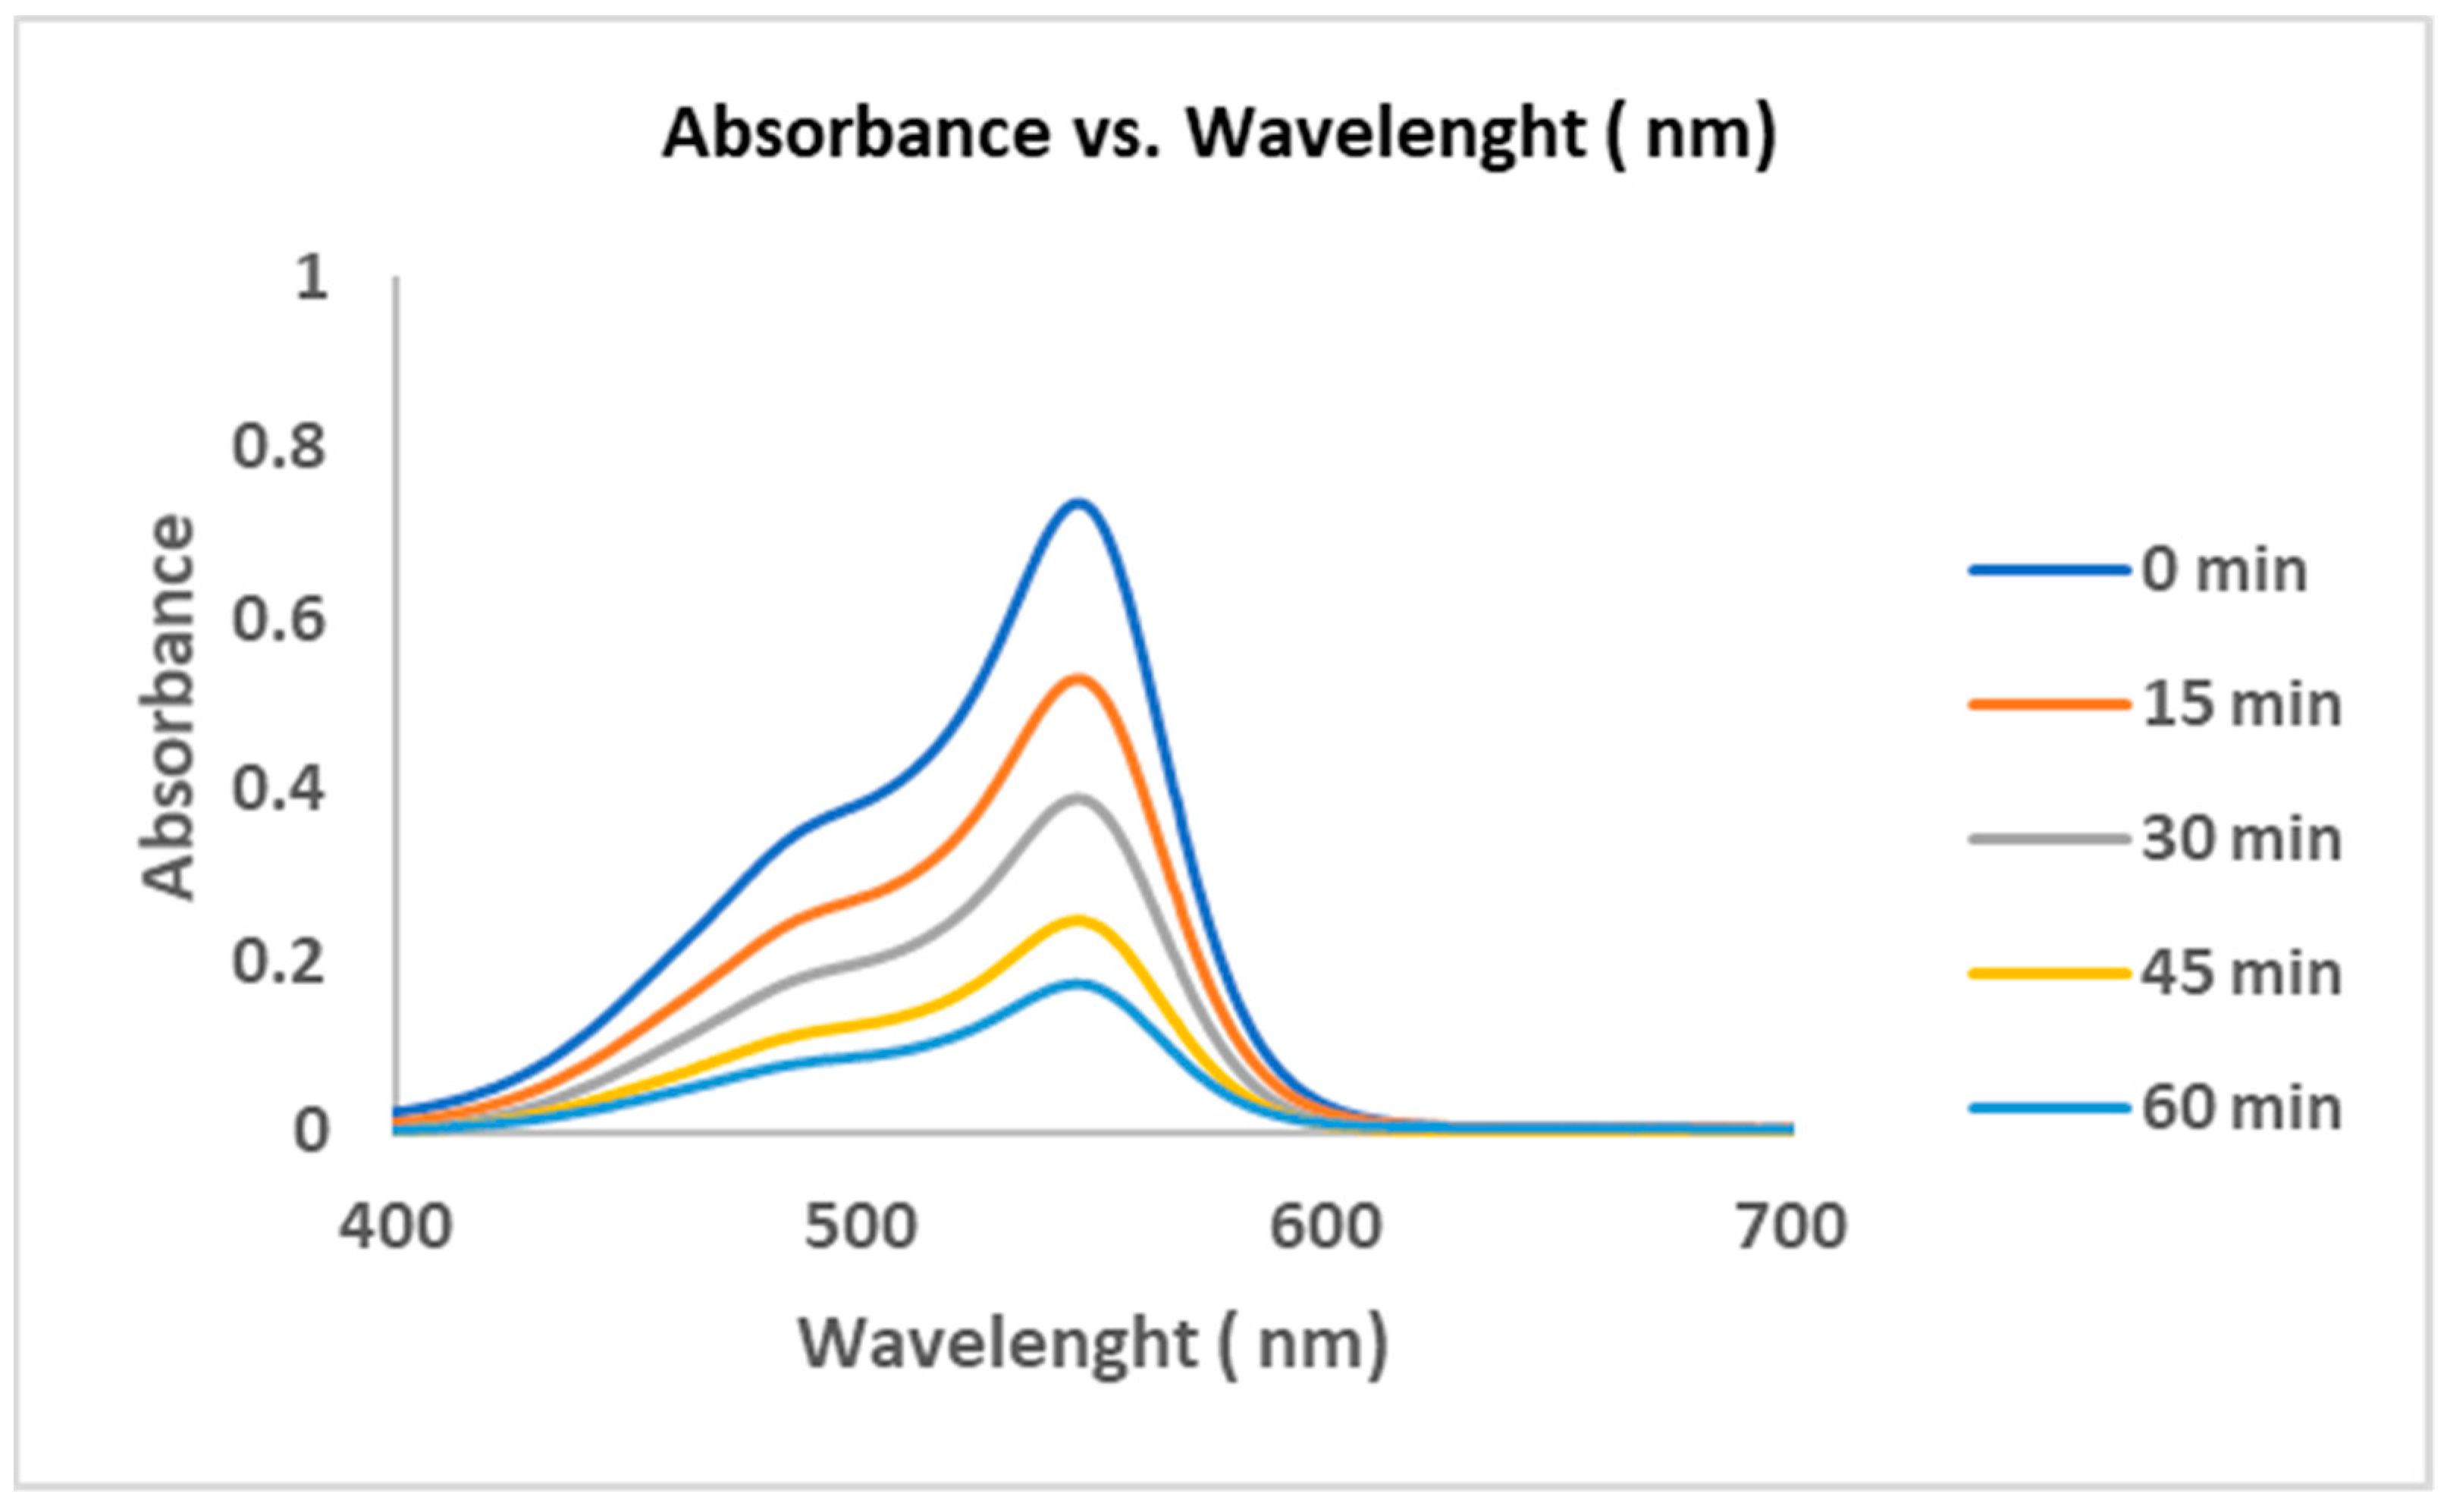
2.2.1. The Irradiation Time Effect

Figure 7 shows the degradation of CF from 0 to 120 min. It can be seen that the degradation of CF was enhanced by doping with W and Cu, and the enhancement was significant at high concentrations of dopants (15 mol%). The rate of degradation increased during the first hour, and became nearly constant during the second hour. Accordingly, the optimal reaction time is inferred to be one hour, since the degradation of CF at this point reached 20%, 30%, and 55% for ZF, ZFWC1, and ZFWC2, respectively. This enhancement in the photocatalytic activity of ZFWC2 for CF degradation was expected, because of the decrease in the BG as the co-dopant concentration increased. The catalyst utilizes visible-light energy, causing electrons to become excited and be shifted from the valence band to the conduction band, consequently generating electrons and holes on the surface of the catalyst. The holes interact with water, producing OH . , while the electrons interact with oxygen, which produces superoxide O 2 . . The produced OH . . and O2−2 cause the degradation of CF into simple products, as showing in Equations 1 to 6
Fe2−xCuxZr2−xWxO7 + hʋ (λ > 400 nm) → Fe2−xCuxZr2−xWxO7 (ecb− + hvb)
Fe 2 x Cu x Zr 2 x W x O 7   ( e cb ) + O 2     Fe 2 x Cu x Zr 2 x W x O 7 + O 2 .  
h + + H 2 O     OH . + H
e + O 2     O 2 .
hvb+ + dye → degradation byproduct
dye → degradation byproduct
The higher efficiency of co-doped samples may be related to control of the electron–hole pair recombination, in which the dopant ions trap the photogenerated electrons and holes, consequently decreasing the chances of recombination of the electron–hole pair, increasing their lifetime and leading to an improvement in the activity of the photocatalyst [38,39,40]. These effects are expected to increase when increasing the concentration of dopants.

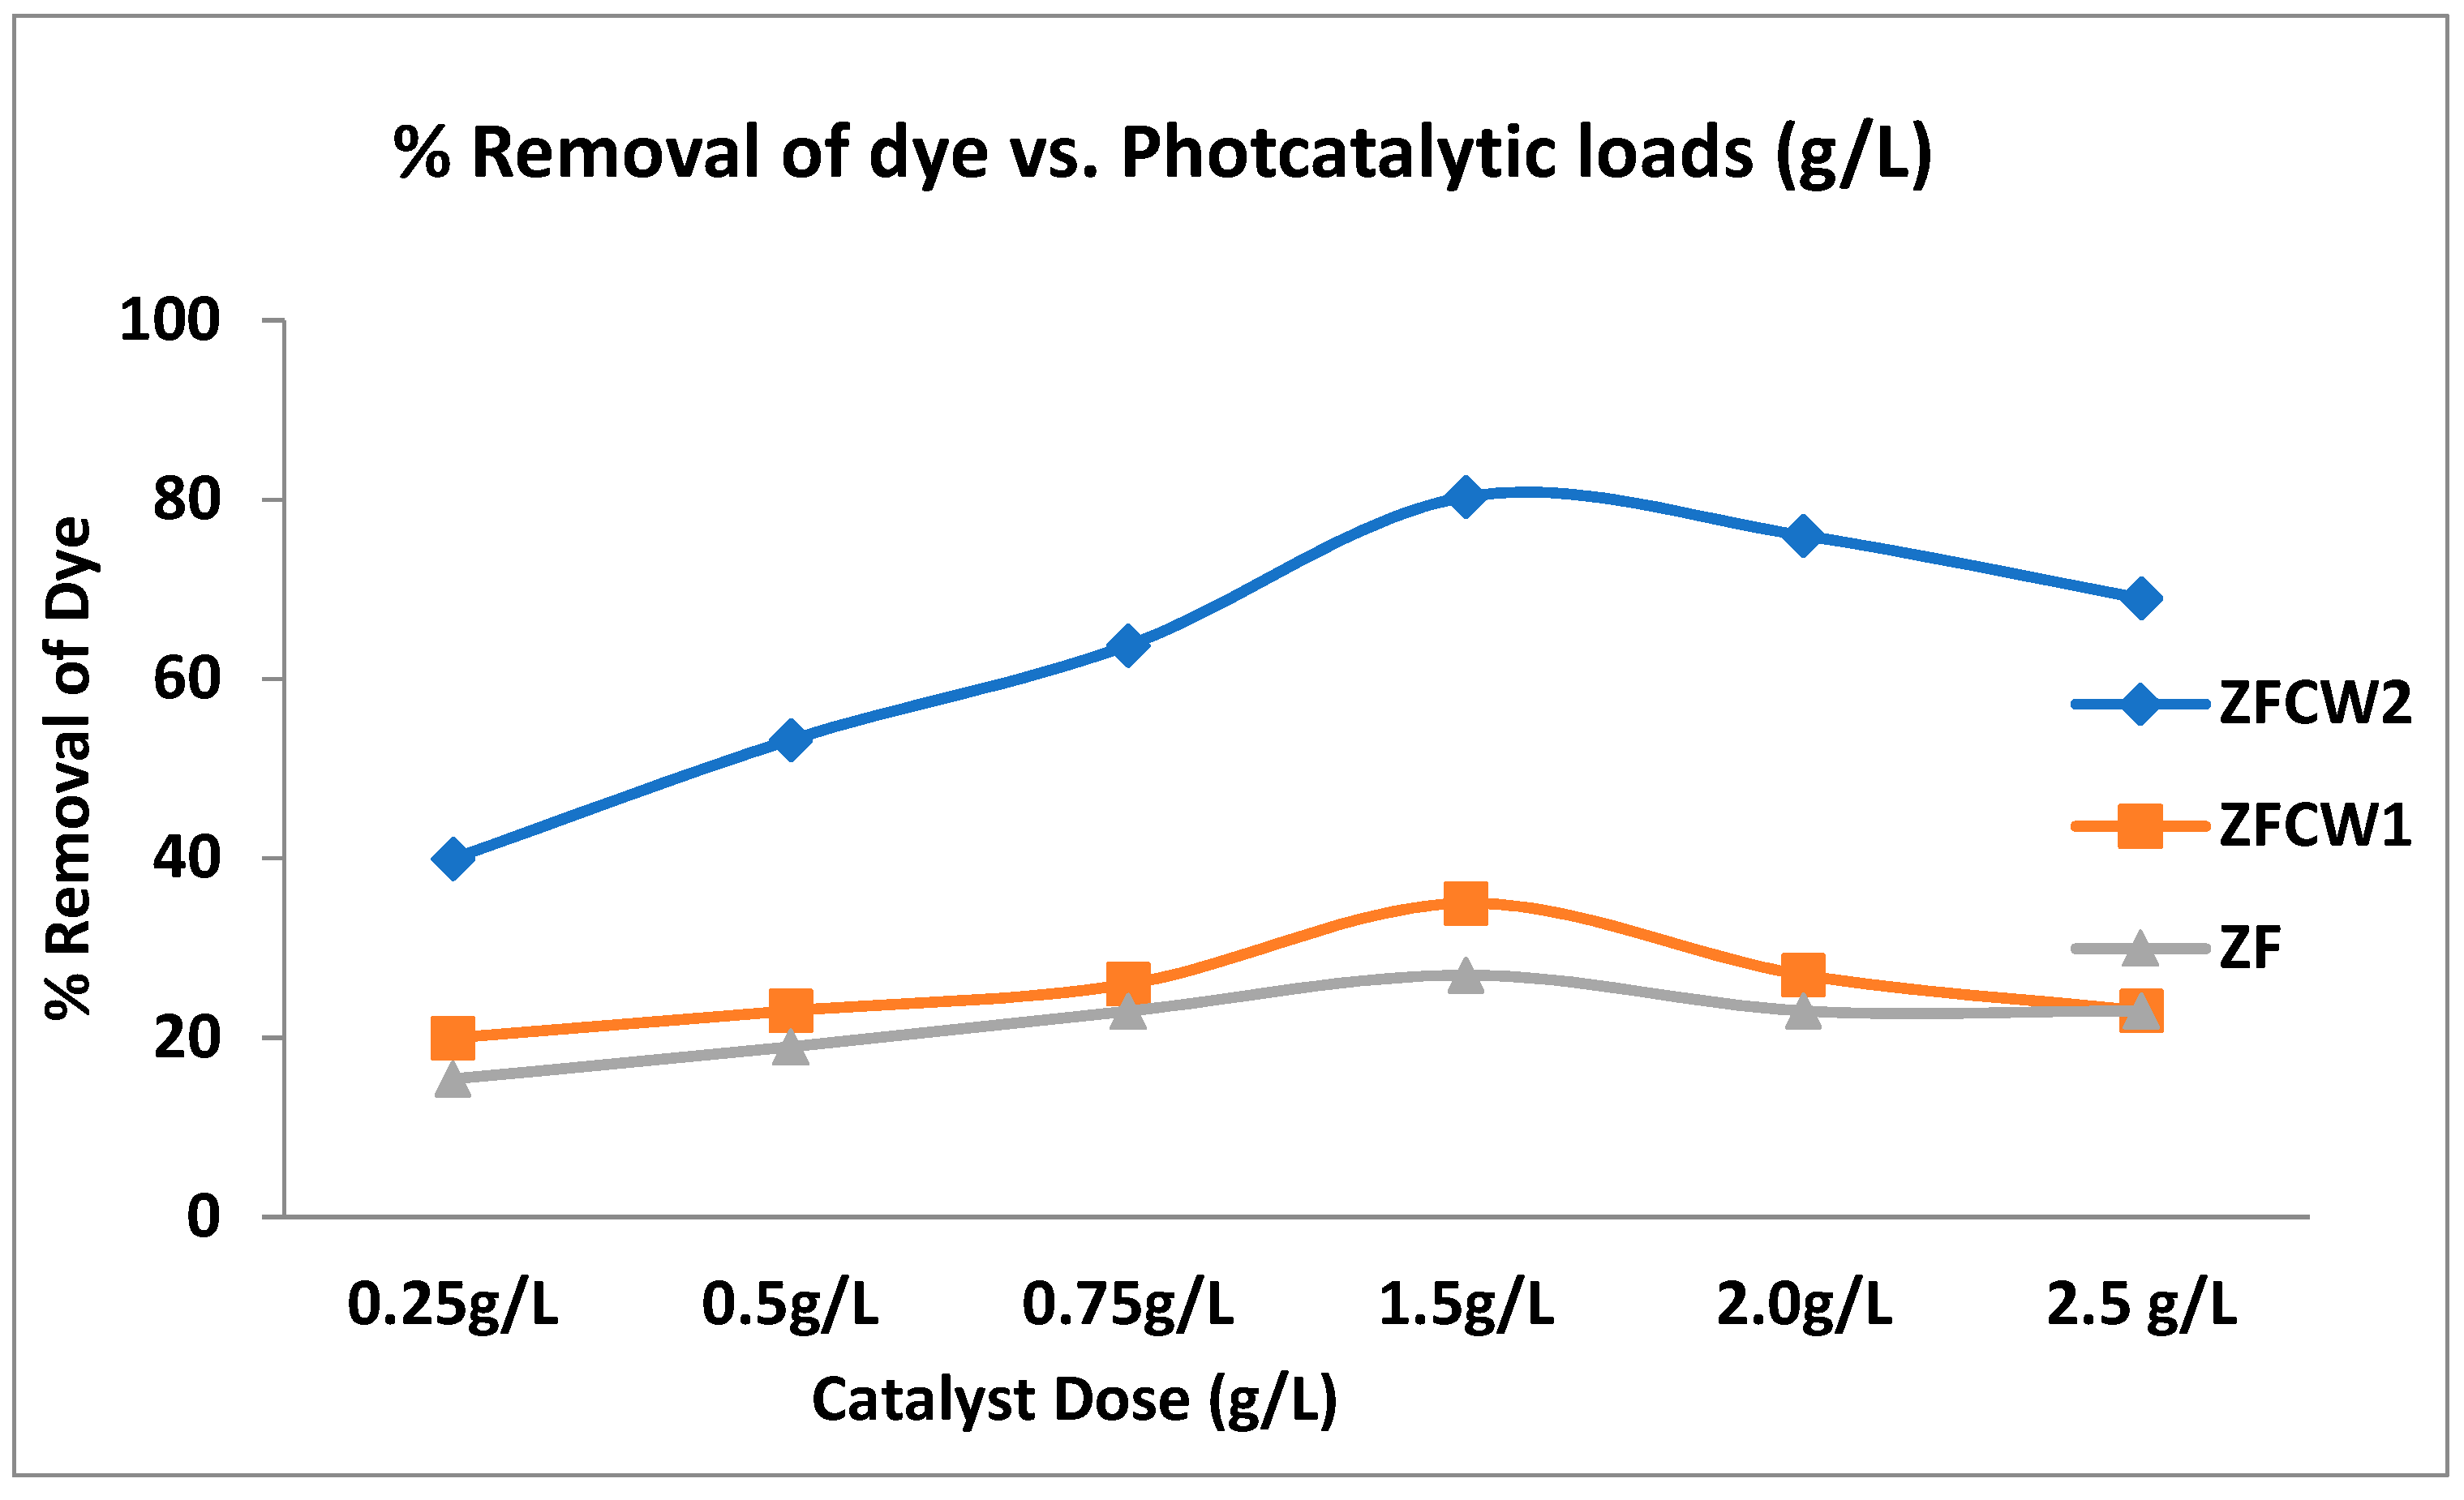
2.2.2. The Effect of Catalyst Dose

Catalyst dose ranged between 0.25 g/L and 2.5 g/L, used at pH 7, 30 mg/L CF concentration, and for 1 h, as shown in Figure 8. The degradation of CF was enhanced with the catalyst dose up to 1.5 g/L (80% CF removal), due to the increase in the number of active sites for degradation, in addition to the generation of more free electrons in the conduction band during photocatalysis [41]. The degradation efficiency decreased at a higher dose as a result of higher solution turbidity, which negatively affected the penetration of light [35]. Moreover, it is expected that a high concentration of photocatalysts may result in particle aggregation, causing a reduction in the number of surface-active sites; consequently, there will be a decrease in the degradation efficiency [42]. A dose of 1.5 g/L was used as the optimal dose for further testing.

2.2.3. Effect of pH

The effect of pH on the photocatalytic degradation of CF was examined by varying the pH between 3 and 11, at 30 mg/L CF and 1.5 g/L catalyst dose. Figure 9 shows that increasing the pH to 9 increased CF degradation, due to the increase in the concentration of hydroxide ions at the active site, which caused an increase in the generation of OH. radicals due to the oxidation of higher amounts of OH. [43]. The CF removal using ZFWC2 was 100% at pH 9. Similar results of optimal pH in alkaline solutions were found in [3,44]. At higher pH (>9) the degradation efficiency decreased, since CF—as a cationic dye—turned into an anionic form at high pH, causing repulsion between dye molecules and the negative catalyst surface in alkaline solutions.

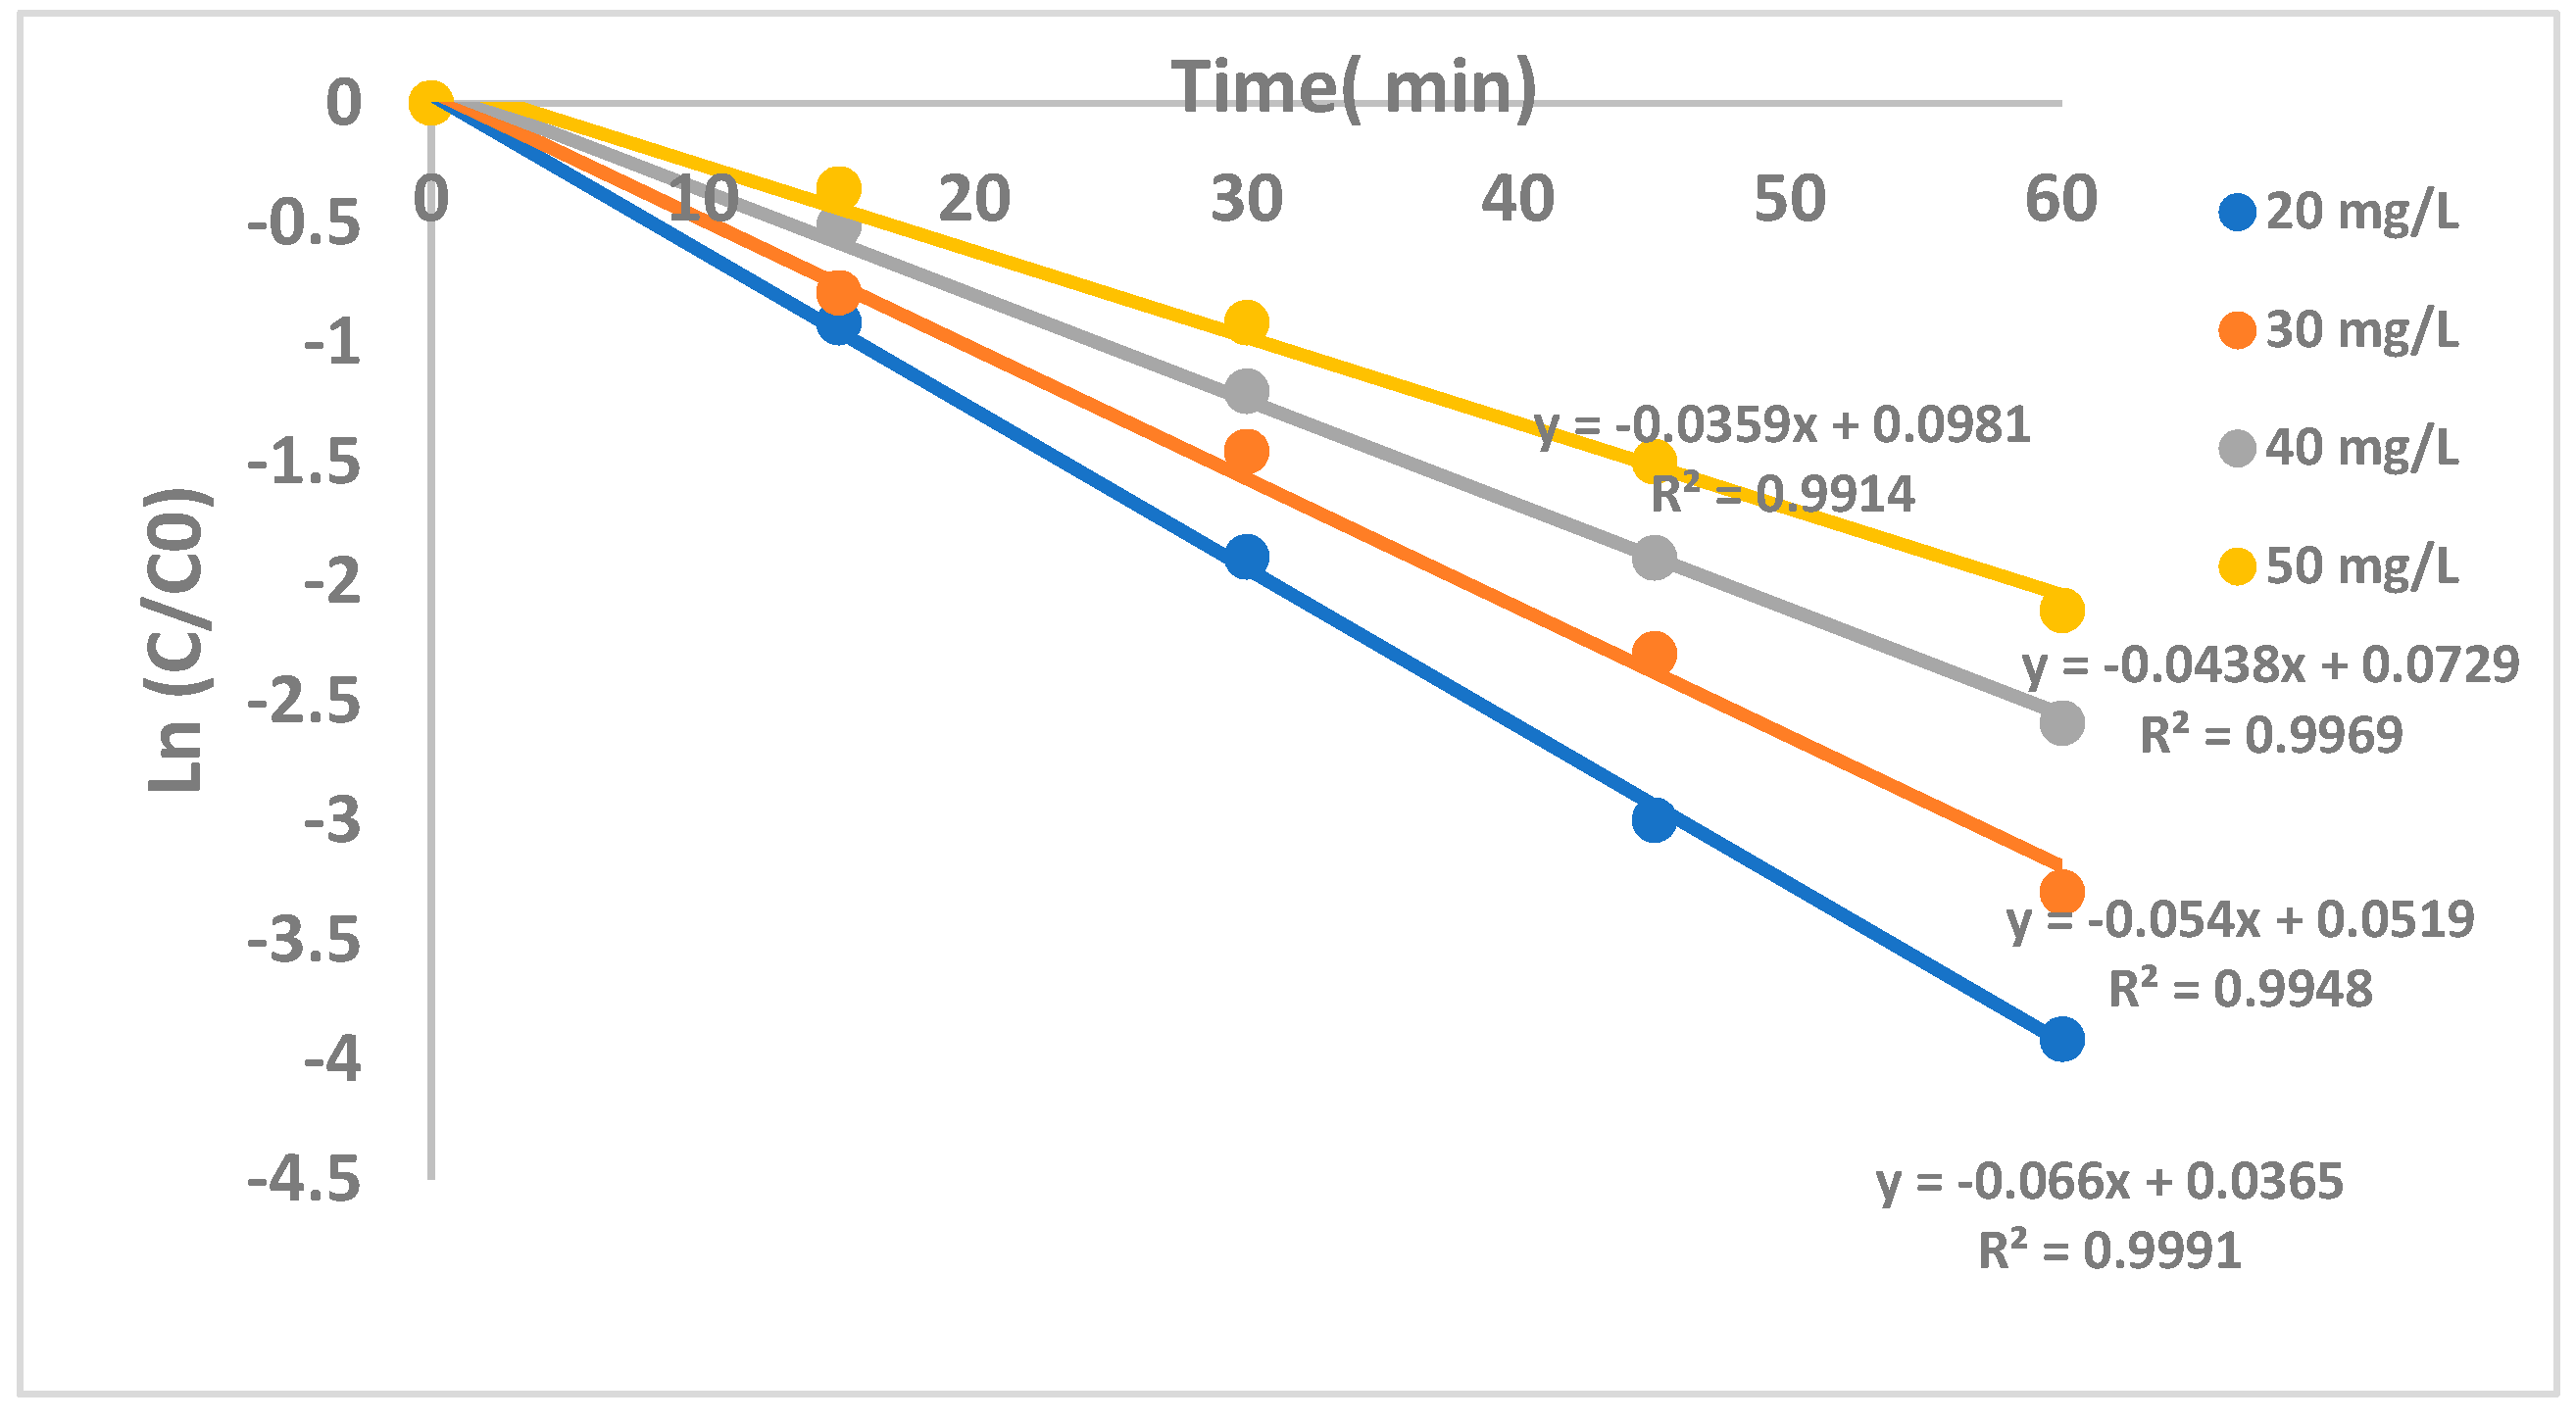
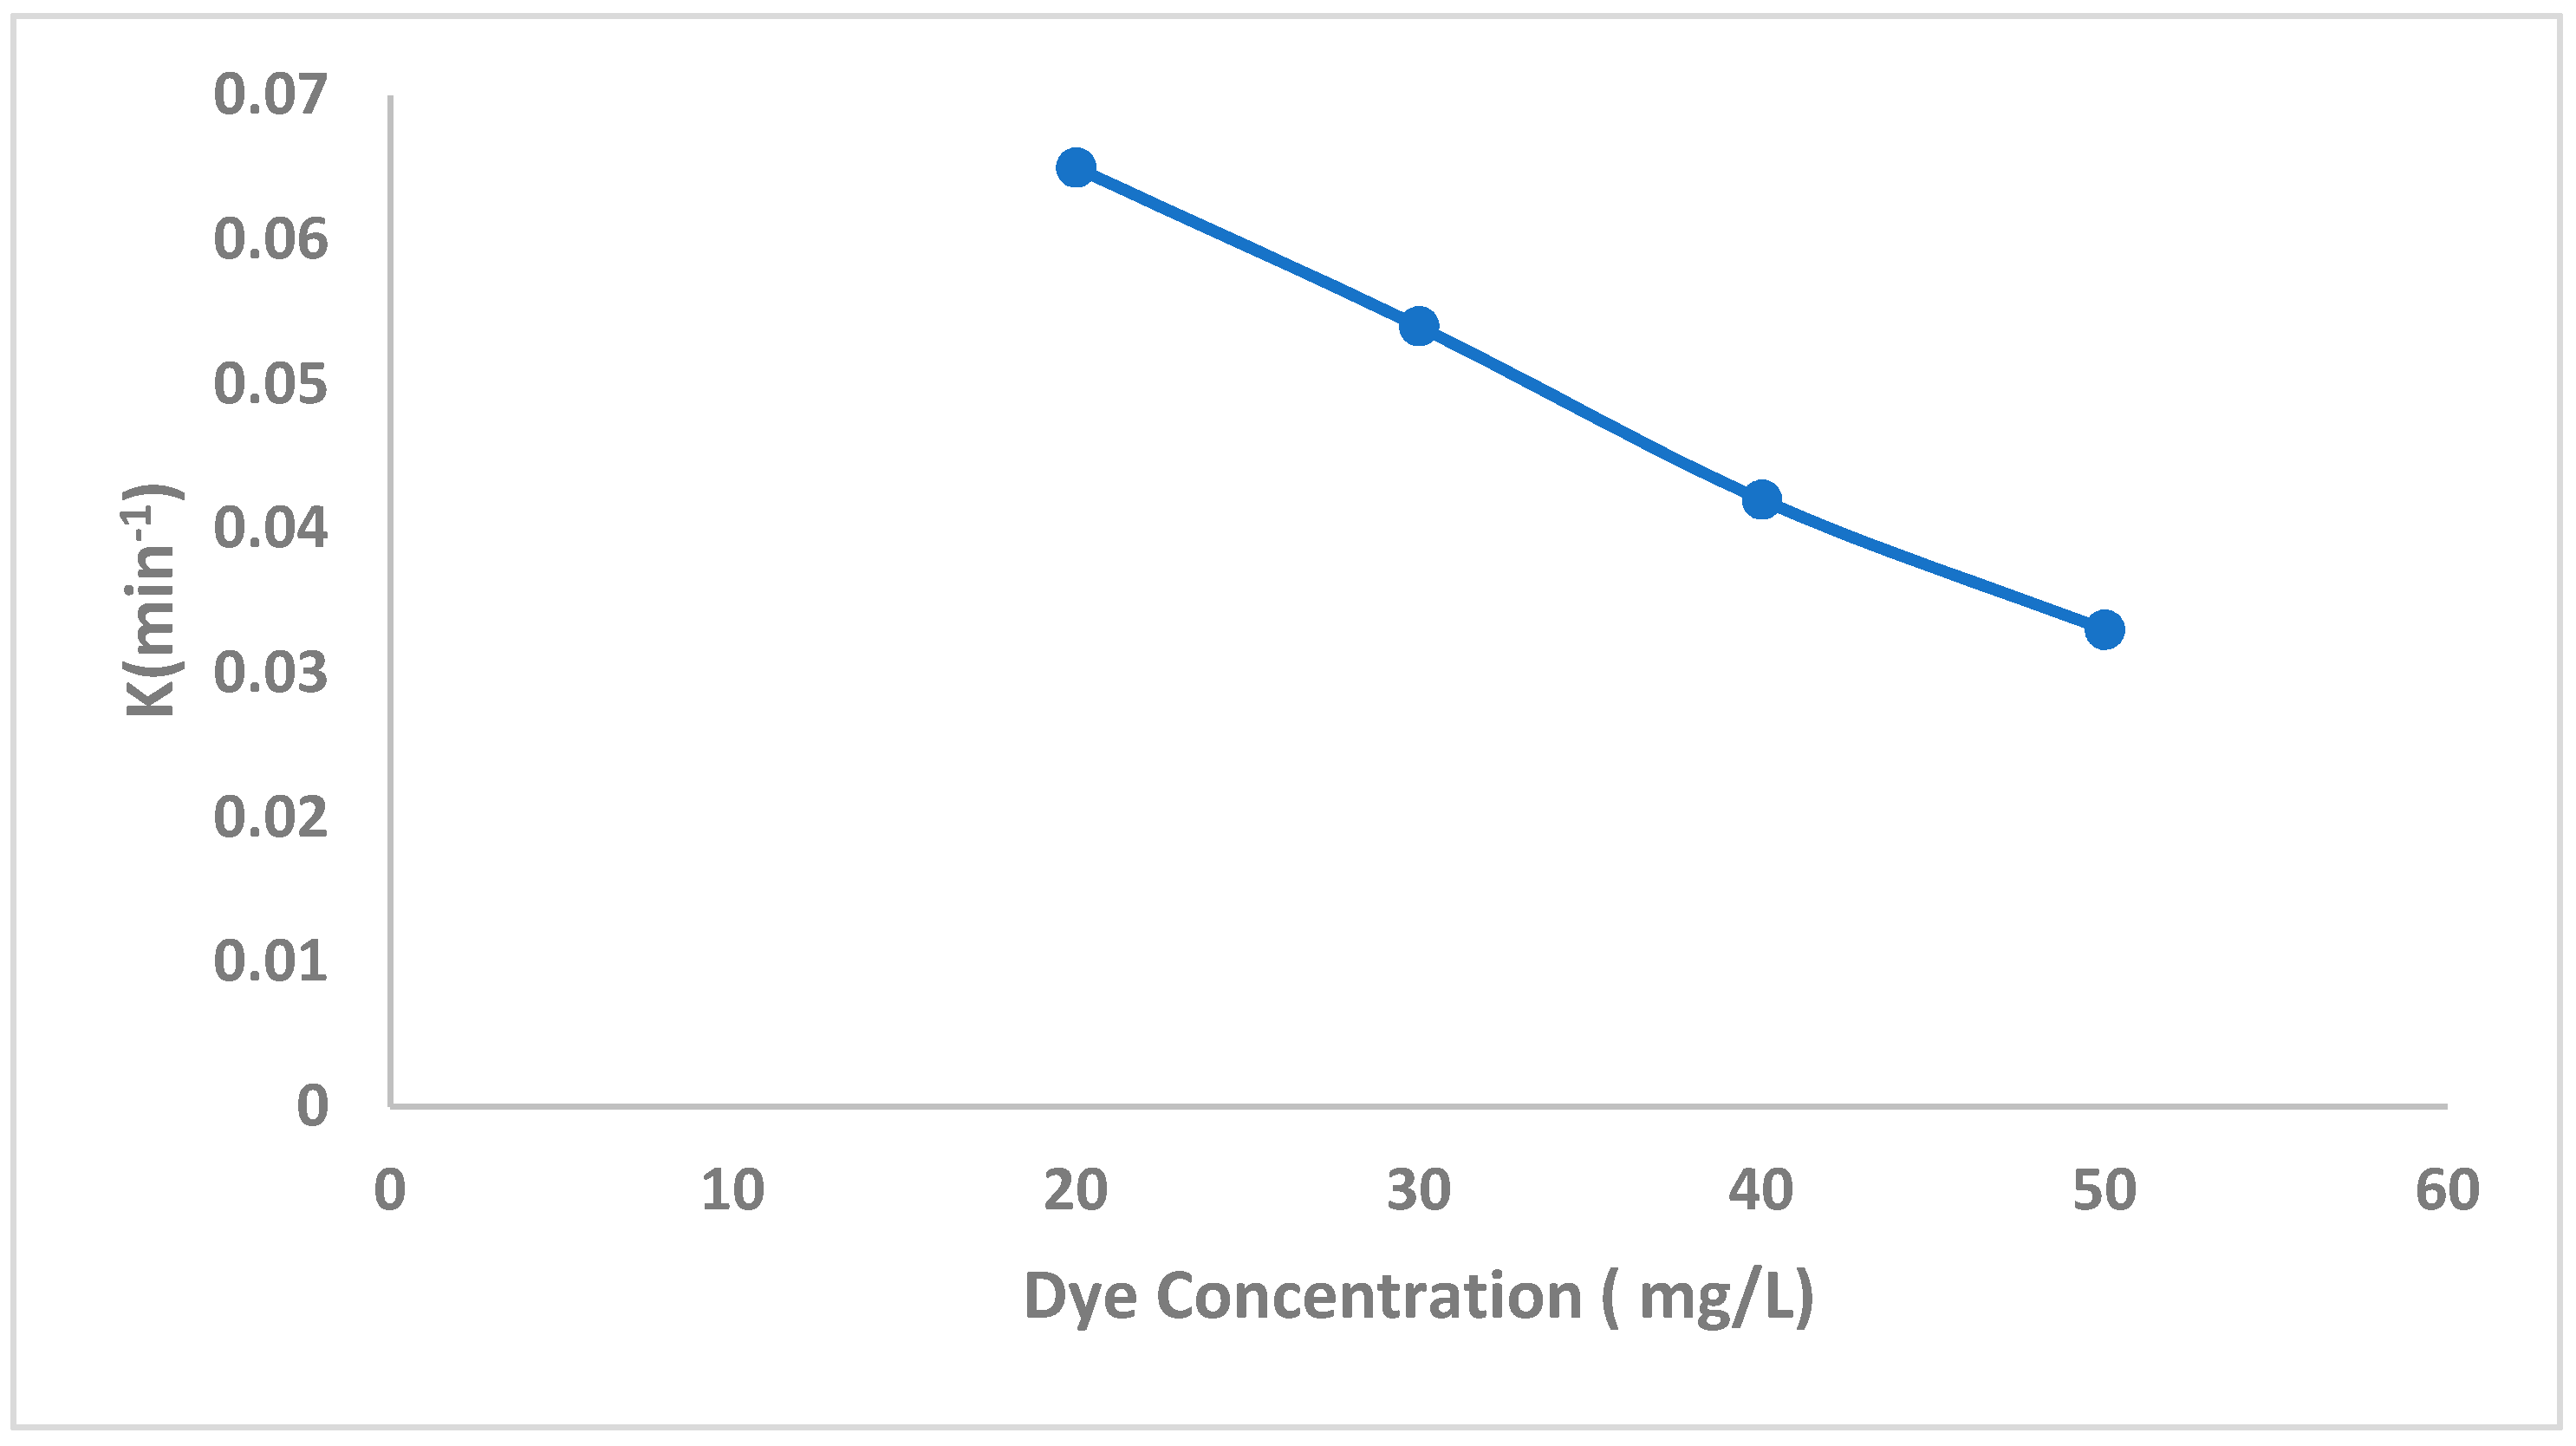
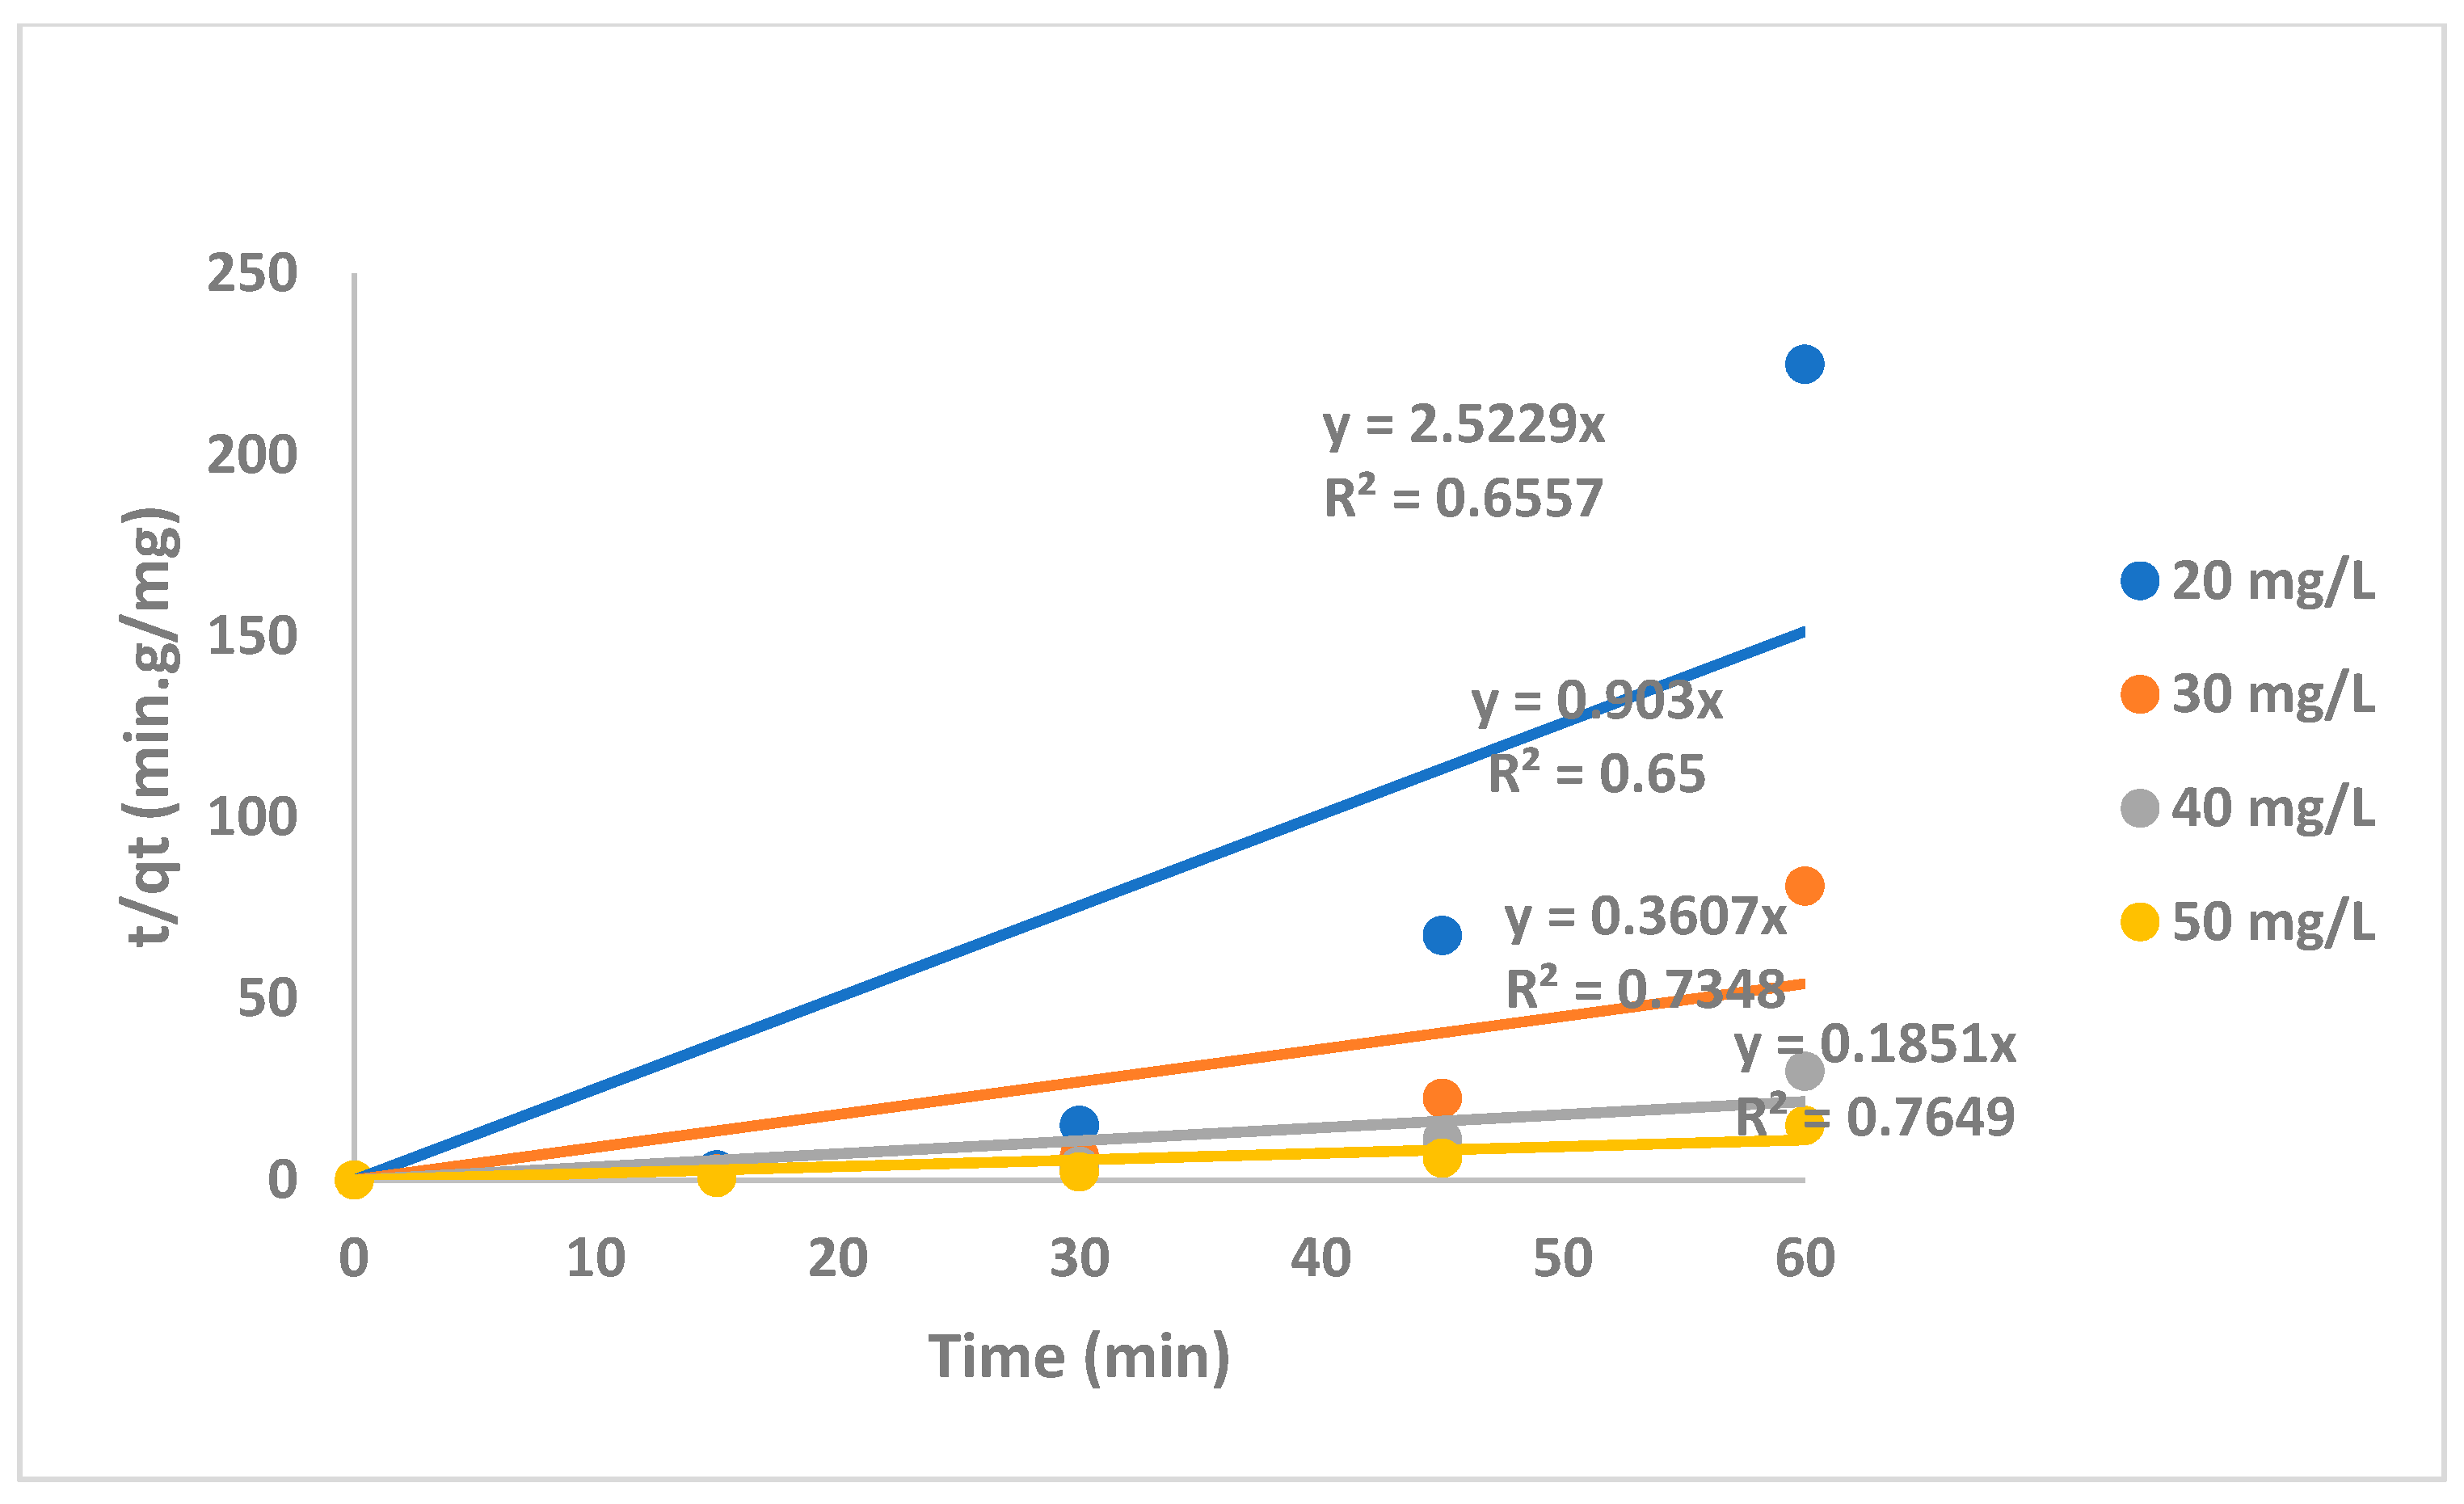
2.2.4. The Effect of CF Concentration

The effect of CF concentration on the photodegradation at 1.5 g/L CF and pH 9 under visible-light irradiation is shown in Figure 10. The reaction was found to follow pseudo-first-order kinetics (Equation (2)); the photodegradation reaction rate decreased upon an increase in CF concentration—from 0.065 min−1 at 20 mg/L, to 0.0337 min−1 at 50 mg/L (Figure 11). This was mainly due to a decrease in light penetration with an increase in dye concentration (with the dye acting as a barrier against the light), causing a decrease in the light intensity at the catalyst’s surface [33,35], in addition to the unavailability of active sites upon adsorption and aggregation of dye molecules [37]. Moreover, the reaction kinetics were studied using a pseudo-second-order equation (Equation (3)), and are shown in Figure 12, which shows that the correlation coefficient was very low compared with that found in the pseudo-first-order kinetics (Figure 10). This confirms that CF degradation follows pseudo-first-order kinetics [3,45,46].
According to the photodegradation experimental findings, increasing the co-dopant concentration to 15 mol% has a major impact on photodegradation, which can be attributed to a decrease in the band gap between the parent catalyst and the doped catalyst, with the lowest band gap at 15 mol%, which shifted the photoexcitation reaction to the visible region and demonstrated that the prepared nanocatalyst Fe1.85Cu0.15Zr1.85W0.15O7 is a promising new photocatalyst, due to its superior efficiency in dye photodegradation compared to other photocatalysts.
As seen in Figure 13, the maximum absorbance peak at λmax = (563) decreased over time, due to the degradation of aromatic amines via oxidation, which is expected to degrade the amines into simpler compounds as intermediates before complete degradation to CO2 and H2O [16]. Similar results were found in [32], which showed color fading of CF over time using La-Bi2O3.

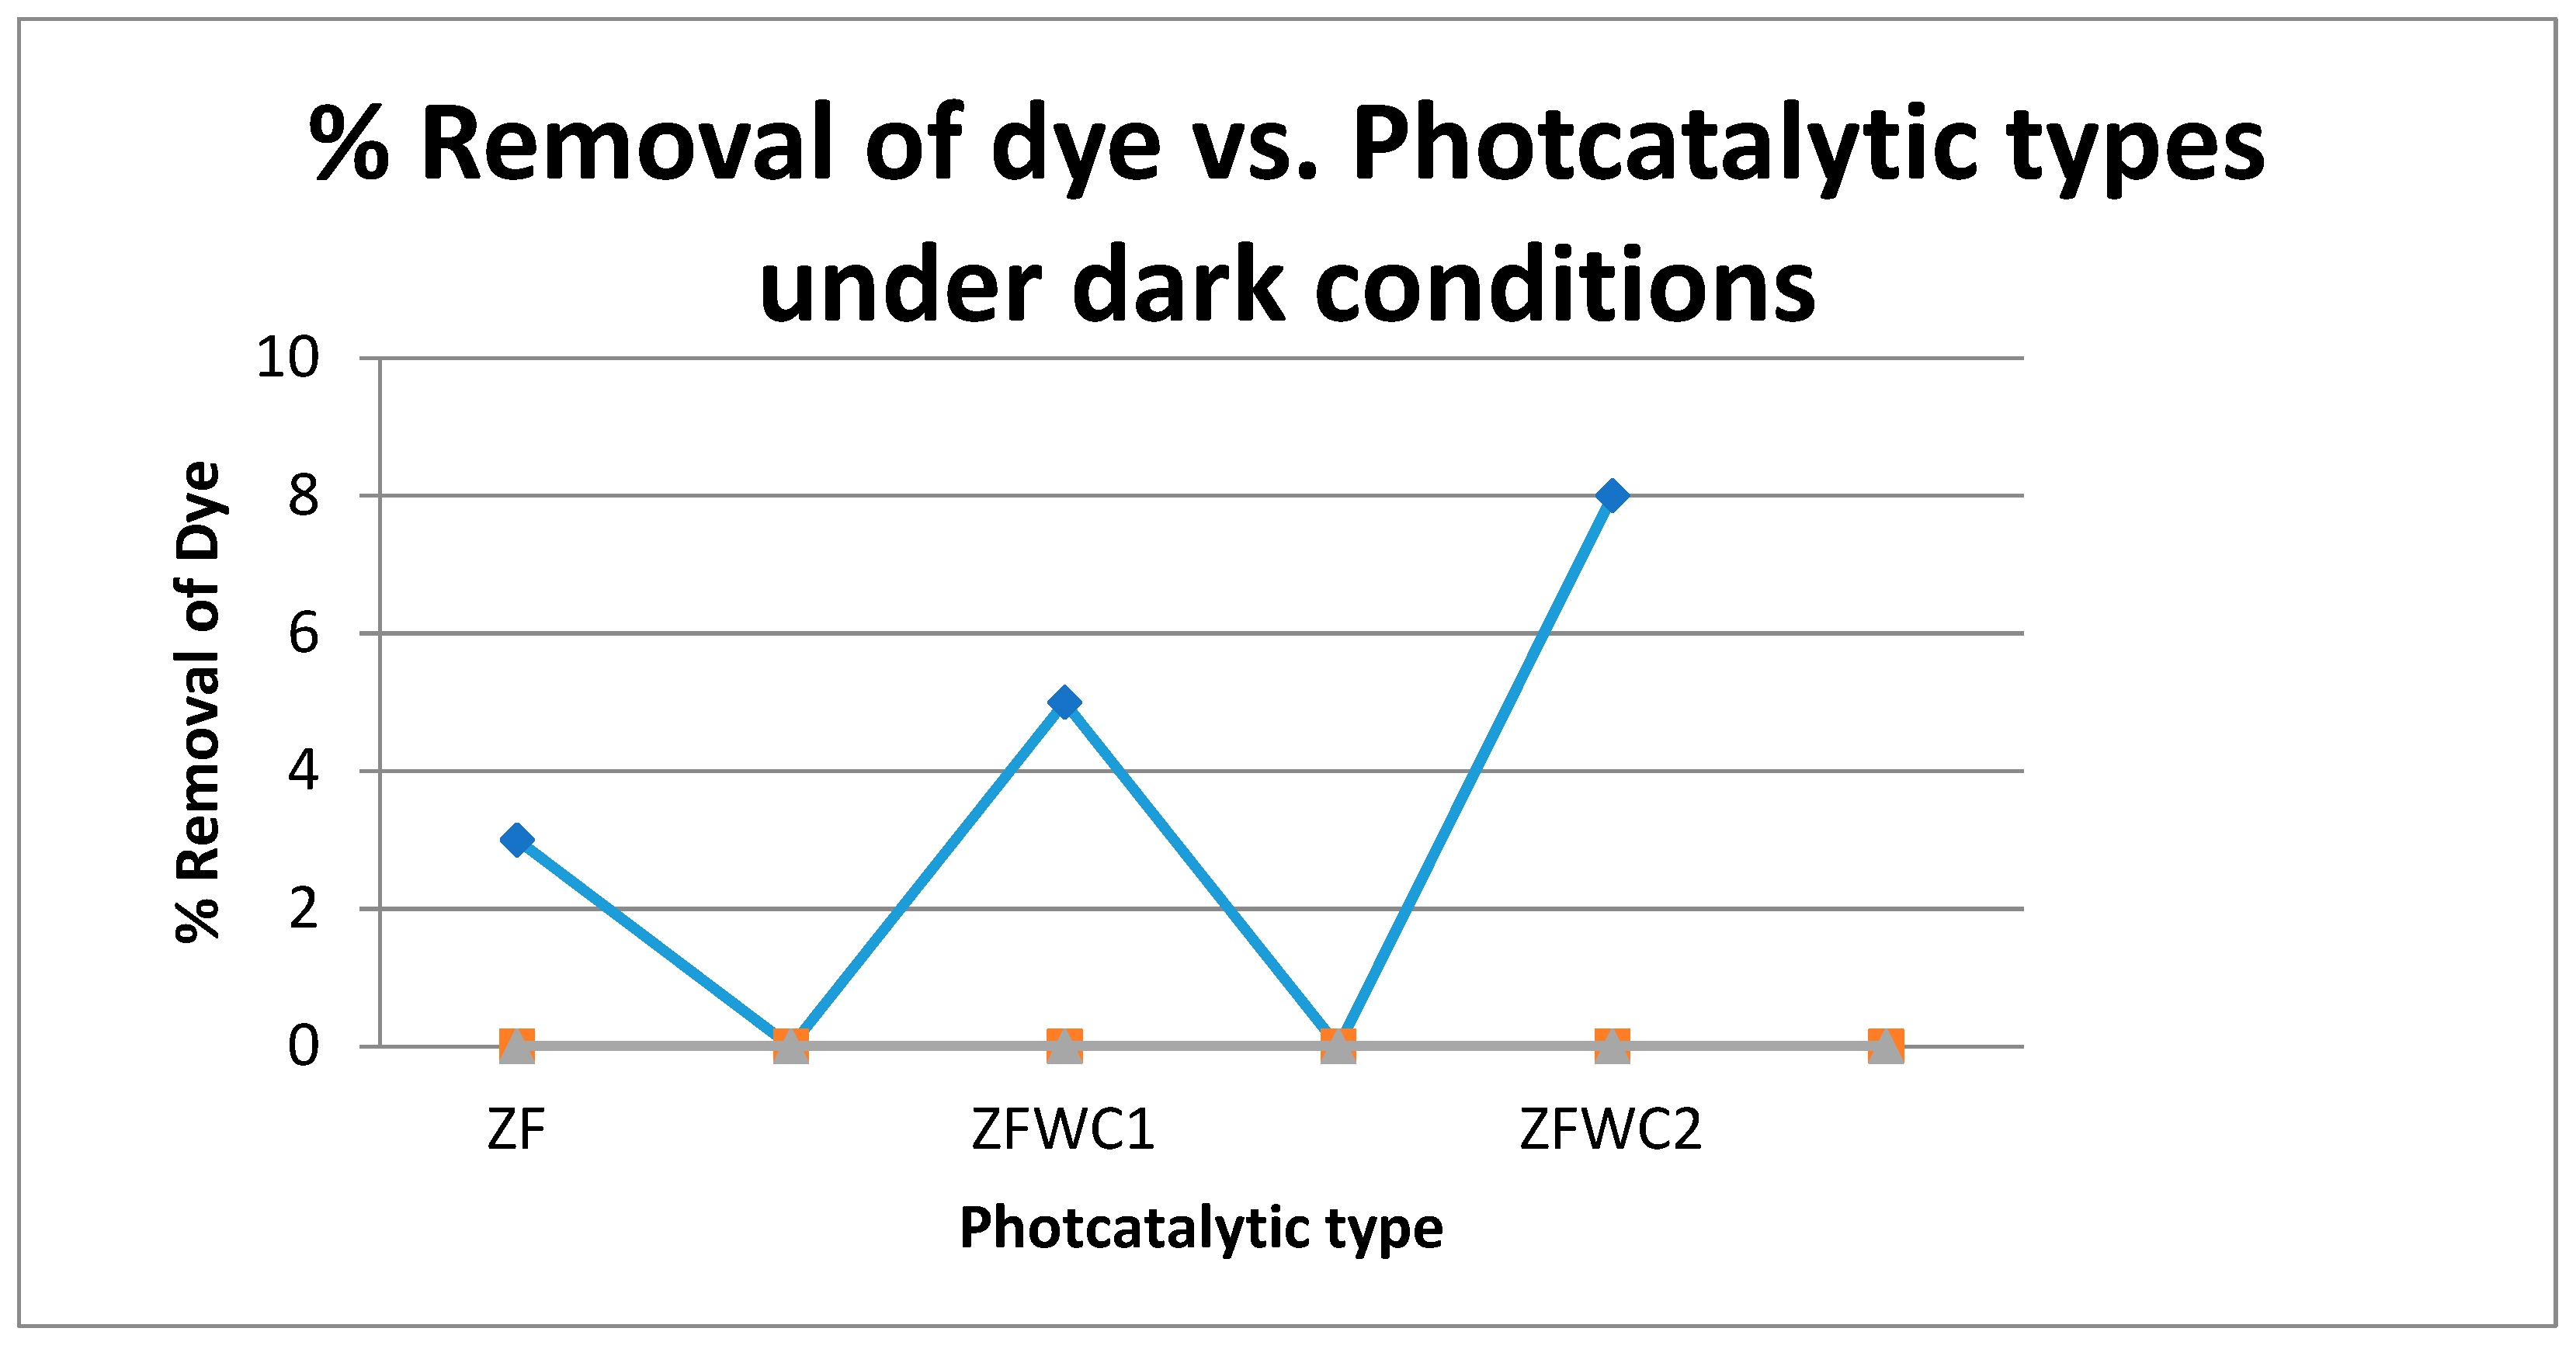
2.2.5. The Effect of Visible Light

A dye solution and catalyst were situated in the dark for 30 min to confirm equilibrium between the adsorption and desorption occurrences of dye molecules on the photocatalyst surface prior to the illumination, and was considered as a control sample, as shown in Figure 14, which shows that the removal of carbol fuchsin dye ranged only from 3 to 8% when using the photocatalyst under dark conditions.

2.2.6. Active Radical Trapping Experiments
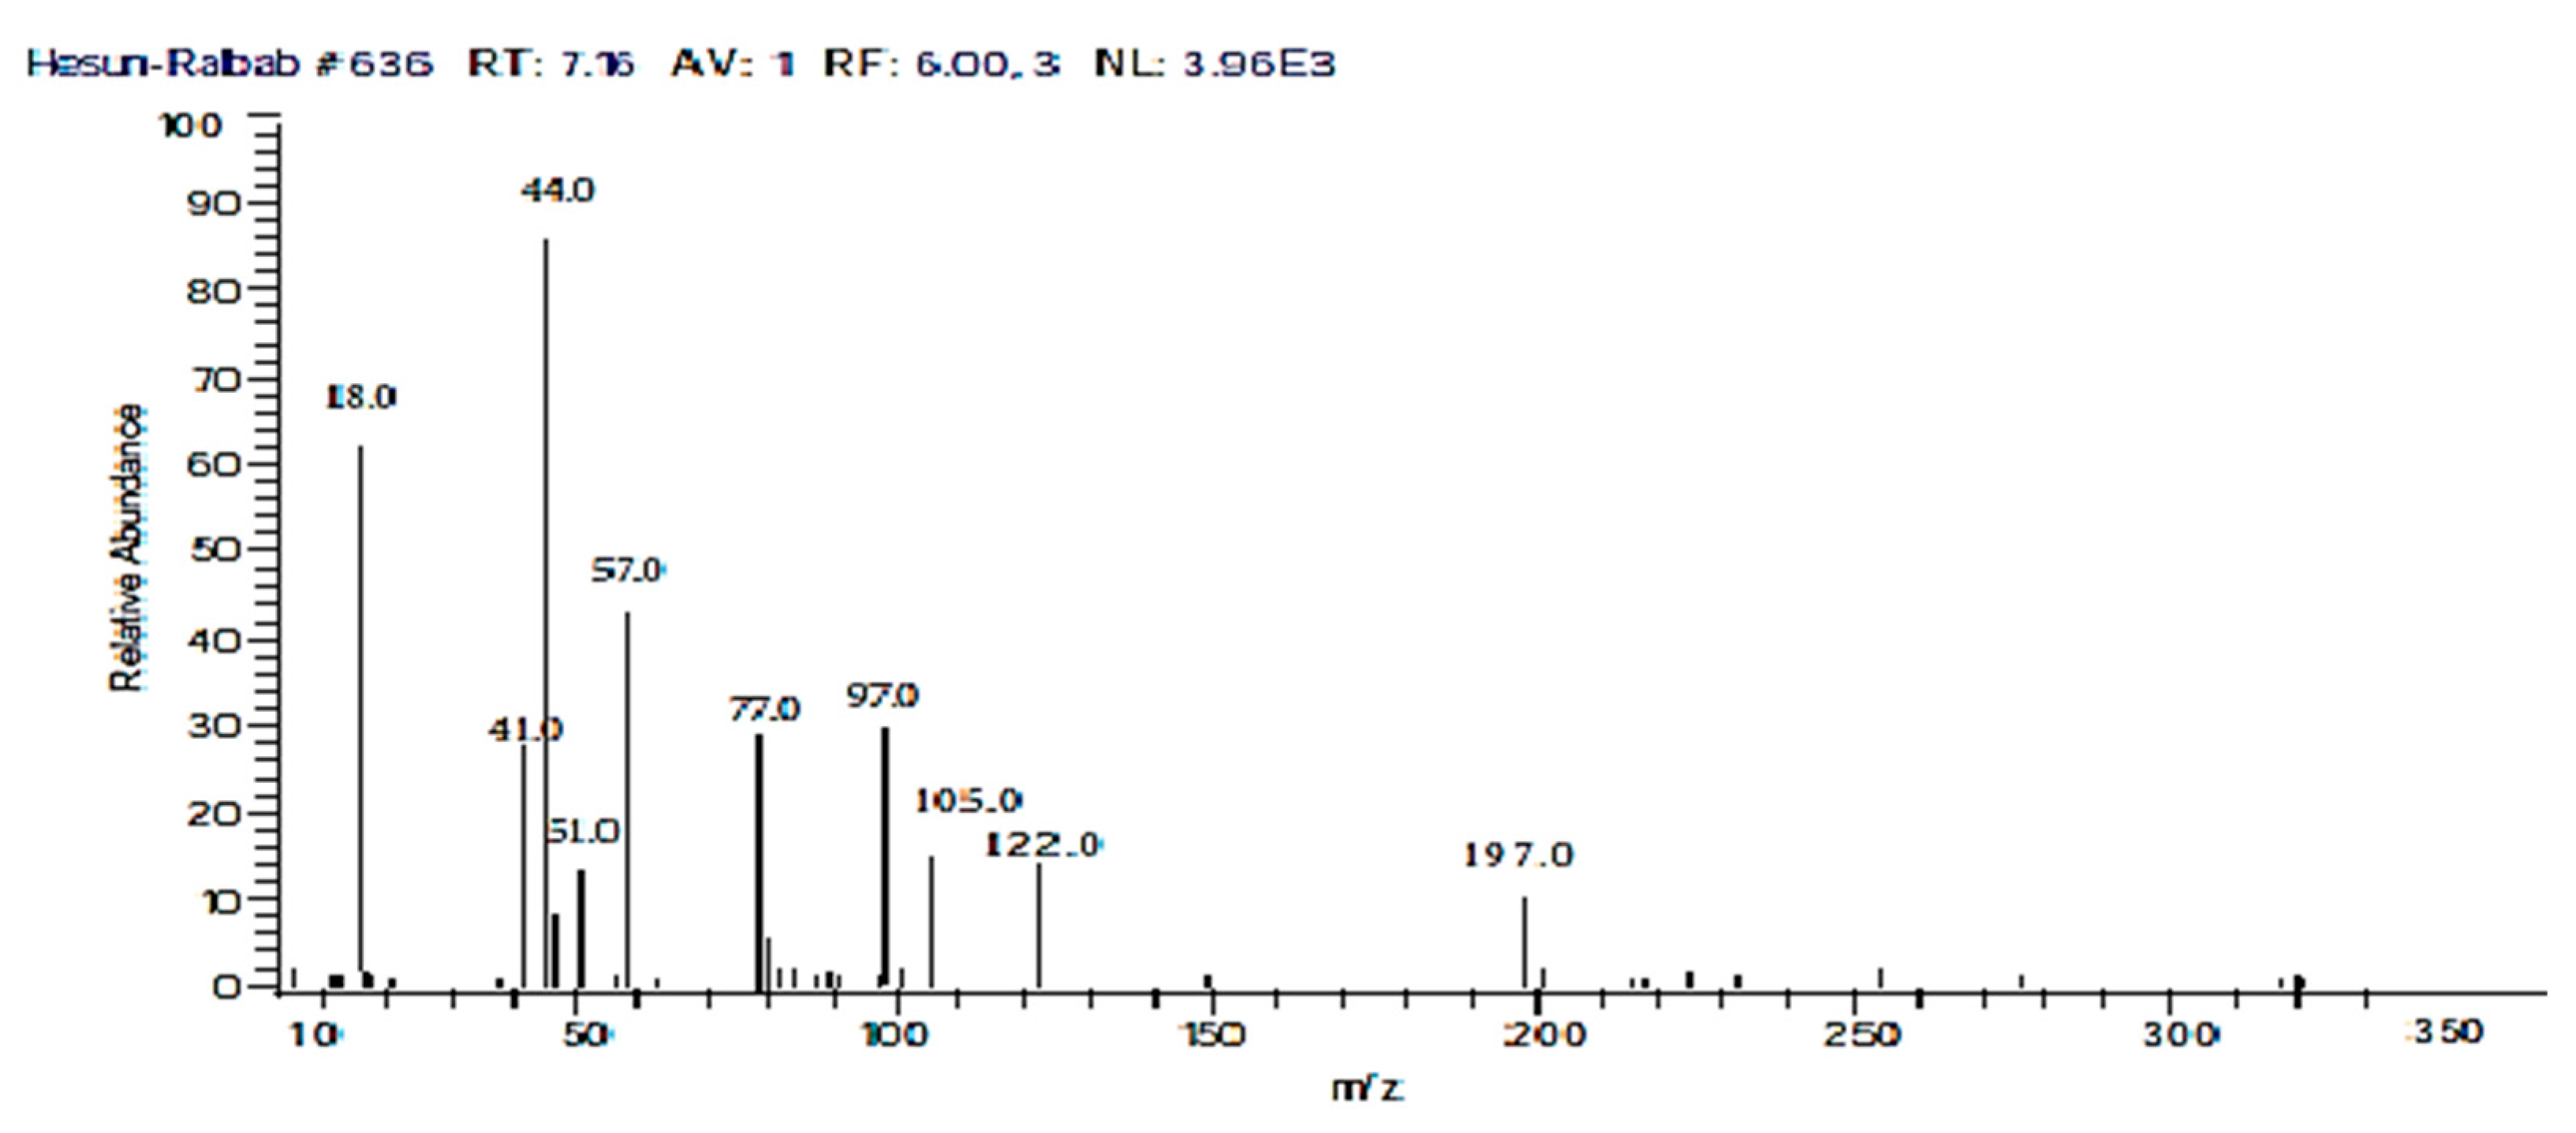
A total of 50 mmol L−1 of scavengers (isopropyl alcohol (IPA), benzoquinone (BQ), and EDTA) were introduced to the reaction mixture (30 mg/L CF dye, 1.5 g/L ZFWC2, pH 9) in order to evaluate the most significant contribution of the radicals in the degradation of CF. When IPA was added as an HO· scavenger, the degradation of CF slightly decreased (CF% removal was 80%), proving that the HO· was not the primary interactive species. When 50 mmol L−1 benzoquinone (BQ) was used, CF% removal was 60%, indicating that the O 2 . plays a role in the photodegradation process. However, when 50 mmol L−1 EDTA was used, the catalytic degradation of CF strongly decreased (CF removal achieved 35%), demonstrating that the h+ plays a significant role in the catalytic process. Accordingly, h+ and O 2 . made the greatest contributions to the photocatalytic degradation of CF, while HO· made only a minor contribution [16].

2.2.7. Toxicity

Vibrio fischeri solution was used to examine the toxicity of the treated water reference using ZFWC2, via incubation for 10 min followed by exposure to heavy light. The water treated with ZFWC2 was nontoxic, as evidenced by an EC50 reading of more than 100 mg/L Microtox [28].

2.2.8. The Proposed Mechanism of Photocatalytic Degradation of CF

To elucidate the mechanism of photocatalytic degradation of CF, we conducted GC–MS analysis of the treated water using ZFWC2 under the optimal operating conditions (Figure 15). Detection of low-molecular-weight compounds m/z = (97, 57, 41) proved the degradation of high-molecular-weight CF (338 g/mol) into the smaller compounds hexane, propanol, and acetonitrile, as a result of attack by active radicals generated during the photocatalytic process (Figure 16). Finally, the detected intermediates mineralized to form inorganic compounds (carbon dioxide, water, and nitrates). The nitrate concentration at end of the degradation experiment was 1.5 mg/L, indicating that nitrates are a byproduct of complete degradation [3,16].

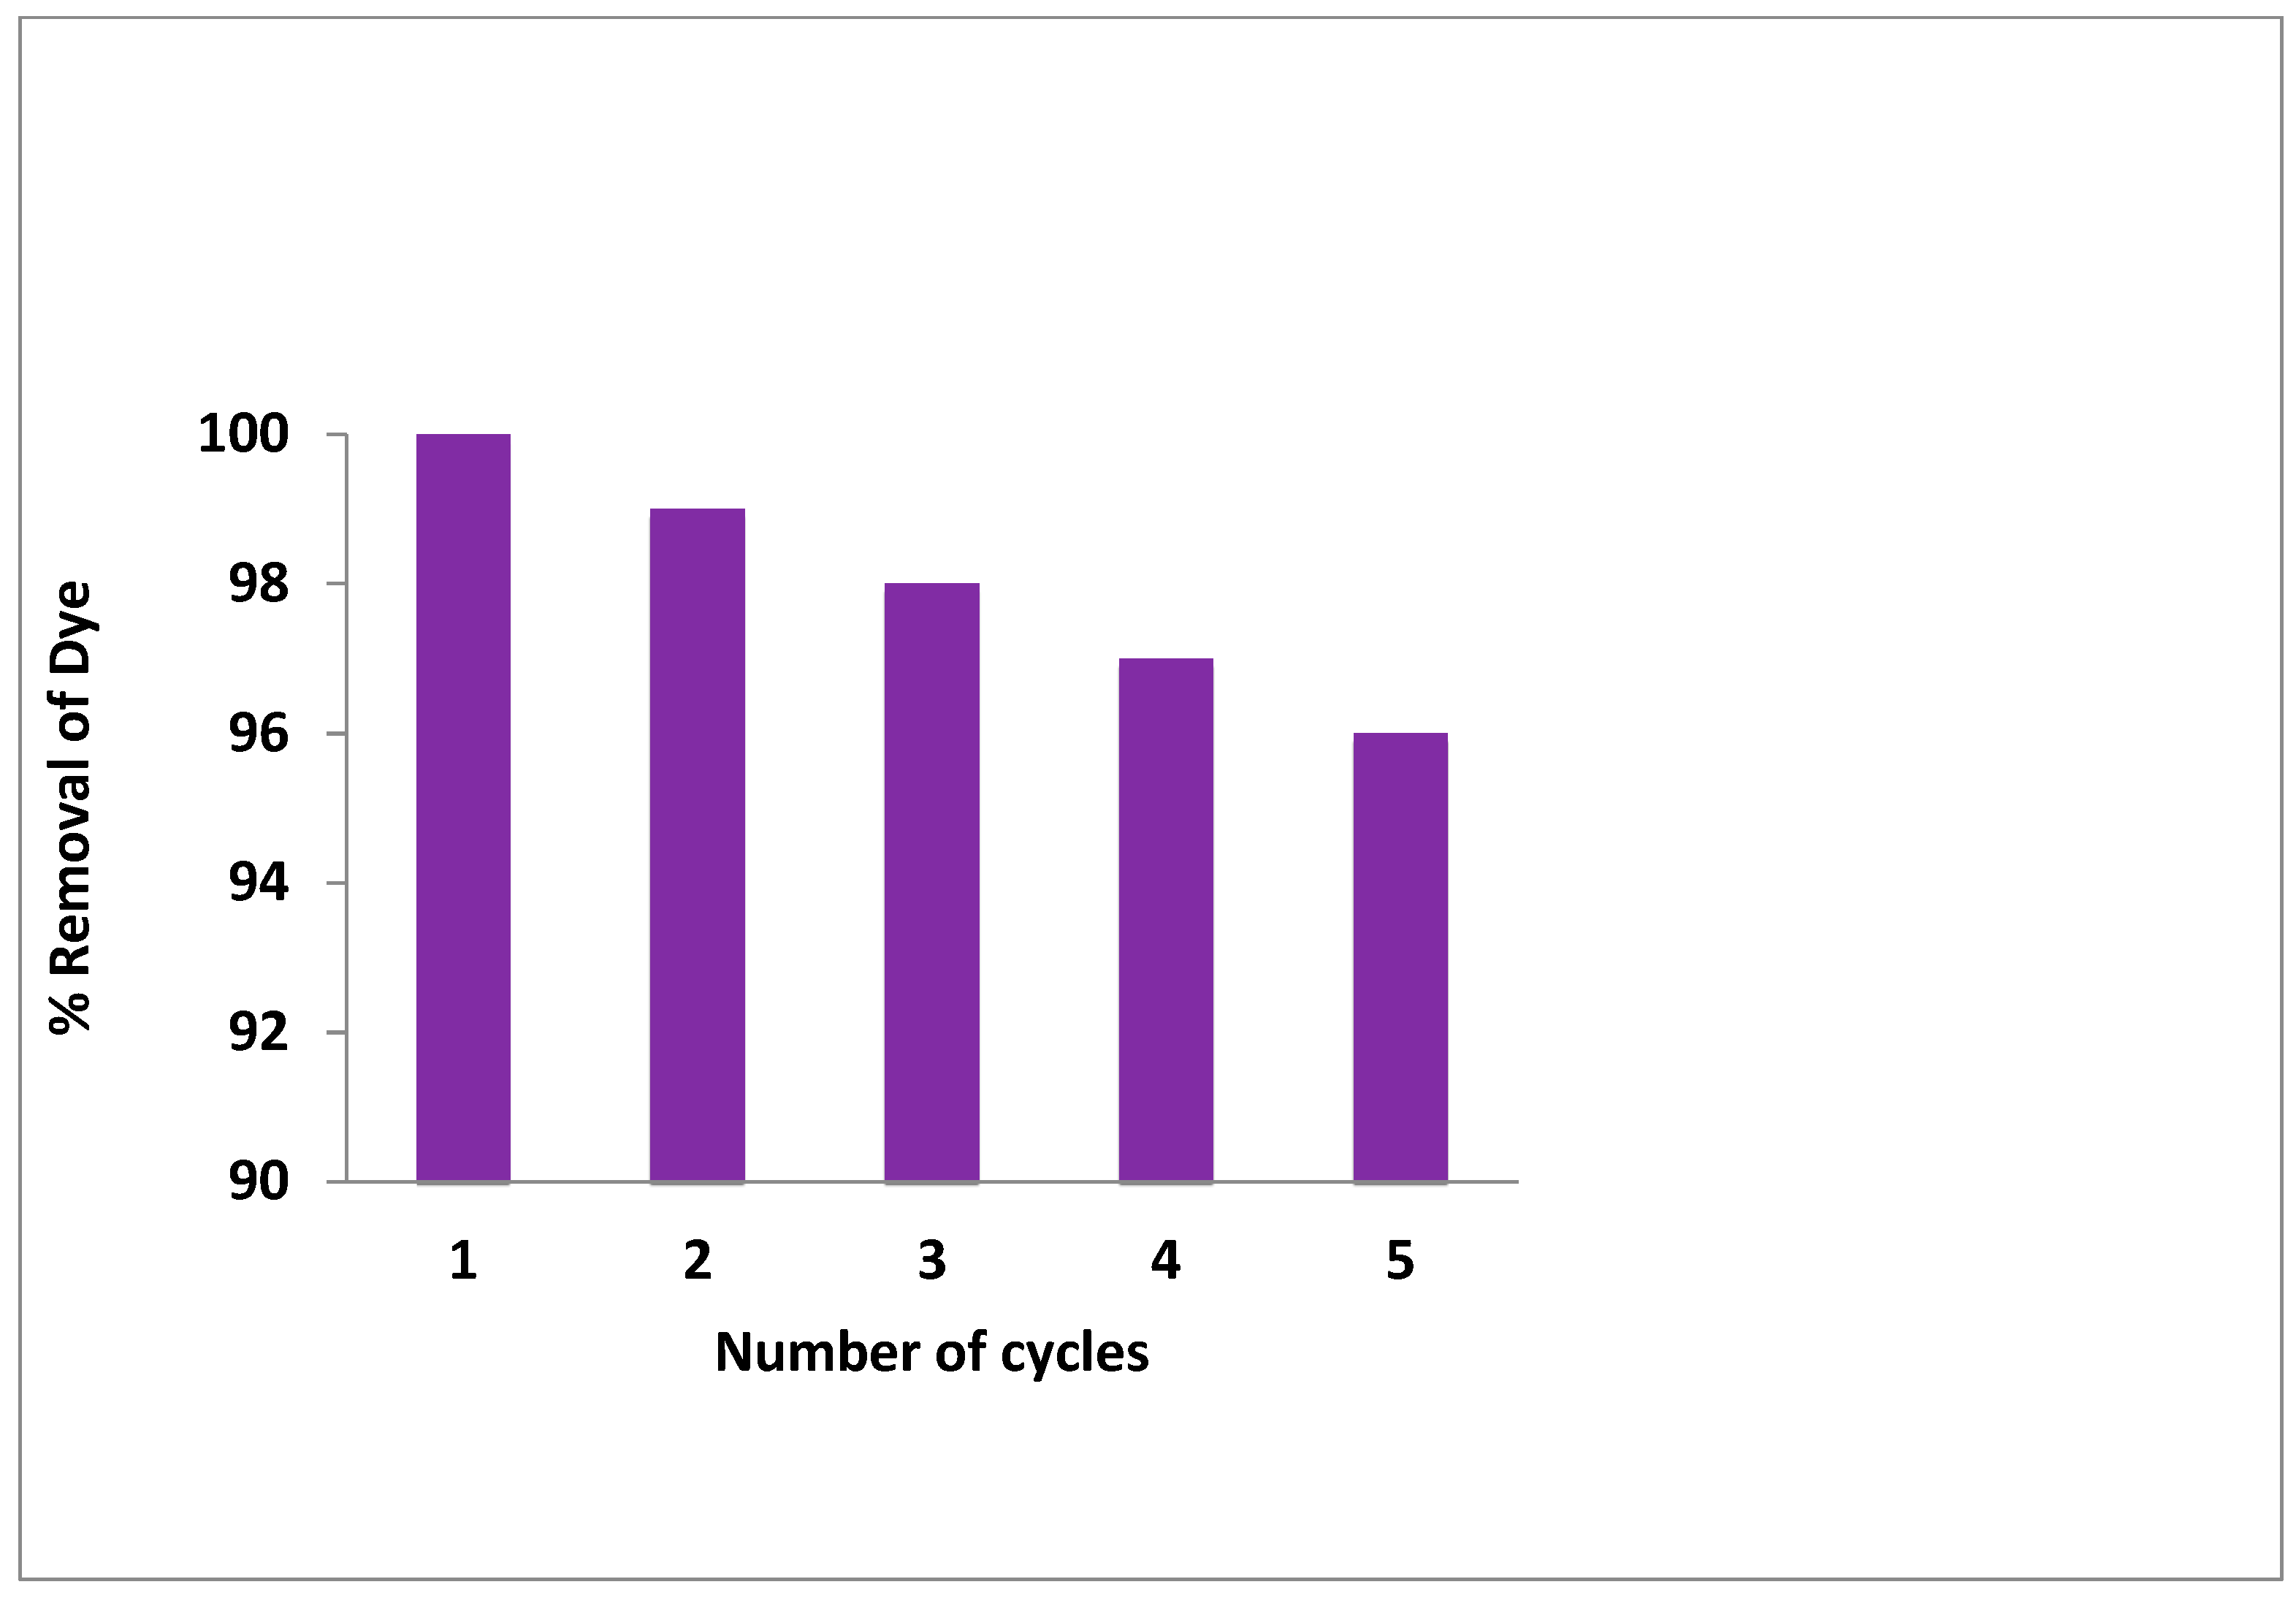
2.2.9. The Reusability of ZFWC2

Five cycles of CF degradation were performed using ZFWC2 under optimal conditions, in order to examine the reusability of the prepared catalyst (Figure 17). After each cycle, the catalyst was allowed to settle in order to remove the supernatant, and was then used in the next cycle. Degradation decreased from 100% to 96% between the first cycle and the fifth cycle, which is considered a promising result for reusing the prepared catalyst without significant loss of its capacity for photodegradation of the dye.
Table 5 compares photocatalytic CF degradation with various photocatalysts that demonstrated complete CF degradation in previous studies with the results of the present study, indicating that Fe1.85Cu0.15Zr1.85W0.15O7 is an efficient photocatalyst comparable to the cited studies.

3. Materials and Methods

3.1. Materials

All materials were purchased and used without any further purification. Zirconium(IV) oxynitrate hydrate and tungsten(VI) chloride were purchased from Sigma-Aldrich, while iron(III) nitrate nonahydrate was purchased from Guangdong Guanghua Sci-Tech. Copper(II) nitrate trihydrate was purchased from Scharlau, citric acid anhydrous from Loba Chemie, ethylene glycol from CLWYD, and carbol fuchsin from Gurr Microscopy Materials.

3.2. Preparation of Photocatalysts

All catalysts were prepared using the Pechini method. Fe2−xCuxZr2−xWxO7 was prepared as described by Abbas et al. (2020) [28], by mixing copper nitrate with an aqueous solution of zirconium oxynitrate hydrate, iron nitrate, and tungsten chloride, according to the proper stoichiometry of the metal oxides in the final solution. For chelation of metal cations, citric acid was added to the aqueous solution, with a 4:1 molar ratio of citric acid: Fe3+ in the final product. pH was adjusted to 3 before the addition of ethylene glycol, with a molar ratio of 1:1.5 for ethylene glycol:citric acid. Esterification and polymerization were achieved by continuously stirring the solution and heating it to 140 °C until a gel was formed. Finally, three calcination steps in a muffle furnace were performed, with two hours for each step (300 °C, 500 °C, and 600 °C), with the product being ground between calcination steps. Table 1 shows the names and compositions of the prepared catalysts.

3.3. Characterization Photocatalysts

A Shimadzu 7000 X-ray spectrophotometer was used for XRD characterizations, and UnitCellWin software [34] was used for the calculation of the lattice parameters. Size measurements of prepared catalysts were performed using a JEOL JEM2100 transmission electron microscope (TEM). The band gap calculations were performed using diffuse reflectance measurements from a Shimadzu UV-3600, with a resolution of 0.1 nm and a photomultiplier tube (PMT) detector. A Lovibond SpectroDirect visible spectrophotometer (Germany) was used for measuring absorbance for the sample. Degradation experiments employed an OSRAM GmbH HQI-T250/Daylight (Munich, Germany), which is a visible metal halide lamp with a luminous efficacy of 82 lm/W and a luminous irradiation flux of 20,000 lm.

3.4. Carbol Fuchsin Degradation Experiments

A solution of carbol fuchsin was prepared. Different parameters were examined: equilibrium time (0–120 min), catalyst dosage (0.25, 0.5, 0.75, 1.5, 2.0, and 2.5 g/L), solution pH (3.0, 5.0, 7.0, 9.0, and 11.0), and carbol fuchsin concentration (20, 30, 40, and 50 ppm). A dye solution and catalyst were situated in the dark for 30 min to confirm equilibrium between the adsorption and desorption of dye molecules on the photocatalyst surface prior to the illumination, and this was considered as a control sample. A commercial visible metal halide lamp (HQI-T250/Daylight, OSRAM GmbH, Munich, Germany) with a luminous efficacy of 82 lm/W and a luminous irradiation flux of 20,000 lm (wavelengths 380–780 nm) was used. Catalyst reusability was tested 5 times.
The degradation efficiency was calculated according to Equation (1):
% Degradation   Efficiency = C 0 C C 0   ×   100 %
where C0 and C are the initial and final concentrations of CF, respectively, at time t. The concentration of CF dye was measured using the double-beam UV–Vis spectrophotometer (Cary-100). The nitrate concentration was determined as described by the APHA in 2017 (APHA, 2017) [47].
The kinetics of the reaction rate were tested using pseudo-first-order reaction (Equation (2)) and pseudo-second-order reaction (Equation (3)) models.
ln C 0 C = K a p p t  
where C0 and C are the CF concentration at zero time and time t, respectively, and Kapp is the pseudo-first-order rate constant.
t q t = 1 k 2 q e 2 + 1 q e t
where k2 is the rate constant, qe is the amount of CF degraded at equilibrium, and qt is the amount of CF degraded at time t.

3.5. Active Radical Trapping Experiments

To examine the significance of the active species involved in CF photodegradation, the experiments were conducted using 50 mmol isopropanol (IPA), EDTA, and benzoquinone (BQ) scavenger, which were introduced to the reaction mixture separately in order to explore the role of the HO· radicals, photogenerated holes, (h+) and O 2 radicals, respectively.

3.6. Toxicity

The treated water was tested using a Microtox Model 500 analyzer and the ISO 11348-3, 2007 standard. The test organism was lyophilized Vibrio fischeri (NRRLB-11177). The bacterial suspension was introduced to treated water, and photometry was measured on a regular basis [48].

4. Conclusions

A promising new photocatalyst (Fe2−xCuxZr2−xWxO7) synthesized using a modified Pechini method showed superior efficiency in dye photodegradation (where x = 0, 0.05, 0.15). The catalysts with the highest concentrations of W and Cu (15 mol%) had the lowest band gap (1.47 eV) among other synthesized catalysts. The prepared catalysts were active under visible light. Complete removal of carbol fuchsin dye (CF) was obtained under optimal conditions of 20 mg/L CF concentration, pH of 9, and catalyst loading of 1.5 g/L of Fe1.85Cu0.15Zr1.85W0.15O7. The degradation rate followed first-order kinetics. The reusability of the photocatalyst five times decreased its efficiency by 4%.

Author Contributions

Conceptualization, R.A.-Z., T.S.J. and H.A.A.; methodology, R.A.-Z., R.A.N., T.S.J., H.A.A. and A.K.; validation; R.A.-Z., A.A.B., R.A.N., T.S.J. and A.K.; formal analysis, A.K. and H.A.A.; investigation, A.A.B. and T.S.J.; resources, A.A.B., H.A.A., T.S.J. and R.A.-Z.; data curation, R.A.-Z., R.A.N., H.A.A. and A.K.; writing—original draft preparation, R.A.-Z. and A.K.; writing—review and editing, A.A.B., T.S.J., R.A.-Z., A.K., H.A.A. and R.A.N.; visualization, R.A.-Z., A.K., H.A.A. and R.A.N.; supervision, A.A.B. and T.S.J.; project administration, A.A.B., T.S.J., R.A.-Z. and H.A.A.; funding acquisition, A.A.B., T.S.J., R.A.-Z. and H.A.A. All authors have read and agreed to the published version of the manuscript.

Funding

This research was funded by the Scientific Research Support Fund in Jordan, (grant number Egy-Jor/1/01/2015) and the Science and Technology Development Fund in Egypt (21734).

Acknowledgments

The authors acknowledge the Jordanian Scientific Research Support Fund and the Egyptian Science and Technology Development Fund for financing this work through collaborative project numbers (Egy-Jor/1/01/2015) in Jordan and (21734) in Egypt. In addition, the authors would like to thank the Deanship of Academic Research (DAR) at The University of Jordan (UJ) for their additional financial support.

Conflicts of Interest

The authors declare no conflict of interest.

References

  1. Pavithra, K.G.; Jaikumar, V. Removal of colorants from wastewater: A review on sources and treatment strategies. J. Ind. Eng. Chem. 2019, 75, 1–19. [Google Scholar] [CrossRef]
  2. Wang, L.; Fu, X.; Han, Y.; Chang, E.; Wu, H.; Wang, H.; Li, K.; Qi, X. Preparation, Characterization, and Photocatalytic Activity of TiO2/ZnO Nanocomposites. J. Nanomater. 2013, 2013, 1–6. [Google Scholar] [CrossRef] [Green Version]
  3. Koli, P.B.; Kapadnis, K.H.; Deshpande, U.G. Transition metal decorated Ferrosoferric oxide (Fe3O4): An expeditious catalyst for photodegradation of Carbol Fuchsin in environmental remediation. J. Environ. Chem. Eng. 2019, 7, 103373. [Google Scholar] [CrossRef]
  4. Qin, J.; Qiu, F.; Rong, X.; Yan, J.; Zhao, H.; Yang, D. Removal of basic fuchsin dye from aqueous solutions using graphite oxide modified aromatic polyurethane foam material. Toxicol. Environ. Chem. 2014, 96, 849–860. [Google Scholar] [CrossRef]
  5. Huong, D.T.M.; Liu, B.-L.; Chai, W.S.; Show, P.L.; Tsai, S.-L.; Chang, Y.-K. Highly efficient dye removal and lysozyme purification using strong and weak cation-exchange nanofiber membranes. Int. J. Biol. Macromol. 2020, 165, 1410–1421. [Google Scholar] [CrossRef] [PubMed]
  6. Brito, C.N.; Ferreira, M.B.; de Moura Santos, E.C.M.; Léon, J.J.L.; Ganiyu, S.O.; Martínez-Huitle, C.A. Electrochemical degradation of Azo-dye Acid Violet 7 using BDD anode: Effect of flow reactor configuration on cell hydrodynamics and dye removal efficiency. J. Appl. Electrochem. 2018, 48, 1321–1330. [Google Scholar] [CrossRef]
  7. Droguett, T.; Mora-Gómez, J.; García-Gabaldón, M.; Ortega, E.; Mestre, S.; Cifuentes, G.; Pérez-Herranz, V. Electrochemical Degradation of Reactive Black 5 using two-different reactor configuration. Sci. Rep. 2020, 10, 1–11. [Google Scholar] [CrossRef]
  8. Cerboneschi, M.; Corsi, M.; Bianchini, R.; Bonanni, M.; Tegli, S. Decolorization of acid and basic dyes: Understanding the metabolic degradation and cell-induced adsorption/precipitation by Escherichia coli. Appl. Microbiol. Biotechnol. 2015, 99, 8235–8245. [Google Scholar] [CrossRef] [Green Version]
  9. Mohamed, A.; El-Sayed, R.; Osman, T.; Toprak, M.; Muhammed, M.; Uheida, A. Composite nanofibers for highly efficient photocatalytic degradation of organic dyes from contaminated water. Environ. Res. 2016, 145, 18–25. [Google Scholar] [CrossRef]
  10. Chen, X.; Wu, Z.; Liu, D.; Gao, Z. Preparation of ZnO Photocatalyst for the Efficient and Rapid Photocatalytic Degradation of Azo Dyes. Nanoscale Res. Lett. 2017, 12, 1–10. [Google Scholar] [CrossRef] [PubMed] [Green Version]
  11. Anwer, H.; Mahmood, A.; Lee, J.; Kim, K.-H.; Park, J.-W.; Yip, A. Photocatalysts for degradation of dyes in industrial effluents: Opportunities and challenges. Nano Res. 2019, 12, 955–972. [Google Scholar] [CrossRef]
  12. Tichapondwa, S.; Newman, J.; Kubheka, O. Effect of TiO2 phase on the photocatalytic degradation of methylene blue dye. Phys. Chem. Earth Parts A/B/C 2020, 118-119, 102900. [Google Scholar] [CrossRef]
  13. Schneider, J.; Matsuoka, M.; Takeuchi, M.; Zhang, J.; Horiuchi, Y.; Anpo, M.; Bahnemann, D.W. Un-derstanding TiO2 photocatalysis: Mechanisms and materials. Chem. Rev. 2014, 114, 9919–9986. [Google Scholar] [CrossRef]
  14. Badvi, K.; Javanbakht, V. Enhanced photocatalytic degradation of dye contaminants with TiO2 immobilized on ZSM-5 zeolite modified with nickel nanoparticles. J. Clean. Prod. 2021, 280, 124518. [Google Scholar] [CrossRef]
  15. Oyelude, E.; Frimpong, F.; Dawson, D. Studies on the Removal of Basic Fuchsin Dye from Aqueous Solution by HCl Treated Malted Sorghum Mash. J. Mater. Environ. Sci. 2015, 6, 1126–1136. [Google Scholar]
  16. Shinde, S.; Shrivastava, V.S. Ni and Zn modified acid activated montmorillonite clay for effective removal of carbol fuchsin dye from aqueous solution. SN Appl. Sci. 2020, 2, 1–11. [Google Scholar] [CrossRef] [Green Version]
  17. Chen, C.; Li, X.; Ma, W.; Zhao, J.; Hidaka, H.; Serpone, N. Effect of Transition Metal Ions on the TiO2-Assisted Photodegradation of Dyes under Visible Irradiation: A Probe for the Interfacial Electron Transfer Process and Reaction Mechanism. J. Phys. Chem. B 2002, 106, 318–324. [Google Scholar] [CrossRef]
  18. Saeed, K.; Khan, I.; Gul, T.; Sadiq, M. Efficient photodegradation of methyl violet dye using TiO2/Pt and TiO2/Pd photocatalysts. Appl. Water Sci. 2017, 7, 3841–3848. [Google Scholar] [CrossRef]
  19. Pastrana-Martínez, L.M.; Morales-Torres, S.; Likodimos, V.; Figueiredo, J.; Faria, J.; Falaras, P.; Silva, A. Advanced nanostructured photocatalysts based on reduced graphene oxide–TiO2 composites for degradation of diphenhydramine pharmaceutical and methyl orange dye. Appl. Catal. B Environ. 2012, 123-124, 241–256. [Google Scholar] [CrossRef]
  20. Sriramoju, J.B.; Muniyappa, M.; Marilingaiah, N.R.; Sabbanahalli, C.; Shetty, M.; Mudike, R.; Chitrabanu, C.P.; Shivaramu, P.D.; Nagaraju, G.; Rangappa, K.S.; et al. Carbon-based TiO2-x heterostructure nanocomposites for enhanced photocatalytic degradation of dye molecules. Ceram. Int. 2021, 47, 10314–10321. [Google Scholar] [CrossRef]
  21. Gouvêa, C.A.; Wypych, F.; Moraes, S.G.; Durán, N.; Peralta-Zamora, P. Semiconductor-assisted photodegradation of lignin, dye, and kraft effluent by Ag-doped ZnO. Chemosphere 2000, 40, 427–432. [Google Scholar] [CrossRef]
  22. Chakrabarti, S.; Dutta, B.K. Photocatalytic degradation of model textile dyes in wastewater using ZnO as semiconductor catalyst. J. Hazard. Mater. 2004, 112, 269–278. [Google Scholar] [CrossRef]
  23. Zhao, H.; Xia, Q.; Xing, H.; Chen, D.; Wang, H. Construction of Pillared-Layer MOF as Efficient Visible-Light Photocatalysts for Aqueous Cr(VI) Reduction and Dye Degradation. ACS Sustain. Chem. Eng. 2017, 5, 4449–4456. [Google Scholar] [CrossRef]
  24. Zhang, M.; Wang, L.; Zeng, T.; Shang, Q.; Zhou, H.; Pan, Z.; Cheng, Q. Two pure MOF-photocatalysts readily prepared for the degradation of methylene blue dye under visible light. Dalton Trans. 2018, 47, 4251–4258. [Google Scholar] [CrossRef] [PubMed]
  25. Chen, Y.; Zhai, B.; Liang, Y.; Li, Y.; Li, J. Preparation of CdS/ g-C3N4/ MOF composite with enhanced visible-light photocatalytic activity for dye degradation. J. Solid State Chem. 2019, 274, 32–39. [Google Scholar] [CrossRef]
  26. Sisi, A.J.; Khataee, A.; Fathinia, M.; Vahid, B. Ultrasonic-assisted degradation of a triarylmethane dye using combined peroxydisulfate and MOF-2 catalyst: Synergistic effect and role of oxidative species. J. Mol. Liq. 2020, 297, 111838. [Google Scholar] [CrossRef]
  27. Khairnar, S.D.; Kulkarni, A.N.; Shinde, S.G.; Marathe, S.D.; Marathe, Y.V.; Dhole, S.D.; Shrivastava, V.S. Synthesis and characterization of 2-D La-doped Bi2O3 for photocatalytic degradation of organic dye and pesticide. J. Photochem. Photobiol. 2021, 6, 100030. [Google Scholar] [CrossRef]
  28. Abbas, H.; Nasr, R.A.; Khalaf, A.; Al Bawab, A.; Jamil, T.S. Photocatalytic degradation of methylene blue dye by fluorite type Fe2Zr2−xWxO7 system under visible light irradiation. Ecotoxicol. Environ. Saf. 2020, 196, 110518. [Google Scholar] [CrossRef]
  29. Malathi, M.; Sreenu, K.; Ravi, G.; Kumar, P.; Sudhakar Reddy, C.; Guje, R.; Velchuri, R.; Vithal, M. Low temperature synthesis of fluorite-type Ce-based oxides of composition Ln2Ce2O7 (Ln = Pr, Nd and Eu): Photodegradation and Luminescence studies. J. Chem. Sci. 2017, 129, 1193–1203. [Google Scholar] [CrossRef]
  30. Devi, V.R.; Ravi, G.; Velchuri, R.; Muniratnam, N.R.; Prasad, G.; Vithal, M. Preparation, Characterization, Photocatalytic Activity and Conductivity Studies of YLnTi2O7(Ln = Nd, Sm, Eu and Gd). Trans. Indian Ceram. Soc. 2013, 72, 241–251. [Google Scholar] [CrossRef]
  31. Ma, T.T.; Zhou, R.S.; Li, X. Synthesis of Pyrochlore-Type K2Ta2O6 with High Photocatalytic Activity for Dye Degradation. Key Eng. Mater. 2016, 680, 203–207. [Google Scholar] [CrossRef]
  32. Ravi, G.; Mansouri, S.; Palla, S.; Vithal, M. Synthesis of Y2Ti2O7-XNywith Visible Light Responsive Photocatalytic Activity. Indian J. Chem. Sect. Inorg. Phys. Theor. Anal. Chem. 2015, 54, 20–26. [Google Scholar]
  33. Abbas, H.A.; Nasr, R.A.; Abu-Zurayk, R.; Al Bawab, A.; Jamil, T.S. Decolourization of crystal violet using nano-sized novel fluorite structure Ga2Zr2−xWxO7 photocatalyst under visible light irradiation. R. Soc. Open Sci. 2020, 7, 191632. [Google Scholar] [CrossRef] [Green Version]
  34. Holland, T.J.B.; Redfern, S. Unit cell refinement from powder diffraction data: The use of regression diagnostics. Miner. Mag. 1997, 61, 65–77. [Google Scholar] [CrossRef]
  35. Nasr, R.A.; Abbas, H.; Khalaf, A.; Bozeya, A.; Jamil, T.S. Nano-sized Ga2-xCuxZr2-xWxO7 for Malachite green decolorization under visible light. DESALINATION Water Treat. 2020, 183, 389–403. [Google Scholar] [CrossRef]
  36. Shannon, R.D. Revised effective ionic radii and systematic studies of interatomic distances in halides and chalcogenides. Acta Crystallogr. A 1976, 32, 751–767. [Google Scholar] [CrossRef]
  37. Jamil, T.; Mansor, E.; Nasr, R. Degradation of Lindane using two nanosized BiOXs and their heterojunction under visible light. DESALINATION Water Treat. 2015, 57, 14750–14761. [Google Scholar] [CrossRef]
  38. Kiriakidou, F.; Kondarides, D.; Verykios, X.E. The effect of operational parameters and TiO2-doping on the photocatalytic degradation of azo-dyes. Catal. Today 1999, 54, 119–130. [Google Scholar] [CrossRef]
  39. Arul, N.S.; Mangalaraj, D.; Han, J.I. Enhanced photocatalytic property of self-assembled Fe-doped CeO2 hierarchical nanostructures. Mater. Lett. 2015, 145, 189–192. [Google Scholar] [CrossRef]
  40. Sayed, M.; Arooj, A.; Shah, N.S.; Khan, J.A.; Shah, L.A.; Rehman, F.; Arandiyan, H.; Khan, A.M.; Khan, A.R. Narrowing the band gap of TiO2 by co-doping with Mn2+ and Co2+ for efficient photocatalytic degradation of enoxacin and its additional peroxidase like activity: A mechanistic approach. J. Mol. Liq. 2018, 272, 403–412. [Google Scholar] [CrossRef]
  41. Mohagheghian, A.; Karimi, S.-A.; Yang, J.-K.; Shirzad-Siboni, M. Photocatalytic Degradation of a Textile Dye by Illuminated Tungsten Oxide Nanopowder. J. Adv. Oxid. Technol. 2015, 18, 18. [Google Scholar] [CrossRef]
  42. Buvaneswari, K.; Karthiga, R.; Kavitha, B.; Rajarajan, M.; Suganthi, A. Effect of FeWO 4 doping on the photocatalytic activity of ZnO under visible light irradiation. Appl. Surf. Sci. 2015, 356, 333–340. [Google Scholar] [CrossRef]
  43. Coleman, H.M.; Eggins, B.R.; Byrne, J.; Palmer, F.L.; King, E. Photocatalytic degradation of 17-β-oestradiol on immobilised TiO2. Appl. Catal. B Environ. 2000, 24, L1–L5. [Google Scholar] [CrossRef]
  44. Chanu, L.A.; Singh, W.J.; Singh, K.J.; Devi, K.N. Effect of operational parameters on the photocatalytic degradation of Methylene blue dye solution using manganese doped ZnO nanoparticles. Results Phys. 2019, 12, 1230–1237. [Google Scholar] [CrossRef]
  45. Barakat, M.; Schaeffer, H.; Hayes, G.; Ismat-Shah, S. Photocatalytic degradation of 2-chlorophenol by Co-doped TiO2 nanoparticles. Appl. Catal. B Environ. 2005, 57, 23–30. [Google Scholar] [CrossRef]
  46. Chiou, C.-H.; Juang, R.-S. Photocatalytic degradation of phenol in aqueous solutions by Pr-doped TiO2 nanoparticles. J. Hazard. Mater. 2007, 149, 1–7. [Google Scholar] [CrossRef] [PubMed]
  47. APHA. Standard Method for Examination of Water and Wastewater, 23rd ed.; American Public Health Association: Washington, DC, USA, 2017. [Google Scholar]
  48. ISO 11348-3. Water Quality-Determination of the Inhibitory Effect of Water Samples on the Light Emission of Vibrio Fischeri (Luminescent Bacteria Test)-Part 3: Method Using Freeze-Dried Bacteria; International Organization for Standardization: London, UK, 2007. [Google Scholar]
Figure 1. XRD pattern of the Fe2−xCuxZr2−xWxO7 system (x = 0, 0.05 and 0.15).
Catalysts 11 01473 g001
Figure 2. The DRS of the ZF, ZFWC1, and ZFWC2 samples.
Catalysts 11 01473 g002
Figure 3. Linear fit for BG energy estimation for the ZF, ZFWC1, and ZFWC2 samples.
Catalysts 11 01473 g003aCatalysts 11 01473 g003b
Figure 4. Estimation of the BG energy for the ZF, ZFW1C1, and ZFW2C2 samples.
Catalysts 11 01473 g004
Figure 5. BG and the proposed energy levels resulting from co-doping in the Fe2−xCuxZr2−xWxO7 system; BG is represented by the arrow.
Catalysts 11 01473 g005
Figure 6. TEM micrographs of (a) ZF, (b) ZFWC1, and (c) ZFWC2.
Catalysts 11 01473 g006aCatalysts 11 01473 g006b
Figure 7. The effect of irradiation time on CF degradation at pH 7, 30 mg/L CF concentration, and 0.5 g/L catalyst loading.
Catalysts 11 01473 g007
Figure 8. The effect of catalyst dose on photocatalytic degradation under visible light.
Catalysts 11 01473 g008
Figure 9. The effect of pH on photocatalytic degradation under visible light.
Catalysts 11 01473 g009
Figure 10. Pseudo-first-order kinetics for the degradation of different concentrations of CF using ZFWC2.
Catalysts 11 01473 g010
Figure 11. The effects of different CF concentrations on the photodegradation reaction rate for ZFWC2.
Catalysts 11 01473 g011
Figure 12. Pseudosecond-order kinetics for the degradation of different concentrations of CF using ZFWC2.
Catalysts 11 01473 g012
Figure 13. UV–Vis studies of CF degradation using ZFWC2 under optimum operating conditions.
Catalysts 11 01473 g013
Figure 14. A dye solution and catalyst under dark conditions for 30 min.
Catalysts 11 01473 g014
Figure 15. The GC–MS mass spectra of photocatalytic degradation of CF using ZFWC2 under optimal operating conditions.
Catalysts 11 01473 g015
Figure 16. The proposed mechanism for the photocatalytic degradation of CF.
Catalysts 11 01473 g016
Figure 17. Reusability study of ZFWC2 for the degradation of CF under optimal conditions.
Catalysts 11 01473 g017
Table 1. Names and compositions of Fe2−xCuxZr2−xWxO7 catalysts.
Name of CatalystComposition of Catalyst
ZFFe2Zr2O7
ZFWC1Fe1.95Cu0.05Zr1.95W0.05O7
ZFWC2Fe1.85Cu0.15Zr1.85W0.15O7
Table 2. The cubic lattice parameters and unit cell volume calculated via XRD.
Samplea (Å)V (Å3)
ZF5.10132.29
ZFWC15.08130.80
ZFWC25.09131.17
Table 3. Calculated BG values for the photocatalysts.
SampleBG
ZF1.96
ZFWC11.86
ZFWC21.47
Table 4. Size range of particles for the prepared photocatalysts, based on TEM.
SampleParticle Size Range (nm)
ZF3–7
ZFWC15–7
ZFWC23–6
Table 5. Comparison of photocatalytic degradation of CF with previous reports.
PhotocatalystReaction Time (min)Catalyst
Dose (g/L)
CF
Concentration
% DegradationReference
Ni- and Zn-modified montmorillonite clay9031594[16]
Undoped Fe3O49082090[3]
Co2+- and Ni2+-doped Fe3O4 nanoparticles9082095[3]
Undoped Fe2Zr2−xWxO7601.53077Present work
Fe1.85Cu0.15Zr1.85W0.15O7601.530100Present work
Publisher’s Note: MDPI stays neutral with regard to jurisdictional claims in published maps and institutional affiliations.

