2.1. Characterisation of the Au/CeO2 Photocatalysts
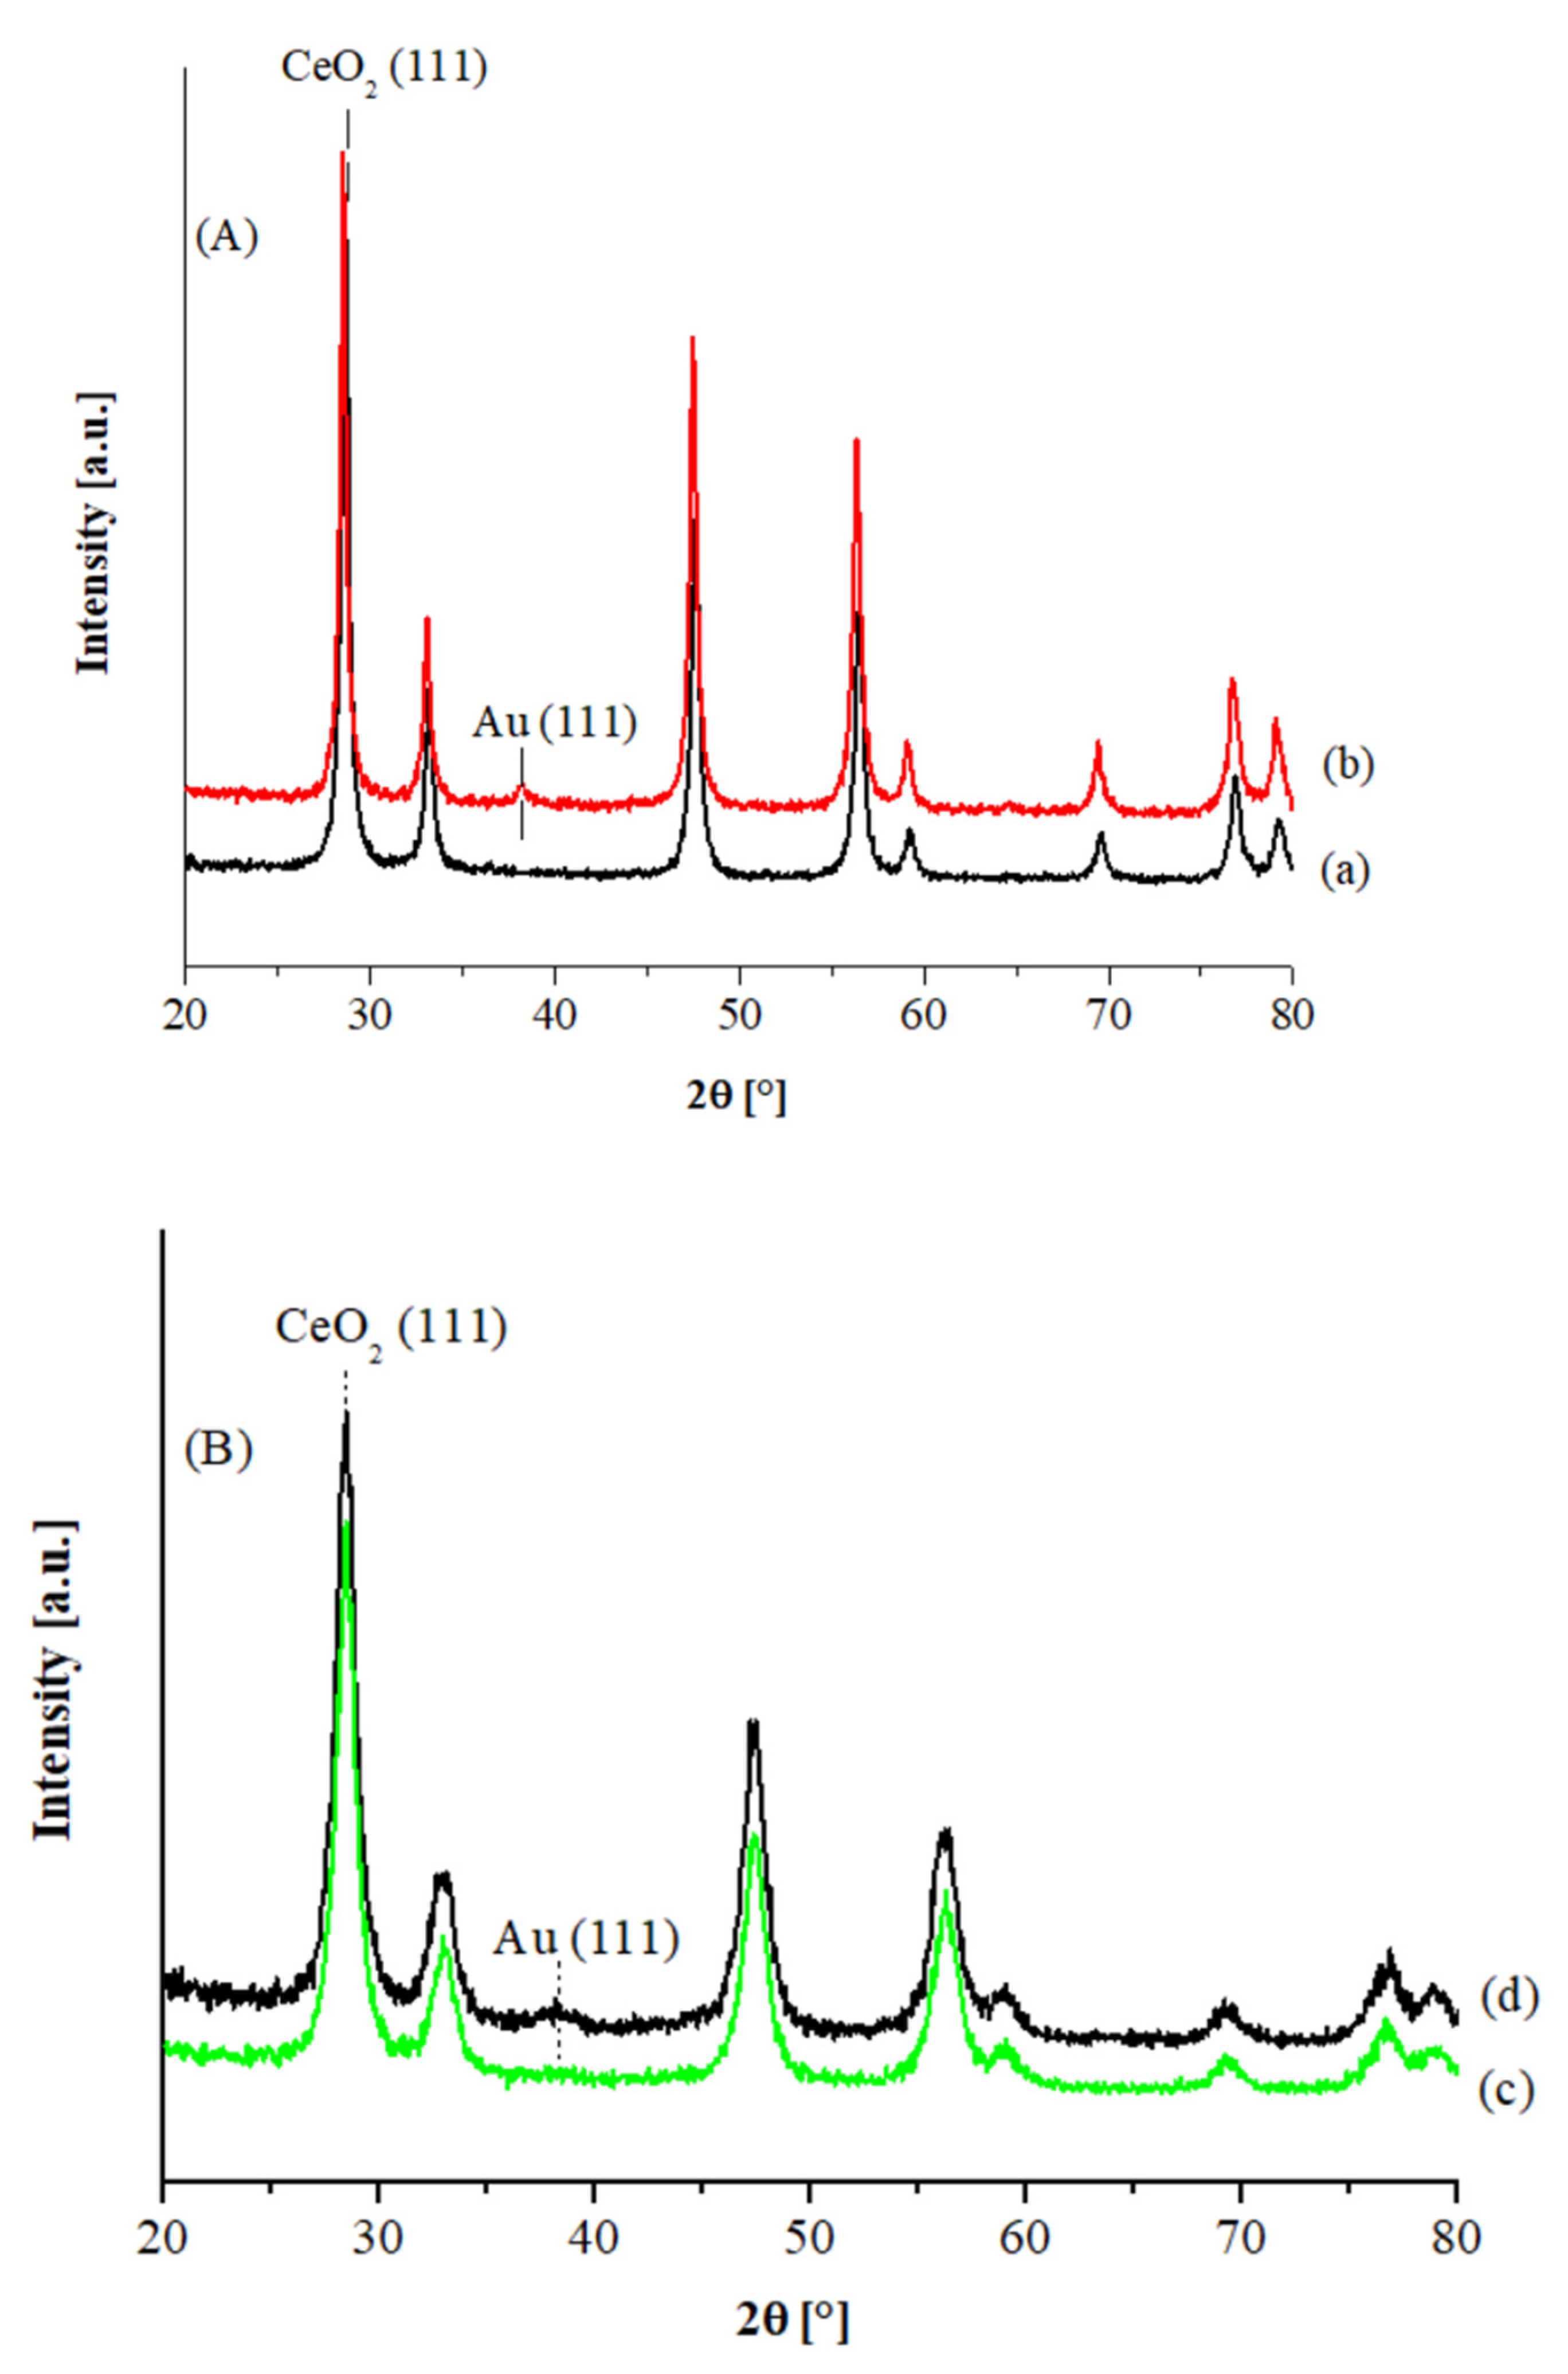
The XRD patterns of the Au catalysts supported on commercial and hp ceria are shown in
Figure 1A,B, respectively. In all cases, the diffraction peaks of the fluorite structure of ceria were detected, with a more crystalline structure in the case of the Aldrich sample. In
Table 1 the support crystallite sizes and the gold particle sizes, as determined from the line broadening of the CeO
2 and metal Au (111) XRD peaks, are listed. No gold signals are visible in the XRD patterns of both Au1% catalysts, while slightly detectable features were observed in the case of the Au3% catalysts, corresponding to an average size of ca. 3.5 and ca. 2.5 nm, in the case of the CeO
2 Aldrich and the hp supported samples, respectively.
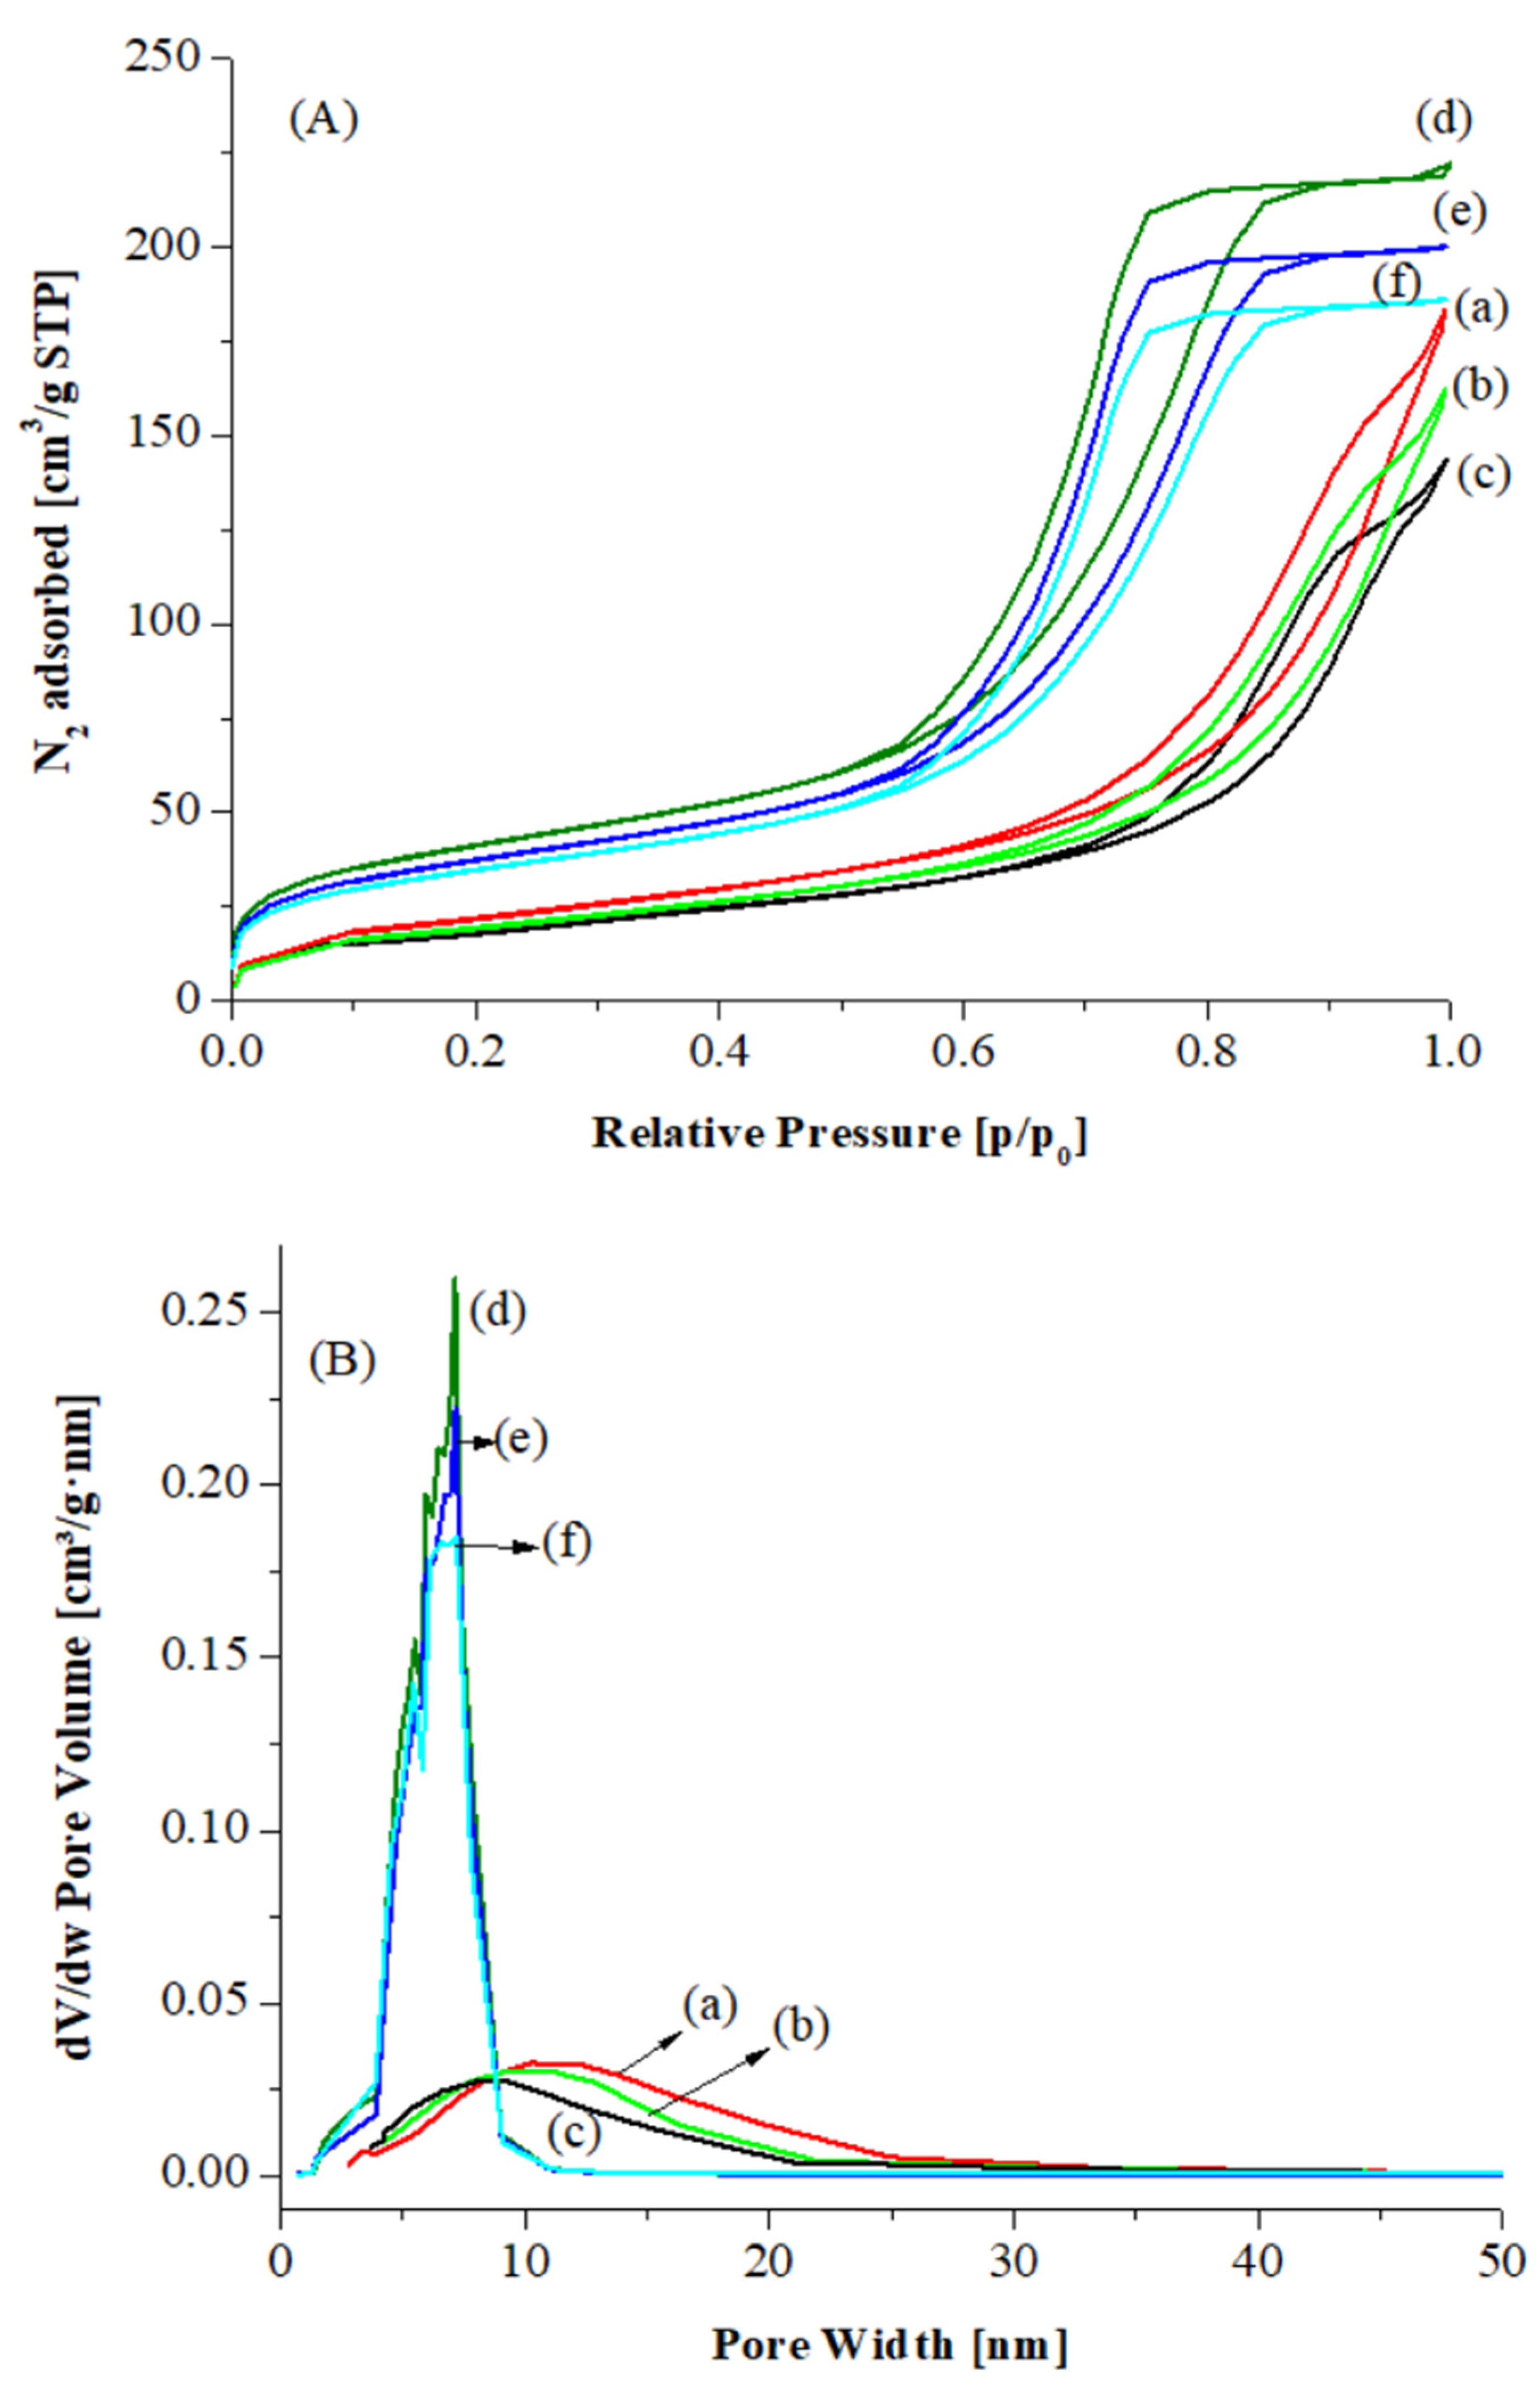
In
Figure 2A,B the nitrogen adsorption–desorption isotherms and pore size distribution curves are displayed for CeO
2 A, CeO
2 hp and for the corresponding Au catalysts. The isotherms are classical type IV, as defined by IUPAC, with hysteresis typical of mesoporous materials, H1-H2 types. The adsorption–desorption curves, for CeO
2 hp and the corresponding Au catalysts, result at low
p/
p0 values in a relatively larger adsorption than for CeO
2 A and the related catalysts, suggesting that the former samples contain also some micropores (see
Table 1).
In
Table 1 the specific surface area (SSA), mesopore diameter and mesopores volume values are listed. The micropore volume calculated by t-Plot for CeO
2 hp and the corresponding gold supported catalysts is also reported. Both ceria oxides are characterized by relatively high SSA, ~80 and 100 m
2/g, respectively. After Au deposition and calcination, for both catalysts the surface area values along with the pore volume slightly decreased. For the Au catalysts over CeO
2 A the mean pore diameter also decreased, suggesting that some metallic Au nanoparticles may partially fill the pores, while no modifications were observed in the pore size distribution of gold deposited over CeO
2 hp, according to the stabilization of gold mainly as Au
+1 species that partially diffuse into the bulk of the support. Furthermore, the Au/CeO
2 hp catalysts kept some microporosity based on the micropore volume values listed in
Table 1.
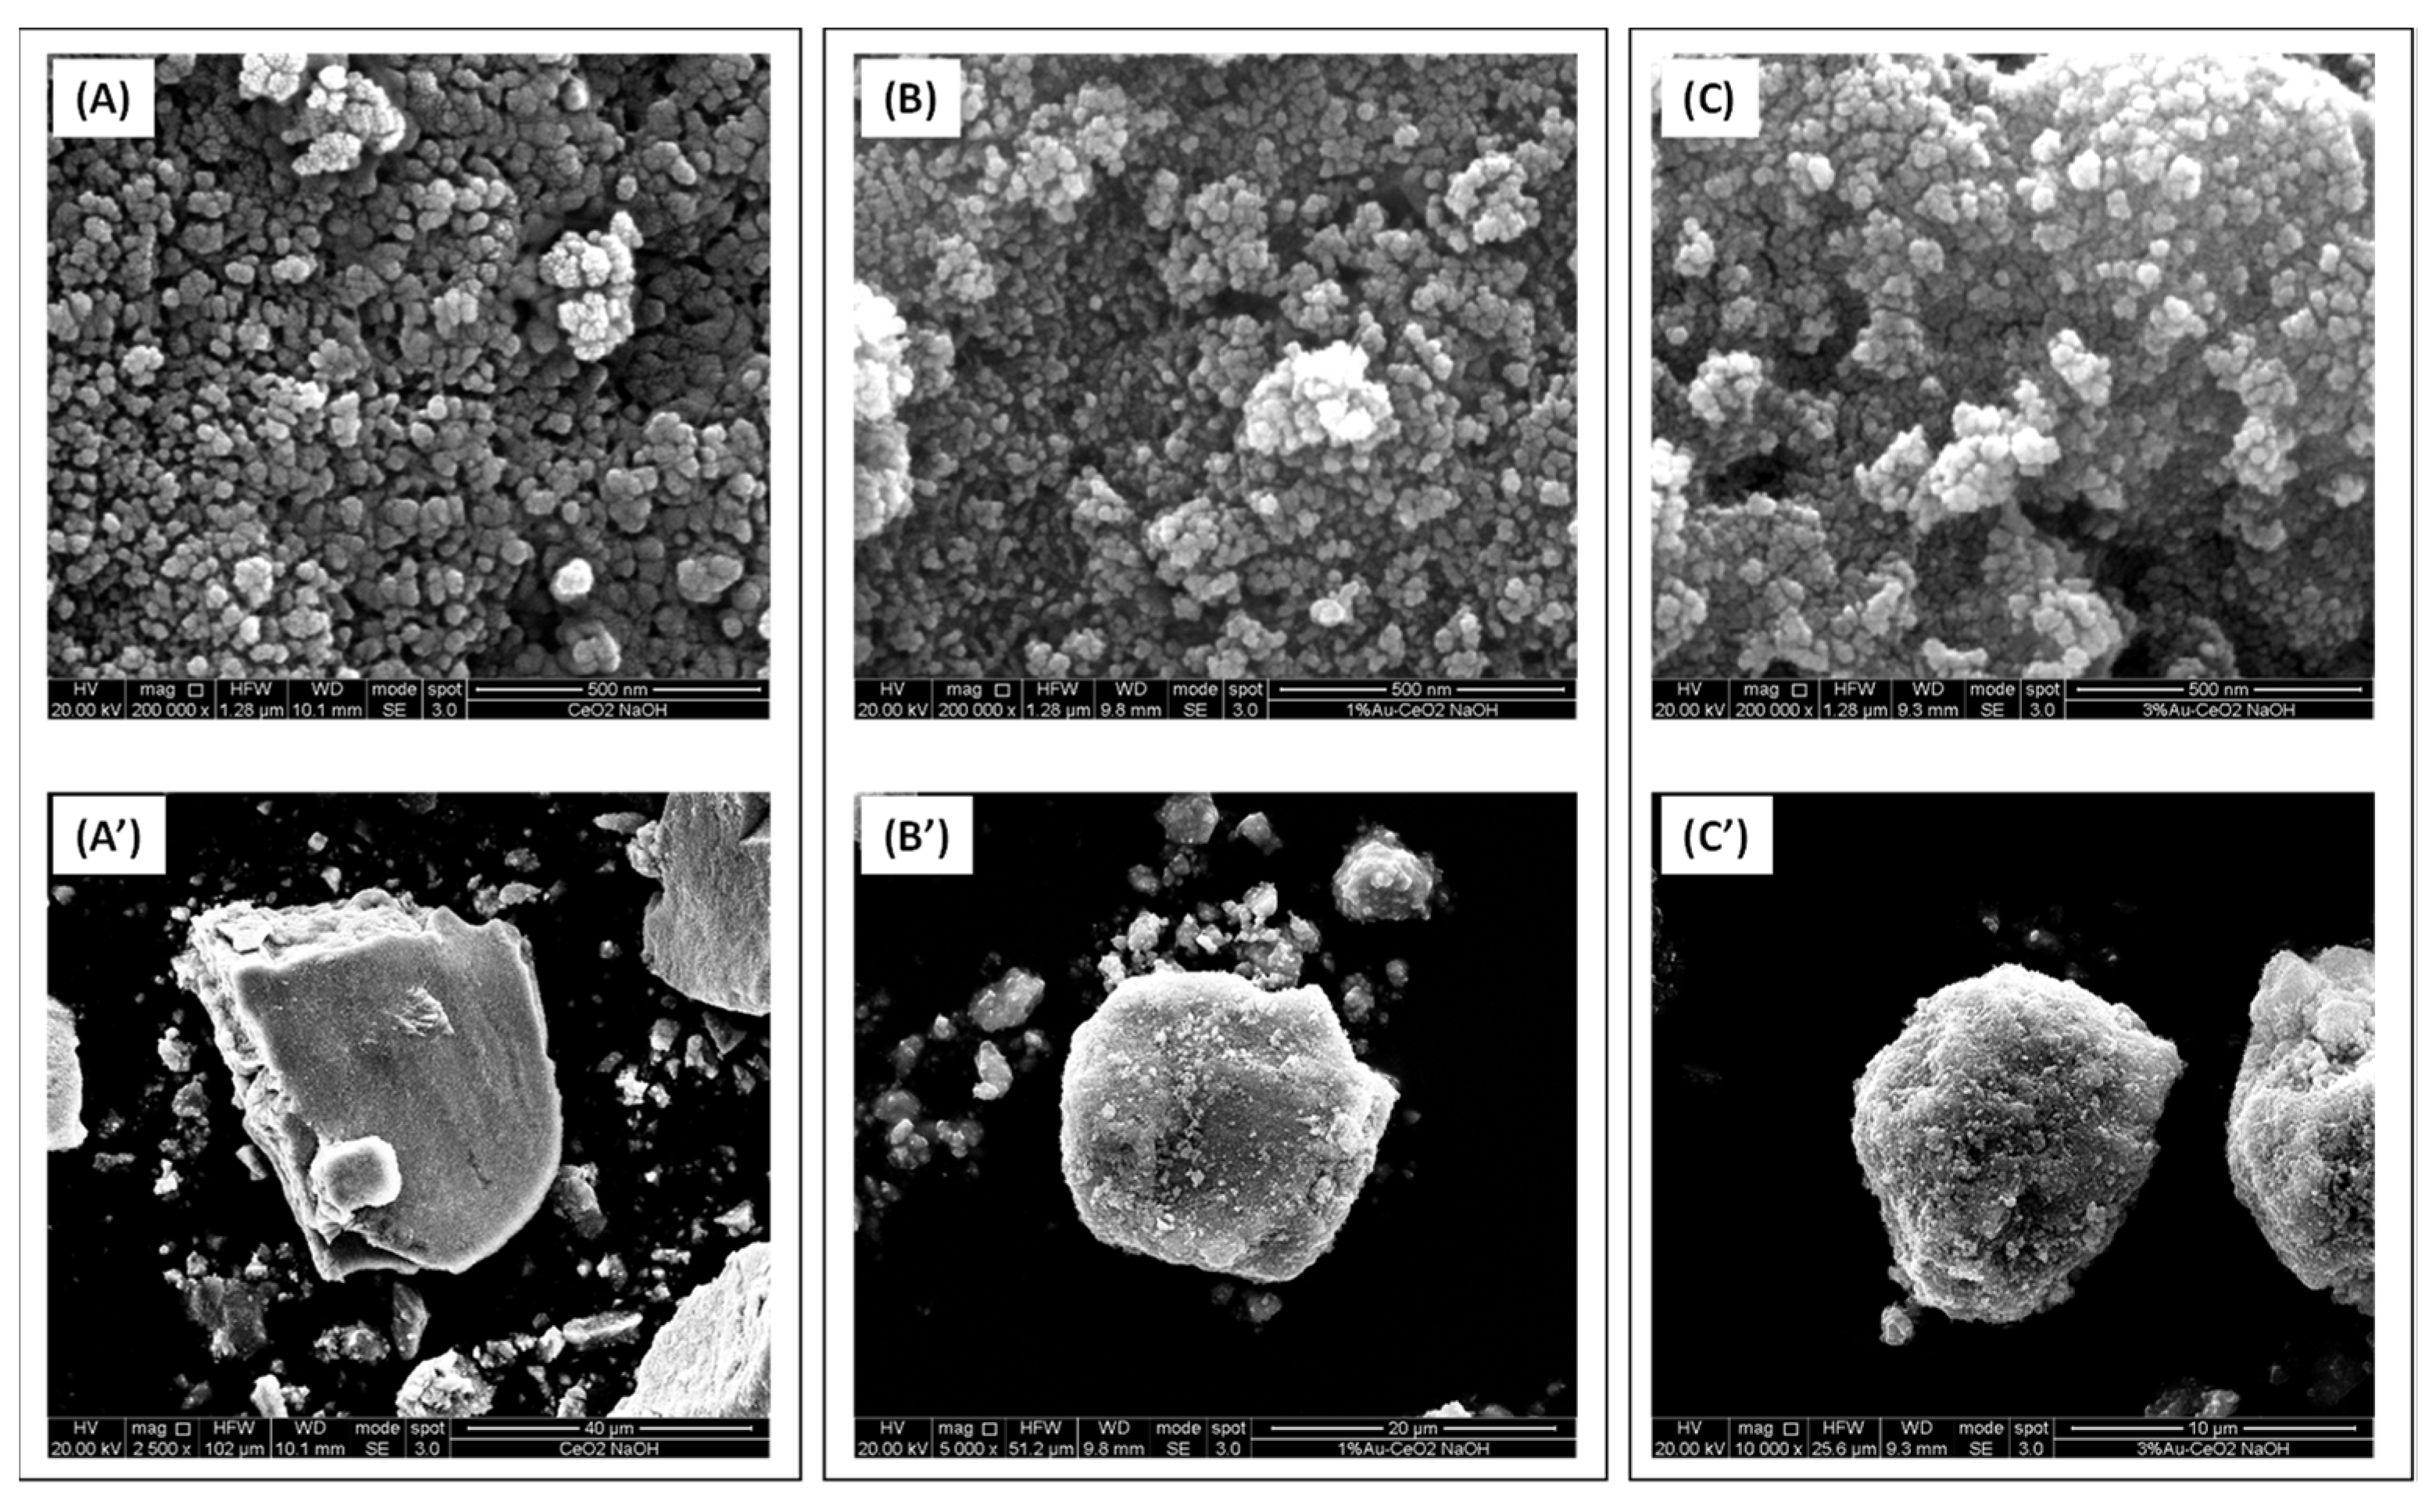
The SEM micrographs shown in
Figure 3 and
Figure 4 are useful to study the morphology of the investigated samples.
Figure 3 reports the micrographs of the samples based on the home prepared CeO
2 material. The CeO
2 hp sample (prepared in the presence of NaOH) consists of aggregates of nanoparticles whose size ranged between ca. 24 and ca. 40 nm. The empty spaces between these particles have roughly the same size of the particles and thus this sample appears to be essentially mesoporous. As far as the commercial CeO
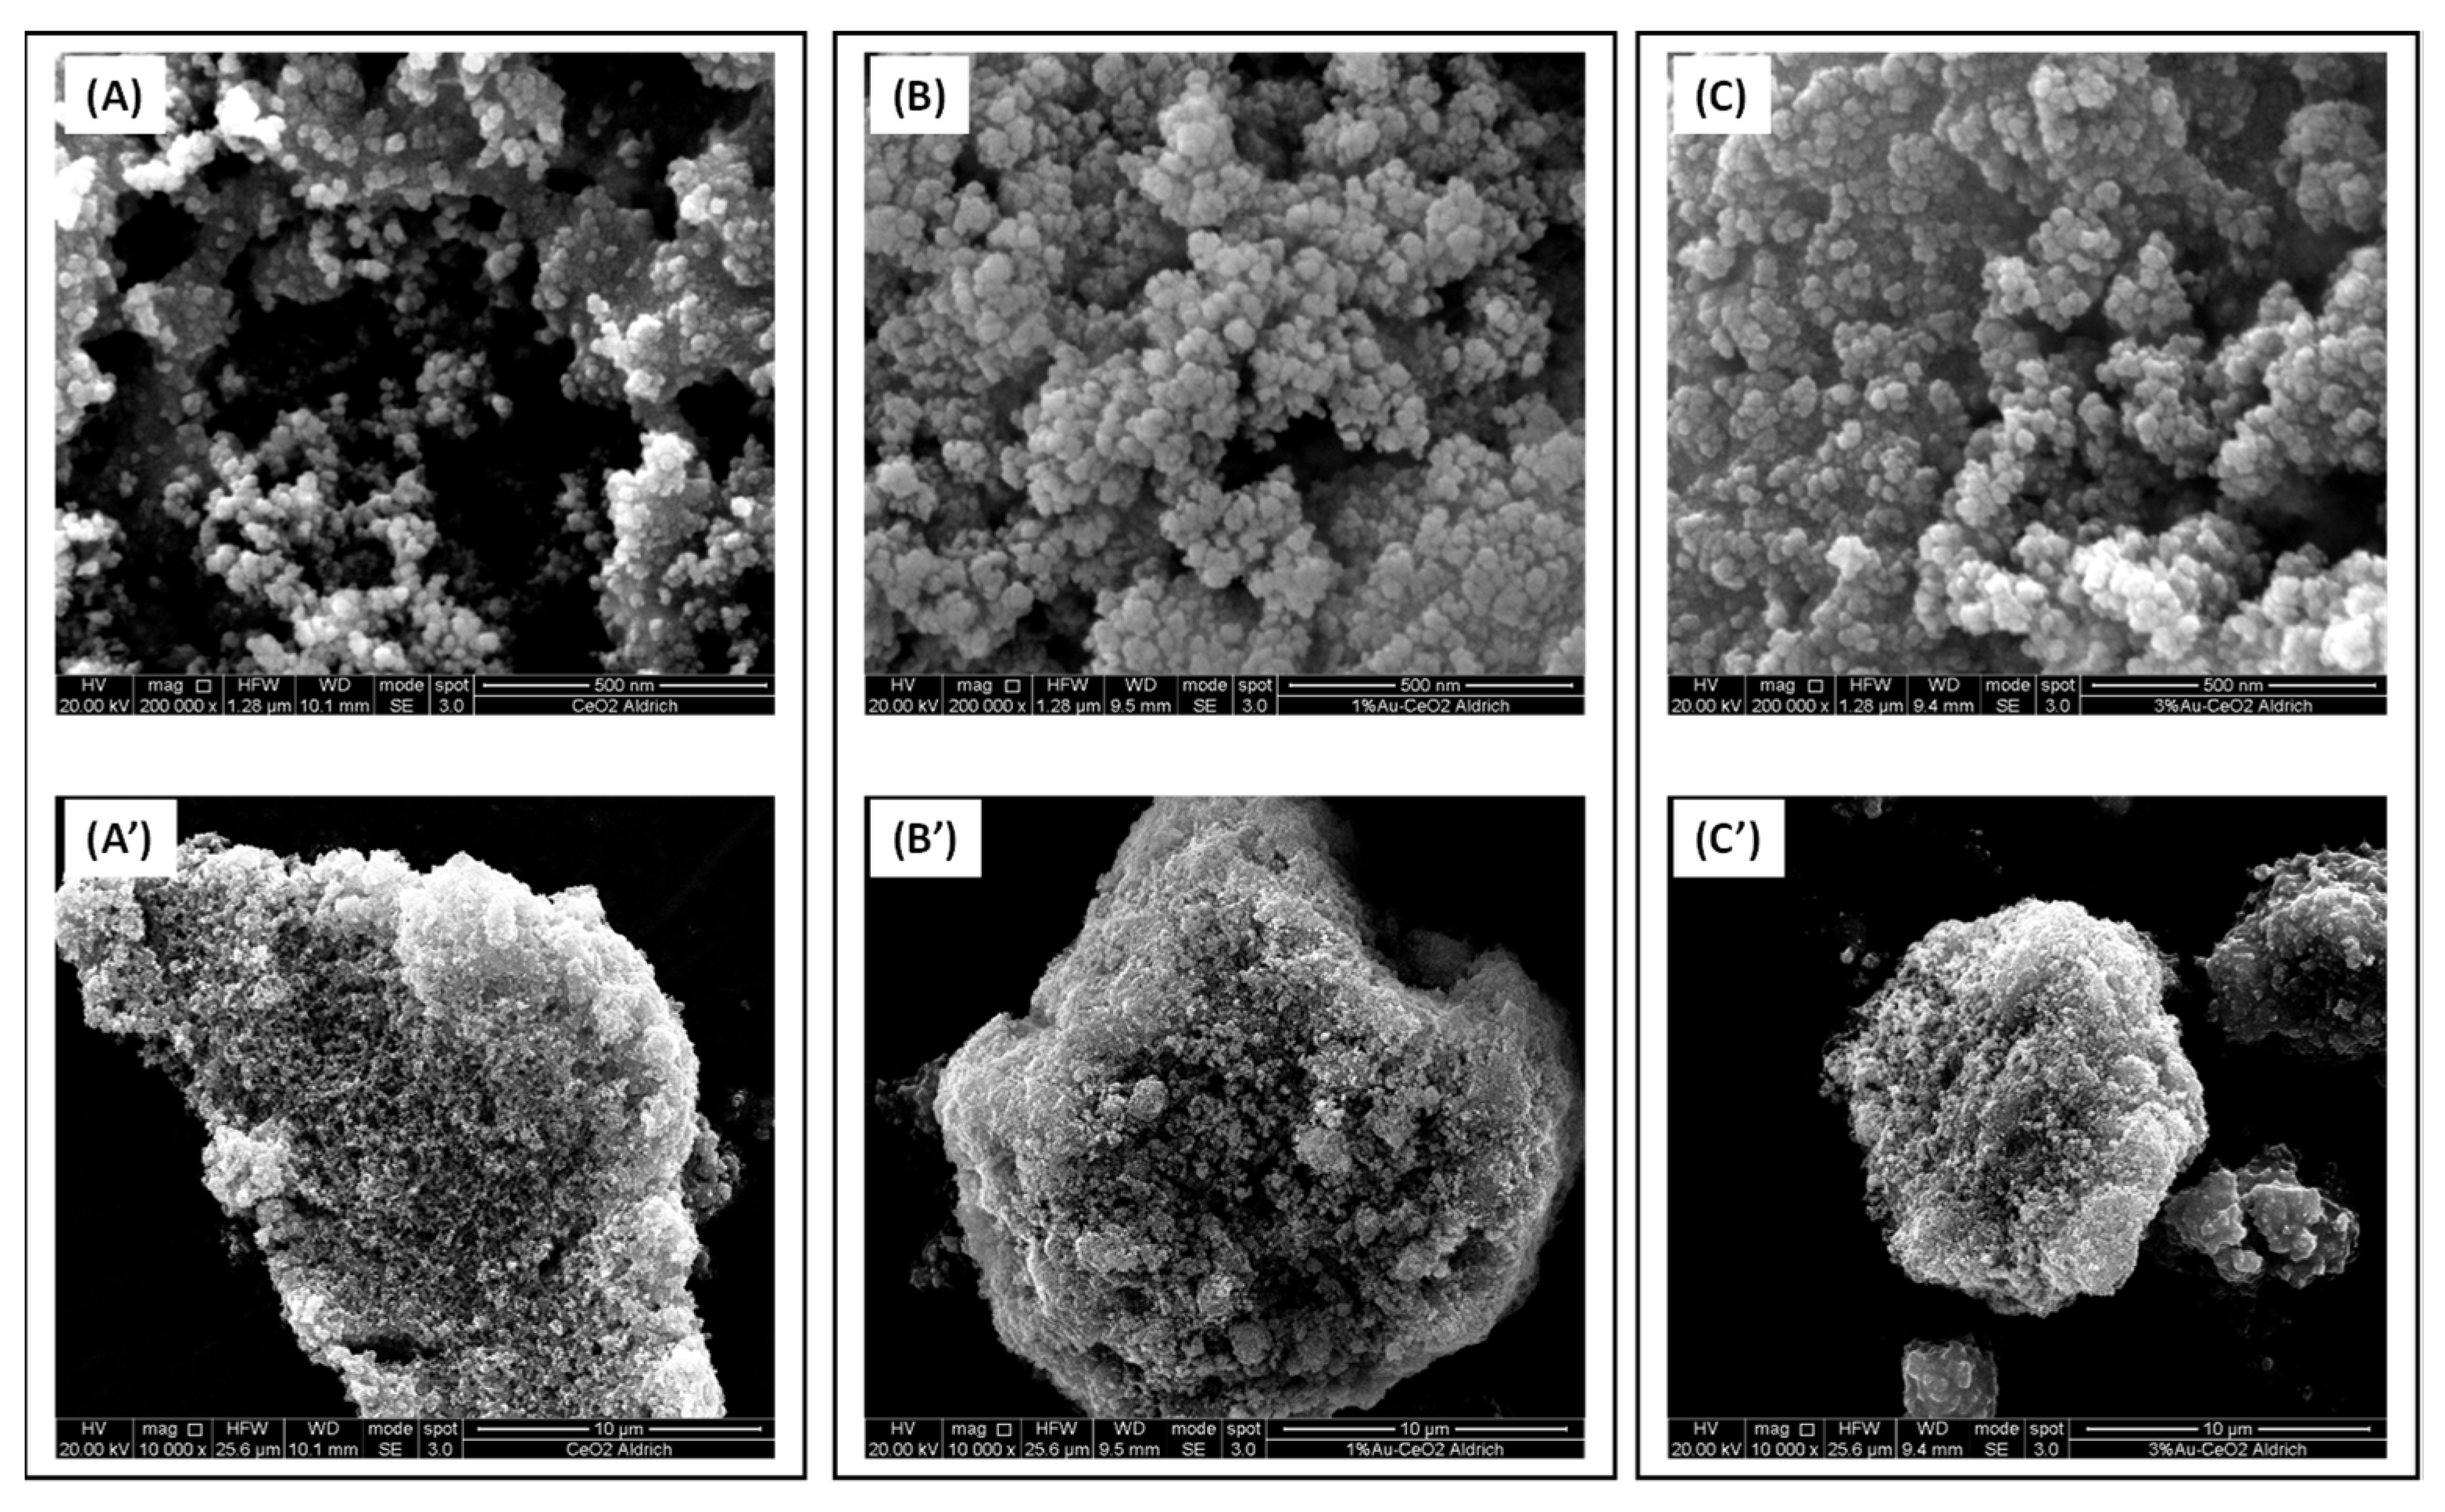
2 A (Aldrich) is concerned, as shown in
Figure 4, it is constituted of aggregates of nanoparticles as well, even if in this case their size is generally smaller (14–25 nm) than those of the CeO
2 hp sample. However, the biggest differences between CeO
2 A and CeO
2 hp sample are observed in the nanoparticles aggregation manner. Indeed, in the CeO
2 A catalyst, in addition to the presence of mesopores, existing in the CeO
2 hp, are also observed macropores. The morphology of the CeO
2 A catalyst looks like that of certain volcanic rocks. For all Au catalysts, the presence of 1% or 3% Au does not modify significantly the morphology of the corresponding ceria supports, in agreement with the so far discussed SSA and porosity values (
Table 1).
As far as the Au content detected by EDX investigation is concerned, it can be noted that the two samples with a nominal content of 1% seem a little richer in the metal. Indeed, for the 1% Au-CeO2 hp and 1% Au-CeO2 A the Au content measured was 1.7% and 1.4%, respectively. On the contrary, in the case of the two catalysts with the higher Au content, the EDX result is practically coincident with the nominal one, 3.2 and 3.1 for the 3% Au-CeO2 hp and 3% Au-CeO2 A samples, respectively. The higher amount of gold detected by EDX for both 1% Au catalysts is in agreement with the higher metal dispersion with respect to the 3% Au samples.
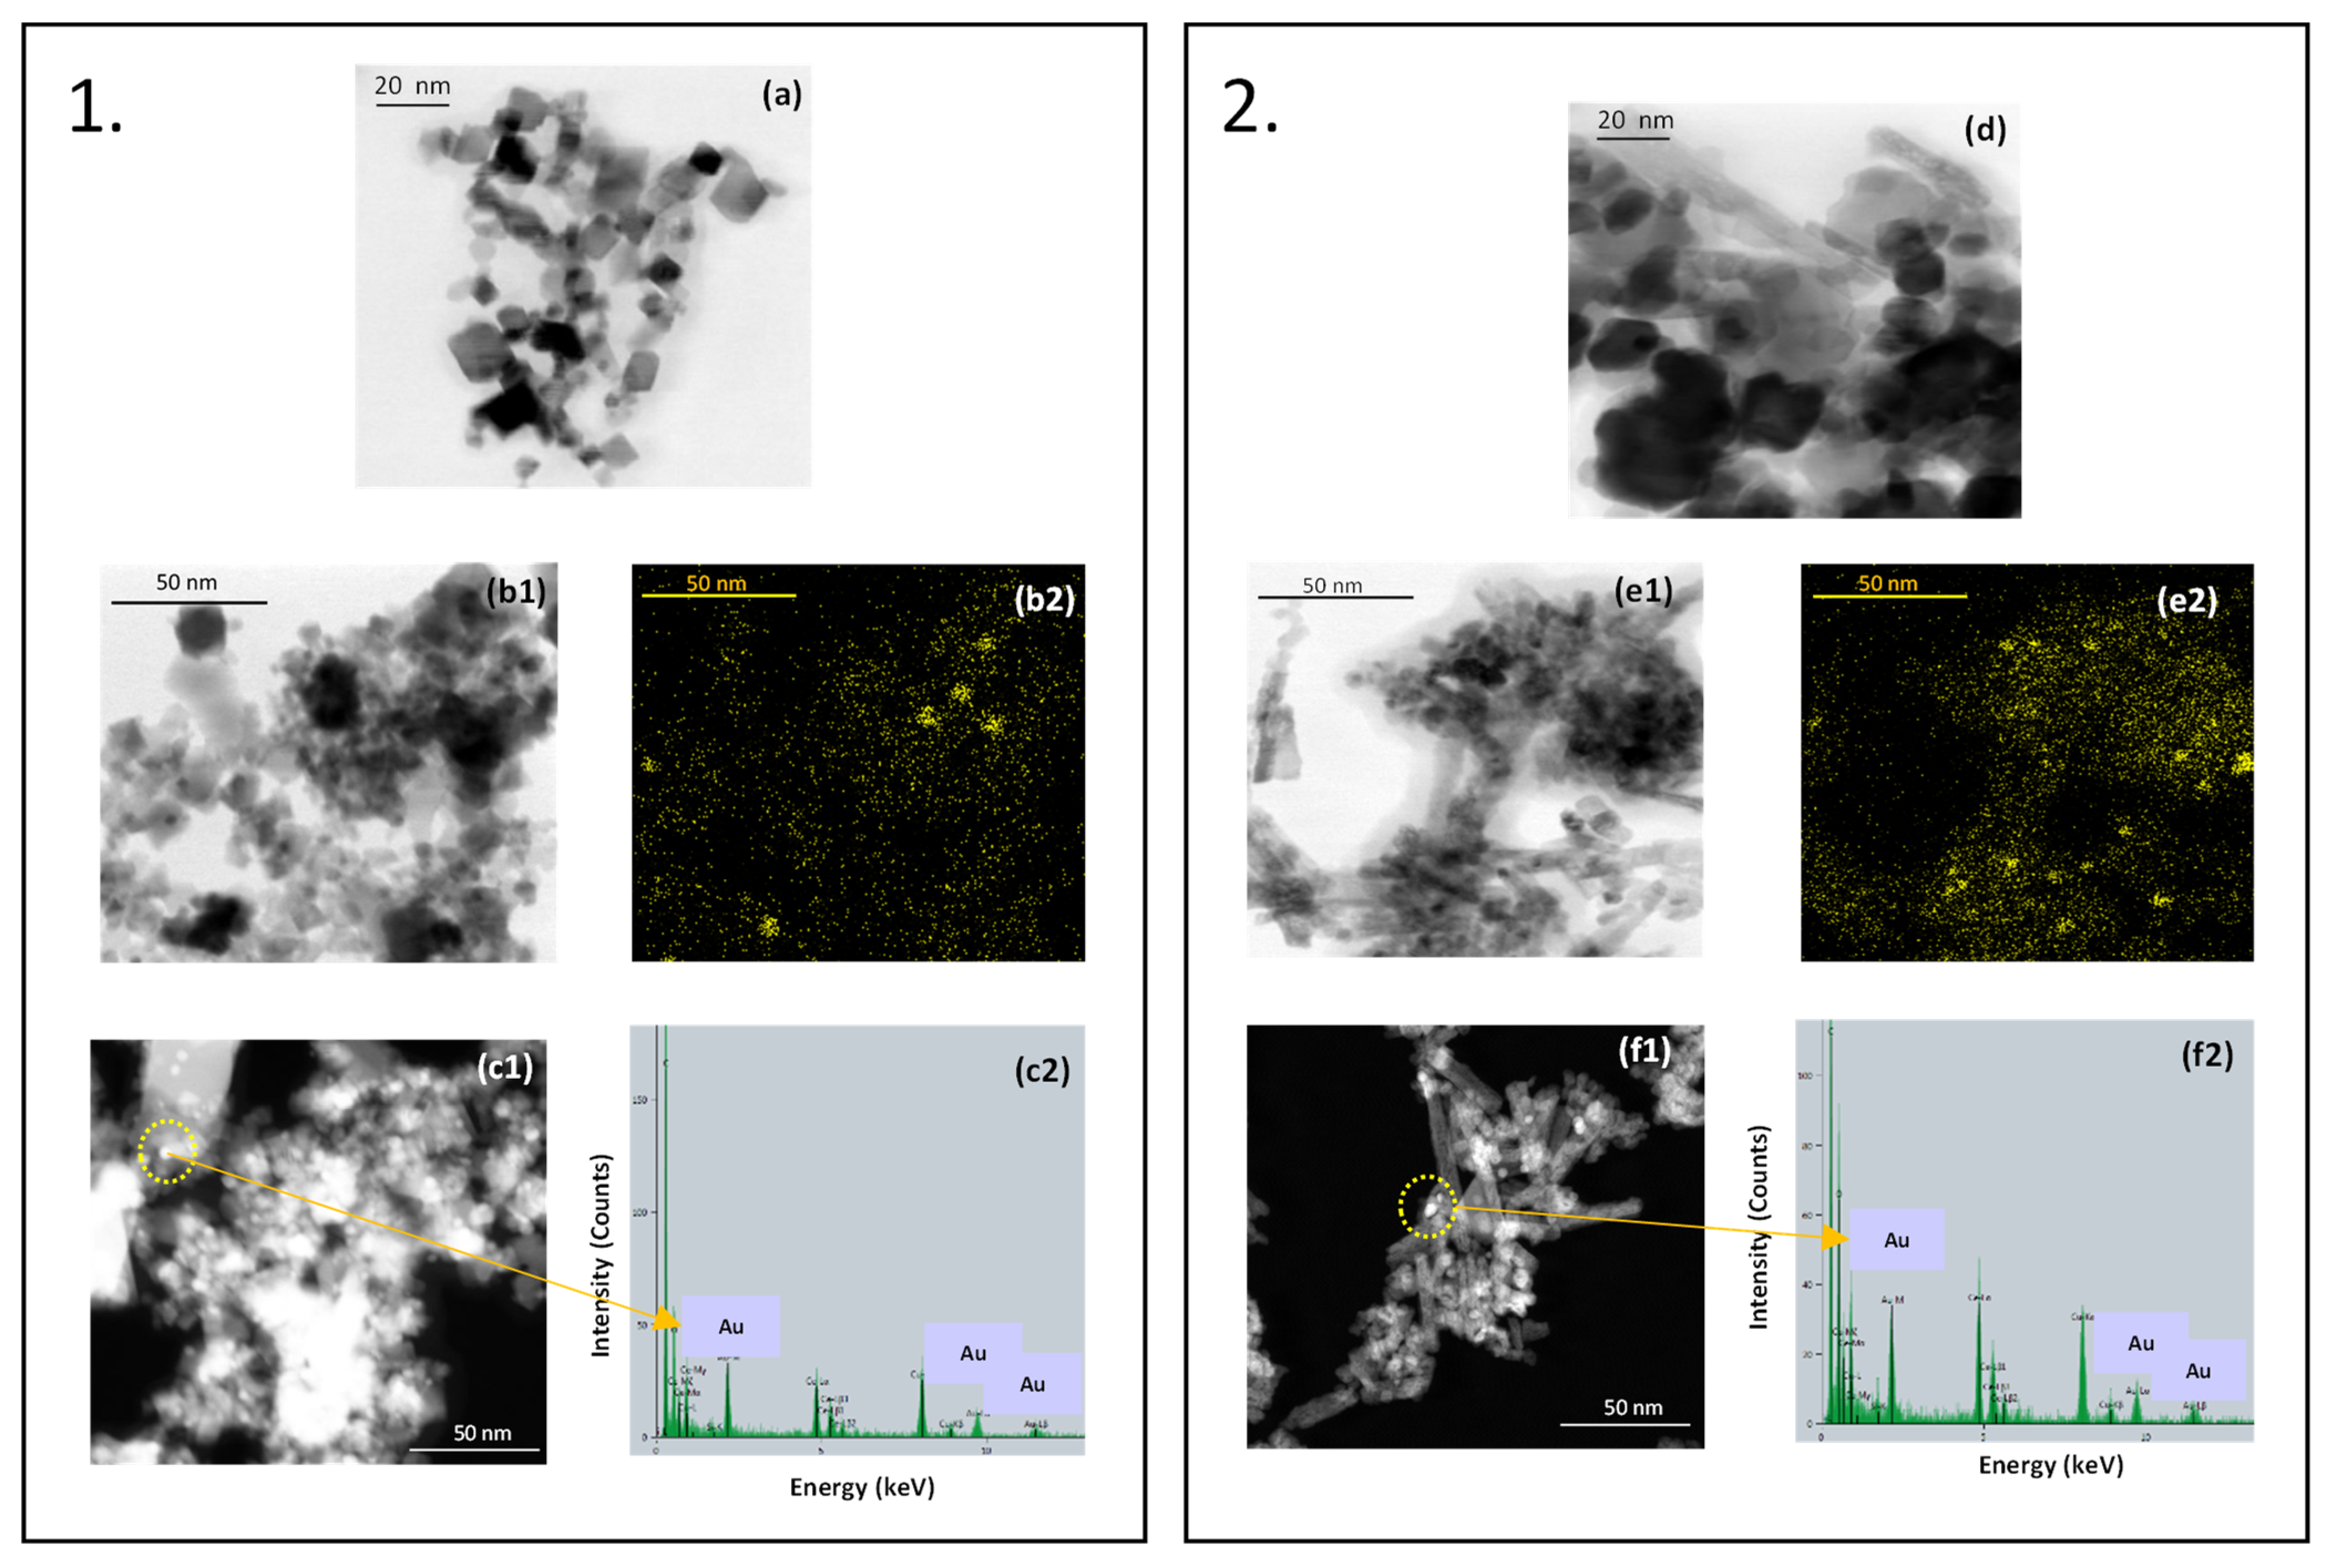
Scanning/transmission electron microscopy was used to get information on the morphology of the samples. The cubic morphology of the bare CeO
2 Aldrich and hp is apparent in the micrographs (a) and (d), respectively, of
Figure 5. While the Aldrich sample appears more homogeneous, some elongated particles can be noted in the hp sample. The presence of gold has been highlighted through EDXS mapping as shown in micrographs (b2) and (e2) for the samples containing 1% gold, and through high-angle annular dark-field (HAADF) detector coupled with EDXS analysis of selected areas for the samples containing 3% gold. Gold is homogeneously distributed throughout the samples and it is present mainly as spherical nanoparticles ranging between 2 and 3 nanometers with some bigger aggregates up to 6 nanometers.
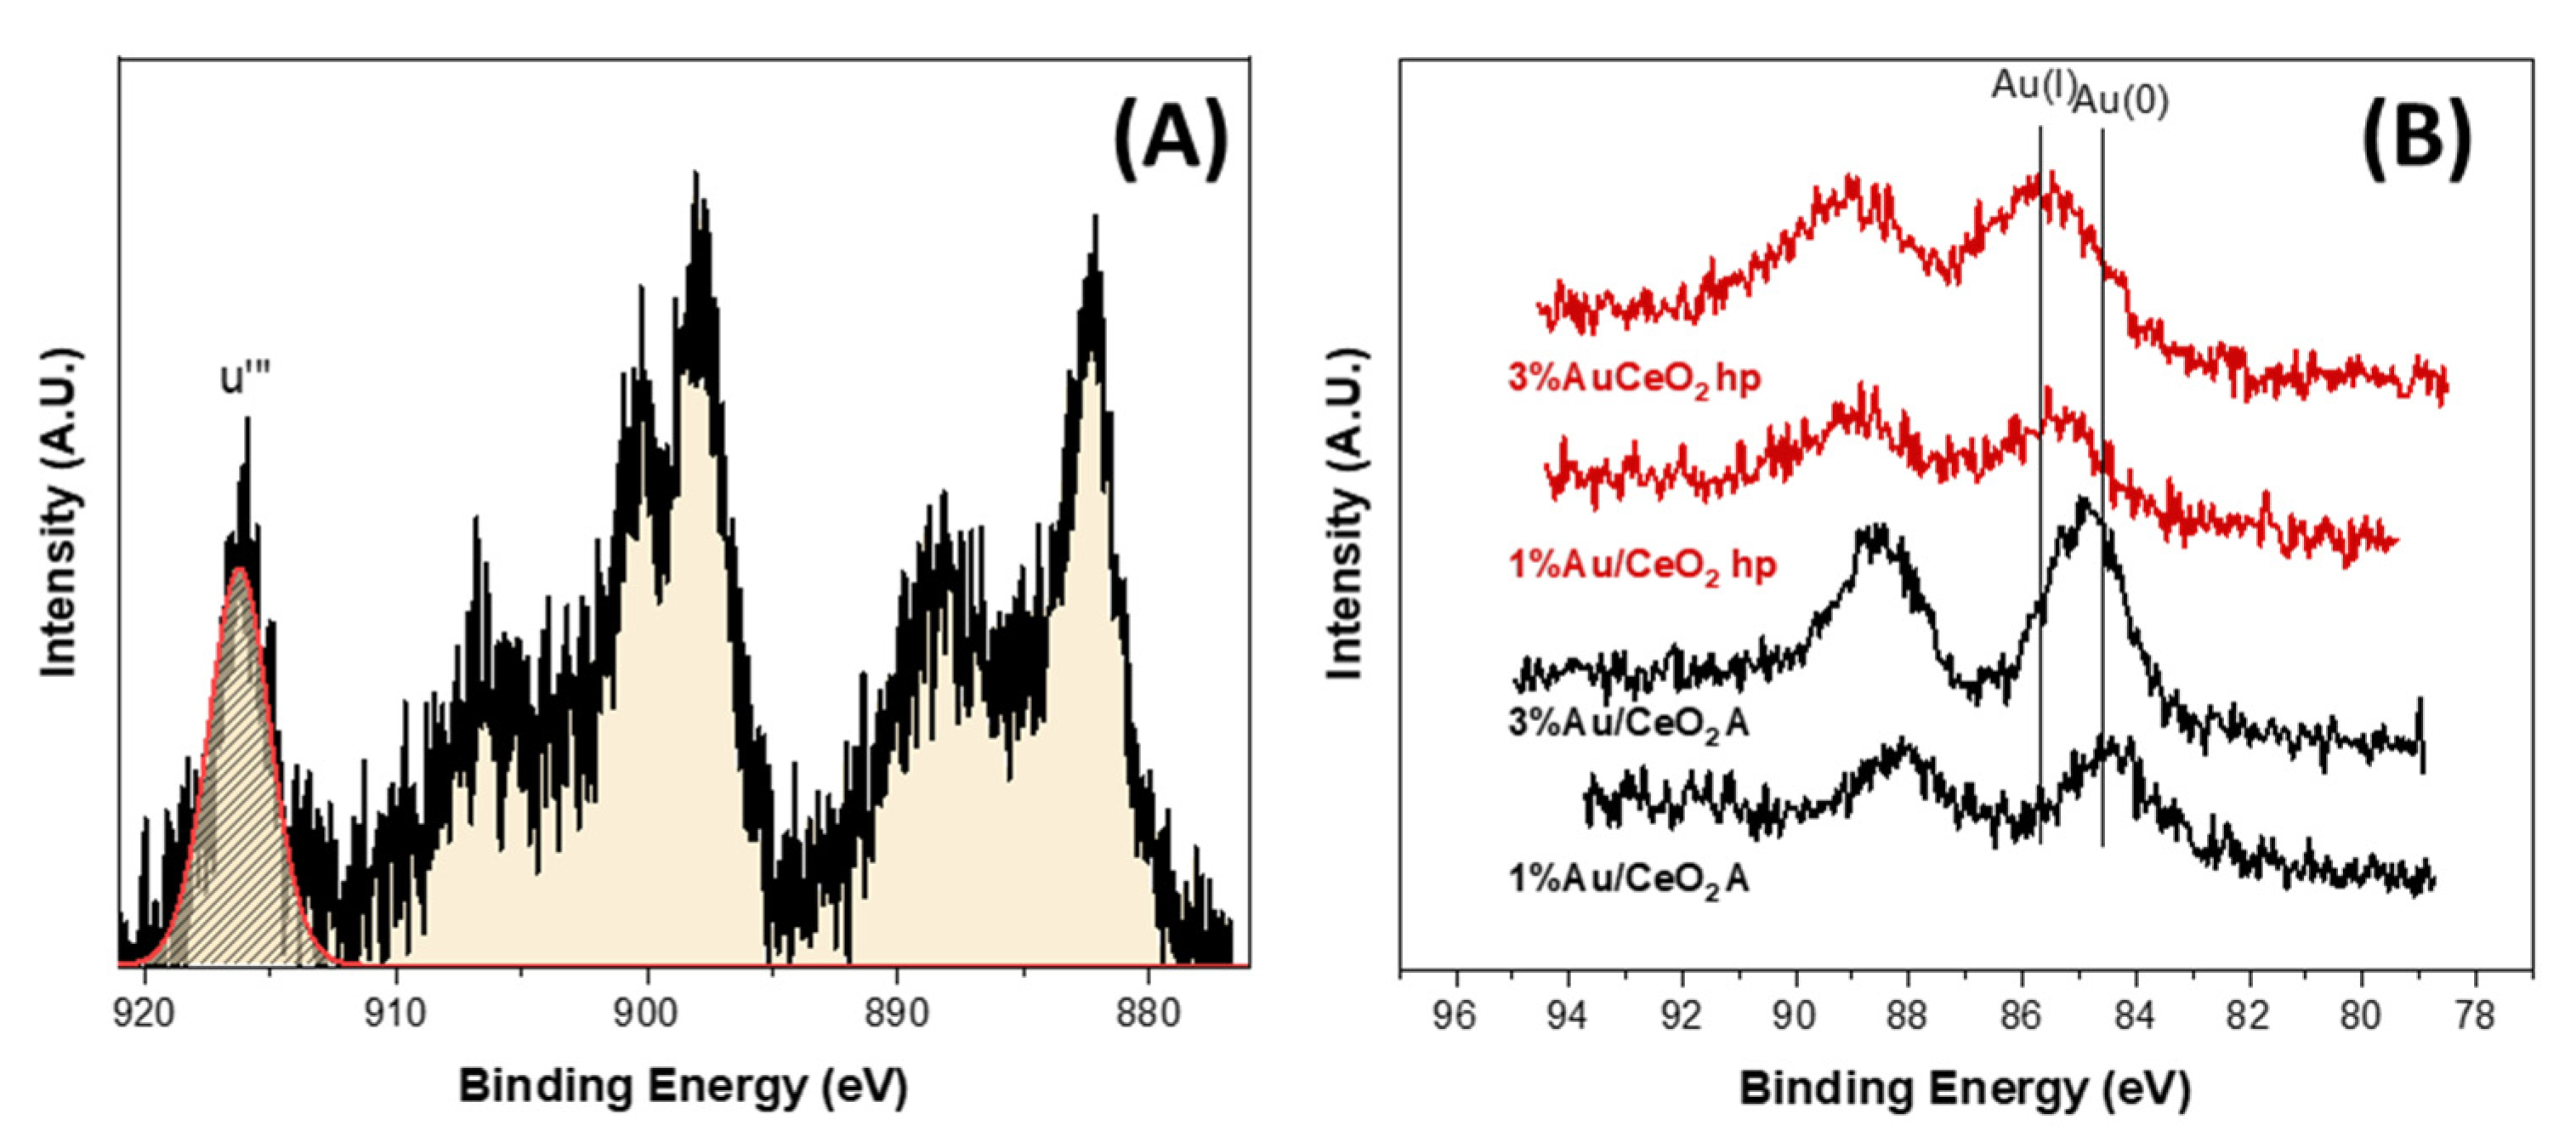
To get deep insight into the chemical composition of the catalysts, the samples were further characterized using XPS. Cerium region is very complex and the determination of the relative percentage of Ce(III) and Ce(IV) is usually done according to the initial classification by Burrough [
20] with ten components (six for the Ce3d5/2–Ce3d3/2 of Ce(IV) and four for Ce3d5/2–Ce3d3/2 of Ce(III)). Anyway, the correct evaluation of the relative percentage of the two different oxidation states, suffer of the complexity of the region. For comparison reasons, it is possible to use the simplification proposed by Henderson [
21]. In agreement with this method, the Ce(IV)% is estimated by calculating the attenuation of the u‴ component at 917 eV with respect to the total area of the Ce3d peak. According to their study in a pure CeO
2 oxide the u‴ component would be 14% of the total Ce3d area. The Ce(III) content in % is then calculated by using Equation (1):
where u‴ is the area fraction of the peak at 917 eV [
22,
23].
Ce (III)–Ce(IV) relative amount was calculated applying this method (see
Figure 6A). Moreover, in order to minimize cerium reduction by the beam, for all samples, Ce region was recorded with a fast modality (3 min each scan). The results obtained are compiled in
Table 2. The samples supported on CeO
2 hp show a higher percentage of Ce(III) with respect to the samples prepared on CeO
2 A. Gold nature is sensitive to the support type. For CeO
2 A both samples show an Au 4f7/2 peak centered at 84.5 ± 0.3 eV typical of metallic gold, while the CeO
2 hp supported series exhibit for both composition the Au 4f7/2 peak centered at 85.4 ± 0.3 eV typical of Au
+1 species [
24]. These results coupled with the increase of Ce(III) in CeO
2 hp supports point out a withdraw of electron from gold to CeO
2 in the hp series. Moreover, for the samples CeO
2 hp the FWHM of gold peak is quite high indicating the presence of several slightly different chemical environments for gold. For both series, the increase of the amount of gold caused a decrease of cerium reduction probably due to the formation of bigger particles, as seen by XRD, which lessen the influence of gold on ceria.
Table 2 reports the XPS-derived Au/Ce atomic ratio along with the above commented EDX atomic ratio. As expected by the surface nature of XPS technique, the XPS-derived ratio are higher than the EDX derived ratio by a factor of ca. 3 for all samples except than 3%Au/CeO
2 A where the Au/Ce by XPS is 5.6 higher than the one by EDX. This fact is probably due to the smaller pore diameter of CeO
2 A. which causes a minor diffusion of gold precursors inside the pores with a more pronounced surface deposition emphasized by XPS analysis. On the other hand, it is likely that Au
+1 species tend to diffuse into the bulk of CeO
2 hp oxides being less detectable on the surface.
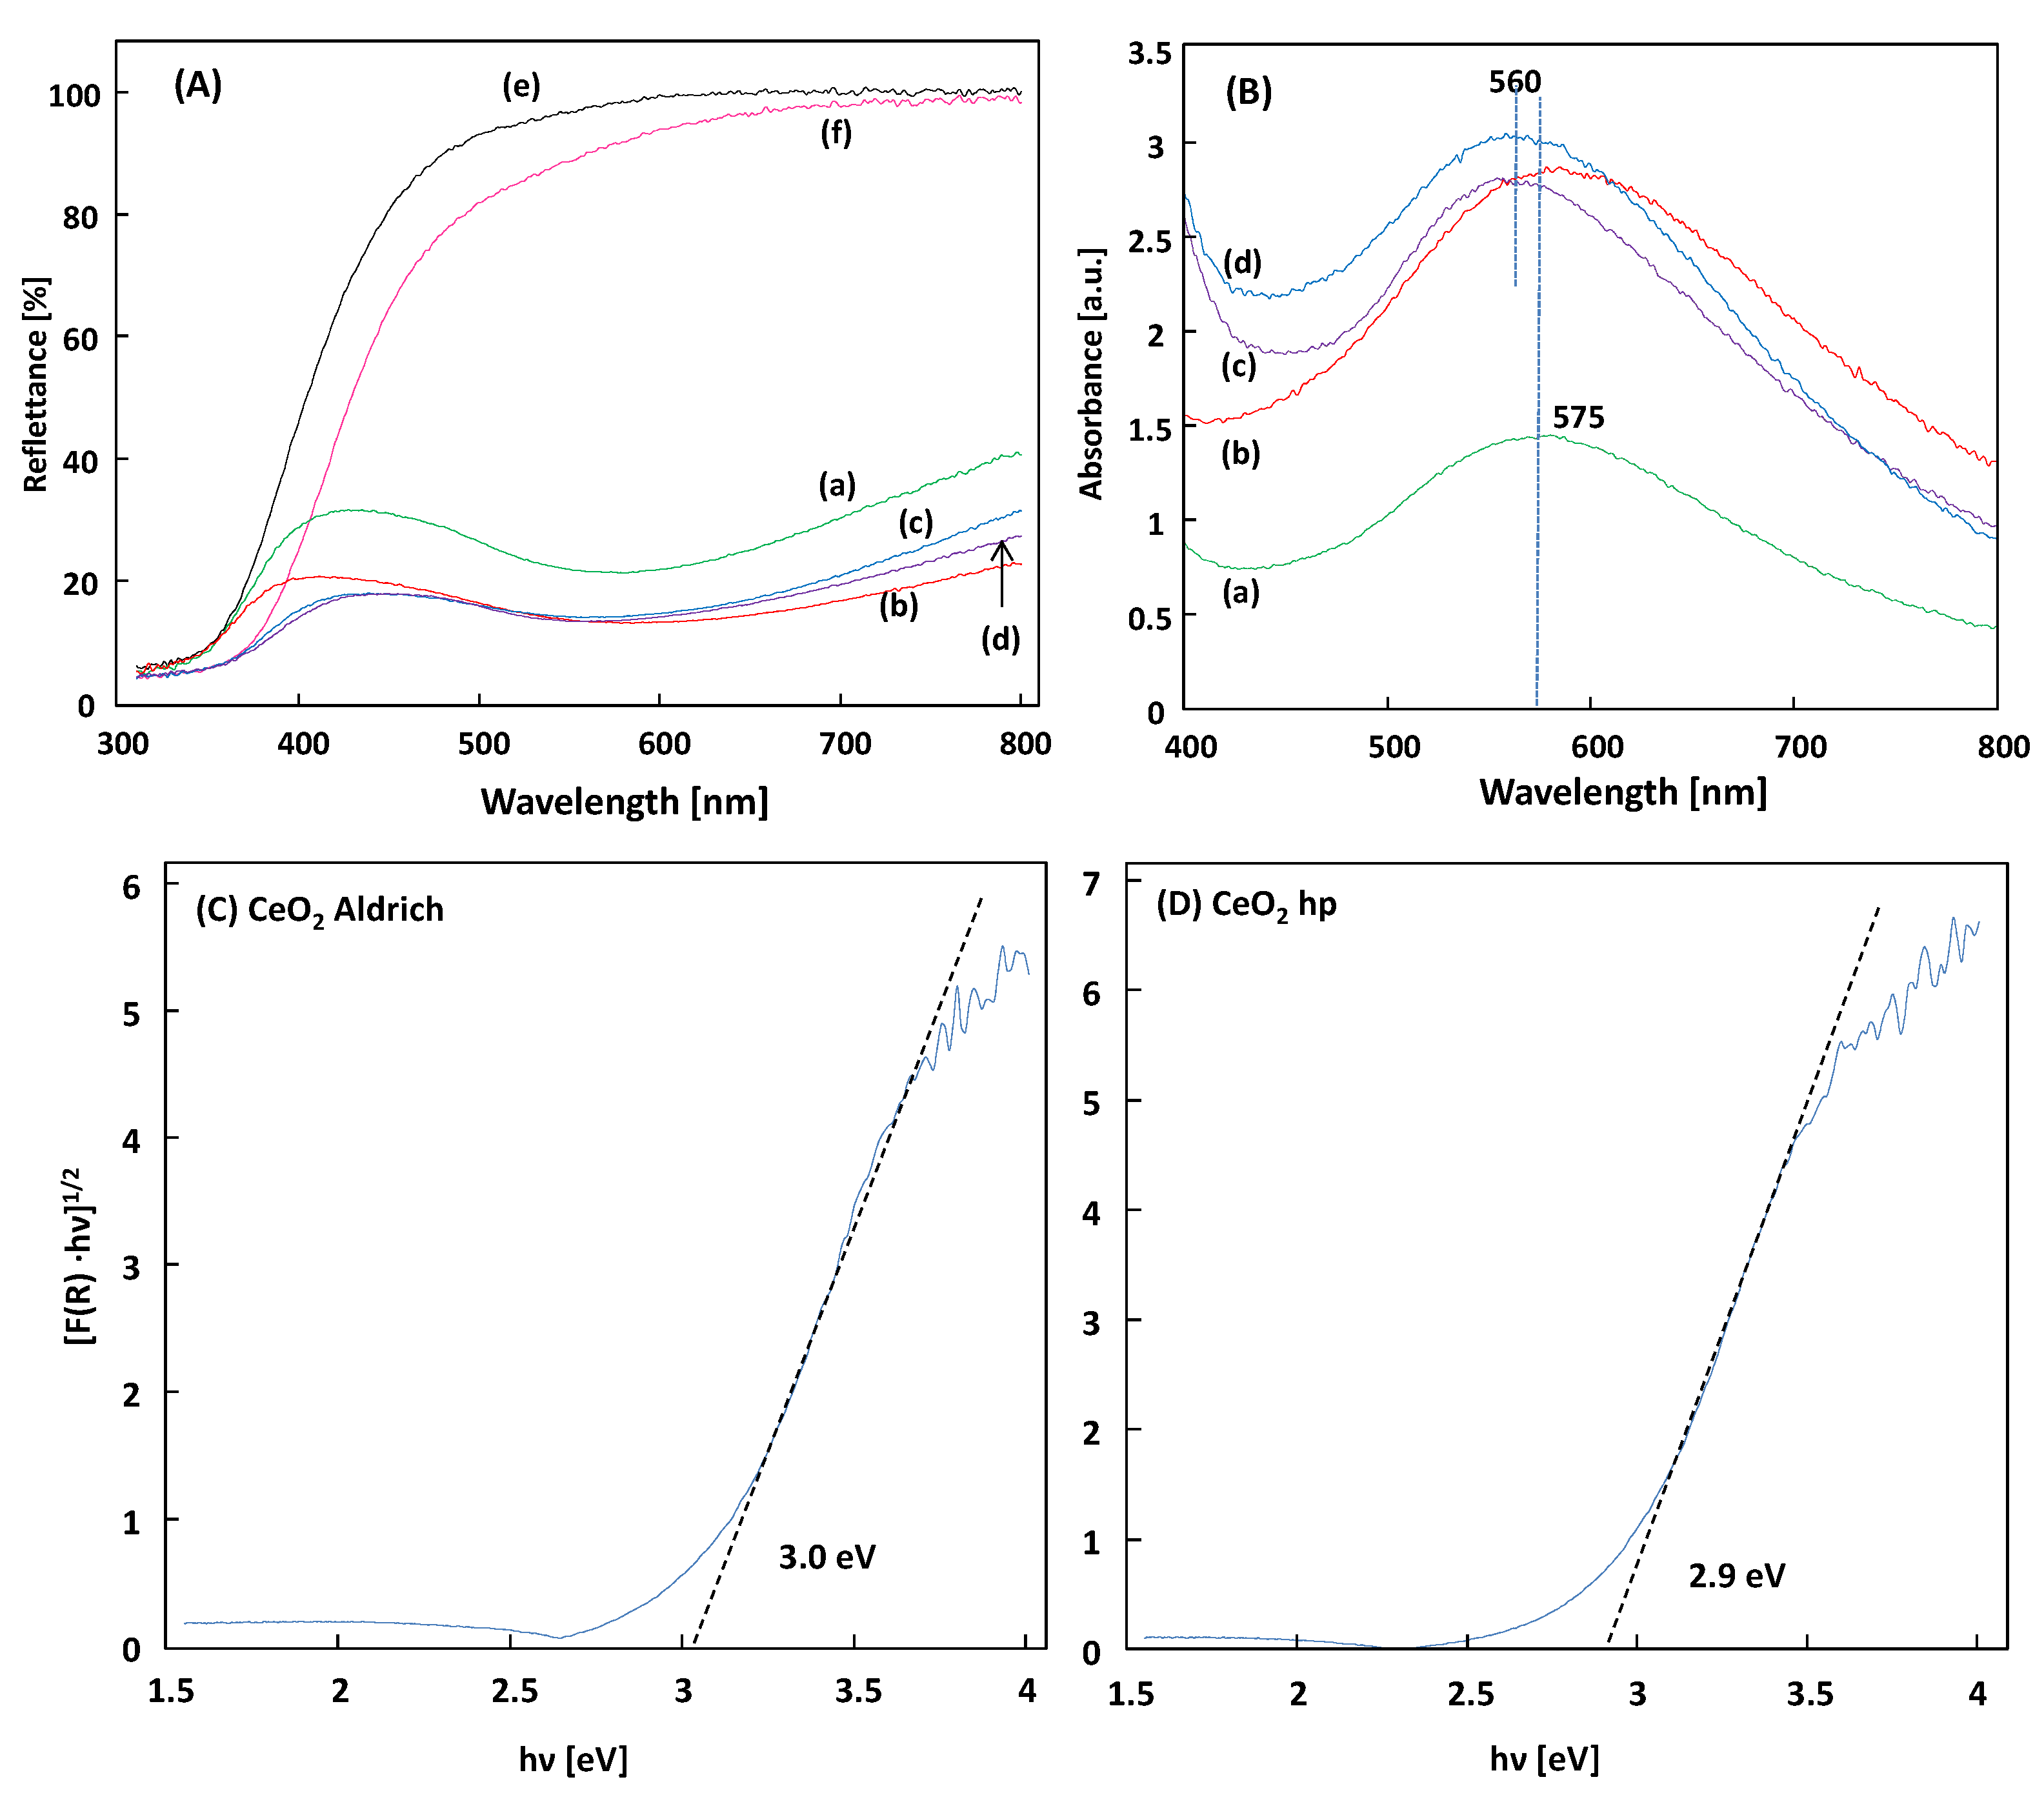
Diffuse reflectance spectroscopy (DRS) has been employed to study the optical properties of the samples.
Figure 7 shows the DRS of the CeO
2 and Au/CeO
2, along with their absorption of UV light. The DRS of the CeO
2 and Au/CeO
2 samples, depicted in
Figure 7A evidenced that both CeO
2 showed only one absorption edge around 400 nm corresponding to the band gap energy of the semiconductor, whereas for the Au supported materials, the visible light absorbance was evident, as revealed in
Figure 7B corresponding to the Kubelka-Munk function F(R
∞) of the diffuse reflectance spectra, which can be assumed as the absorption of the samples. The plasmonic absorption band of the Au is observed at 575 and 560 nm for the Au/CeO
2 A and Au/CeO
2 hp samples, respectively. The SPR absorption becomes more intensive as the Au loading increases from 1% to 3 wt.%. The increased visible light absorption from Au SPR should help enhance the harvesting of solar energy and promote related photocatalytic processes.
Ke et al. supported Au nanoparticles on different oxides, including CeO
2 and TiO
2, among others, to test these photocatalysts under visible light for the reduction of ketones to alcohols. They reported the DRS spectra of the powders and comparing Au/CeO
2 with Au/TiO
2, the LSPR band of Au/CeO
2 resulted red shifted and a more intense peak was recorded for the one of Au/TiO
2. They suggested a stronger LSPR effect of Au/CeO
2, explaining the stronger absorption light of Au/CeO
2 by a possible strong interface action between Au nanoparticles CeO
2 that those existing in the Au/TiO
2 powder [
25]. The red-shift of the LSPR band for the present samples, with respect to those observed by Ke (ca. 520 nm), could indicate a strong interaction with the CeO
2 support, particularly in the case of the CeO
2 A samples.
To determine the optical band gap energy of the materials, the Kubelka-Munk function F(R
∞) of the diffuse reflectance spectra has been used and the band gap value was estimated by extrapolating a linear fitting in the Tauc plot [
26] (i.e., the plot of (F(R
∞)·hν)
1/2 vs. the incident light energy in eV) by considering the CeO
2 as an indirect semiconductor, as shown in
Figure 7C,D. The presence of Au on the surface of CeO
2 does not change the E
gap nevertheless it affords absorbance in the visible region, so that both UV and visible radiation can contribute to the photoactivity of the powders [
27]. In addition, the photoactivity can increase via the delay of the recombination rate of photogenerated electron and hole pairs [
28].
2.2. Photocatalytic Activity under UV or under Visible Light Irradiation
All the Au/CeO
2 powders showed to be photoactive under UV and, as well, under Vis light irradiation for the photocatalytic partial oxidation of both alcohols. The results obtained for the selective oxidation of benzyl alcohol (BA) and 4-methoxy benzyl alcohol (4-MBA) in water, in terms of alcohol conversion and selectivity to the corresponding aldehyde after 4 h of reaction, are reported in
Table 3.
The perusal of
Table 3 shows that by irradiating the system containing a benzyl alcohol suspension with both UV or visible light, the CeO
2 pristine powders resulted completely inactive, whereas a modest conversion of BA was observed in the presence of Au-loaded CeO
2 samples showing a selectivity to benzaldehyde of 100%. As a general consideration, the conversion values were, for any photocatalyst, nearly the same by irradiating with UV light or under visible irradiation, albeit for the latter the presence of Au seemed to be slightly beneficial.
The conversion of 4-MBA was much higher than that obtained for BA and the selectivity to 4-MBAL was remarkable only in the case of the samples loaded with Au. Under UV irradiation, both CeO
2 pristine powders gave rise to a certain conversion, slightly higher for the commercial powder, as reported in
Table 3. Interestingly, only the CeO
2 A sample gave rise also conversion of 4-MBA under visible light irradiation. The Au/CeO
2 samples lead to a higher conversion of the alcohol than the pristine CeO
2, and the conversion increased by increasing the Au amount. The Au supported samples resulted particularly active by using the CeO
2 A as support. These samples showed higher conversion of 4-MBA under visible irradiation than under UV light. The most active sample in terms of conversion resulted to be the 3%Au/CeO
2 A, particularly under visible light. Selectivity to 4-MBAL under UV irradiation resulted 25% and 18% for the pristine CeO
2 A and hp, respectively. The presence of Au on both of the supports increased not only the conversion but also the selectivity to the aldehyde and in general the activity increased by increasing the Au content. The most active sample in terms of conversion and selectivity resulted the 3%Au/CeO
2 A, followed by the 3%Au/CeO
2 hp. These insights evidence that the photocatalysts based on the CeO
2 hp are in general less oxidant than the analogous based on the commercial CeO
2 A. This behavior is the same than that observed for the BA partial oxidation, albeit BA resulted by far more difficult to be oxidized than 4-MBA. The Au-loaded CeO
2 materials can be used under visible light irradiation for 4-MBA partial oxidation quite successfully. Furthermore, these materials seem more effective under visible light irradiation with respect to UV light.
The mechanism of the photo-oxidation in the presence of Au nanoparticles is distinctly different from that of the semiconductor photocatalysts. Indeed, in a photocatalytic process when a semiconductor is irradiated by suitable radiation, electrons are promoted from the valence band to the conduction band. Consequently, the generated electron/hole couples are responsible of oxidation and reduction processes. The photogenerated electrons reduce the adsorbed oxygen (O
2), if the process is carried out in air, to form superoxide radicals (O
2−•) and the photogenerated holes react with H
2O to form hydroxyl radicals (OH
•), generally responsible for the oxidation of substrates resulting in their mineralization and/or partial oxidation. On the contrary, irradiated Au-NPs are able to absorb visible light due to the surface plasmon resonance effect. This effect is due to the joint oscillation of conduction electrons in the gold NPs which, resonating with the electromagnetic field of the incident light, give rise to a significant enhancement of the local electromagnetic fields near the surfaces of the Au-NPs. Consequently, the conducting electrons on the NP surfaces increase their energy content and they can interact with the O
2 molecules adsorbed on the surface of Au-NP or even on the support surface to form superoxide radicals (O
2−•). Furthermore, the excited electrons may relax back to their equilibrium states and release heat to the Au-NP lattice, resulting in a rapid and localized heating of the Au-NPs [
25]. Such two effects can induce together chemical reactions of adsorbed molecules both on the Au-NPs and on the support. Furthermore, the localized heating of the Au-NPs can favorite the desorption of the reaction intermediate. In the case of the reactions reported in this study, the desorption of the formed aldehydes is of paramountcy importance to avoid their successive oxidation to benzoic acids that are responsible for the blockage and consequently the inactivation of the catalytic sites [
29].
To explain the higher conversion of 4-MBA with respect to BA by using the same photocatalyst and experimental conditions, it is necessary to remind that the aromatic alcohols with electron donating substituent groups (EDG), as -O-CH
3 in different positions, show different photocatalytic activity and selectivity, in the presence of TiO
2 [
30], but also by using C
3N
4 based photocatalysts [
31,
32]. Indeed, it is already known that the conversion of aromatic alcohols depends on the type and position of the substituent in the aromatic ring. In particular, the methoxy group in para position of the benzyl alcohol, increased both conversion and selectivity to the aldehyde. This because, the methoxy group, as Electron Donating Group (EDG), is an ortho-para orienting group, and its presence in the para position induces the attack by oxidant species to the benzyl group, thus favoring the alcohol-to-aldehyde transformation. The result obtained by using TiO
2 and C
3N
4 as photocatalysts under UV was also observed during the present investigation in the presence of CeO
2 and Au/CeO
2 photocatalysts both under UV and visible irradiation. The adsorption of 4-MBA by means of the alcoholic group on the surface of the photocatalyst and the inductive and delocalization effects caused by the –OCH
3 group on the aromatic ring, hinder the strong oxidizing attacks that can cause the mineralization of the molecule [
31].
The photocatalytic alcohol degradation rate obtained by using all the samples are reported in
Table 4. The results are in agreement with the conversion data reported in
Table 3.
Bare CeO
2 does not produce any oxidation of BA, whereas 4-MBA was partially oxidized, faster in the presence of CeO
2 A than with CeO
2 hp. Notably, despite the band gap values of the CeO
2 samples, ca. 2.9 and 3.0 eV (see
Figure 7) for the home prepared and Aldrich, respectively, the presence of the Au allowed the reaction to proceed with higher rates under visible irradiation than under UV one. This result is attributed to the surface plasmon resonance effect. The faster reaction was observed in the presence of 3%Au/CeO
2 A.
The reaction proceeds under both UV and visible light irradiation, by the two distinct mechanisms already discussed above. For that reason, the best photocatalysts (i.e., those containing 3% of Au) were tested for the 4-MBA partial oxidation also under natural solar irradiation supplying contemporaneously both UV and visible light.
2.3. Photocatalytic Activity under Natural Solar Light Irradiation
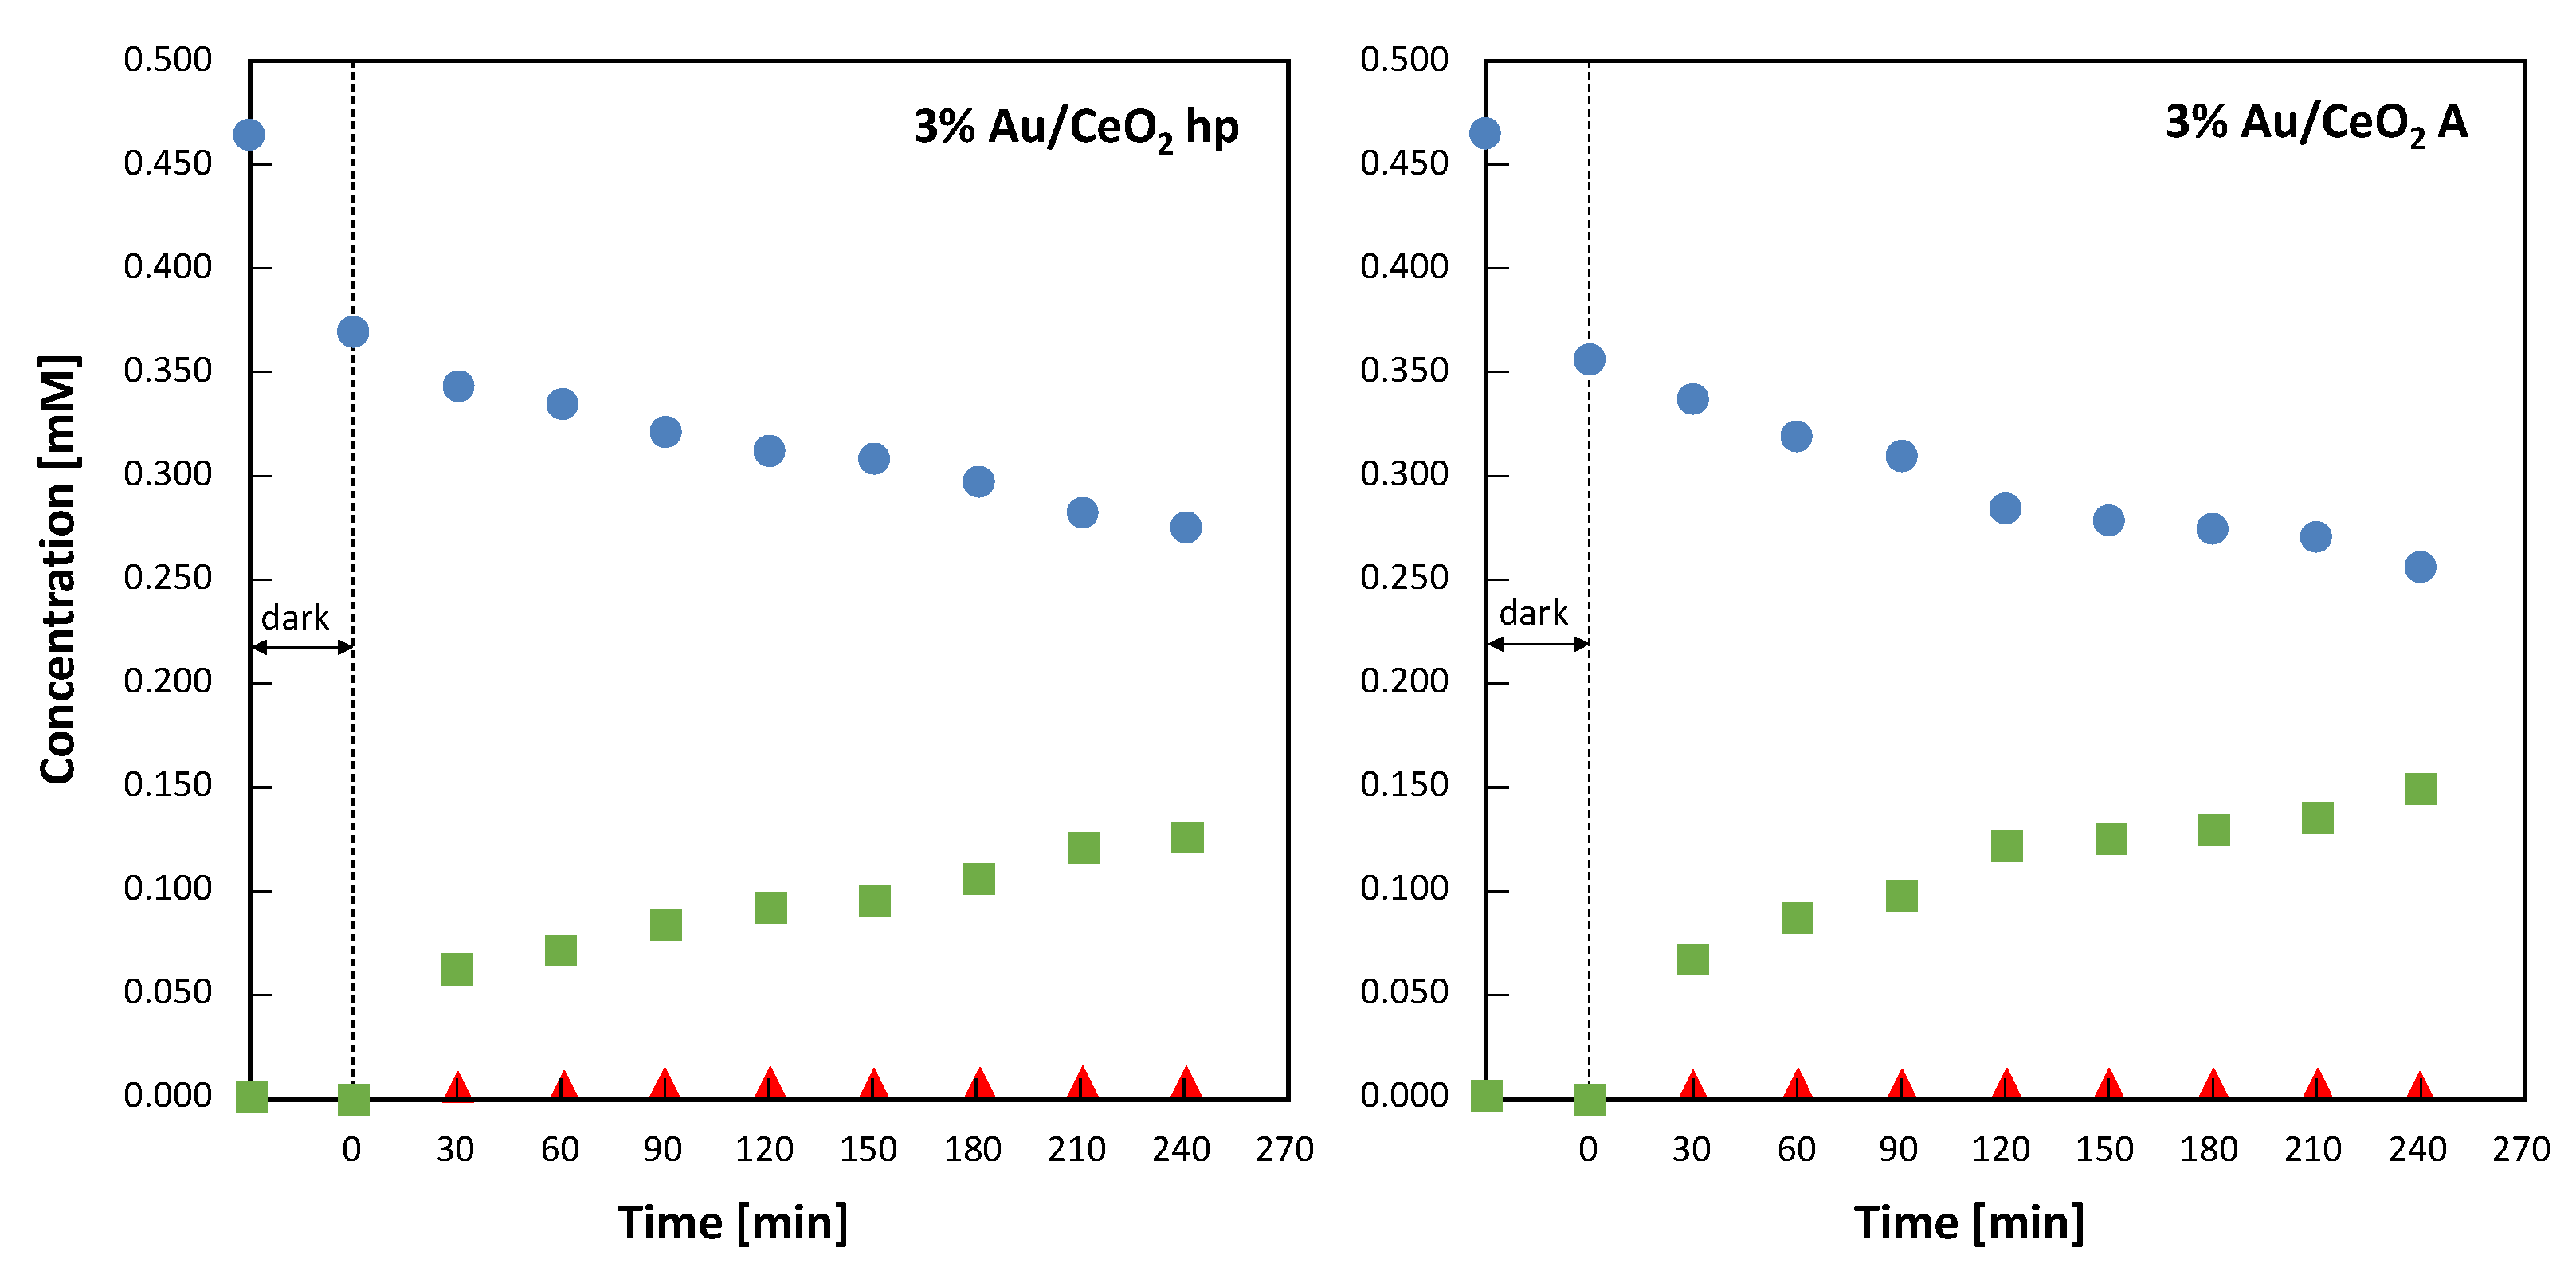
The evolution of 4-MBA concentration along with that of 4-MBAL and 4-methoxy benzoic acid (4-MBAcid) during photocatalytic experiments carried out under solar irradiation in the presence of the two 3% Au-loaded CeO
2 samples are reported in
Figure 8. Both experiments were carried out contemporaneously, so the two reactors used received the same number of photons. During the first 30 min of the experiments, conducted in dark conditions, both catalysts adsorbed ca. 20% of the initial 4-MBA. This adsorption was slightly more evident (ca. 24%) in the case of 3%Au/CeO
2 A. In
Figure 8 it is observed that, for both materials, during the first 30 min of irradiation the amount of aldehyde formed was greater than the amount of alcohol disappeared. This fact indicates that during the first steps of the reaction the amount of adsorbed alcohol reacting to give the aldehyde is not completely replaced by the alcohol present in the bulk of the suspension. This suggests that the amount of alcohol consistently adsorbed on the catalyst surface under irradiation is lower than that adsorbed in dark conditions. Furthermore, it cannot be excluded that part of the aldehyde formed remained adsorbed on the catalyst surface to be furtherly oxidized to 4-methoxybenzoic acid.
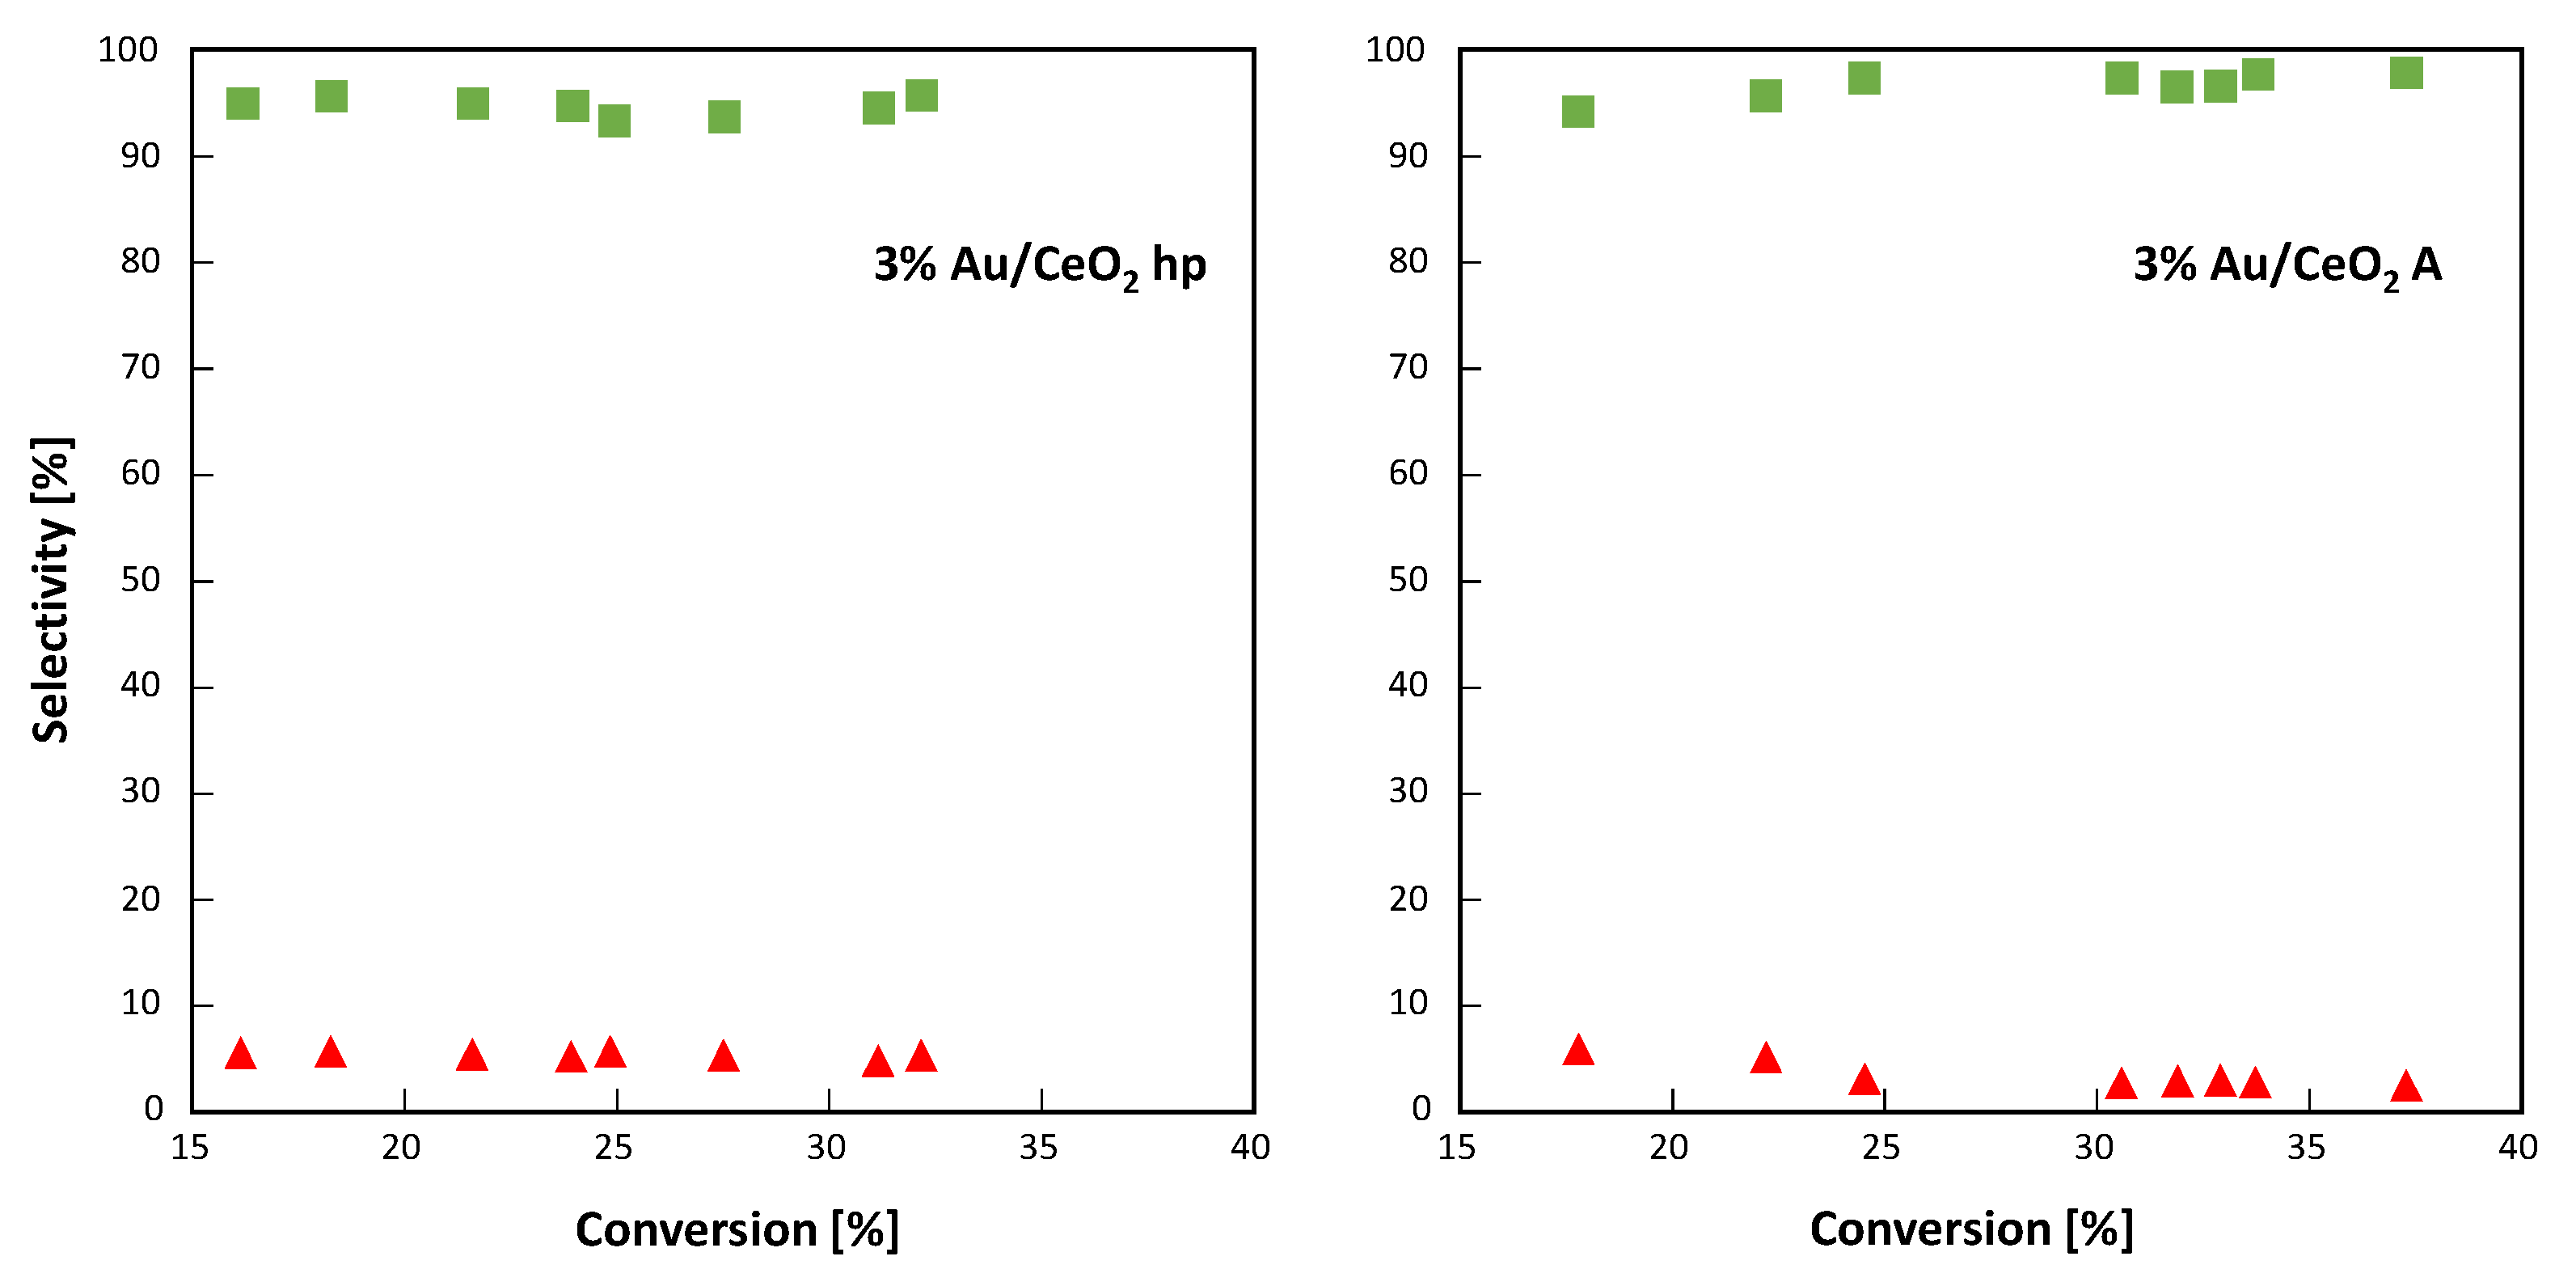
From the results reported in
Figure 8, it was possible to calculate the conversion of 4-MBA and the selectivity versus the formation of 4-MBAL and 4-MBAcid during the evolution of the reaction. These results are reported in
Figure 9.
As reported in
Figure 9 for both 3% Au-loaded CeO
2 samples, the selectivity towards 4-MBAL was always in the range 95–98% (the highest values were observed for 3%Au/CeO
2 A) and it seems independent to the percentage of 4-MBA converted. The selectivity towards the formation of 4-methoxybenzoic acid was close to 5–2% (the highest values were observed for 3%Au/CeO
2 hp), indicating that no other species were formed during the 4-MBA partial oxidation.
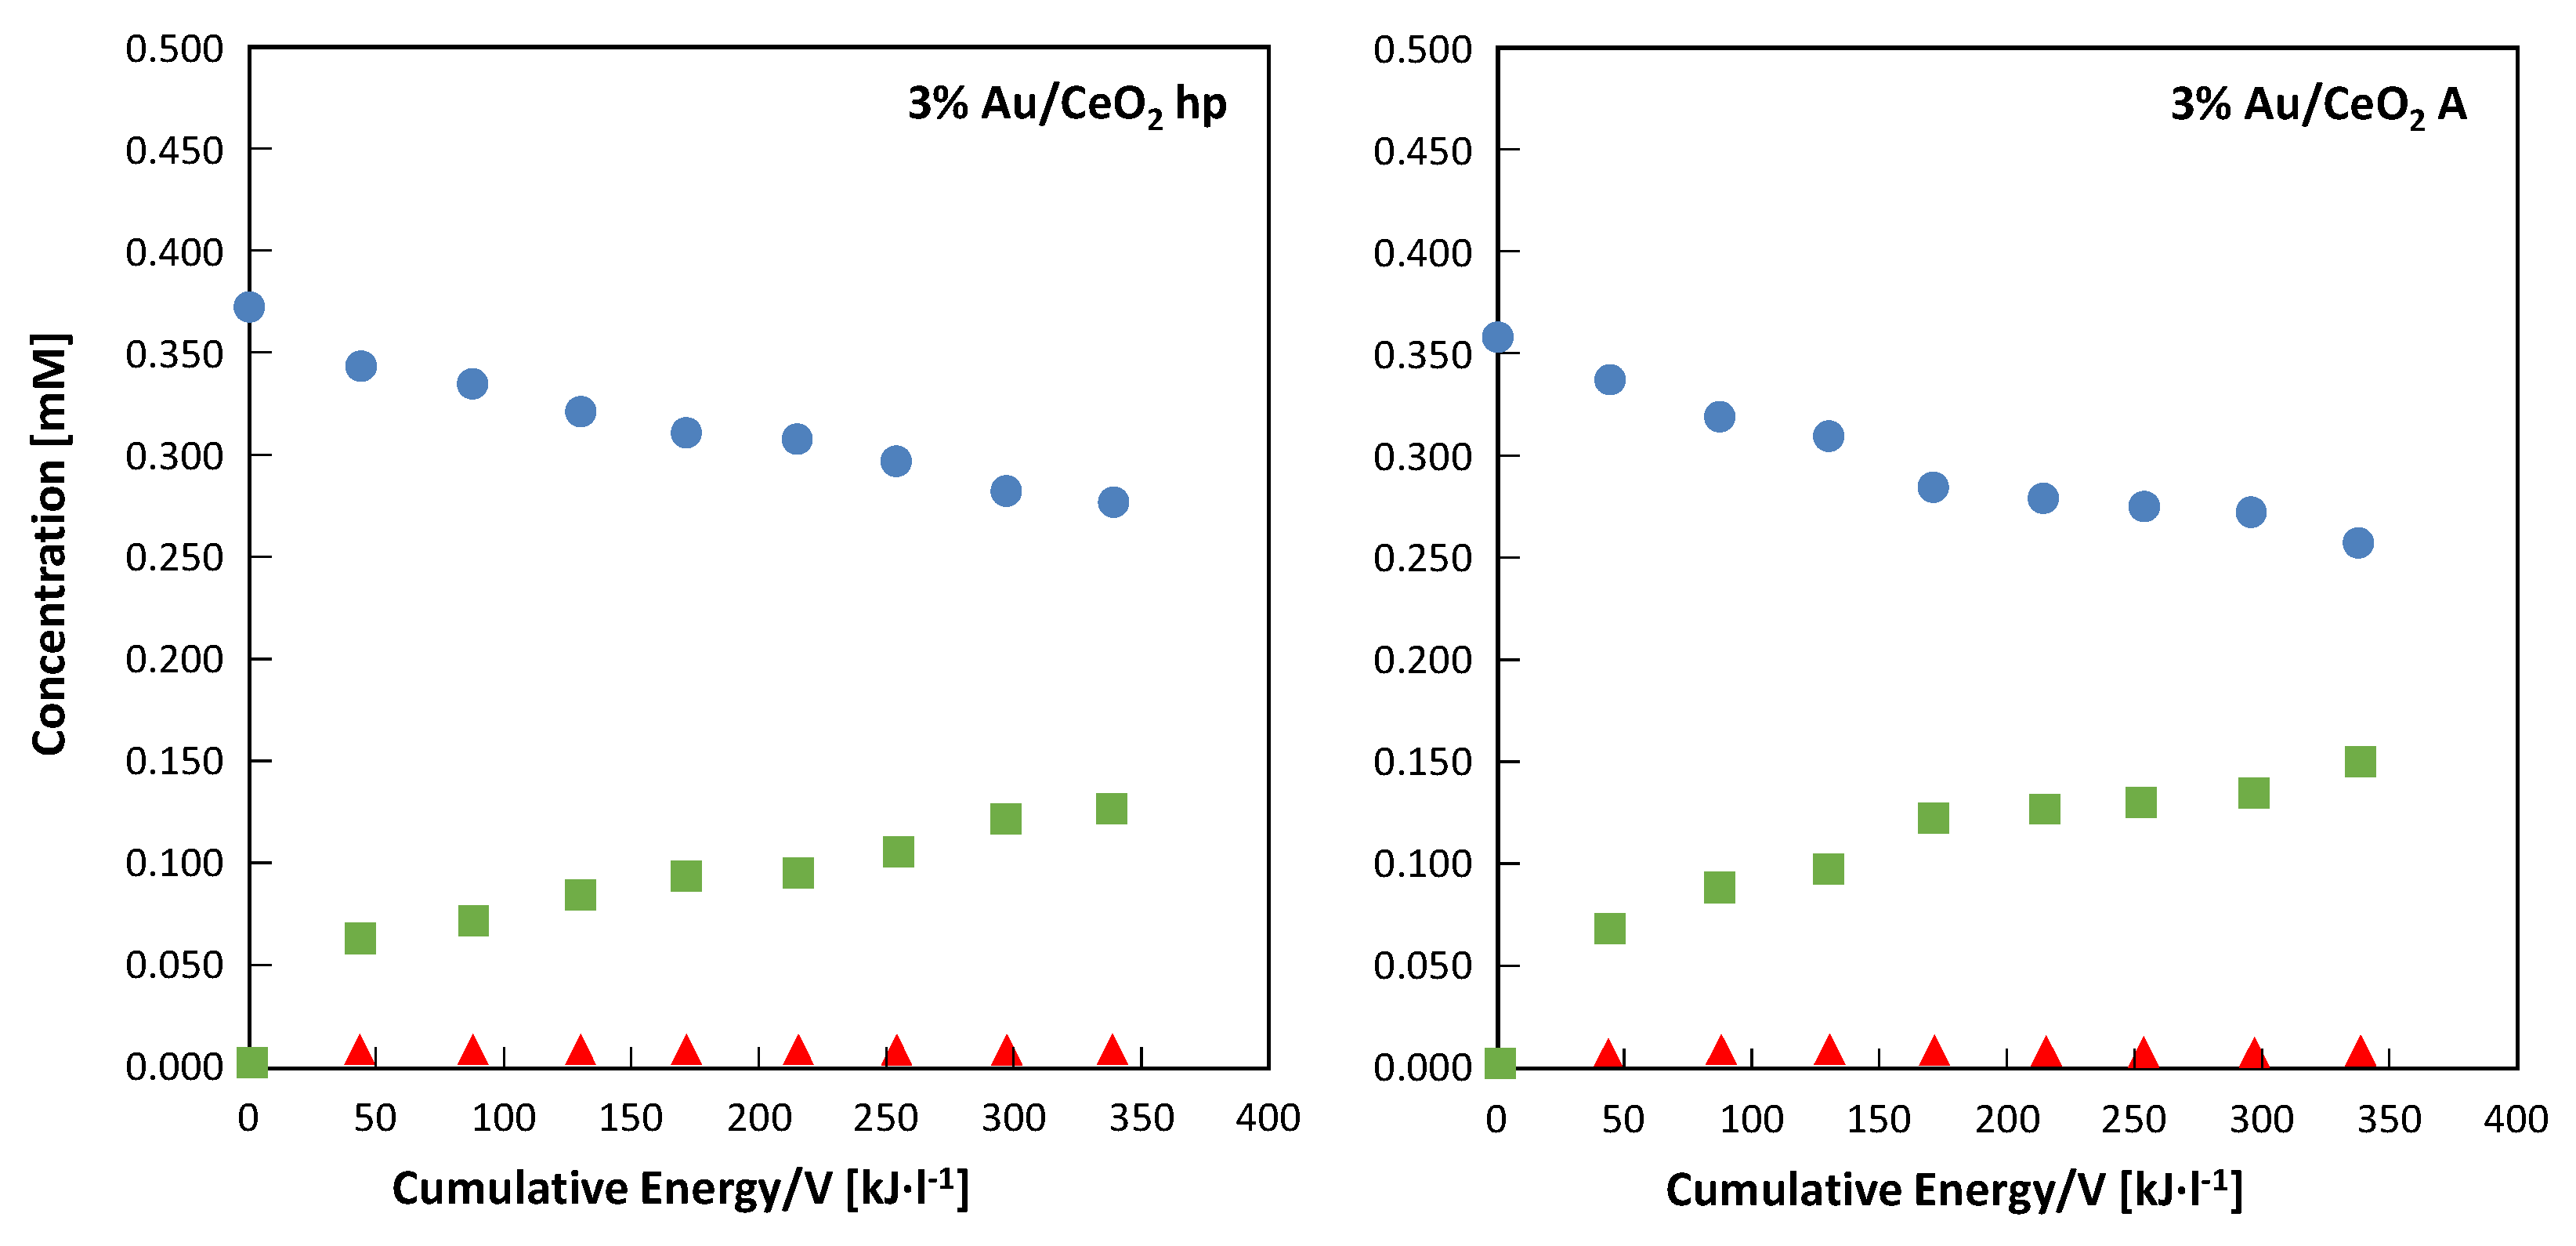
In order to compare the tests carried out under natural sunlight irradiation with those conducted under UV or Vis light, the evolution of 4-MBA, 4-MBAL and 4-MBAcid concentration were also reported versus the cumulative energy entering in the reacting system per unit of volume of suspension. The results obtained under solar light irradiation are reported in
Figure 10.
Figure 8 and
Figure 10 are representative of the same runs, consequently after 4 h of irradiation (240 min) the cumulative energy entering the reactor per unit of volume of suspension was ca. 340 kJ·L
−1. It is important to consider that ca. 6% of the measured solar irradiation (20 kJ·L
−1) was in the UV (315–400 nm) and the remaining part (320 kJ·L
−1) in the visible range (450–560 nm). As far as the runs carried out under UV irradiation are concerned, the cumulative energy entering the reactor per unit of volume of suspension after 4 h was ca. 5 kJ·L
−1, then it was much lower if compared with the amount entering under solar light irradiation. On the contrary, in the case of the tests conducted under visible light irradiation, the cumulative energy entering the reactor per unit of volume of suspension after 4 h was ca. 540 kJ·L
−1 (i.e., ca. 220 kJ·L
−1) more with respect to that entering during the solar tests. In
Table 5 are reported the results obtained in the presence of the two photocatalysts loaded with 3% of gold after the runs carried out by irradiating the photoreactor with UV, visible or natural solar light.
From a perusal of
Table 5 it can be concluded that the 3%Au/CeO
2 A photocatalyst was always the most active in terms of alcohol conversion. In particular, under both UV and visible irradiation the activity of the 3%Au/CeO
2 A sample was substantially higher than that obtained with the 3%Au/CeO
2 hp photocatalyst. On the contrary, when the reaction was carried out under natural solar light the activity of the two catalysts was similar even if the sample based on CeO
2 A showed to be always the most active. On the basis of the irradiation source reaching the system in the three cases, it is possible to observe that the two photocatalysts are active both under UV and visible light but the 3%Au/CeO
2 A sample is able to better exploit both UV and visible light irradiation when used separately. On the other hand, the 3%Au/CeO
2 hp photocatalyst is not very active when irradiated with UV or visible light alone. Conversely, when the latter catalyst is irradiated with sunlight containing both UV and visible, a considerable increase of activity occurs. This synergistic effect was not observed in the case of the other catalyst and consequently the activity of the two samples appeared similar.
To explain the different behavior of the two catalysts under the various types of irradiation, it is necessary to consider various factors. In particular, the porosity and the presence of metallic gold on the surface of the materials seem to be the most important ones, while the specific surface area does not seem to play an important role.
Let us now understand what happens when the catalysts are irradiated with the different sources of radiation. From the results shown in
Table 5 it can be seen that the 3% Au/CeO
2 hp catalyst is less active under UV irradiation than the other one. This fact can be justified by considering that the 3% Au/CeO
2 hp material possess a greater amount of mesopores with respect the 3% Au/CeO
2 A sample. Mesopores that results also smaller in comparison with those showed by the latter catalyst. Consequently, the 4-MBAL formed during the early stages of irradiation could in part be retained in the pores to be further oxidized to 4-MBAcid which blocking [
29] the catalytic sites strongly reduce the activity of the catalyst. This effect is observed, although to a lower extent, also in the case of the 3% Au/CeO
2 A catalyst; in fact, even in this case the selectivity towards 4-MBAL does not reach 100%, indicating the formation of 4-MBAcid which remains adsorbed on the catalyst. Interestingly, under UV irradiation no 4-MBAcid was observed in solution.
Under visible irradiation, the plasmonic effect, causing strong local heating, favors the 4-MBAL desorption, avoiding its subsequent oxidation to 4-MBAcid. This fact is evidenced by the high selectivity towards 4-MBAL (ca. 100%) observed under visible light irradiation with both catalysts. The fact that the 3% Au/CeO2 hp catalyst was still not very active also under visible irradiation can be justified considering that the gold deposited in this catalyst is essentially in ionic form (see XPS study) and consequently the plasmonic effect responsible for the photoactivity was less marked.
Furthermore, the lower gold-support interaction in the case of the 3% Au/CeO
2 hp catalyst, as evidenced by diffuse reflectance investigation, can contribute to the low activity of this material. Under natural solar light irradiation it was observed that the activity of the 3% Au/CeO
2 hp catalyst increased. This fact can be related to the UV energy density entering the system that was 20 kJ·L
−1 (i.e., four times higher than that measured during the test carried out under UV lamp irradiation (5 kJ·L
−1)). Consequently, it is possible to assume that the 3% Au/CeO
2 hp catalyst is essentially activated by UV; indeed, under solar irradiation the amount of visible light reaching the reactor (320 kJ·L
−1) was lower with respect to the test conducted by irradiating the system by using visible LED (540 kJ·L
−1). However, the presence of visible light was still beneficial because the plasmonic effect help the reaction by favoring the desorption of the 4-MBAL; indeed, for these runs the selectivity towards the formation of aldehyde was always close to 100% (see
Table 5). Resuming for the 3% Au/CeO
2 hp catalyst, the enhanced photocatalytic activities can be attributed to the synergistic effect between the Au nanocrystal acting as the plasmonic component for efficiently harvesting the light and the CeO
2 support providing catalytically active sites for the oxidation reaction. On the other hand, in the case of the 3% Au/CeO
2 A catalyst, which was almost active even under irradiation with visible light, the additional UV contribution of solar radiation did not significantly increase the activity of the catalyst.
It is interesting to compare the conversion, selectivity and reaction rate obtained with the photocatalysts in this study with respect to those reported in literature for the same reaction.
Li et al. study the partial oxidation of benzyl alcohol with a 100% selectivity to benzaldehyde in the presence of 0.25–0.5 wt.% Au/CeO
2 samples using acetonitrile as the solvent and the irradiation of λ > 420 nm [
15]. They reported a maximum conversion rate of ca. 2250 and ca. 390 μmol·h
−1·g
−1 under UV–Vis or only visible irradiation, respectively. These results are better than those obtained in our work (ca. 36 μmol·h
−1·g
−1 under visible light) but they are not comparable because we have used water as solvent. Moreover, the UV and visible photon flux emitted by the Xe lamp used by Li et al. were much higher with respect to our light source. Kominami et al. studied the photocatalytic oxidation of benzyl alcohol in aqueous suspensions of Au/CeO
2 samples under irradiation by green light from an LED. They prepared Au/CeO
2 nanocomposites by two photodeposition methods, both exhibiting LSPR absorption at around 550 nm matching with the wavelength of the green LED light used in their research [
16]. They conclude that the size of the nanoparticles affected the intensity of the photoabsorption and hence the photocatalytic activity as previously observed in plasmonic Au/TiO
2/photocatalysts [
33]. The authors have shown that the benzyl alcohol was completely consumed after 15 to 20 h depending upon de material and experimental conditions. Benzaldehyde was formed from benzyl alcohol partial photo-oxidation with a >99% selectivity. The rates of benzaldehyde formation were determined to be in the range 1.9 to 3.0 μmol h
−1. These results were very close to those obtained in this work using the visible LED (in
Table 4, 20·10
−5 mM min
−1 correspond to 1.8 μmol h
−1). Cui et al. studied the selective photocatalytic conversion of alcohols (benzyl alcohol, 4-methoxybenzyl alcohol) using Au/CeO
2 composites with different Au loadings under visible light irradiation (λ > 400 nm, light intensity of 0.7 W cm
−2 by using benzotrifluoride as solvent [
34]. The conversion achieved a 100% in the presence of Au 4 wt.%/CeO
2 after 4 h of reaction and the selectivity to benzaldehyde was ca. 95%. Wolski et al. prepared three CeO
2 samples using different co-precipitation agents (urea, hexamethylenetetramine or NaOH) and Au-loaded photocatalysts. The catalytic study was carried out in dark condition at 40 °C (thermal catalysis) and evidenced that the most active catalysts (highest conversion of benzyl alcohol) were those containing gold and in particular the one prepared by using NaOH as co-precipitation agent [
19]. The results obtained by Wolski et al. are not comparable with those reported in this work but indicate that, in order to avoid the over oxidation of benzyl alcohol to benzoic acid, it is better to carry out the experiments at room temperature, as in our case. By using the best catalyst they obtained benzoic acid. With a conversion after 40 min of 47% with a selectivity to benzoic acid of 91%, the benzaldehyde was obtained with a 9% of selectivity. Furthermore, in our opinion, the use of a basic solution for the experiments could significantly influence the results.


 ,
, 


