Article

Synthesis of Ce/MgO Catalysts for Direct Oxidation of Hibiscus cannabinus Stalks to Vanillin

by
Nur Akila Syakida Idayu Khairul Anuar
1,2,
Anita Ramli
1,2,* and
Lim Jun Wei
1,2
1
Fundamental and Applied Sciences Department, Universiti Teknologi PETRONAS, Seri Iskandar 32610, Perak, Malaysia
2
HICOE Centre for Biofuels and Biochemicals Research, Universiti Teknologi PETRONAS, Seri Iskandar 32610, Perak, Malaysia
*
Author to whom correspondence should be addressed.
Catalysts 2021, 11(12), 1449; https://doi.org/10.3390/catal11121449
Submission received: 21 October 2021 / Revised: 24 November 2021 / Accepted: 25 November 2021 / Published: 28 November 2021

Abstract

:
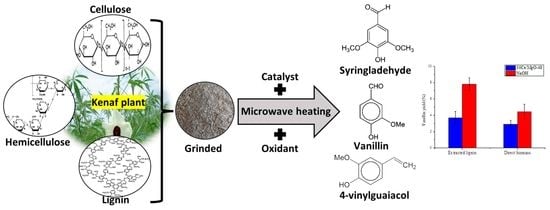
One possible method of producing vanillin from biomass is through controlled oxidation of lignin. Direct oxidation of kenaf stalks was chosen without having to separate the cellulose and hemicellulose components from the lignocellulosic biomass. This makes the process greener, as well as saving time. In this paper, Ce/MgO catalysts were developed for oxidation of kenaf stalks and kenaf lignin under microwave irradiation. The catalysts were characterized for their physicochemical properties using XRD and N2 adsorption–desorption isotherms. The synthesized MgO showed the presence of diffraction peaks assigned to cubic MgO while the 30Ce/MgO catalysts showed the presence of cubic fluorite of CeO2. N2 adsorption–desorption isotherms showed that all catalysts possess Type III isotherm according to IUPAC classification, indicating a nonporous structure. All catalysts were tested for direct oxidation of kenaf stalks under 300 W of microwave irradiation using H2O2 as the oxidizing agent at pH 11.5 and temperatures between 160 and 180 °C for 10–30 min with 5–15% catalyst loading. The highest vanillin yields of 3.70% and 2.90% for extracted lignin and direct biomass oxidation were achieved using 30Ce/MgO-48. In comparison, 7.80% and 4.45% were obtained using 2N of NaOH homogeneous catalyst for extracted lignin and direct biomass, respectively, at 170 °C for 20 min. The reusability test shows that 30Ce/MgO can be used up to three cycles without significant loss in catalytic activity. Other compounds detected were 4-vinylguaiacol, syringol and syringaldehyde.

Graphical Abstract

1. Introduction

Vanillin, known as 4-hydroxy-3-methoxybenzaldehyde (Figure 1), is vanilla’s primary flavor constituent used as a flavoring and fragrance ingredient in the food and cosmetic industries [1]. The commercial vanillin market is served by three major sources, namely, natural vanilla from vanilla pods, vanillin produced from petrochemical sources and vanillin produced from kraft lignin [2]. The Vanilla planifolia A plant is the best-known natural source of vanillin, which belongs to the orchid family, mainly cultivated in Mexico, Madagascar, Reunion, Java, and Tahiti [3]. However, the production of natural vanillin from vanilla pods covers only 0.2% of the market requirement and its production cost is very high as it requires manual labor to pollinate the flower [1,4]. Furthermore, the extraction of vanillin from vanilla beans is a long and expensive process, and is inconsistent, and the demand for this universally popular flavoring cannot be satisfied by vanilla beans alone. Nowadays, vanillin produced from petroleum-based intermediates, especially guaiacol, accounts for 85% of the world supply, while the remaining 15% is produced from lignin [5].
The synthesis of vanillin from renewable sources should result in a greener and more sustainable process. Lignin could be used as a natural precursor from renewable sources to meet the growing demand for natural vanillin as far as the aroma and fragrance fields are concerned. Furthermore, vanillin produced from lignin shows 1.2 times higher aromatic intensity than petroleum-based vanillin [1]. One possible method of producing vanillin through a sustainable process is through the controlled oxidation of lignin from lignocellulosic biomass. Lignin is a three-dimensional amorphous macromolecule and is the most significant renewable material with an aromatic skeleton structure. Lignin’s composition and ratio are different for different plants such as hardwood and softwood [7]. Softwoods have a lignin content of 25–35% dry weight, while the lignin content in hardwoods is 18–25% [8].
Sales and co-workers [9] reported that the oxidation of lignin to produce vanillin occurs at very alkaline pH (almost 14) and high temperatures (130 °C) with oxygen pressure higher than 3 bar. They investigated the conversion of alkaline lignin extracted from sugarcane bagasse using batch slurry and continuous fluidized-bed reactors and reported that 0.56 g of vanillin and 0.5 g of syringaldehyde were obtained from 30 g of lignin at 120 °C after 2 h [9]. Furthermore, Araujo et al. [10] reported that low-molecular weight lignin derived from softwoods is preferable to than high molecular weight lignin for obtaining a better vanillin yield. They also reported that regardless of the source of lignin, pH is the essential variable in the reaction, with lower pH values promoting vanillin degradation, thus reducing the vanillin yield.
The oxidizing agent used for the oxidation reaction also significantly influences the yield of vanillin produced, as observed by Alireza et al. [6], where 4.2% and 1.2% of vanillin yield were reported from oxidation of industrial lignin using molecular oxygen and alkaline nitrobenzene, respectively. Furthermore, Valery et al. [11] reported a vanillin yield of 18.6% when lignin extracted from powdered pine wood using standard alcohol-toluene as a solvent was oxidized using copper oxide (CuO) catalyst. On the other hand, Chen et al. [12] reported that a 4.2% vanillin yield was achieved from the direct oxidation of Japanese cedar wood particles in CuO as the catalyst and H2O2 solution as an oxidizing agent under microwave irradiation at 200 °C for 20 min.
Chaudhary and Dhepe [13] reported that solid acids, homogeneous acids, ionic liquid, supercritical fluids yield low molecular weight aromatic products. However, most of these methods were linked to a few problems such as high temperatures (≥ 250 °C) or pressures (>3 MPa) or both for operation parameters. Alkaline oxidation of lignin is considered the only approach that yields large amounts of single monomeric aldehydes that are the predominant products in the presence of base catalysts. However, the conversion of lignin to vanillin requires a very high pH and this is usually achieved by using NaOH as the solvent, resulting in problems of corrosion and pollution. A study carried out by Long et al. [14] reported a 13.2% yield phenolic monomers, including vanillin obtained during lignin depolymerization using MgO solid base catalyst, while Biswas et al. [15] stated that the properties of the high base of CaO/CeO2 catalysts enhanced the cleavage of β-O-4 in the lignin structure, thus increasing the reaction’s selectivity. Base catalysts are very interesting for alkaline oxidation of lignin; therefore, alkaline solid catalysts based on MgO were developed. The basicity of MgO was modified using Ce to increase its basicity properties.
Kenaf (Hibiscus cannabinus) is a commodity crop with a high potential to produce renewable vanillin since it contains 13–15% lignin [16]. In this paper, we report the vanillin production from direct oxidation of kenaf stalks and kenaf lignin using 30Ce/MgO under microwave irradiation.

2. Result

2.1. Catalyst Characterization

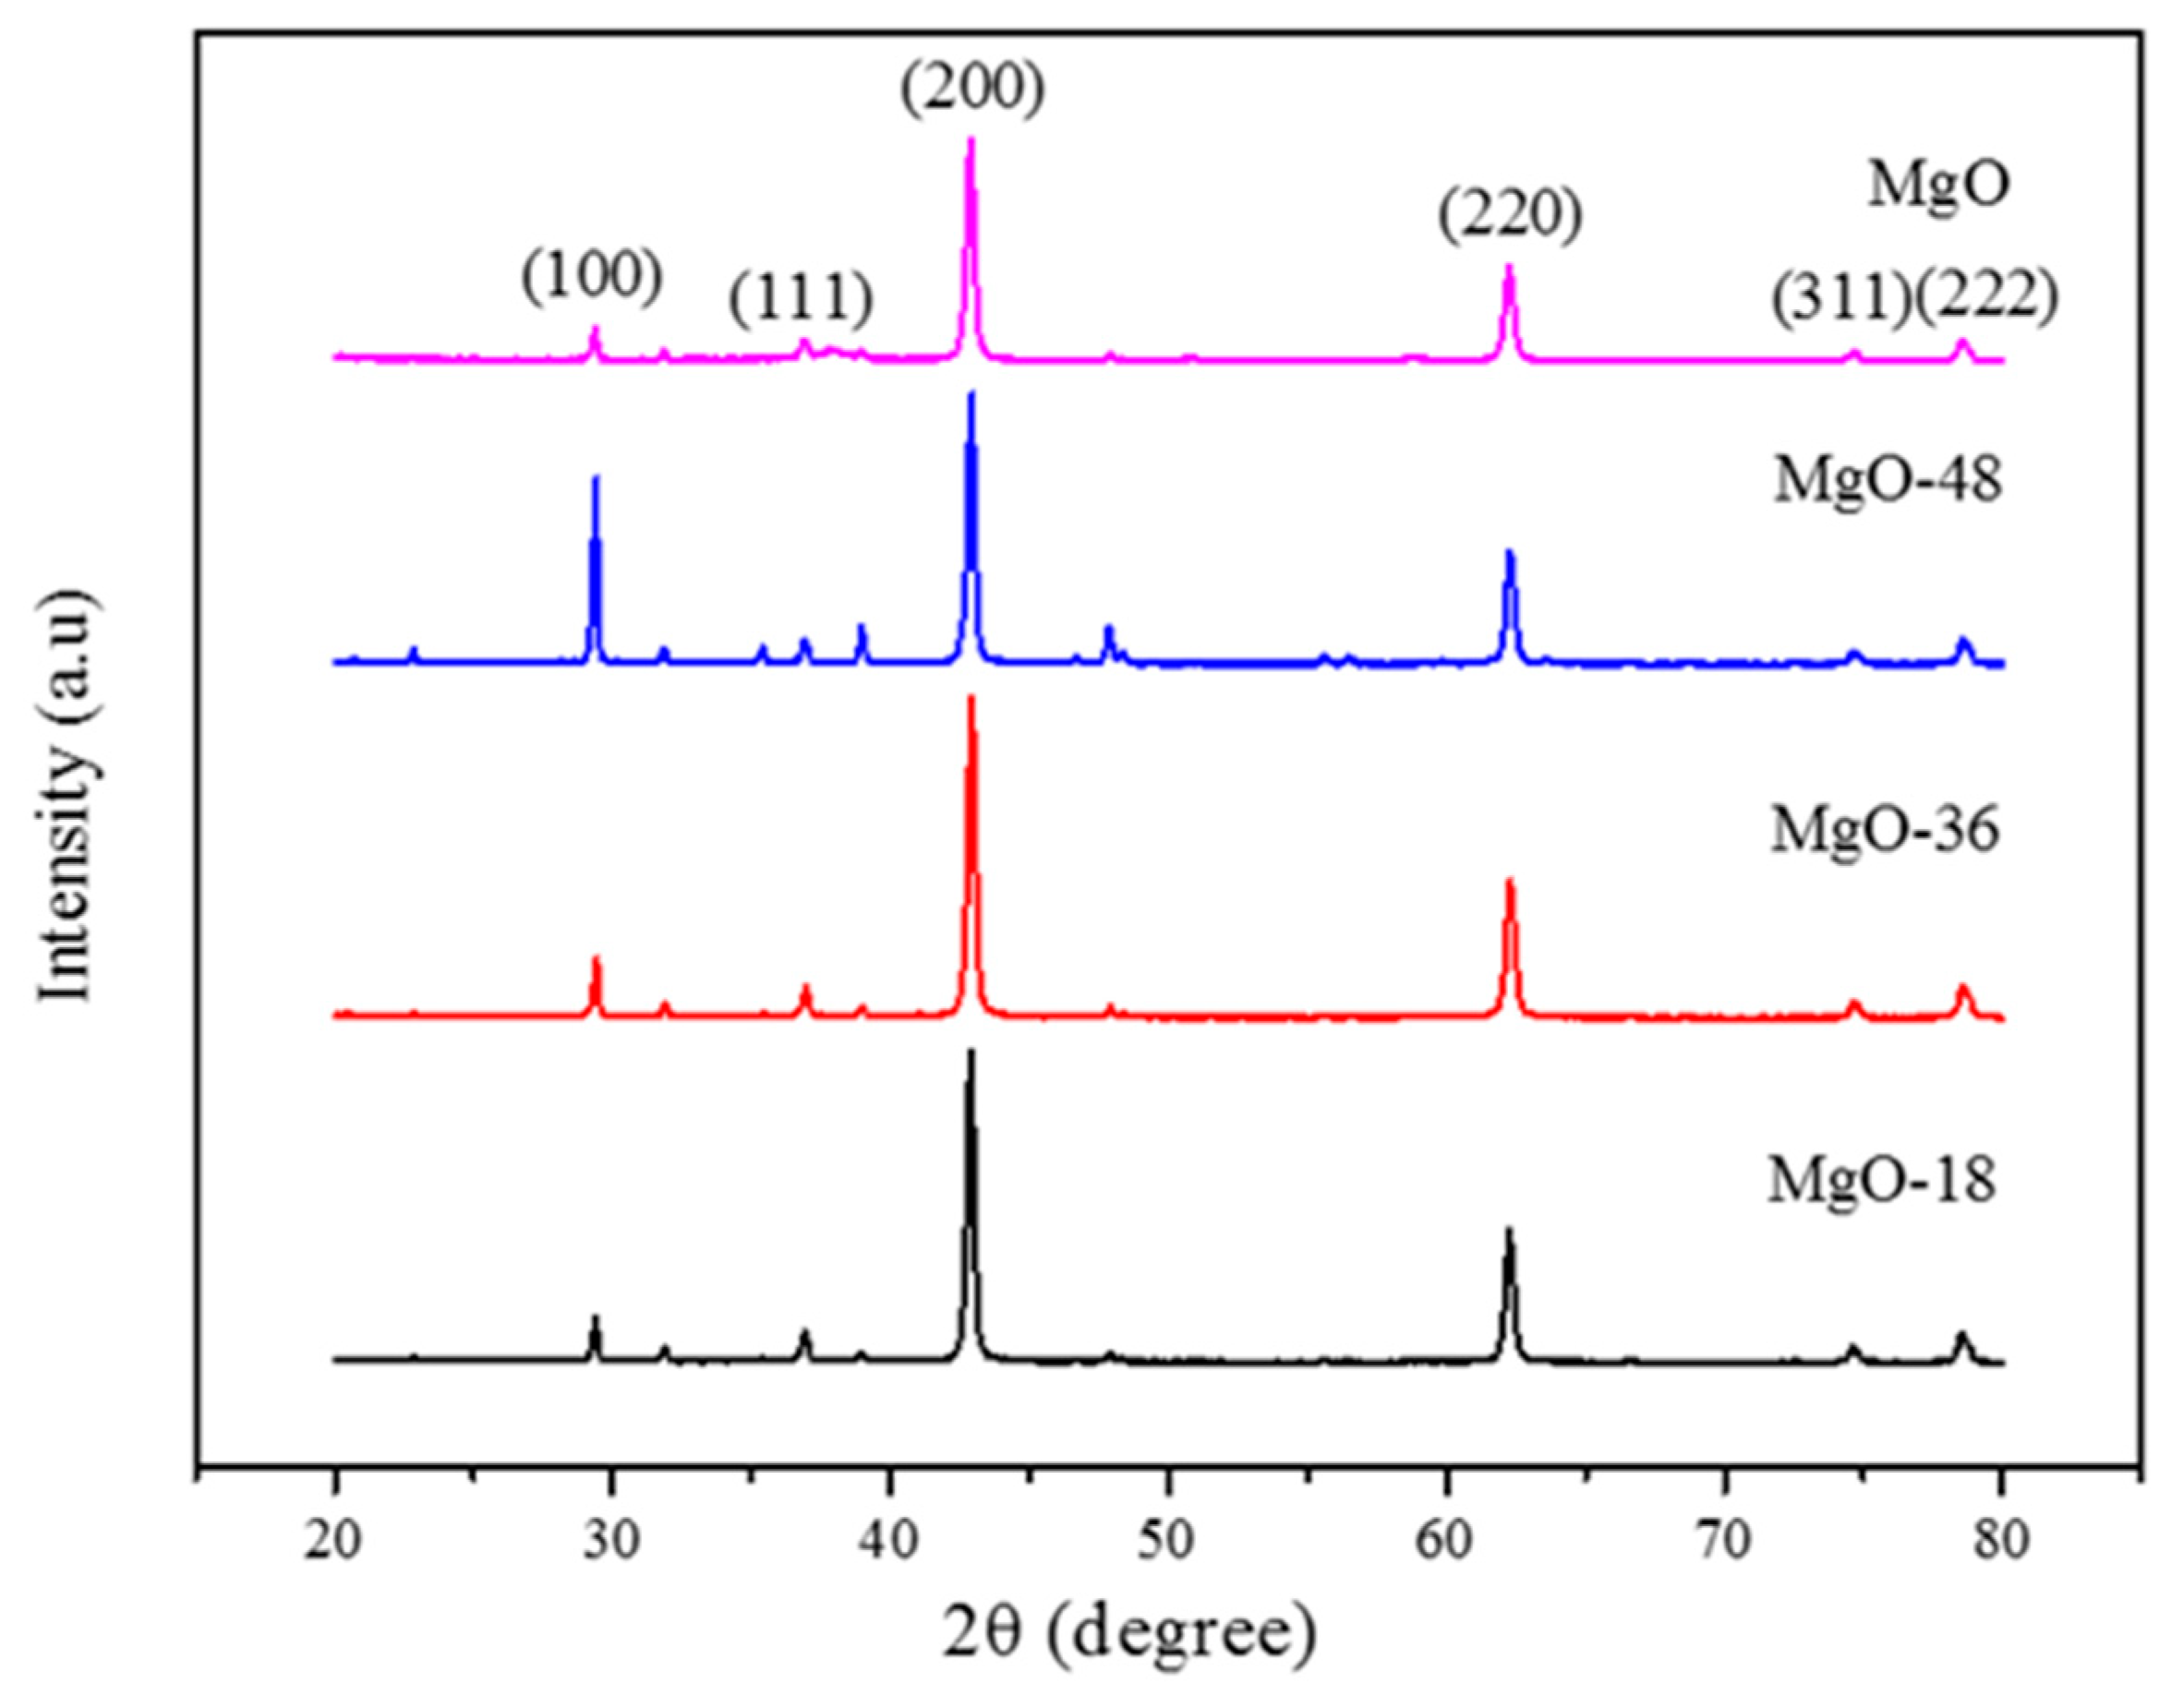
Figure 2 shows the X-ray diffractograms of MgO synthesized using sol-gel and hydrothermal methods (more details are available in Figure S1). The presence of diffraction peaks at 2θ = 29.33, 36.90, 42.85, 62.13, 74.65 and 78.40° indicate the formation of cubic phase of MgO [10] which could be assigned to (100), (111), (200), (220), (311) and (222) planes, respectively [17,18]. Based on ICDD: 00-04500946, the diffraction peak of MgO exhibits a crystalline periclase of magnesium oxide with a cubic crystal system, as reported by Araujo et al. [10]. The result is similar to that reported by Bing et al. [19], where they observed diffraction peaks at 2θ value of 36.94, 43.01, 62.21, 74.62, 78.63°, which can be indexed to the standard diffraction spectra of MgO powder. However, Araujo et al. [10] and Bing et al. [19] did not report the presence of a Mg(100) peak at a 2θ value of 29.33. On the other hand, Xiangcun et al. [20] showed that there was the formation of impurity of Mg(OH)2 at 2θ value around 30° in the XRD pattern, which could be due to high hydration properties of MgO materials. In general, the intensity of the peaks was higher when the MgO was synthesized using the hydrothermal method (MgO-18, MgO-36 and MgO-48) compared to MgO synthesized using the sol-gel method (MgO-SG). The hydrothermal method can increase crystallite size with good structure; hence the crystal quality is improved [21] compared to the sol-gel method, which results in a higher specific surface area [22].
From the result, MgO-36 showed the highest peak intensity at the plane (200), followed by MgO-18 and MgO-48. Increasing intensity peaks from 18 hours to 48 h synthesized duration can be related to Ahmedet al.’s study [23], which suggested that the catalyst shows the high structural ordering of mesopores in the material due to stronger intensity of peaks in the XRD spectrum. However, further extension duration to 48 h synthesis resulted in decreased intensity peaks at the plane (200), which could be due to the structural ordering decreases in the material as the interplanar spacing increases, as reported by Ahmed [23].
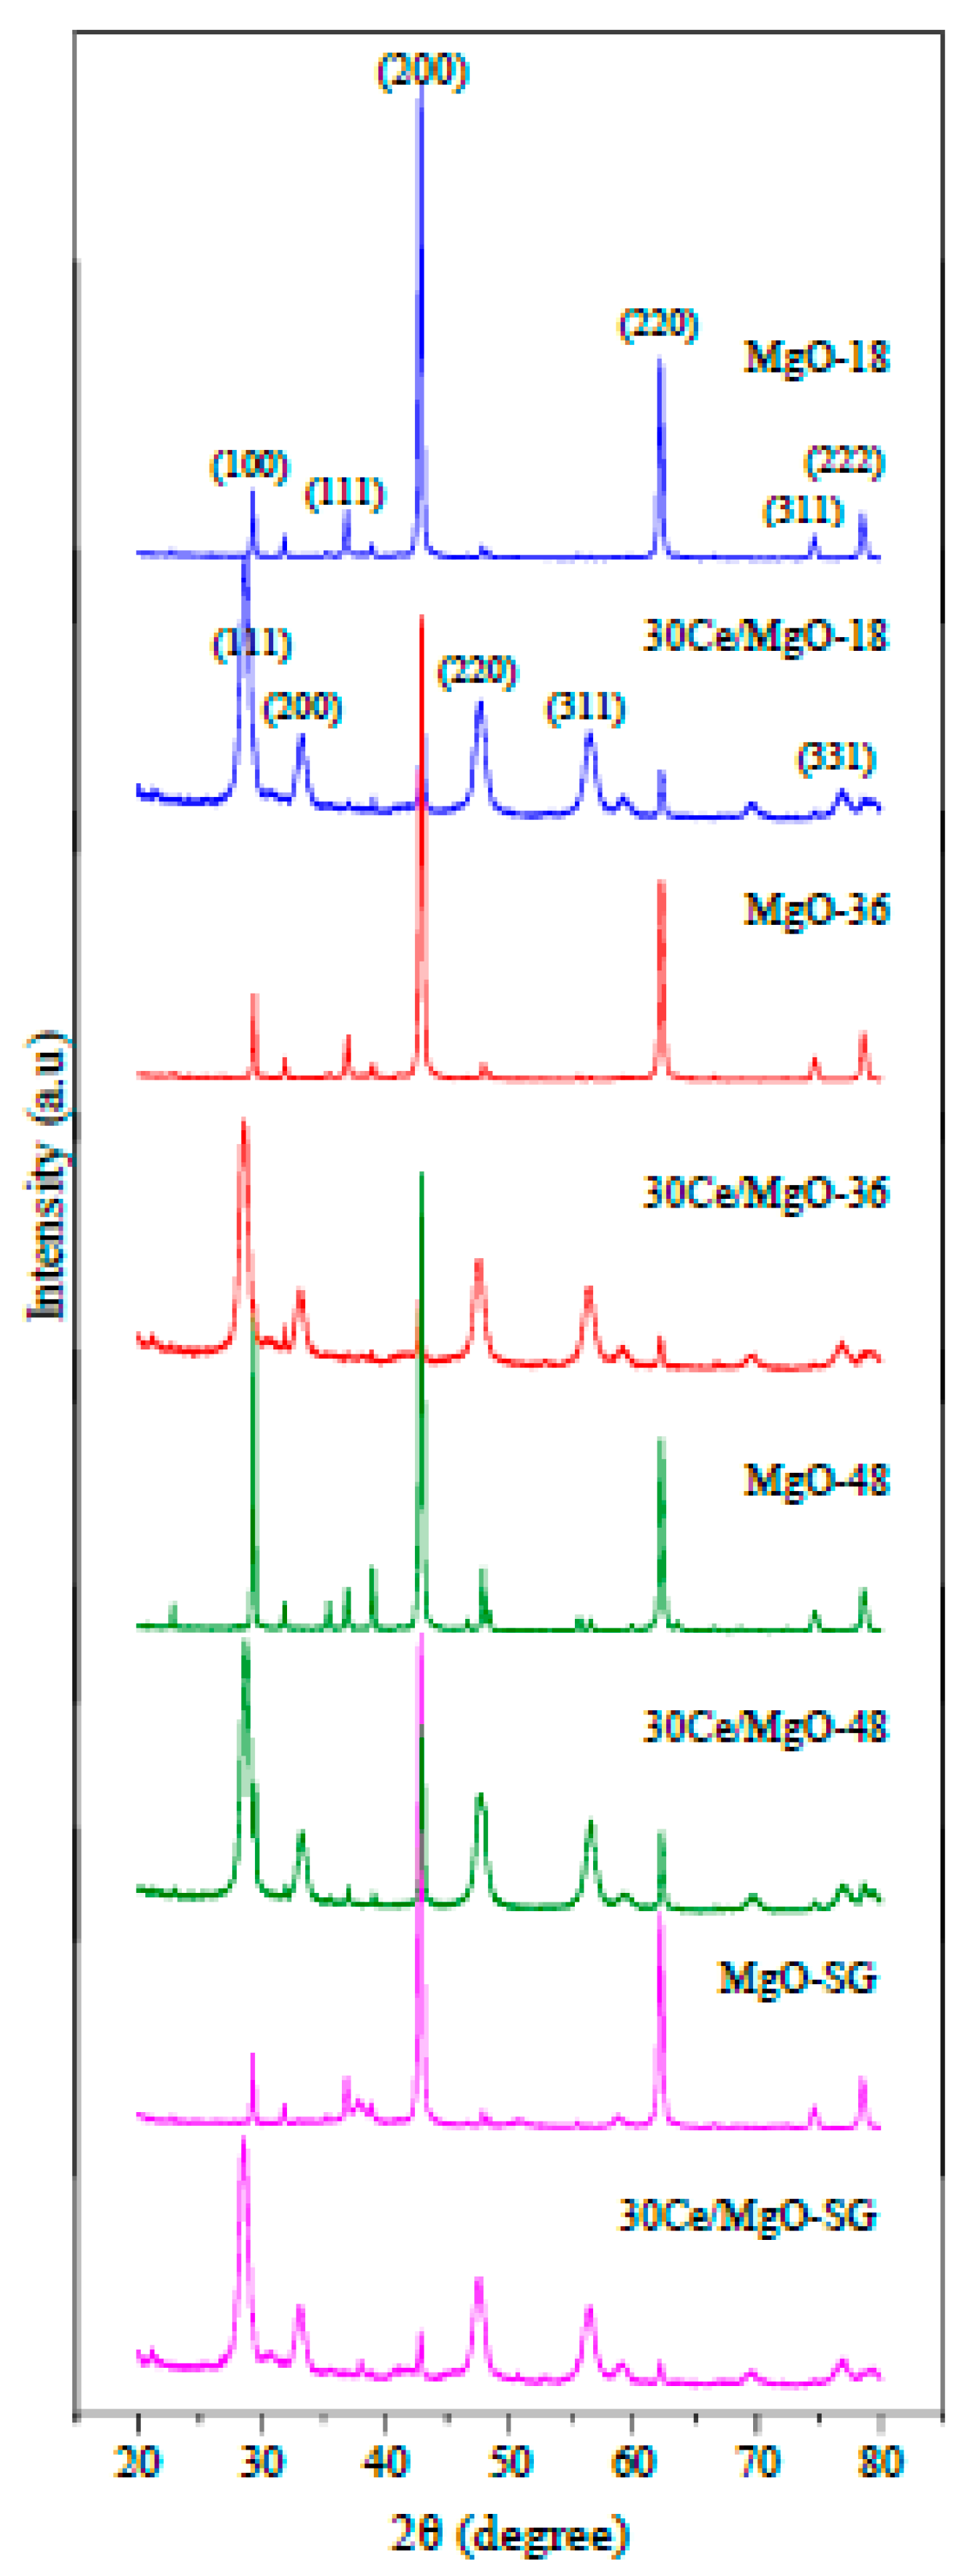
When the synthesized MgO was impregnated with 30% Ce, the formation of new peaks with low intensities were observed at 2θ = 28.51, 33.32, 47.60, 56.35 and 78.71° (Figure 3 and Figure S2) in all 30Ce/MgO catalysts, which could be assigned to Ce (111), Ce (200), Ce (220), Ce (311) and Ce (331) planes, respectively, indicating the formation of cubic fluorite structure of CeO2 as referenced from ICSD: 28709 [24,25]. Furthermore, the intensities of all MgO peaks is reduced while the Mg(200) and (220) peaks shifted to slightly higher 2θ value of 43.17 and 62.94°, respectively, with lower intensities. The results are in agreement with research reported by Setoudeh et al. [26] that shows diffraction peaks of MgO would slightly shift to higher angles due to the diffusion of Ni2+ ions into the MgO lattice, while the diffusion of Mg2+ into Ni2+ lattice would result in the peaks to slightly lower angles. These phenomena are attributed to the presence of Ce diffused into the MgO lattice [27].
Table 1 shows the estimated crystallite size of the synthesized MgO and CeO2, determined from the diffraction peaks for (200) and (111), respectively. The calculation of the crystallite size is based on the highest intensity peak for both MgO and CeO2. The result showed decreased crystallite size as the hydrothermal duration process increased from 18 to 36 h. However, the crystallite size increases as the duration process are prolonged to 48 h for MgO catalysts, while MgO-36 shows a smaller crystallite size than MgO-18 and MgO-48. Soo Min et al. [28] observed that XRD peaks become sharper as the duration for hydrothermal treatment was increased as prolonged duration at hydrothermal temperature allows the crystals to grow more extensive during the hydrothermal process.
The observation of the crystallite size trend for MgO-supported Ce catalysts shows a different pattern than for the MgO catalyst. From Table 1, it is clear that the 30Ce/MgO catalyst displays an increasing pattern, as hydrothermal duration increases from 18 h to 36 h. However, a contradiction trend in crystallite size was observed as the crystallization period was further increased to 48 for 30Ce/MgO-48 compared to 30Ce/MgO-18 and 30Ce/MgO-36 catalysts. 30Ce/MgO-48 possesses a smaller crystallite size, as the order of increasing crystallite size is 30Ce/MgO-36 > 30Ce/MgO-SG > 30Ce/MgO-18 > 30Ce/MgO-48. Crystallite size at Ce(111) plane shows a clear increasing pattern as synthesis duration increases. It could be caused by a lower state of dispersion of Ce at the site into the support surface, due to the agglomeration of impregnated metal into MgO pores/channel or surface as synthesized duration increases from 18 h to 48 h [29].
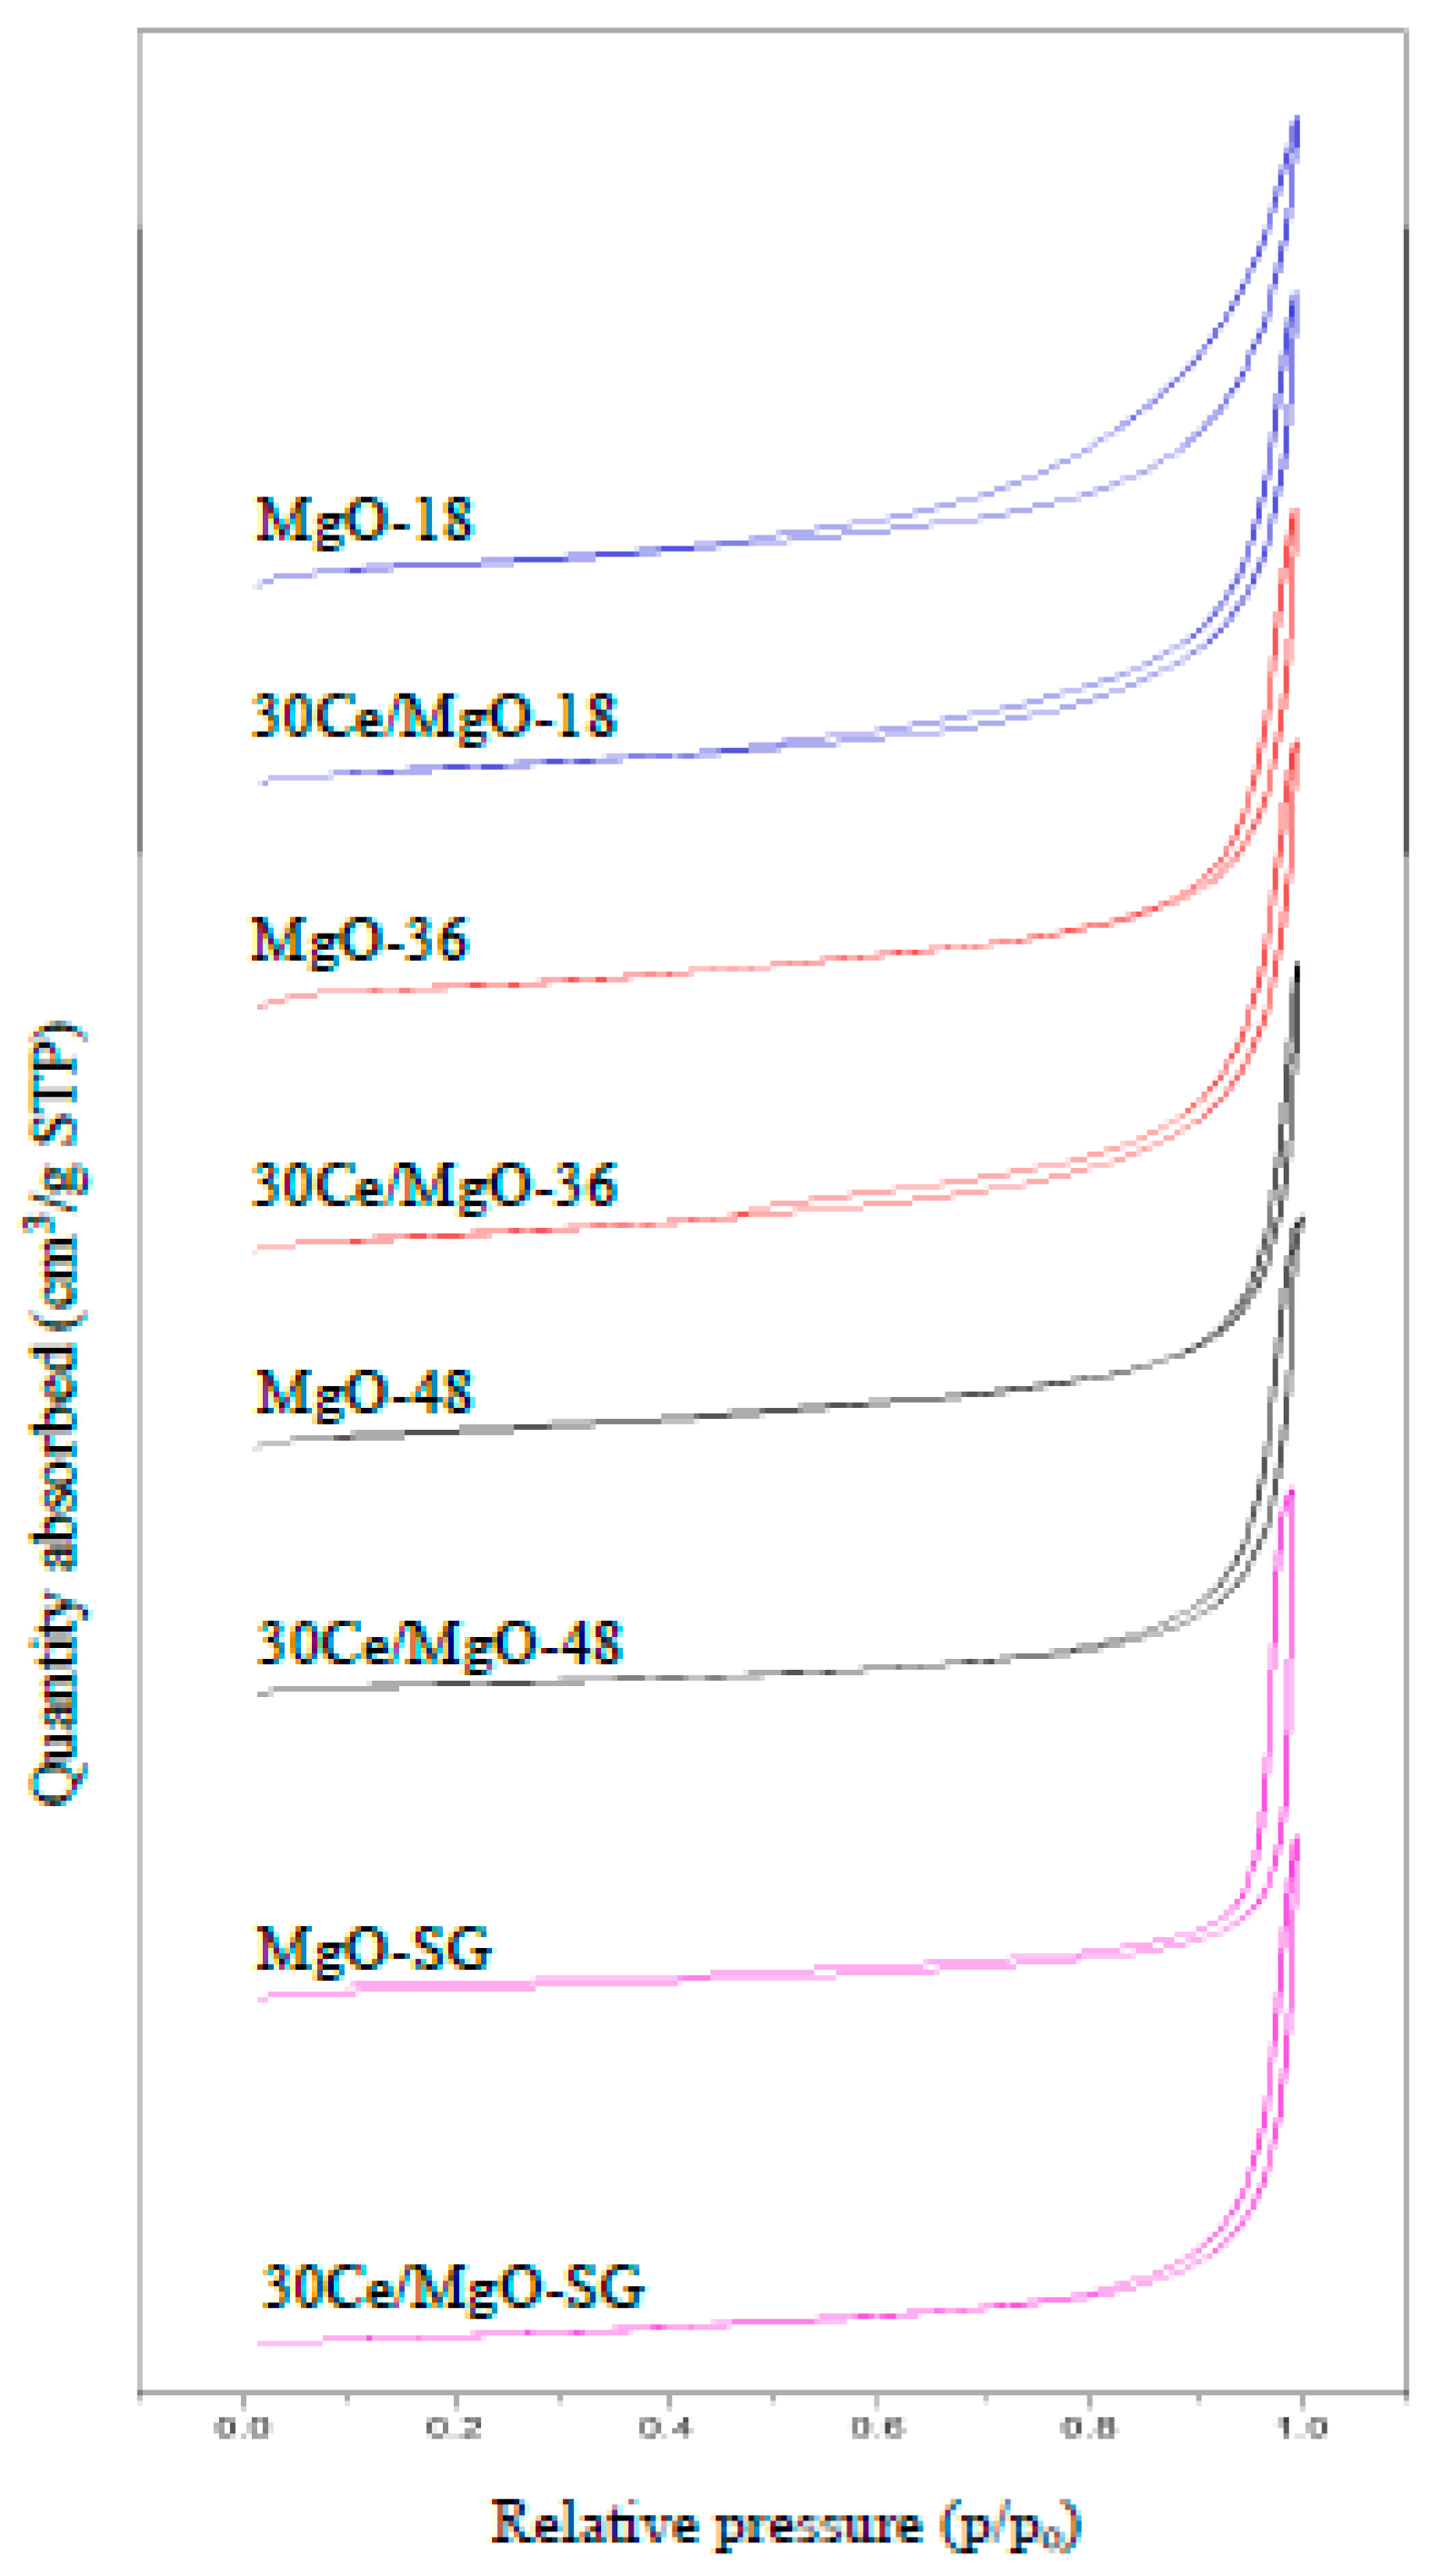
Figure 4 shows the N2 adsorption–desorption isotherms of MgO-supported Ce catalysts, where all samples show a combination of Type II isotherms with a knee shape isotherm at a very low relative pressure (p/po) and Type III isotherms at higher p/po according to IUPAC classification, a characteristic of non-porous materials [30,31]. Moreover, the isotherm destination turns upward at high relative pressure, which could be attributed to the voids between the particles [32]. Li et al. [33] stated that MgO exhibits a typical type-III isotherm—the N2 adsorption–desorption isotherm, which is a typical characteristic of a porous structure with a significant H3 hysteresis loop. They also reported that observation at medium relative pressure (p/po) range of 0.5–1.0confirmed the presence of substantial mesopores in the MgO nanoparticles [33].
Table 2 shows the textural properties of the MgO and MgO-supported Ce catalysts where the surface area, pore volume and average pore size of MgO synthesized using the hydrothermal method increased when the crystallization period was increased from 18 to 36 h. However, when the crystallization period was further increased to 48 h, the surface area, pore volume and average pore size of the MgO decreased as the crystallite size of the MgO crystals that were formed also showed increases. The surface area and crystallite size of all catalysts showed a clear contradiction trend to each other, which agrees with the findings stated by Chowdhury et al. [33] and Li et al. [24]. Both studies reported that a bigger total surface area of the materials would result in larger interparticle porosity or voids between particles, thus reducing the crystallite size of the materials. As can be seen, MgO-36 showed the highest surface area (34.6 m2/g) with the smallest crystallite size (29.9 nm) among other MgO catalysts, while MgO-48 showed the smallest surface area (13.5 m2/g) with the biggest crystallite size (48.4 nm). The result obtained was also in agreement with the study carried out by Sui et al. [34] that showed CeO2 support, and the Co/CeO2 catalyst exhibited a smaller particle size correlated with a higher specific surface area. For 30Ce/MgO catalysts, 30Ce/MgO-48 also showed the highest surface area (29.3 m2/g) compared to other 30Ce/MgO catalysts. Among the 30Ce/MgO catalysts, the surface area increases in an order of 30Ce/MgO-48 > 30Ce/MgO-SG > 30Ce/MgO-18 > 30Ce/MgO-36.

2.2. Lignin Extraction

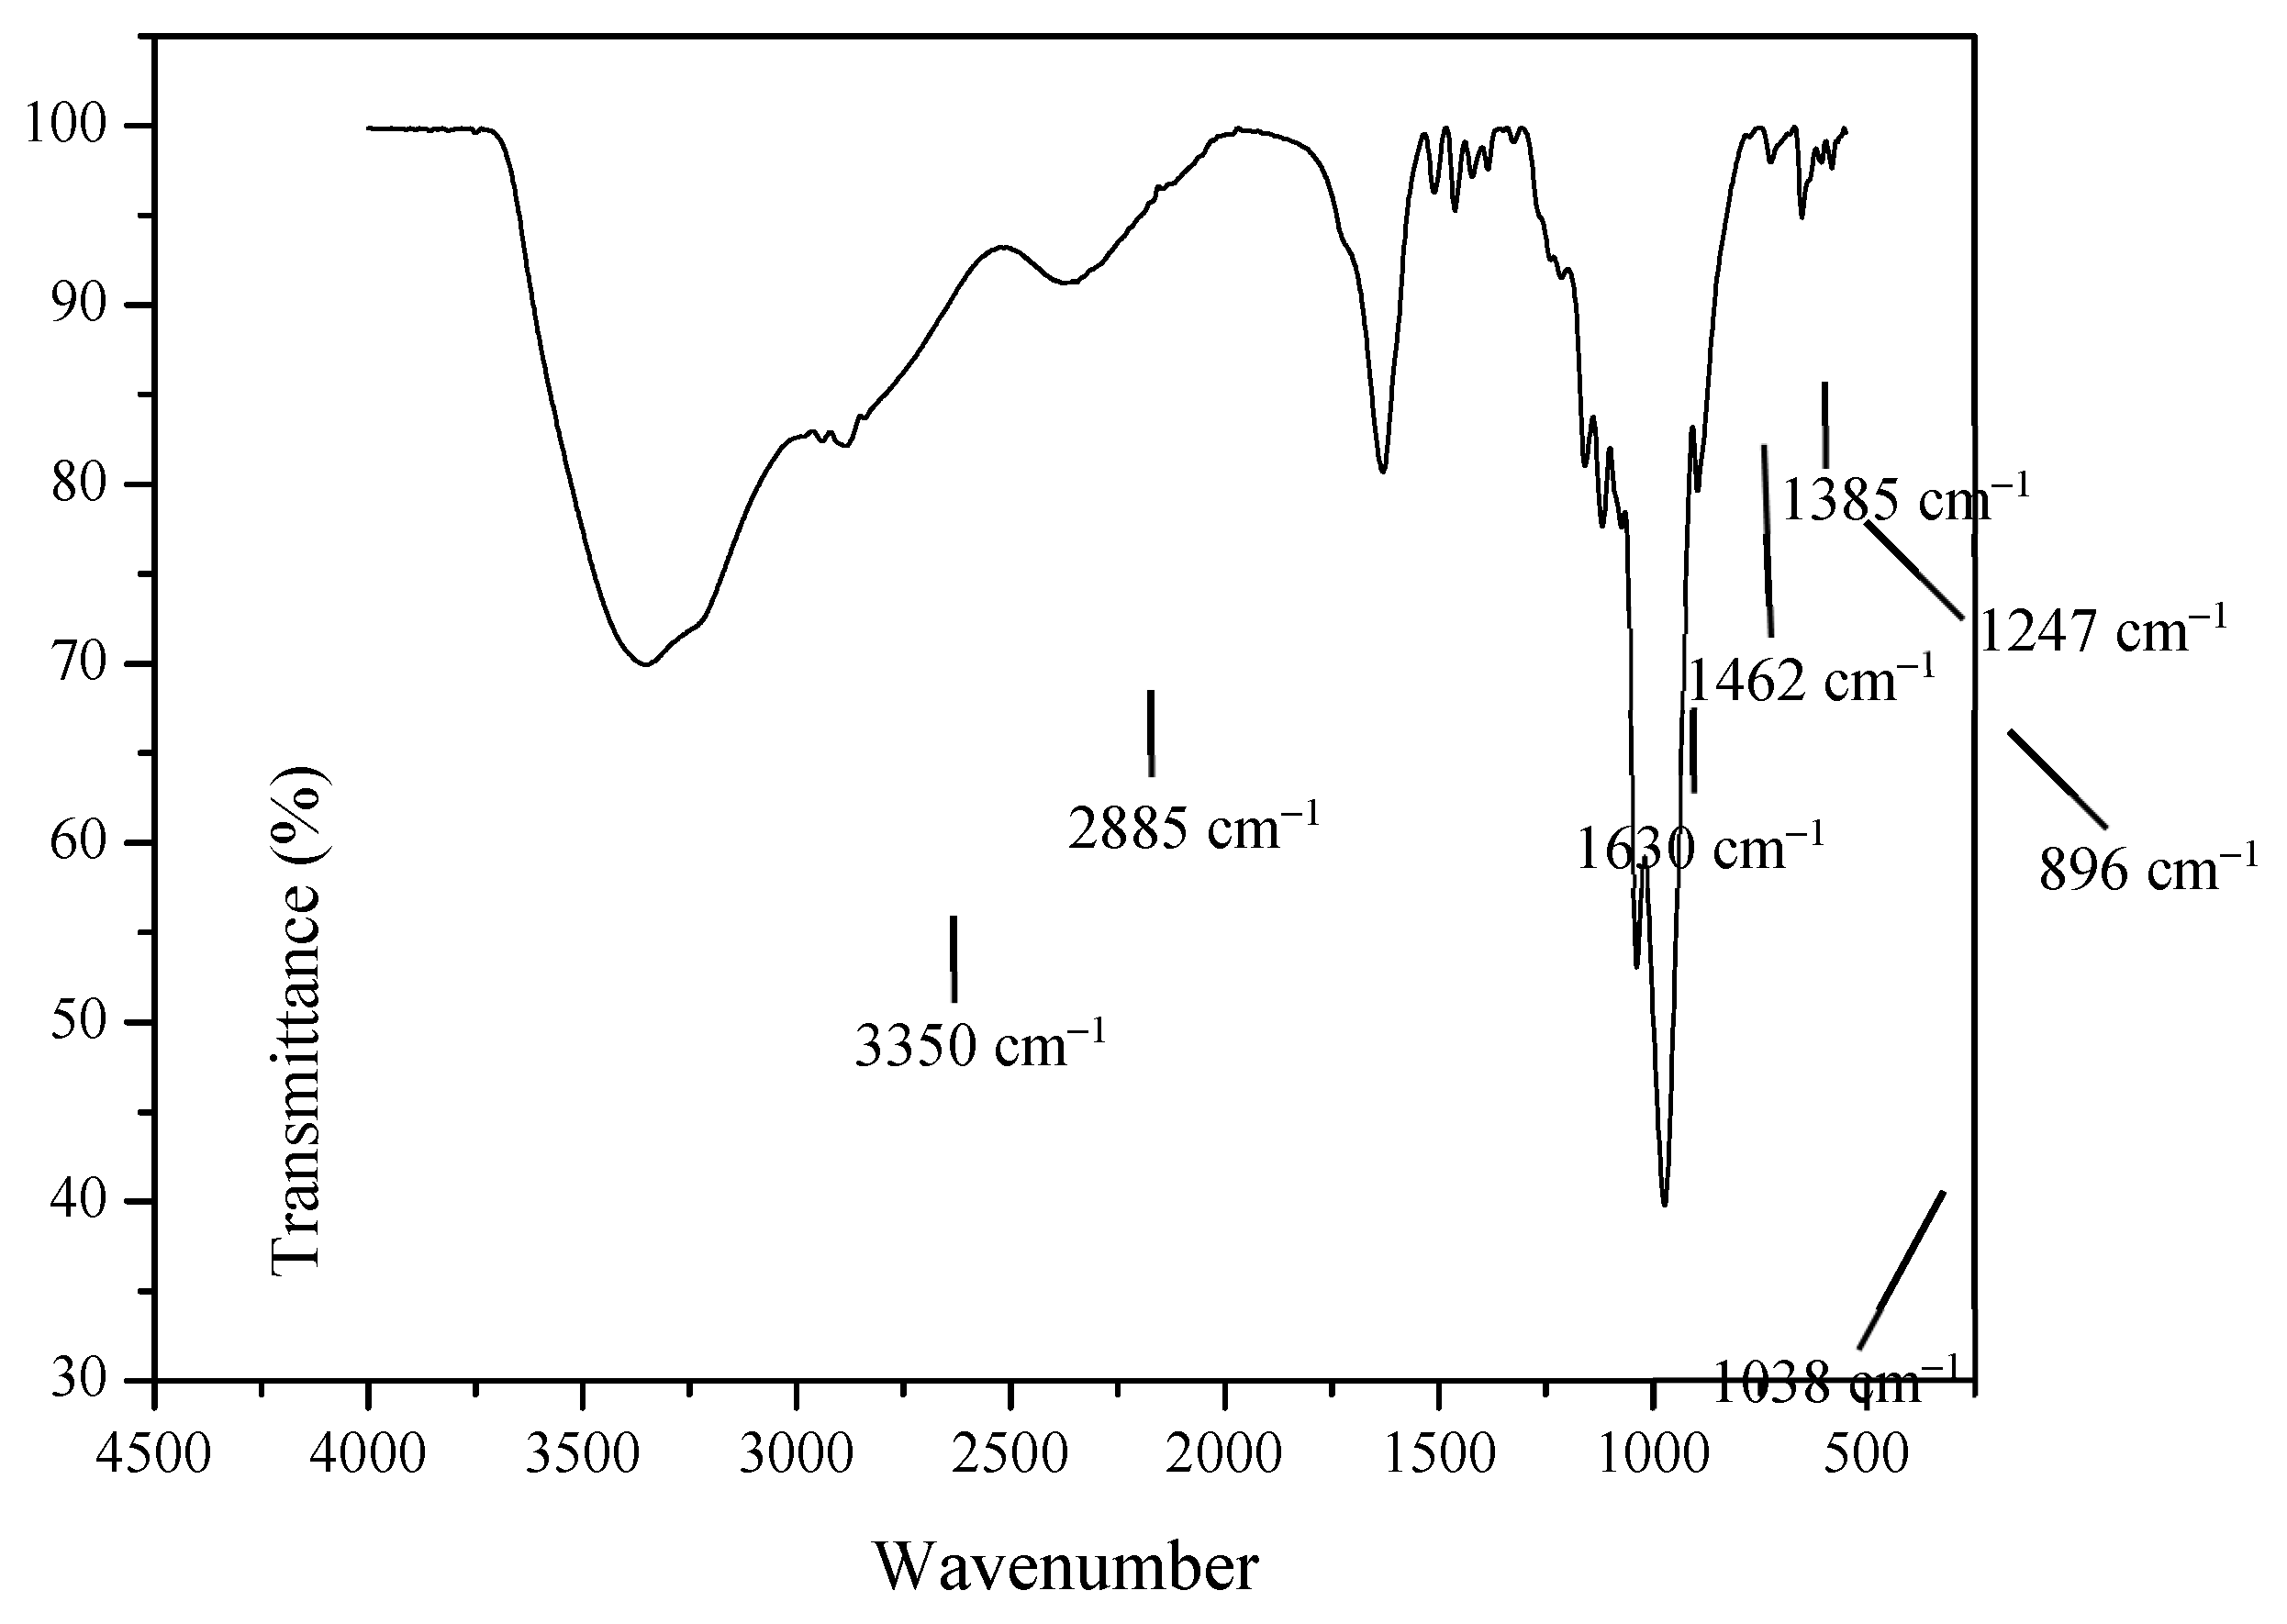
Mohamad Aini et al. [35] reported that lignin content in kenaf is 19.2–21.2%. The lignin extracted from kenaf in this work is 23.5% compared to 20.8% reported earlier by Mohamad Aini et al. [35] for lignin extraction from kraft lignin of kenaf. On the other hand, Yang et al. [36] reported that 16.7% lignin was extracted from kenaf bast using the acid hydrolysis method. Figure 5 shows the infrared spectra of the extracted lignin, while the interpretation is tabulated in Table 3 and is compared with that reported in the literature.
According to Table 3, the broad peak at 3350 cm−1 is attributed to the stretching vibration of O–H bonds [37], and the band at 2886 cm−1 is attributable to the C–H stretching vibration in the methyl and methylene groups [38]. The C–H bending vibration in the methyl groups can be allocated to the band at 1462 cm−1 [39]. The band 1650–1590 was due to C=C aromatic vibrations exhibiting the presence of lignin. The bands for C=O stretching vibration in the syringyl propane unit (S) and the guaiacyl propane unit (G) are at 1385 cm−1 and 1247 cm−1, respectively [40]. The band at 1037 cm−1 can be assigned to the C=O deformation in secondary and primary alcohol or aliphatic esters [41]. An absorption band at 897 cm−1 was assigned to C–O–C stretching at the β– (1, 4)–glycosidic linkage in cellulose [42].
Table 3. Functional group and frequency of FTIR.
IR Band (cm−1)Assignment
Literature Data[ref]Data Obtained
3500–3100[35]3350Stretching vibration of O–H bonds
2900–2800[38]2886C–H stretching vibration in the methyl and methylene groups
1650–1590[40]1630C=C aromatic vibrations
1464–1424[39]1462C–H bending vibration in the methyl groups
1272–1265[40]1247C=O stretching vibration in guaiacyl propane units (G)
1340–1330[40]1385C=O stretching vibration in syringyl propane units (S)
1130–1035[41]1038C=O deformation in secondary and primary alcohol or aliphaticesters
897–889[42]896C–O–C stretching at the β-(1, 4)-glycosidic linkage in cellulose

2.3. Catalyst Testing

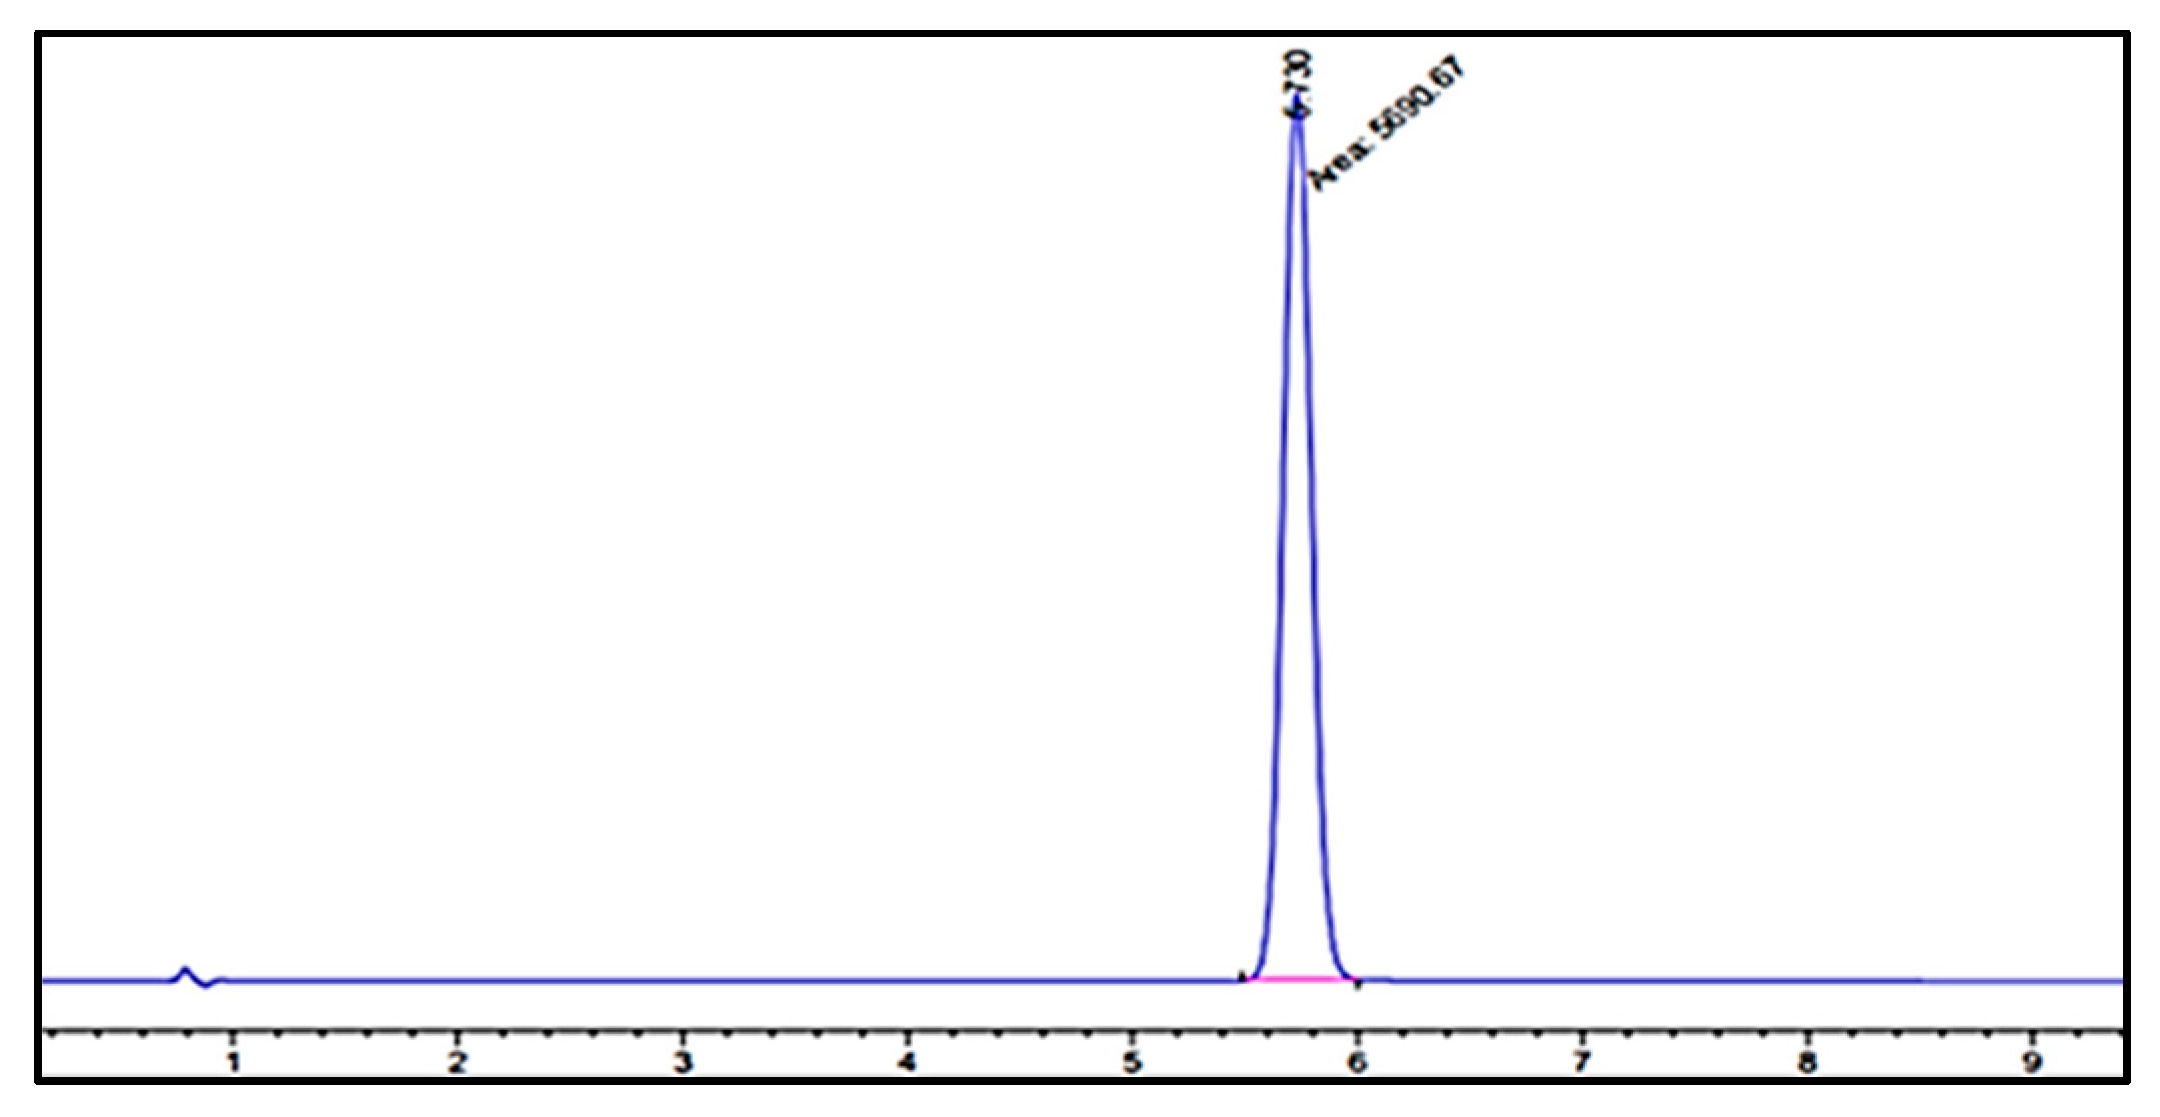
Figure 6 shows the HPLC chromatogram of vanillin standard, where it shows that the retention time of vanillin is 5.730 min. Based on this chromatogram, five different concentrations of standard vanillin were prepared for the calibration curve to allow for the quantitative determination of the vanillin produced from direct oxidation of kenaf stalks.
Figure 7 shows the calibration curve of vanillin standard at five different concentrations (1.25 × 10⁻⁴, 6.25 × 10⁻⁵, 3.125 × 10⁻⁵, 1.56 × 10⁻⁵ and 7.81 × 10⁻⁶) using HPLC. The curve was plotted to measure the peak area attained from the injected aliquot of standard vanillin solution with known concentration. The calibrated curve will be used to determine the vanillin yield quantitatively. The correlation coefficient, R2 of the best-fit line displayed at 0.9995, indicates high accuracy.
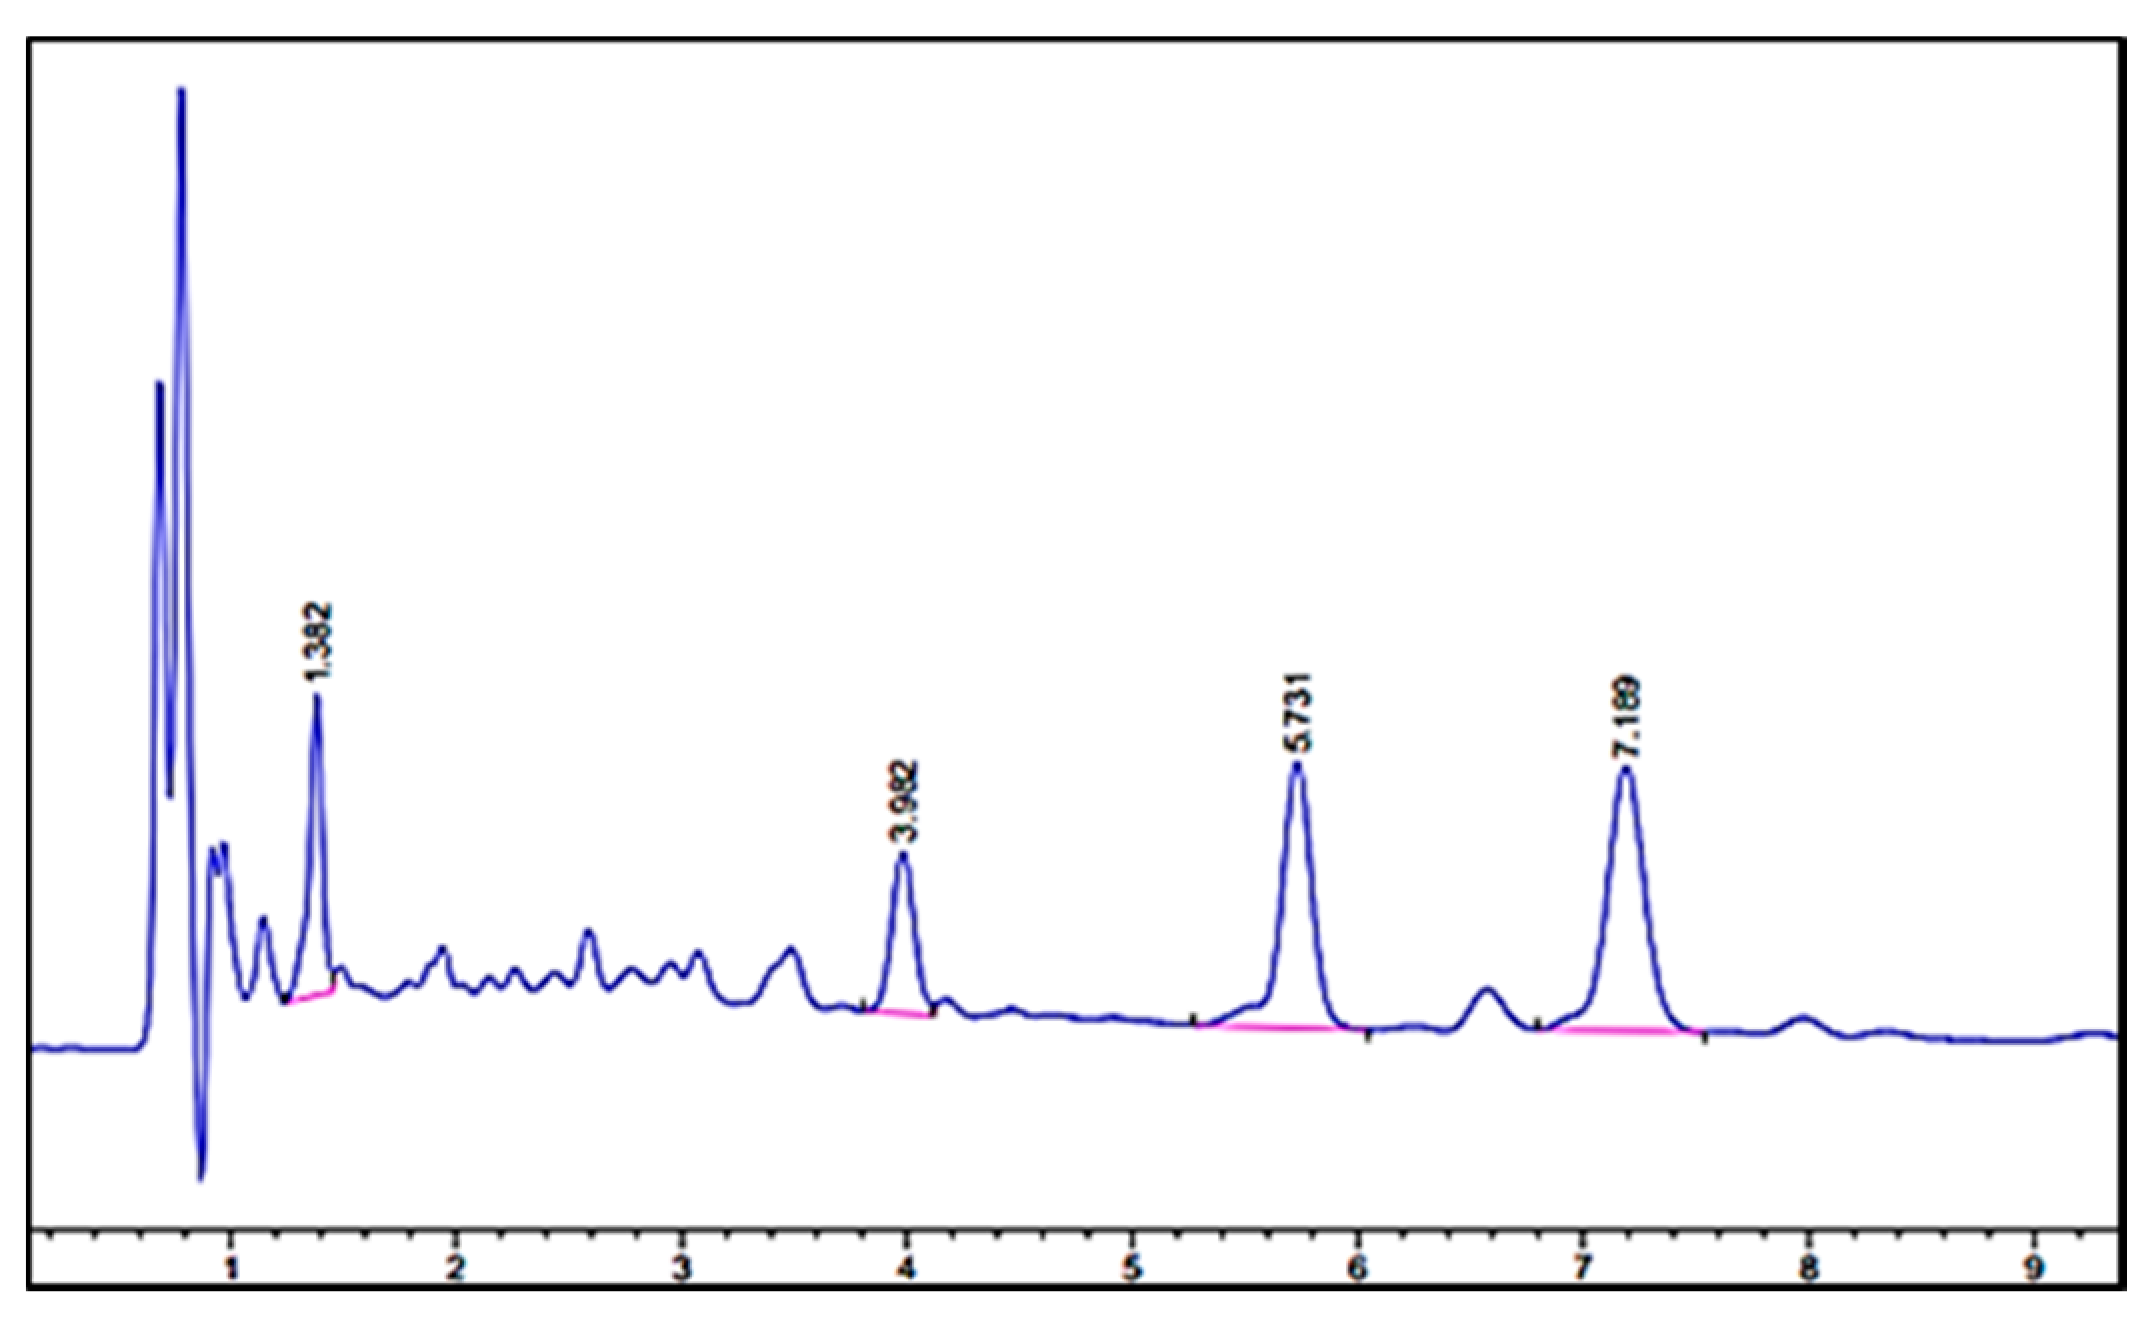
When the catalysts were tested in the direct oxidation of kenaf stalks, the liquid produced from oxidation in the presence of 30Ce/MgO-36 shows the presence of vanillin at the retention time of 5.73 min (Figure 8). However, the chromatogram also shows the presence of three other compounds at the retention time of 1.38, 3.98 and 7.18 min. The other compounds could be 4-vinylguaiacol, syringol and syringaldehyde, respectively.
Vanillin was detected in the liquid produced from direct oxidation of kenaf stalks in all MgO-supported Ce catalysts. In contrast, no vanillin was detected when MgO was used as the catalyst, which indicates that Ce is the active component responsible for the formation of vanillin. Using the linear equation derived from the calibration curve (Figure 7), the vanillin produced from direct oxidation of kenaf stalks at 180 °C and ambient pressure can be calculated. Our earlier work on converting lignin derived from pineapple leaves shows a vanillin yield of 6% at 170 °C and pressure of 15 bars by using compressed air as an oxidizing agent [43].
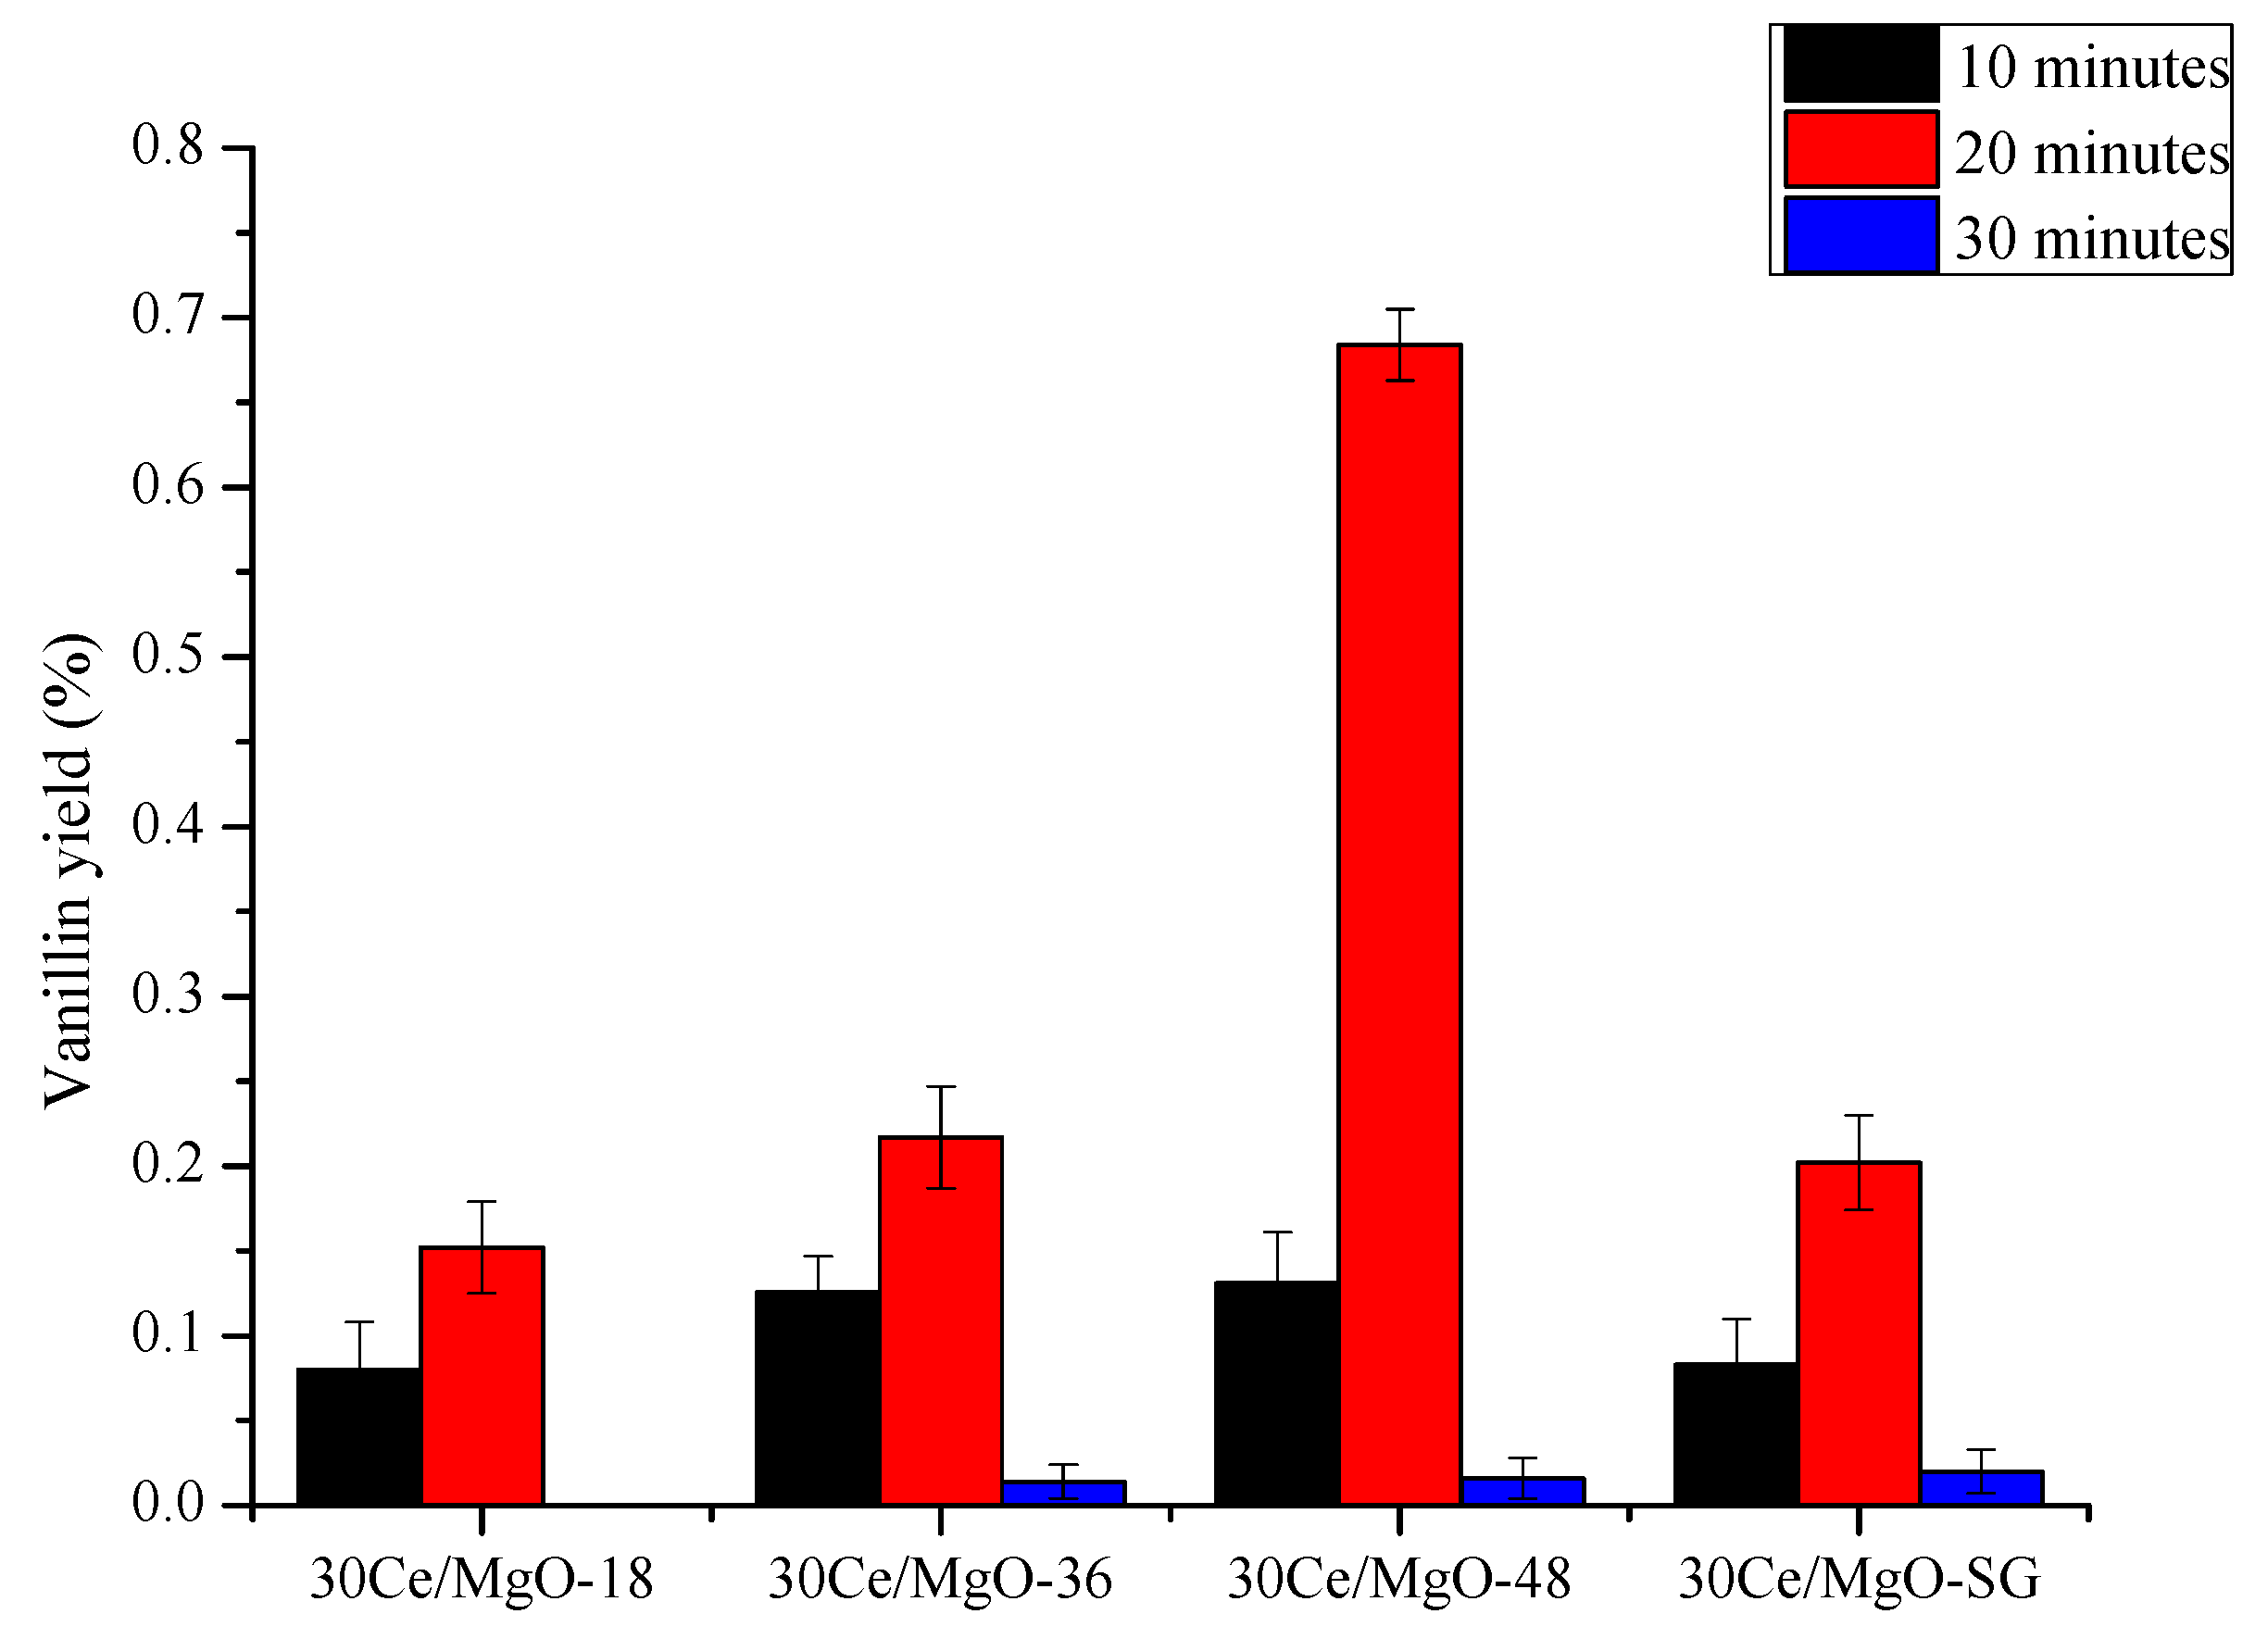
Figure 9 shows the effect of reaction time on vanillin yield. There are no significant differences in vanillin yield for all catalysts at reaction duration of 10 and 30 min. At the same time, there is an increasing trend for catalyst 30Ce/MgO-48 compared to other catalysts at a 20-minute reaction duration. The 30Ce/MgO-48 catalyst showed the highest vanillin yield of 0.684% when the reaction was performed for 20 min at 180 °C, while 30Ce/MgO-18, 30Ce/MgO-36 and 30Ce/MgO-SG gave a vanillin yield of 0.152, 0.217 and 0.202%, respectively. This is considered substantial since the vanillin is produced directly from kenaf stalks without separating the lignin from the cellulose and hemicellulose components.
Furthermore, the reaction was performed at pH 11.5, which is lower than pH 12–14 as reported by other researchers [1,10]. Direct production of vanillin has also been achieved by Chen et al. [12]. Japanese cedar wood was used as a biomass source that gives 5% vanillin yield. The CuO catalyst combined with H2O2 solution as an oxidant showed the best yield for 20 min under 180 °C. From this result, 20 min was chosen as the optimum reaction time. Das et al. [44] stated that further extension duration might lead to low product yield due to repolymerization of depolymerized lignin or over-oxidized products that form during the time while the reaction occurs. The research properties were continued to determine the effect of reaction temperature on the vanillin yield.
There was no vanillin produced using MgO catalyst; however, by using ceria loading, the presence of vanillin was detected. Nolan et al. [45] reported that ceria could be an active catalyst due to its high oxygen storage capacity, which can absorb/release oxygen under oxidizing/reducing conditions. It is related to the comparatively facile formation of O vacancies in CeO2 [46]. Several studies have investigated and confirmed the presence of peroxide species on CeO2 surfaces, but these have been solely related to adsorbed molecular oxygen [47]. Oxidation reactions continuously occur because oxidized surfaces of ceria are being provided by peroxide, which acts as an oxidant in the reaction. The low mass transfer and low concentration rate of O2 during the reaction are also being provided by H2O2 [44].
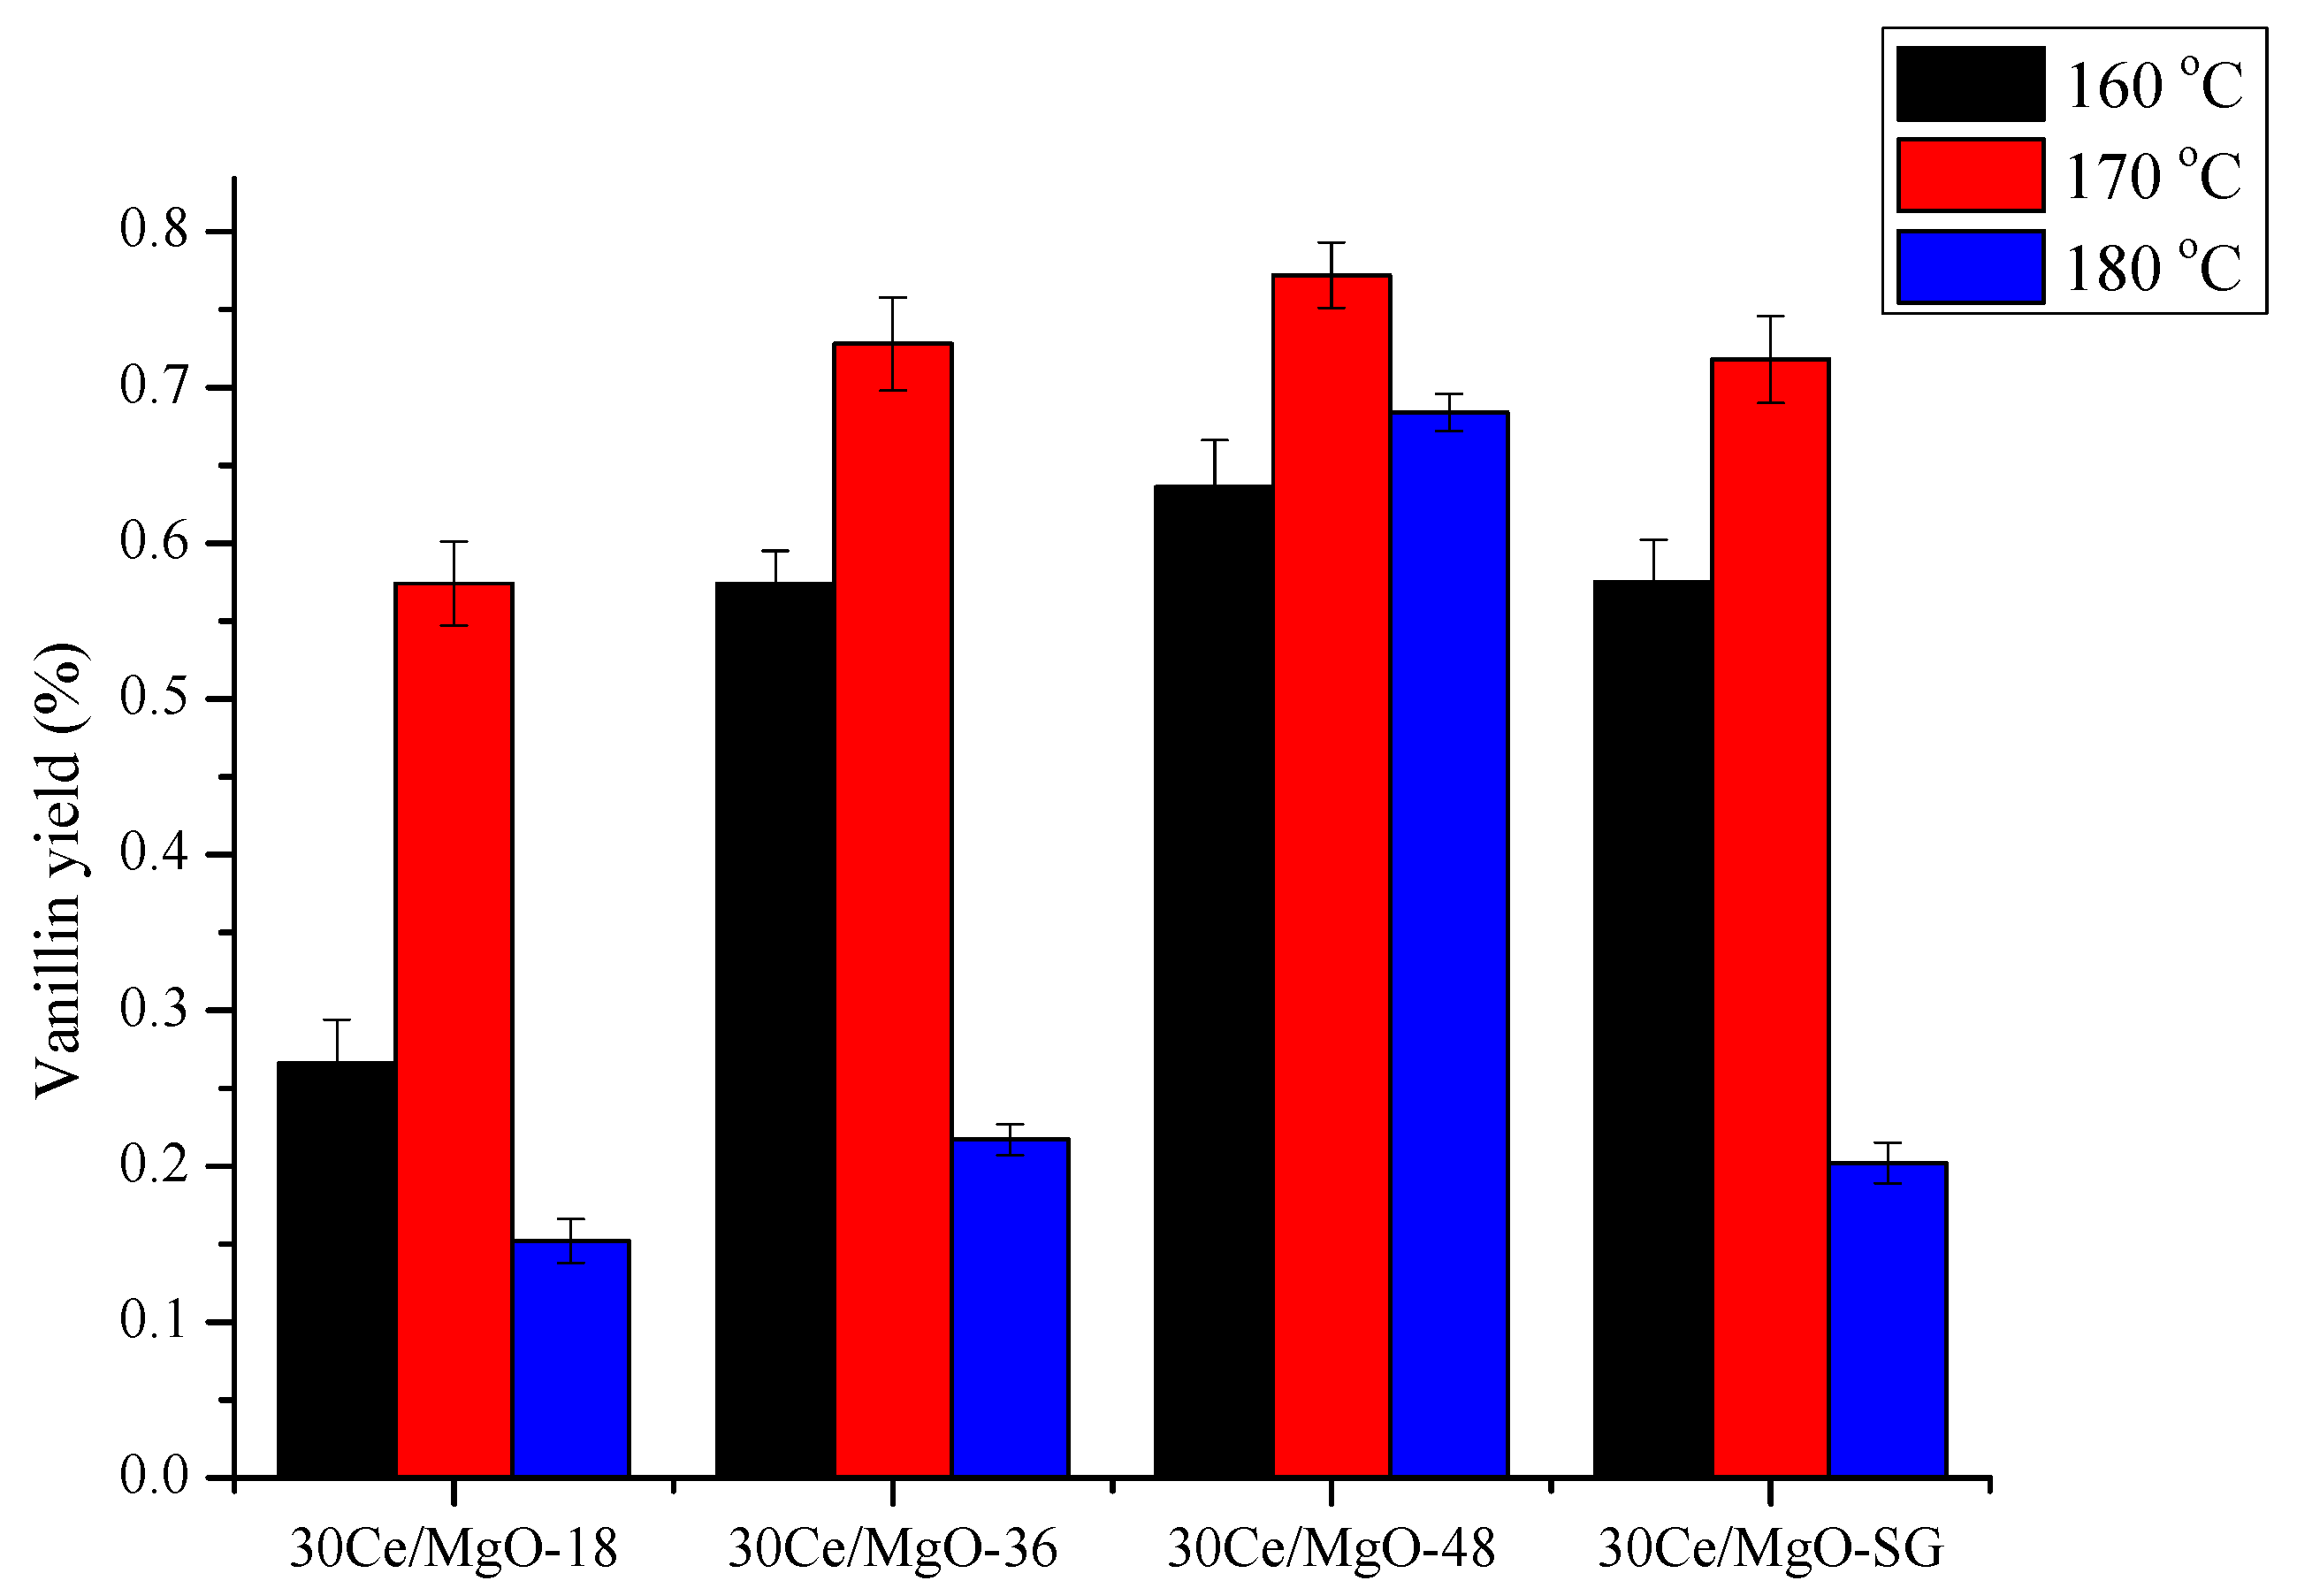
Figure 10 shows the effect of reaction temperature on vanillin yield using all the MgO-supported Ce catalysts. Vanillin yields increase with increasing reaction temperature from 160 to 170 °C using all catalysts. However, the vanillin yield decreased when the temperature was further increased to 180 °C regardless of the catalyst used, which could be attributed to the degradation of vanillin at high temperatures, as reported by Chen et al. [12]. Based on Yuting et al. [37], prolonging the reaction time did not improve the vanillin yield, which could be caused by low selectivity due to tandem reaction. According to Tarabanko et al. [48], increasing the temperature of aspen wood oxidation to more than 160 °C can give a higher yield of vanillin and syringaldehyde, while another study showed a high aromatic aldehyde yield in aspen wood oxidation when the temperature was raised from 110 °C to 160 °C [48,49].
Figure 10 shows that 170 °C reaction temperature with a 20-minute reaction time presents the high vanillin yield, which was 0.772% in the presence of 30-Ce/MgO-48 catalyst and followed by 0.728, 0.718, 0.716% for 30Ce/MgO-36, 30Ce/MgO-SG, 30Ce/MgO-18 catalysts, respectively.
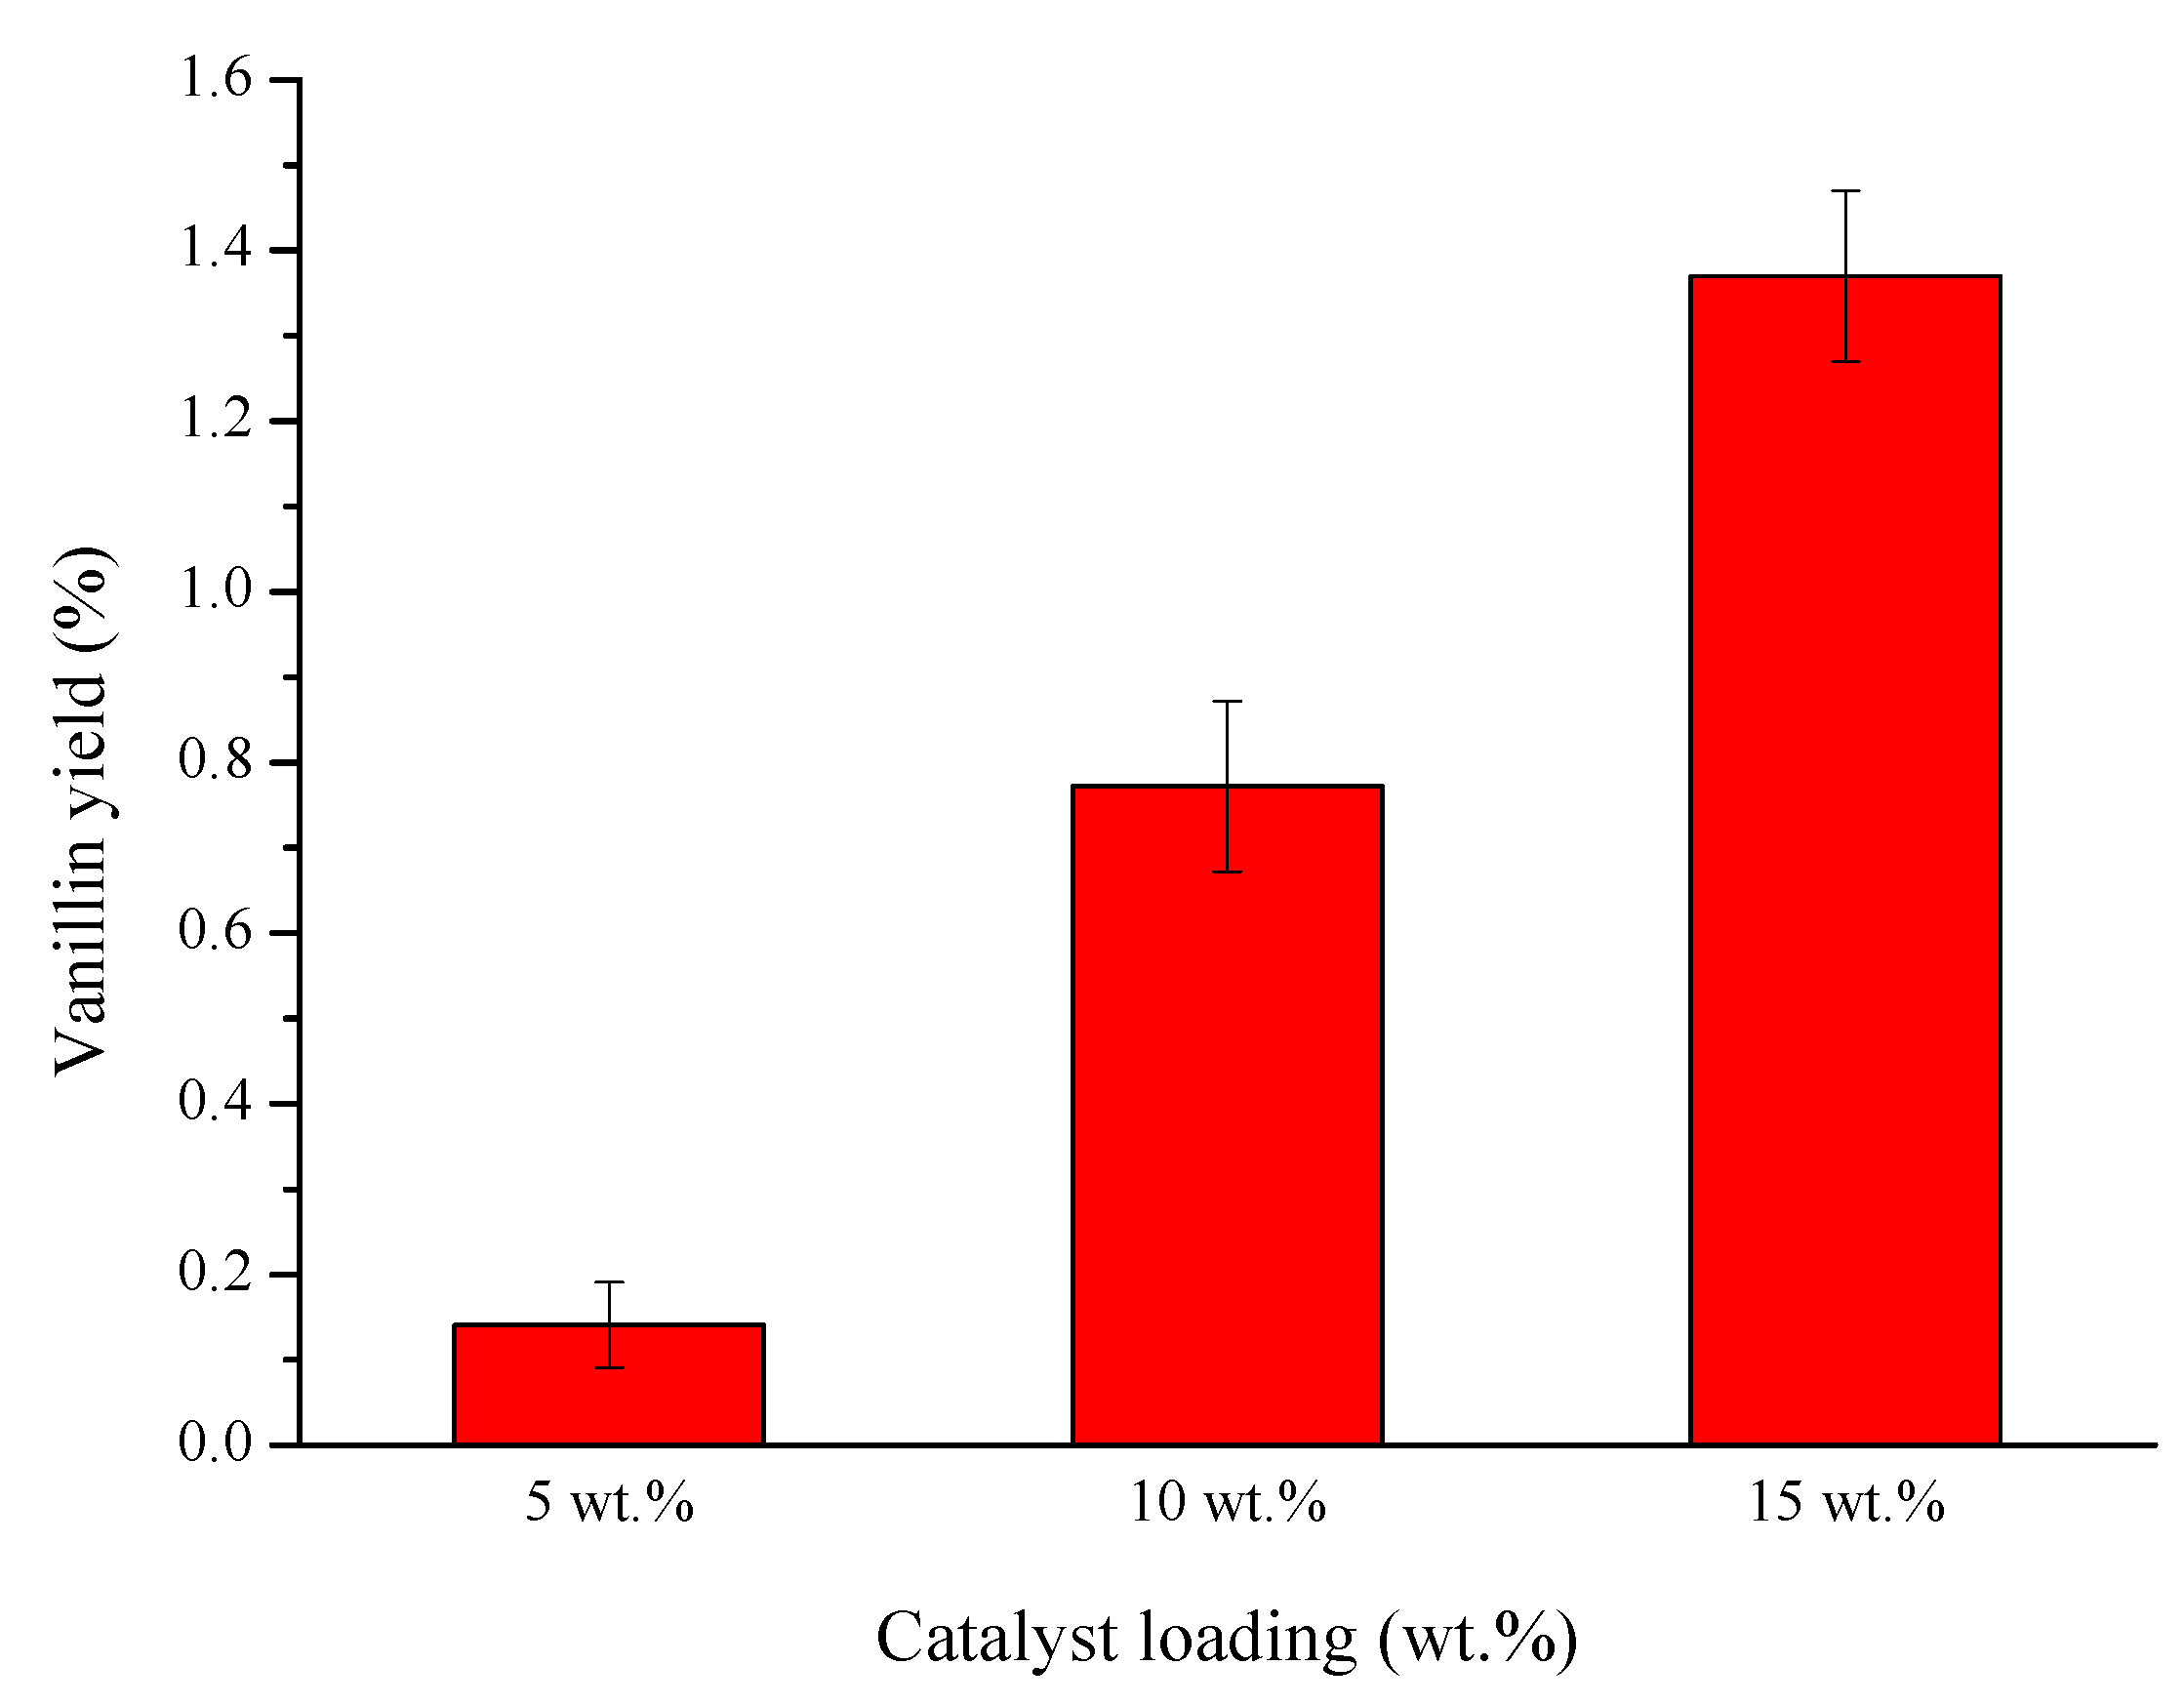
Based on the vanillin yield obtained in Figure 9 and Figure 10, 30Ce/MgO-48 shows the higher vanillin yield for reaction time and temperature. Hence, 30Ce/MgO-48 was chosen as the best catalyst for further optimization on catalyst loading with a fixed amount of biomass. Figure 11 shows the vanillin yield obtained on the different amounts (5, 10 and 15 wt.%) of 30Ce/MgO-48 catalyst loading synthesized with 2 g of kenaf dried stalks for 20 min at 170 °C under microwave heating. The result shows the increased number of yields with the increased amount of catalyst loading with vanillin yield of 0.141% (5 wt.%), 0.772% (10 wt.%) and 1.37% (15 wt.%). These were due to the higher total contact frequency of catalysts with lignin, as reported by Chen et al. [12]. In addition, higher catalyst dosage indicates a much more catalytic active center resulting in higher catalytic performance [50]. This result is also in agreement with the research carried out by Prado et al. [51], which stated that increasing catalyst loading from 1% to 20% preceded to greater vanillin yield from 0.015 to 0.22%. It is also speculated that increases in catalyst loading resulted in more active sites available to break down lignin into aromatic aldehyde products.
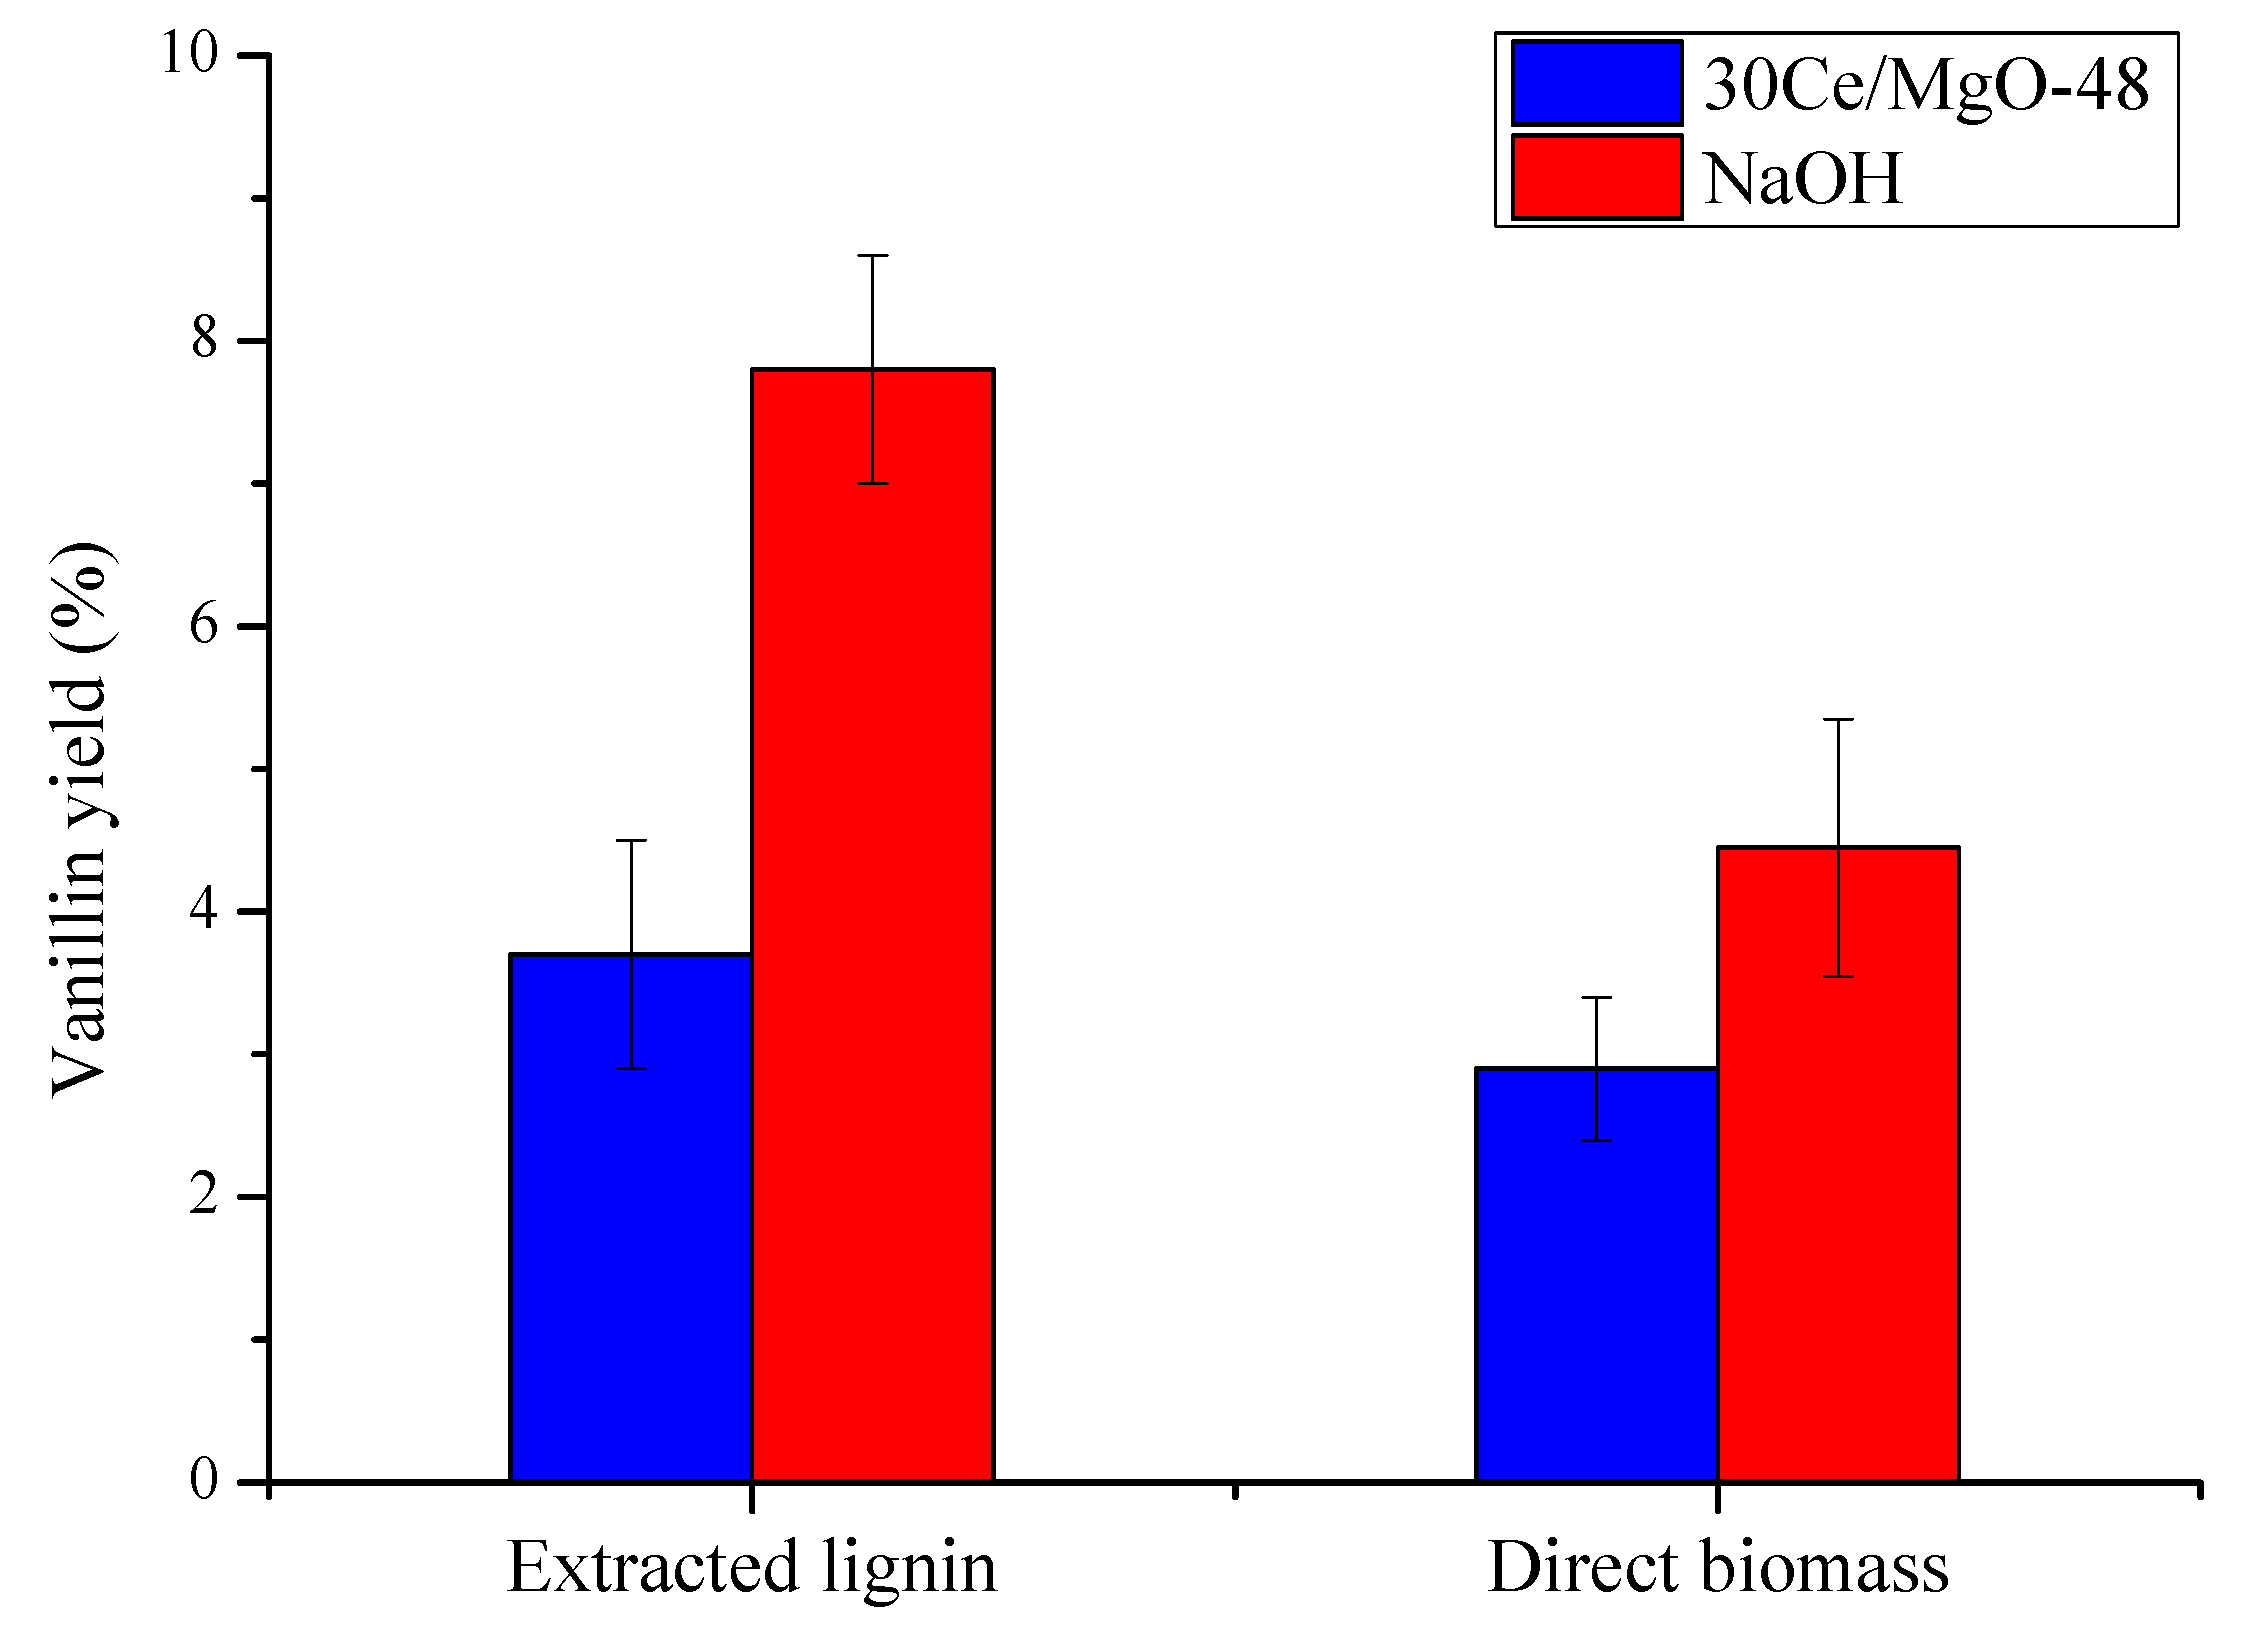
Figure 12 shows vanillin production from extracted lignin and biomass synthesized using 15 wt.% of heterogeneous and homogeneous catalyst for 20 min at 170 °C under microwave heating. The optimum operating conditions for a time, temperature and catalyst loading were chosen to synthesize the extracted lignin and direct biomass for vanillin production in the presence of heterogeneous (30Ce/MgO-48) and homogeneous (NaOH) catalysts. This study was performed to compare their catalytic performance and obtained yield on vanillin production. The vanillin yield obtained in the presence of 30CeMgO-48 as heterogeneous catalysts were 3.70% and 2.90% for oxidations of extracted lignin and the direct oxidation of biomass, respectively. On the other hand, 7.80% and 4.45% were obtained in the presence of 2N NaOH as a homogeneous catalyst for oxidations of extracted lignin and direct biomass, respectively.
Extracted lignin obtained a higher vanillin yield than direct biomass because of the isolation of lignin as an active compound for conversion to vanillin. The vanillin production is caused by the breaking down of aryl ether linkages in β-O-4 bonds and Cα-Cβ cleavage between lignin structures through the oxidation process. Compared to biomass, the oxidation process directly to biomass without separating lignin with cellulose and hemicellulose was the cause of lower vanillin yield. According to Lu et al. [52], more than 50% of aryl ether bonds (β-O-4) are contained in the lignin structure. Furthermore, the (β-O-4) bonds are a stable linkage (52–75 kcal mol−1) and require high energy for the cleavage process to occur [53]. In this regard, the use of catalysts is vital for the efficient and selective cleavage of (β-O-4) bonds because of the unique characteristics of catalysts that render them able to control the activation routes of cleavage [54]. Cleavage (β-O-4) bonds in the lignin structure from direct biomass are challenging because the lignin structure is not separated from cellulose and hemicellulose components.
As reported by previous studies, the use of supported or unsupported metal catalysts such as Pd [52], Ce [55], V [56], Ni [52], Cu [57] and Ru [58] as heterogeneous catalysts was successful in producing vanillin with high selectivity and conversion percentage. However, there are limitations during the reaction process where the reaction cannot proceed for a new turn when the lignin fragment is saturated on the catalyst’s surface. On the other hand, the homogeneous catalyst is counted as flexible a catalyst that allows them to freely contact the CAr–O bonds without high steric limitation, since the reaction occurs solely in a liquid phase. This condition results in a reduction in mass transfer limitations [59], which is one of the reasons for the high production yield of vanillin in the presence of homogeneous catalysts compared to heterogeneous catalysts. Moreover, NaOH was used as a homogeneous catalyst during the oxidation reaction. A study reported by Lopes et al. [54] stated that using Ionic Liquids (ILs) as a green framework, ground-breaking homogeneous catalysis for lignin depolymerization had been developed and it can act as a solvent and catalyst at the same time. They also stated that the cleavage of lignin ether bonds was promoted by acidic ILs approaches.
The reusability of the 30Ce/MgO-48 catalyst was determined by the repeated use of the catalyst for the direct oxidation of Kenaf stalks to vanillin production three times with the new reactants and optimized reaction conditions. After the first use, the recovered catalyst was washed with ethanol to remove the organic deposits such as unreacted biomass and derived biomass product, then dried at 100 °C for 12 h. Figure 13 shows that the 30Ce/MgO-48 catalyst is chemically stable and can be repeated for a third time with a slightly significant loss in activity compared to vanillin’s yield in the first use of catalyst. There are 0.5% yield differences between the first and second cycle with 2.90% and 2.54%, while there are no significant in yield obtained for the third cycle with 2.52% vanillin. The slight decrease in vanillin production for the second cycle may be attributed to the saturated surface of catalyst by side product of biomass, including a major lignin-like oligomers product from vanillin oxidative polymerization [60,61].

3. Materials and Methods

3.1. Catalyst Preparation

MgO was synthesized using sol-gel and hydrothermal methods. First, 1 M magnesium nitrate solution was prepared using magnesium nitrate hexahydrate (Mg(NO3)2·6H2O) salts in the sol-gel method. Then, 1 M sodium hydroxide (NaOH) was added dropwise to the magnesium nitrate solution under vigorous stirring to adjust the pH to pH 12. The mixture was stirred until a white solution was formed. Then, the white solution was dried at 120 °C for 12 h followed by calcination at 500 °C for 5 h. The sample is denoted as MgO-SG. For the synthesis of MgO under the hydrothermal method, the same procedure was repeated until the formation of a white solution. The white solution was then transferred to a Teflon-lined stainless steel hydrothermal vessel and left for crystallization at 120 °C for 18–48 h, followed by drying at 120 °C for 5 h and calcination at 500 °C for 5 h. The catalysts were denoted as MgO-18, MgO-36 and MgO-48 for 18, 36 and 48 h crystallization time. The calcined MgO was impregnated with 30 wt.% of Ce using Ce(NO3)3.6H2O via incipient wetness impregnation method. Typically, the required amount of metal salt was dissolved in a sufficient amount of distilled water before MgO was added to the solution and stirred for 3 h at room temperature. The slurry was then dried at 120 °C for 12 h and calcined at 500 °C for 5 h.

3.2. Catalyst Characterization

The crystallinity of the MgO-supported Ce catalysts was determined using Bruker X-ray diffraction (XRD) model X’Pert3 Powder and Empyrean (PANanalytical, Billerica, MA, USA). The catalysts were recorded on an X-ray Diffractometer system between 2θ value of 20–80° with 227 s/step exposure time and 0.105°/step step size. Surface area and pore size of catalysts were analyzed using Brunauer-Emmett-Teller (BET) (Micromeritics ASAP 2020, Norcross, GA, USA). The catalysts were degassed at 200 °C for 24 h, prior to N2 adsorption measurement at −77 °C. The crystallite size of synthesized MgO particles was determined according to Scherrer’s equation: D = kλ/βcosθ. Crystallite size were analyzed using HighScore Plus software (version 3.0), Malvern, UK with X-ray wavelength of CuKα radiation at λ = 1.54 A°, where θ is Bragg angle. β is the full width at half maximum in radians was taken corresponding to the 2θ value at plane (100) and (200). The unknown shape factor, k, was assumed as 0.89, the reflecting peak at 2θ was chosen for the entire sample.

3.3. Lignin Extraction and Characterization

Dried kenaf stalks were broken into 10 cm lengths before being grinded into small pieces using a grinder. The extractive compounds such as protein, waxes, resin, fatty acids and lipid were removed from the dried kenaf stalks using a mixture of ethanol and water with (2:1) ratio via Soxhlet extraction for 8 h. Extracted sample was dried in the oven for 24 h at 60 °C. The dried residue was then soaked in an NaOH solution for 5 min with a sample to the solvent ratio (6: 100 g/mL). The mixture was stirred and placed into a hydrothermal pressure vessel prior for the cooking process at 121 °C for 2 h to break the bonds between lignin and hemicellulose. Heated mixture left to cool at room temperature before the separation of solid residue through filtration. The dark brown sample fluid (black liquor) was kept overnight at 4 °C (refrigerator). Black liquor was acidified by H3PO4 (20%) at pH 2. Lignin precipitates into semi-solid form at around pH 14. The precipitated lignin was then vacuum filtrated using a 0.45 µm pore filter and washed using distilled water and 20% H3PO4. The isolated was dried in an oven at 55 °C for 48 h [43]. The sample was characterized using FTIR (Perkin Elmer Frontier 01, Cheshire, UK) between 500 and 4000 cm−1 for 50 scans with a resolution of 4 cm−1.

3.4. Catalytic Oxidation of Raw Kenaf

The performance of the catalyst was tested for the direct oxidation of kenaf stalks and extracted lignin to vanillin under microwave irradiation. Two grams of dried kenaf stalks and 1.06 g of dried lignin were soaked in 20 mL of 0.01 N NaOH solution in a screw-cap test tube for 24 h before it was transferred to a Teflon tube. Then, 5 wt.%–15 wt.% of catalyst and 1 mL of H2O2 were added to the mixture and the pH was adjusted to pH 11.5 and stirred at 600 rpm for 10 s at room temperature using a magnetic stirrer before the mixture was heated in the 300W of microwave heating (Milestone Srl, Milan, Italy, MicroSYNTH MA143) at 160–200 °C for 10–30 min. Then, the mixture was cooled to room temperature and filtered through filter paper to remove the insoluble materials. The residue was washed with 20 mL of 0.01 N NaOH solution twice. The same procedure was performed by changing the heterogeneous catalyst to a homogeneous sodium hydroxide catalyst to study vanillin production for direct oxidation from Kenaf stalks and extracted lignin. According to the obtained result, 15 wt.% was chosen as optimized catalyst loading for further study using 2N of sodium hydroxide catalyst. The filtrate was transferred to a glass test tube with a cap. At the same time, the catalyst residue was washed several times with ethanol to further investigate catalyst reusability under optimized reaction conditions, followed by a drying process under an oven at 100 °C for 2 h. Concentrated hydrochloric acid (37%) was then added to the filtrate at a 1:2 ratio. The mixture was then agitated using a vortex agitator at 5000 rpm for 15 s, followed by centrifugation for 15 min at 1000 rpm. Next, ethyl acetate was added to the supernatant at a 1:1 ratio. The low molecular weight compounds were extracted into the organic phase, including vanillin. The mixture was agitated for 60 s at 5000 rpm followed by centrifugation at 1000 rpm for 5 min, after which the mixture separated into two phases. The upper phase was transferred to a vial. Excess solvent was removed using a rotary evaporator at 50 °C and 400 mbar [12].
The brownish solution containing vanillin was analyzed using Agilent High Performance Liquid Chromatography (HPLC) with a UV-VIS detector at a wavelength of 280 nm. The HPLC (Agilent 1200 series, Santa Clara, CA, USA) was equipped with Hypersil C18 column, Santa Clara, CA, USA (particle size of 5 μm, 150 × 4.6 mm inside diameter). The column temperature was set at 35 °C and injection volume of 20 μL with a mixture of acetonitrile: water (1:8 v/v) containing 1% acetic acid used as the mobile phase at a flow rate of 2 mL min−1. Vanillin (Sigma-Aldrich, purity 99.7%, Darmstadt, Germany) was used as standard [61].

4. Conclusions

Vanillin was successfully produced from direct oxidation of kenaf stalks and lignin extract from kenaf stalks under microwave heating using H2O2 as an oxidizing agent in the presence of MgO-supported Ce catalysts at pH 11.5. The vanillin yield of 3.70% was achieved from extracted lignin using 30Ce/MgO-48 catalyst at 170 °C for 20 min with catalyst loading of 15%, while direct oxidation from kenaf stalks 2.90%. On the other hand, the highest vanillin was obtained when NaOH was used as a homogeneous catalyst with 7.80% and 4.45% for oxidations of extracted lignin and direct biomass, respectively. The heterogeneous 30Ce/MgO-48 catalyst is chemically stable and can be repeated use for 3 times.

Supplementary Materials

The following are available online at https://www.mdpi.com/article/10.3390/catal11121449/s1, Figure S1. X-ray diffraction patterns of MgO. (a) MgO-18; (b) MgO-36; (c) MgO-48; (d) MgO-SG, Figure S2. X-ray diffraction patterns of 30Ce/MgO. (a) 30Ce/MgO-18; (b) 30Ce/MgO-36; (c) 30Ce/MgO-48; (d) 30Ce/MgO-SG, Figure S3. Gas-chromatogram of degradation wood product.

Author Contributions

Conceptualization, A.R.; methodology, N.A.S.I.K.A.; software, A.R.; validation, A.R. and L.J.W.; formal analysis, N.A.S.I.K.A.; investigation, N.A.S.I.K.A.; resources, A.R. and L.J.W.; data curation, N.A.S.I.K.A.; writing—original draft preparation, N.A.S.I.K.A.; writing—review and editing, A.R.; visualization, A.R. and L.J.W.; supervision, A.R. and L.J.W.; project administration, A.R.; funding acquisition, A.R. and L.J.W.; All authors have read and agreed to the published version of the manuscript.

Funding

This research was funded by Malaysian Ministry of Higher Education under Fundamental Research Grant Scheme (FRGS/1/2020/STG04/UTP/02/2, cost center 015LC0-145) and MURATA SCIENCE FOUNDATION, grant no. 015ME0-026.

Data Availability Statement

Data is contained within the article or Supplementary Material.

Acknowledgments

The authors would like to thank Yayasan Universiti Teknologi PETRONAS for the research grants awarded to conduct the research and Universiti Teknologi PETRONAS for awarding Graduate Research Assistantship to Ms Nur Akila Syakida Idayu Khairul Anuar.

Conflicts of Interest

The authors declare no conflict of interest.

References

  1. Maxence, F.; Bernard, B.; Sylvain, C. Vanillin production from lignin and its use as a renewable chemical. ACS Sustain. Chem. Eng. 2016, 4, 35–46. [Google Scholar]
  2. Akriti, A.; Nirmala, K.; Soumitra, B. Derivatives and applications of lignin—An insight. Scitech J. 2014, 1, 30–36. [Google Scholar]
  3. Nicholas, J.W.; Melinda, J.M.; Arjan, N. Vanillin. Phytochemistry 2003, 63, 505–515. [Google Scholar]
  4. Pesach, L.; Matthew, V.D.; Alex, V.D. Pollination of vanilla and evolution in the Orchidaceae. Lindleyana 2006, 75, 926–929. [Google Scholar]
  5. Pinto, P.; Da Silva, E.A.B.; Rodrigues, A.E. Lignin as source of fine chemicals: Vanillin and syringaldehyde. Methods Mol. Biol. 2012, 381–420. [Google Scholar]
  6. Alireza, S.; Sepideh, M.R.; Ali, G. Oxidative production of vanillin from industrial lignin using oxygen and nitrobenzene: A comparative study. Int. J. Farming Appl. Sci. 2013, 2, 1165–1171. [Google Scholar]
  7. Donostia, S.S. Lignin extraction, purification & depolymerization study. Scitech J. 2012, 1, 30–36. [Google Scholar]
  8. Zakzeski, J.; Bruijnincx, P.C.A.; Jongerius, A.L.; Weckhuysen, B.M. The catalytic valorization of lignin for the production of renewable chemicals. Chem. Rev. 2010, 110, 3552–3599. [Google Scholar] [CrossRef] [PubMed]
  9. Sales, F.G.; Maranhão, L.C.; Filho, N.M.L.; Abreu, C.A. Experimental evaluation and continuous catalytic process for fine aldehyde production from lignin. Chem. Eng. Sci. 2007, 62, 5386–5391. [Google Scholar] [CrossRef]
  10. Araújo, J.; Grande, C.; Rodrigues, A.E. Vanillin production from lignin oxidation in a batch reactor. Chem. Eng. Res. Des. 2010, 88, 1024–1032. [Google Scholar] [CrossRef]
  11. Valery, E.T.; Konstantin, L.K.; Ekaterina, A.S.; Nikolay, T.; Yulia, V.C.; Olga, V.B.; Boris, N.K.; Laurent, D. Processing pine wood into vanillin and glucose by sequential catalytic oxidation and enzymatic hydrolysis. J. Wood Chem. Technol. 2016, 37, 43–51. [Google Scholar]
  12. Chen, Q.; Masakazu, K.; Keiichiro, K.; Kanade, T.; Suguru, O.; Takashi, W. direct production of vanillin from wood particles by copper oxide–peroxide reaction production of vanillin from wood particles by copper oxide–peroxide reaction. ACS Sustain. Chem. Eng. 2017, 5, 11551–11557. [Google Scholar]
  13. Chaudhary, R.; Dhepe, P.L. Solid base catalyzed depolymerization of lignin into low molecular weight products. Green Chem. 2017, 19, 778–788. [Google Scholar] [CrossRef]
  14. Long, J.; Zhang, Q.; Wang, T.; Zhang, X.; Xu, Y.; Ma, L. An Efficient and Economical Process for Lignin Depolymerization in Biomass-derived Solvent Tetrahydrofuran. Bioresour. Technol. 2014, 154, 10–17. [Google Scholar] [CrossRef]
  15. Biswas, B.; Kumar, A.; Krishna, B.B.; Bhaskar, T. Effects of solid base catalysts on depolymerization of alkali lignin for the production of phenolic monomer compounds. Renew. Energy 2021, 175, 270–280. [Google Scholar] [CrossRef]
  16. Ververis, C.; Georghiou, K.; Christodoulakis, N.; Santas, P.; Santas, R. Fiber Dimensions, Lignin and Cellulose Content of Various Plant Materials and Their Suitability for Paper Production. Ind. Crops Prod. 2004, 19, 245–254. [Google Scholar] [CrossRef]
  17. Badr, M.M.; Mobasherpoura, I.; Marzban, E.R.; Mortazavic, G. Synthesis of cubic MgO nanostructure by an easy hydrothermal-calcinations method. J. Ceram. Process. Res. 2014, 15, 88–92. [Google Scholar]
  18. Wahab, R.; Ansari, S.; Dar, M.; Kim, Y.S.; Shin, H.S. Synthesis of magnesium oxide nanoparticles by sol-gel process. Mater. Sci. Forum 2007, 558–559, 983–986. [Google Scholar] [CrossRef]
  19. Bing, W.; Xingaoyuan, X.; Ren, H.; Zhi, Y.H. Preparation of MgO nanocrystals and catalytic mechanism on phenol ozonation. RSC Adv. 2017, 7, 43464–43473. [Google Scholar]
  20. Li, X.; Xiao, W.; He, G.; Zheng, W.; Yu, N.; Tan, M. Pore size and surface area control of MgO nanostructures using a surfac-tant-templated hydrothermal process: High adsorption capability to azo dyes. Colloids Surfaces A Physicochem. Eng. Asp. 2012, 408, 79–86. [Google Scholar] [CrossRef]
  21. Widiyandari, H.; Sukmawati, A.N.; Sutanto, S.; Yudha, C.; Purwanto, A. Synthesis of LiNi0.8Mn0.1Co0.1O2 cathode material by Hydrothermal Method for High Energy Density Lithium Ion Batery. In Proceedings of the 9th International Conference on Physics and Its Applications: Journal of Physics, Surakarta, Indonesia, 14 August 2019. [Google Scholar]
  22. Wang, J.A.; Novaro, O.; Bokhimi, X.; López, T.; Gómez, R.; Navarrete, J.; Llanos, M.E.; López-Salinas, E. Structural defects and acidic and basic sites in Sol−Gel MgO. J. Phys. Chem. B 1997, 101, 7448–7451. [Google Scholar] [CrossRef]
  23. Ahmed, S. Development of Modified Si-MCM-41 and Studies on Its Behaviour for CO2 Adsorption. Ph.D. Thesis, Universiti Teknologi PETRONAS, Seri Iskandar, Malaysia, 2014. [Google Scholar]
  24. Li, Z.P.; Wan, Y.Y.; Ji, F.W.; Jun, C.; Chuan, G.F.; Qian, F.Z. Low temperature synthesis of magnesium oxide and spinel powders by a Sol-gel Process. Mater. Res. 2010, 13, 339–343. [Google Scholar]
  25. Krishnakanth, R.; Jayakumar, G.; Irudayaraj, A.A.; Raj, A.D. Structural and magnetic properties of NiO and Fe-doped NiO nanoparticles synthesized by chemical co-precipitation method. Mater. Today Proc. 2016, 3, 1370–1377. [Google Scholar] [CrossRef]
  26. Setoudeh, N.; Zamani, C.; Sajjadnejad, M. Mechanochemical synthesis of nanostructured MgXNi1−XO compound by Mg-NiO mixture. Mater. Sci. 2017, 50, 51–59. [Google Scholar]
  27. Bindu, P.; Thomas, S. Estimation of lattice strain in ZnO nanoparticles: X-Ray peak profile analysis. J. Theory Appl. Phys. 2014, 8, 123–134. [Google Scholar] [CrossRef] [Green Version]
  28. Soo-Min, P.; Yoon-Chae, N.; Chunghee, N. Effects of hydrothermal treatment duration on morphology of WO3 nanostructures. J. Nanosci. Nanotechnol. 2017, 17, 7719–7722. [Google Scholar]
  29. Chary, K.V.; Naresh, D.; Vishwanathan, V.; Sadakane, M.; Ueda, W. Vapour phase hydrogenation of phenol over Pd/C catalysts: A relationship between dispersion, metal area and hydrogenation activity. Catal. Commun. 2007, 8, 471–477. [Google Scholar] [CrossRef]
  30. Roy, M.; Ghosh, S.; Naskar, M.K. Synthesis of morphology controllable porous Co3O4 nanostructures with tunable textural properties and their catalytic application. Dalton Trans. 2014, 43, 10248–10257. [Google Scholar] [CrossRef]
  31. Matthias, T.; Katsumi, K.; Alexander, V.N.; James, P.O.; Francisco Rodriguez, E.R.; Jean, R.; Kenneth, S.W.S. Physisorption of gases, with special reference to the evaluation of surface area and pore size distribution (IUPAC Technical Report). Pure Appl. Chem. 2015, 87, 1051–1069. [Google Scholar]
  32. Zhang, H.; Hu, J.; Xie, J.; Wang, S.; Cao, Y. A solid-state chemical method for synthesizing MgO nanoparticles with superior adsorption properties. RSC Adv. 2019, 9, 2011–2017. [Google Scholar] [CrossRef] [Green Version]
  33. Chowdhury, I.H.; Bose, P.; Mandal, S.; Naskar, M.K. Effect of anion type on the synthesis of mesoporous nanostructured MgO, and its excellent adsorption capacity for the removal of toxic heavy metal ions from water. RSC Adv. 2016, 6, 6038–6047. [Google Scholar] [CrossRef]
  34. Sui, C.; Xing, L.; Cai, X.; Wang, Y.; Zhou, Q.; Li, M. Co-supported CeO2Nanoparticles for CO catalytic oxidation: Effects of different synthesis methods on catalytic performance. Catalysts 2020, 10, 243. [Google Scholar] [CrossRef] [Green Version]
  35. Mohamad Aini, N.A.; Othman, N.; Hussin, M.H.; Sahakaro, K.; Hayeemasae, N. Effect of extraction methods on the mo-lecular structure and thermal stability of kenaf (Hibiscus cannabinus core) biomass as an alternative bio-filler for rubber composites. Int. J. Biol. Macromol. 2020, 154, 1255–1264. [Google Scholar] [CrossRef] [PubMed]
  36. Yang, S.; Wei, J.; Yuanming, Z.; He, W.; Fangwei, Z.; Kai, Y.; Guangting, H. A novel process of nanocellulose extraction from Kenaf Bast. Mater. Res. Express 2018, 5. [Google Scholar]
  37. Yuting, Z.; Yuhe, L.; Wei, L.; Jing, L.; Xiangbo, S.; Lungang, C.; Chenguang, W.; Bert, F.S.; Longlong, M. complementing vanillin and cellulose production by oxidation of lignocellulose with stirring control. ACS Sustain. Chem. Eng. 2020, 8, 2361–2374. [Google Scholar]
  38. Khalil, H.P.A.; Ismail, H.; Rozman, H.D.; Ahmad, M.N. The Effect of acetylation on interfacial shear strength between plant fiber and various matrices. Eur. Polym. J. 2001, 37, 1037–1045. [Google Scholar] [CrossRef]
  39. Rodrigues, J.; Faix, O.; Pereira, H. Determination of lignin content of Eucalyptus globulus wood using FTIR spectroscopy. Holzforsch 1998, 52, 46–50. [Google Scholar] [CrossRef]
  40. Hassan, N.S.; Badri, K.H. Lignin recovery from alkaline hydrolysis and glycerolysis of oil palm fiber. In Proceedings of the 2014 Universiti Kebangsaan Malaysia, Faculty of Science and Technology 2014 Postgraduate Colloquium, Selangor, Malaysia, 9–11 April 2014. [Google Scholar]
  41. Zhao, J.; Xiuwen, W.; Hu, J.; Liu, Q.; Shen, D.; Xiao, R. Thermal degradation of softwood lignin and hardwood lignin by TG-FTIR and Py-GC/MS. Polym. Degrad. Stab. 2014, 108, 133–138. [Google Scholar] [CrossRef]
  42. Mohd Warid, M.N.; Ariffin, H.; Hassan, M.A.; Shirai, Y. Optimization of Superheated Steam Treatment to Improve Surface Modification of Oil Palm Biomass Fiber. BioResources 2016, 11, 5780–5796. [Google Scholar] [CrossRef] [Green Version]
  43. Haridass, K. Synthesis of Renewable Vanillin from Pineapple Leaves Lignin. In Final Year Project Dissertation, Degree; Universiti Teknologi PETRONAS: Seri Iskandar, Malaysia, 2018. [Google Scholar]
  44. Das, L.; Xu, S.; Shi, J. Catalytic oxidation and depolymerization of lignin in aqueous ionic liquid. Front. Energy Res. 2017, 5, 5. [Google Scholar] [CrossRef]
  45. Nolan, M.; Fearon, J.E.; Watson, G.W. Oxygen vacancy formation and migration in ceria. Solid State Ion. 2006, 177, 3069–3074. [Google Scholar] [CrossRef]
  46. Keating, P.R.; Scanlon, D.O.; Watson, G.W. The nature of oxygen states on the surfaces of CeO2 and La-doped CeO2. Chem. Phys. Lett. 2014, 608, 239–243. [Google Scholar] [CrossRef] [Green Version]
  47. Gu, T.; Liu, Y.; Weng, X.; Wang, H.; Wu, Z. The enhanced performance of ceria with surface sulfation for selective catalytic reduction of NO by NH3. Catal. Commun. 2010, 12, 310–313. [Google Scholar] [CrossRef]
  48. Tarabanko, V.E.; Tarabanko, N. Catalytic oxidation of lignins into the aromatic aldehydes: General process trends and development prospects. Int. J. Mol. Sci. 2017, 18, 2421. [Google Scholar] [CrossRef] [PubMed] [Green Version]
  49. Tarabanko, V.E.; Gulbis, G.R.; Ivanchenko, N.M.; Kuznetsov, B.N.; Kudryashev, A.V. Study of wood and lignosulfonates processing into fine products. Chem. Sustain. Dev. 1996, 4, 405–417. [Google Scholar]
  50. Amarasekara, A. Acidic ionic liquids. Chem. Rev. 2016, 116, 6133–6183. [Google Scholar] [CrossRef]
  51. Prado, R.; Erdocia, X.; de Gregorio, G.F.; Labidi, J.; Welton, T. Willow lignin oxidation and depolymerization under low cost ionic liquid. ACS Sustain. Chem. Eng. 2016, 4, 5277–5288. [Google Scholar] [CrossRef]
  52. Lu, J.; Wang, M.; Zhang, X.; Heyden, A.; Wang, F. β-O-4 bond cleavage mechanism for lignin model compounds over Pd catalysts identified by combination of first-principles calculations and experiments. ACS Catal. 2016, 6, 5589–5598. [Google Scholar] [CrossRef]
  53. Jiang, L.; Guo, H.; Li, C.; Zhou, P.; Zhang, Z. Selective cleavage of lignin and lignin model compounds without external hydrogen, catalyzed by heterogeneous nickel catalysts. Chem. Sci. 2019, 10, 4458–4468. [Google Scholar] [CrossRef] [PubMed] [Green Version]
  54. Da Costa Lopes, A.M.; Gomes, J.R.B.; Coutinho, J.A.P.; Silvestre, A.J.D. Novel insights into biomass delignification with acidic deep eutectic solvents: A mechanistic study of β-O-4 ether bond cleavage and the role of the halide counterion in the catalytic performance. Green Chem. 2020, 22, 2474–2487. [Google Scholar] [CrossRef]
  55. Deng, W.; Zhang, H.; Wu, X.; Li, R.; Zhang, Q.; Wang, Y. Oxidative conversion of lignin and lignin model compounds catalyzed by CeO2-supported Pd nanoparticles. Green Chem. 2015, 17, 5009–5018. [Google Scholar] [CrossRef]
  56. Ma, Y.; Du, Z.; Liu, J.; Xia, F.; Xu, J. Selective oxidative C–C bond cleavage of a lignin model compound in the presence of acetic acid with a vanadium catalyst. Green Chem. 2015, 17, 4968–4973. [Google Scholar] [CrossRef]
  57. Liu, H.; Li, H.; Lu, J.; Zeng, S.; Wang, M.; Luo, N.; Xu, S.; Wang, F. Photocatalytic cleavage of C–C Bond in lignin models under visible light on mesoporous graphitic carbon nitride through π–π stacking interaction. ACS Catal. 2018, 8, 4761–4771. [Google Scholar] [CrossRef]
  58. Fan, H.; Yang, Y.; Song, J.; Ding, G.; Wu, C.; Yang, G.; Han, B. One-pot sequential oxidation and aldol-condensation reactions of veratryl alcohol catalyzed by the Ru@ZIF-8 + CuO/basic ionic liquid system. Green Chem. 2014, 16, 600–604. [Google Scholar] [CrossRef]
  59. Xu, C.; Arancon, R.A.D.; Labidi, J.; Luque, R. Lignin depolymerisation strategies: Towards valuable chemicals and fuels. Chem. Soc. Rev. 2014, 43, 7485–7500. [Google Scholar] [CrossRef] [PubMed]
  60. Shilpy, M.; Ehsan, M.A.; Ali, T.H.; Abd Hamid, S.B.; Ali, M.E. Performance of Cobalt Titanate Towards H2O2 Based Catalytic Oxidation of Lignin Model Compound. RSC Adv. 2015, 5, 9644–79653. [Google Scholar] [CrossRef]
  61. Saberi, F.; Rodriguez-Padrón, D.; Garcia, A.; Shaterian, H.; Luque, R. Unprecedented Proline-Based Heterogeneous Organocatalyst for Selective Production of Vanillin. Catalysts 2018, 8, 167. [Google Scholar] [CrossRef] [Green Version]
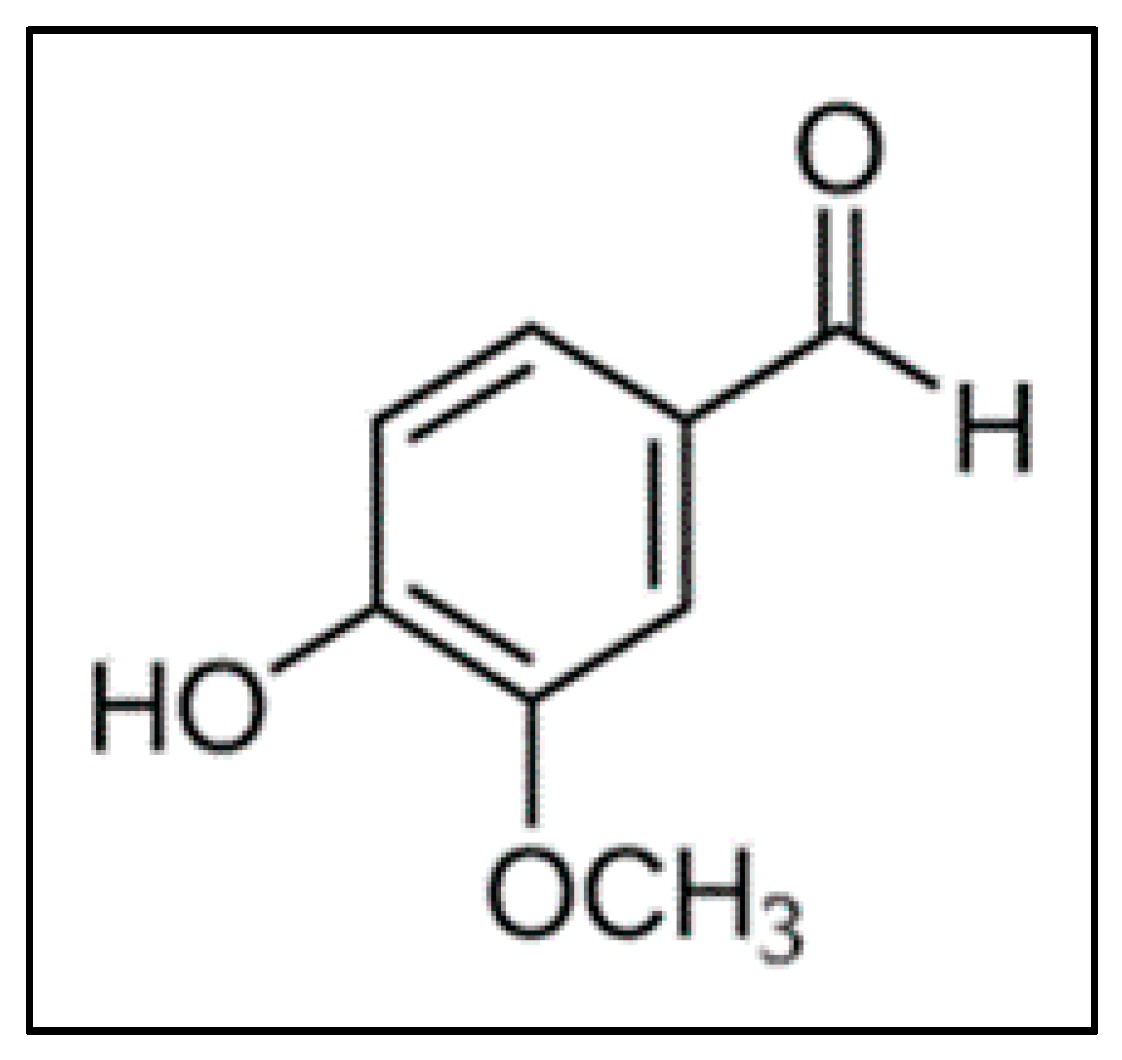
Figure 1. Chemical structure of vanillin [6].
Catalysts 11 01449 g001
Figure 2. X-ray diffraction patterns of MgO synthesized using sol-gel and hydrothermal methods at pH 12.
Catalysts 11 01449 g002
Figure 3. X-ray diffraction patterns of MgO-supported CeO2 catalysts.
Catalysts 11 01449 g003
Figure 4. N2 adsorption–desorption isotherms of the catalyst.
Catalysts 11 01449 g004
Figure 5. FTIR spectra of dried kenaf stalk’s lignin.
Catalysts 11 01449 g005
Figure 6. HPLC chromatogram of vanillin standard.
Catalysts 11 01449 g006
Figure 7. Calibration curve of the vanillin standard at five different concentrations.
Catalysts 11 01449 g007
Figure 8. HPLC chromatogram of derived vanillin.
Catalysts 11 01449 g008
Figure 9. Reaction condition: 2 g of dried kenaf stalks, 20 mL of 0.01 N NaOH solution, 10 wt.% of catalyst, 1 mL of H2O2 at 180 °C.
Catalysts 11 01449 g009
Figure 10. Reaction condition: 2 g of dried kenaf stalks, 20 mL of 0.01 N NaOH solution, 10 wt.% of catalyst, 1 mL of H2O2 at 20 min.
Catalysts 11 01449 g010
Figure 11. Reaction condition: 2 g of dried kenaf stalks, 20 mL of 0.01 N NaOH solution, 1 mL of H2O2 at 20 min for 170 °C.
Catalysts 11 01449 g011
Figure 12. Reaction condition: 2 g of dried kenaf stalks and 1.06 g of extracted lignin, 20 mL of 0.01 N NaOH solution, 15 wt.% of catalyst, 1 mL of H2O2 at 20 min for 170 °C.
Catalysts 11 01449 g012
Figure 13. Reaction condition: 2 g of dried kenaf stalks, 20 mL of 0.01 N NaOH solution, 15 wt.% of catalyst, 1 mL of H2O2 at 20 min for 170 °C.
Catalysts 11 01449 g013
Table 1. Crystallite size of MgO and MgO-supported Ce catalysts.
CatalystCrystallite Size (nm)
Mg (200)Ce (111)
MgO-1836.5-
MgO-3629.9-
MgO-4848.4-
MgO-SG32.8-
30Ce/MgO-1843.93.9
30Ce/MgO-3650.74
30Ce/MgO-4840.014.4
30-Ce/MgO-SG45.37.1
Table 2. Textural properties of MgO and 30Ce/MgO catalyst.
CatalystBET Surface Area (m2/g)Pore Volume (cm3/g)Average Pore Size (nm)Crystallite Size (nm)
MgO-1828.40.19321.736.5
MgO-3634.60.28536.429.9
MgO-4813.40.07614.448.4
MgO-SG27.30.14620.432.8
30Ce/MgO-1827.50.16518.843.9
30Ce/MgO-3625.90.15818.250.7
30Ce/MgO-4829.30.29332.340.0
30Ce/MgO-SG28.40.24730.245.3
Publisher’s Note: MDPI stays neutral with regard to jurisdictional claims in published maps and institutional affiliations.