1. Introduction
Gasification of the biomass offers the possibility to reduce greenhouse gas (GHG) emissions and increase the share of renewable resources in different industrial sectors. Through gasification, the biomass is converted into an energy-rich gas (i.e., raw gas) that contains mainly H
2, CO, and CO
2, with lower levels of CH
4 and other hydrocarbons originating from the volatile fraction of the fuel. The net conversion process requires heat, and several gasifier configurations to achieve energy balance in different ways have been proposed and investigated. In a dual fluidized bed (DFB) reactor, the heat production and gasification reactions occur in two separate but interconnected fluidized bed reactors, i.e., the combustor and the gasifier. In the combustor, heat is generated through the combustion of the char and other residual streams produced in the gasification reactor. Thereafter, the heat is transported to the gasifier by means of a sand-like material that circulates continuously between the two reactors. The concept of the DFB gasifier has been successfully demonstrated in several projects [
1,
2,
3].
Optimization of DFB gasification is mainly concerned with a high yield of gas with low tar content and a low heat demand for high energy efficiency. This optimization usually involves fine adjustment of the conversion rate in the gasifier so that the residual char and other streams can cover the heat demand without generating unwanted excess heat. In other words, to achieve high energy efficiency, the heat demand of the gasifier should be kept as low as possible while ensuring a sufficiently high conversion rate in the gasifier. A high conversion rate in the gasifier involves both char gasification reactions to produce H2 and CO and secondary reactions of the volatile fraction of the fuel to yield as much gas as possible via cracking and steam reforming. The behaviors of the heat demand and the fuel conversion rate in the gasifier regarding temperature are antithetical, requiring other means to speed up fuel conversion, such as catalyst-assisted gasification.
A general observation that has been made at commercial DFB gasification plants operating with the biomass is that over time, the gas yield and its quality increase when using olivine as the bed material [
4,
5]. This behavior has been attributed to the enrichment of olivine with catalytically active elements such as alkali and alkaline earth metals, which originate from the biomass ash or from additives. There is an ongoing debate as to the contributions of the different ash species to the catalytic effects observed and as to whether the catalytic effects are purely heterogeneous or homogeneous in nature. In this context, potassium (K) and calcium (Ca) are the most predominant species in the biomass ash that have been linked to the acquired catalytic activity of ash-enriched bed materials [
5,
6,
7]. Calcium is most likely connected to heterogeneous catalytic effects given the solid nature of the Ca compounds formed under gasification and combustion conditions. Potassium, on the other hand, is linked to potential homogeneous gas phase interactions [
8] given the gaseous nature of common K species detected at gasification and combustion temperatures, e.g., K, KOH, and KCl. The focus of this work was on the role of K in the DFB configuration.
The increased catalytic activity of the bed material arising from ash accumulation is not valid for all types of systems. The effect of alkali on conversion of the fuel is dependent upon the physical and chemical availabilities of the K species, and these in turn depend on the nature of the bed material and the mode of interaction with the alkali. More specifically, if the alkali is bound to silicon in the form of a silicate, its catalytic availability is very limited and the catalytic activities are negligible [
9,
10]. Therefore, the catalytic effects discussed here apply to bed materials that contain only a small amount of available silicon in the matrix, e.g., olivine [
1,
2,
3,
5], bauxite [
11], or feldspar [
12,
13], or to conditions under which the absorption capability of the usually applied silica-based sands is depleted. A similar reasoning is valid for the ash composition of the fuel where the use of a fuel with a high silicon-to-potassium ratio (S/K ratio) in the ash will lead to the formation of stable K silicates [
14], and these will likely not show any of the aforementioned catalytic effects. For these reasons, the examples used in this work are based primarily on olivine as the bed material and biomasses with a composition that entails an excess of K with respect to the level of silicon.
Alkali species in a DFB system are known to be potential precursors of the conversion rate of the biomass. The catalytic activity of K was developed, for instance, for coal gasification in the 1980s, e.g., the Exxon process [
15], where the main goal was to increase the char gasification rates. In a DFB system, the catalytic consequences of the availability and transport of alkali though the system are expected to go beyond the catalysis of char gasification. In the past few years, efforts have been made to distinguish specific catalytic effects and reactions that are altered by the presence of ash-enriched bed materials or alkali vapors. The effects of ash-enriched olivine on biomass conversion have been examined in relation to char gasification rates [
16], gas quality [
4,
5,
7], the water–gas shift (WGS) reaction [
6], and the fuel burnout in the combustor [
17]. The latter is rarely documented in the fluidized bed combustion literature. Marinkovic et al. found that the increase in activity of olivine in the gasification part coincided with insufficient CO burnout in the combustor [
5]. This effect was related to the disruption of CO oxidation in the presence of K. In a recent work, the inhibitory effect of K on CO oxidation was thoroughly investigated at the laboratory scale; it was found that K in the gas phase could remove OH radicals from the combustion environment, thereby preventing complete oxidation of CO [
17].
Apart from the fragmented efforts to date to understand specific effects mediated by ash in DFB gasifiers, there has been no comprehensive description of the effect of alkali on fuel conversion in a large-scale DFB setup. The aim of this work was to fill that gap by presenting a comprehensive picture of the catalytic role of alkali in a DFB system, encompassing a gasification and combustion reactor. For this purpose, a dedicated experimental campaign at a Chalmers DFB gasifier is presented here, in which controlled enrichment of the bed with alkali was achieved through the addition of sulfur (S) to the bed material, while the composition of the flue gas and raw gas was monitored.
1.1. Transport of K in DFB Systems and Enhanced Retention of K by Means of Sulfur Addition
For materials that do not chemically retain alkali, the form of alkali in the reactor depends on the available reaction partners, such as S, carbon dioxide, steam, and chlorine, as well as the conditions prevailing in the system. This is especially relevant for a DFB system as the differing fluidization media, air and flue gases in the CFB part and steam in the BFB, create distinct regions with oxidizing and reducing conditions.
Figure 1 presents a schematic of the generic paths that K can take in the DFB. Potential paths for K include direct formation of K compounds in the solid form (GS1, CS1, in the gasifier or the combustor, respectively), which then follow the bed material stream; the release of K in the gaseous form (GG1, CG1), which follows the gas stream; the adsorption/absorption of K vapors to the bed material particles (GS2, CS2); and the release of K compounds from the bed material into the gas phase (GG2, CG2). Based on mass balance calculations, a net flow of K from the combustion part to the gasification part was measured at a Güssing plant [
18], which points towards CS1, CS2, GG1, and GG2 being the predominant paths for K in DFB systems. This dynamic behavior of the bed material in retaining and releasing alkali under oxidizing and steam-rich conditions, respectively, is the same principle that is applied in flue gas treatment to remove alkali with solid absorbents [
19].
Potassium is typically released from the biomass in the forms of KOH and K and as KCl from chlorine-containing fuels [
20]. The driving force for the transport of these K vapors via the GS2/CS2 paths is adsorption/absorption, such that the amount of K accumulated in the system is naturally limited by the equilibrium, the available surface, and the gas phase concentration. Providing a reaction partner such as S can further boost the net transport of K from the combustion to the gasification part by the bed material. In fact, S enhances the CS2 path by promoting formation of potassium sulfate (K
2SO
4), which is retained in olivine particles [
16]. This sulfation reaction has also been applied in other thermochemical processes, such as air and oxyfuel combustion, for reducing the concentrations of corrosive KCl in flue gas streams [
21,
22]. Therefore, S was selected here as a reaction partner for K based on its well-known affinity for this ash element under combustion conditions.
1.2. The Chalmers DFB Plant
The experiments presented here were conducted in a Chalmers DFB unit, which consists of a 12 MWth circulating fluidized bed (CFB) boiler and an integrated 2 MWth bubbling fluidized bed (BFB) gasifier [
23], as schematized in
Figure 2. As the plant serves as a heat production unit for the campus, heat is extracted from the CFB, which always requires fuel feeding to the boiler. The system can be operated in two different modes: (i) only the boiler and (ii) the boiler and the gasifier together. The switch between these two modes is facilitated by an intermediate vessel referred to as the particle distributor (No. 5 in
Figure 2). The particle distributor returns the bed material directly to the boiler or, alternatively, it leads the bed material to the gasifier via a loop seal (No. 7 in
Figure 2). When the gasifier is included in the loop, the bed material returns to the boiler via loop seal 2 (No. 8 in
Figure 2). The raw gas produced in the gasifier is discharged into the boiler, where it is combusted.
Three main variables were investigated: (1) accumulation of fuel ash in the bed material; (2) deliberate addition of S to the system; and (3) deliberate addition of potassium to the system. Ash accumulation in the system occurred naturally following the addition of fuel to the boiler (No. 2 in
Figure 2) and the gasifier (No. 9 in
Figure 2). S was introduced for selected time periods into the return leg of the bed material and to the boiler (indicated with a black arrow in
Figure 2). This implies that S was first exposed to the oxidizing conditions of the boiler and subsequently transported to the gasifier if it was retained in olivine. A batch of K
2CO
3 was added to the gasifier on one occasion to investigate the direct influence of K on the raw gas quality. K
2CO
3 was introduced at the inlet loop seal to the gasifier (No. 7 in
Figure 2).
The results presented in this work pertain to the measurements carried out over 2 weeks of operation of the plant, with the focus on the first 65 h of continuous operation from start-up of the DFB. Additional tests with the boiler only were carried out thereafter. The results are interpreted in the context of the information derived from previous investigations conducted at the laboratory scale that addressed isolated catalytic aspects of S–K interactions in fuel conversion.
2. Results
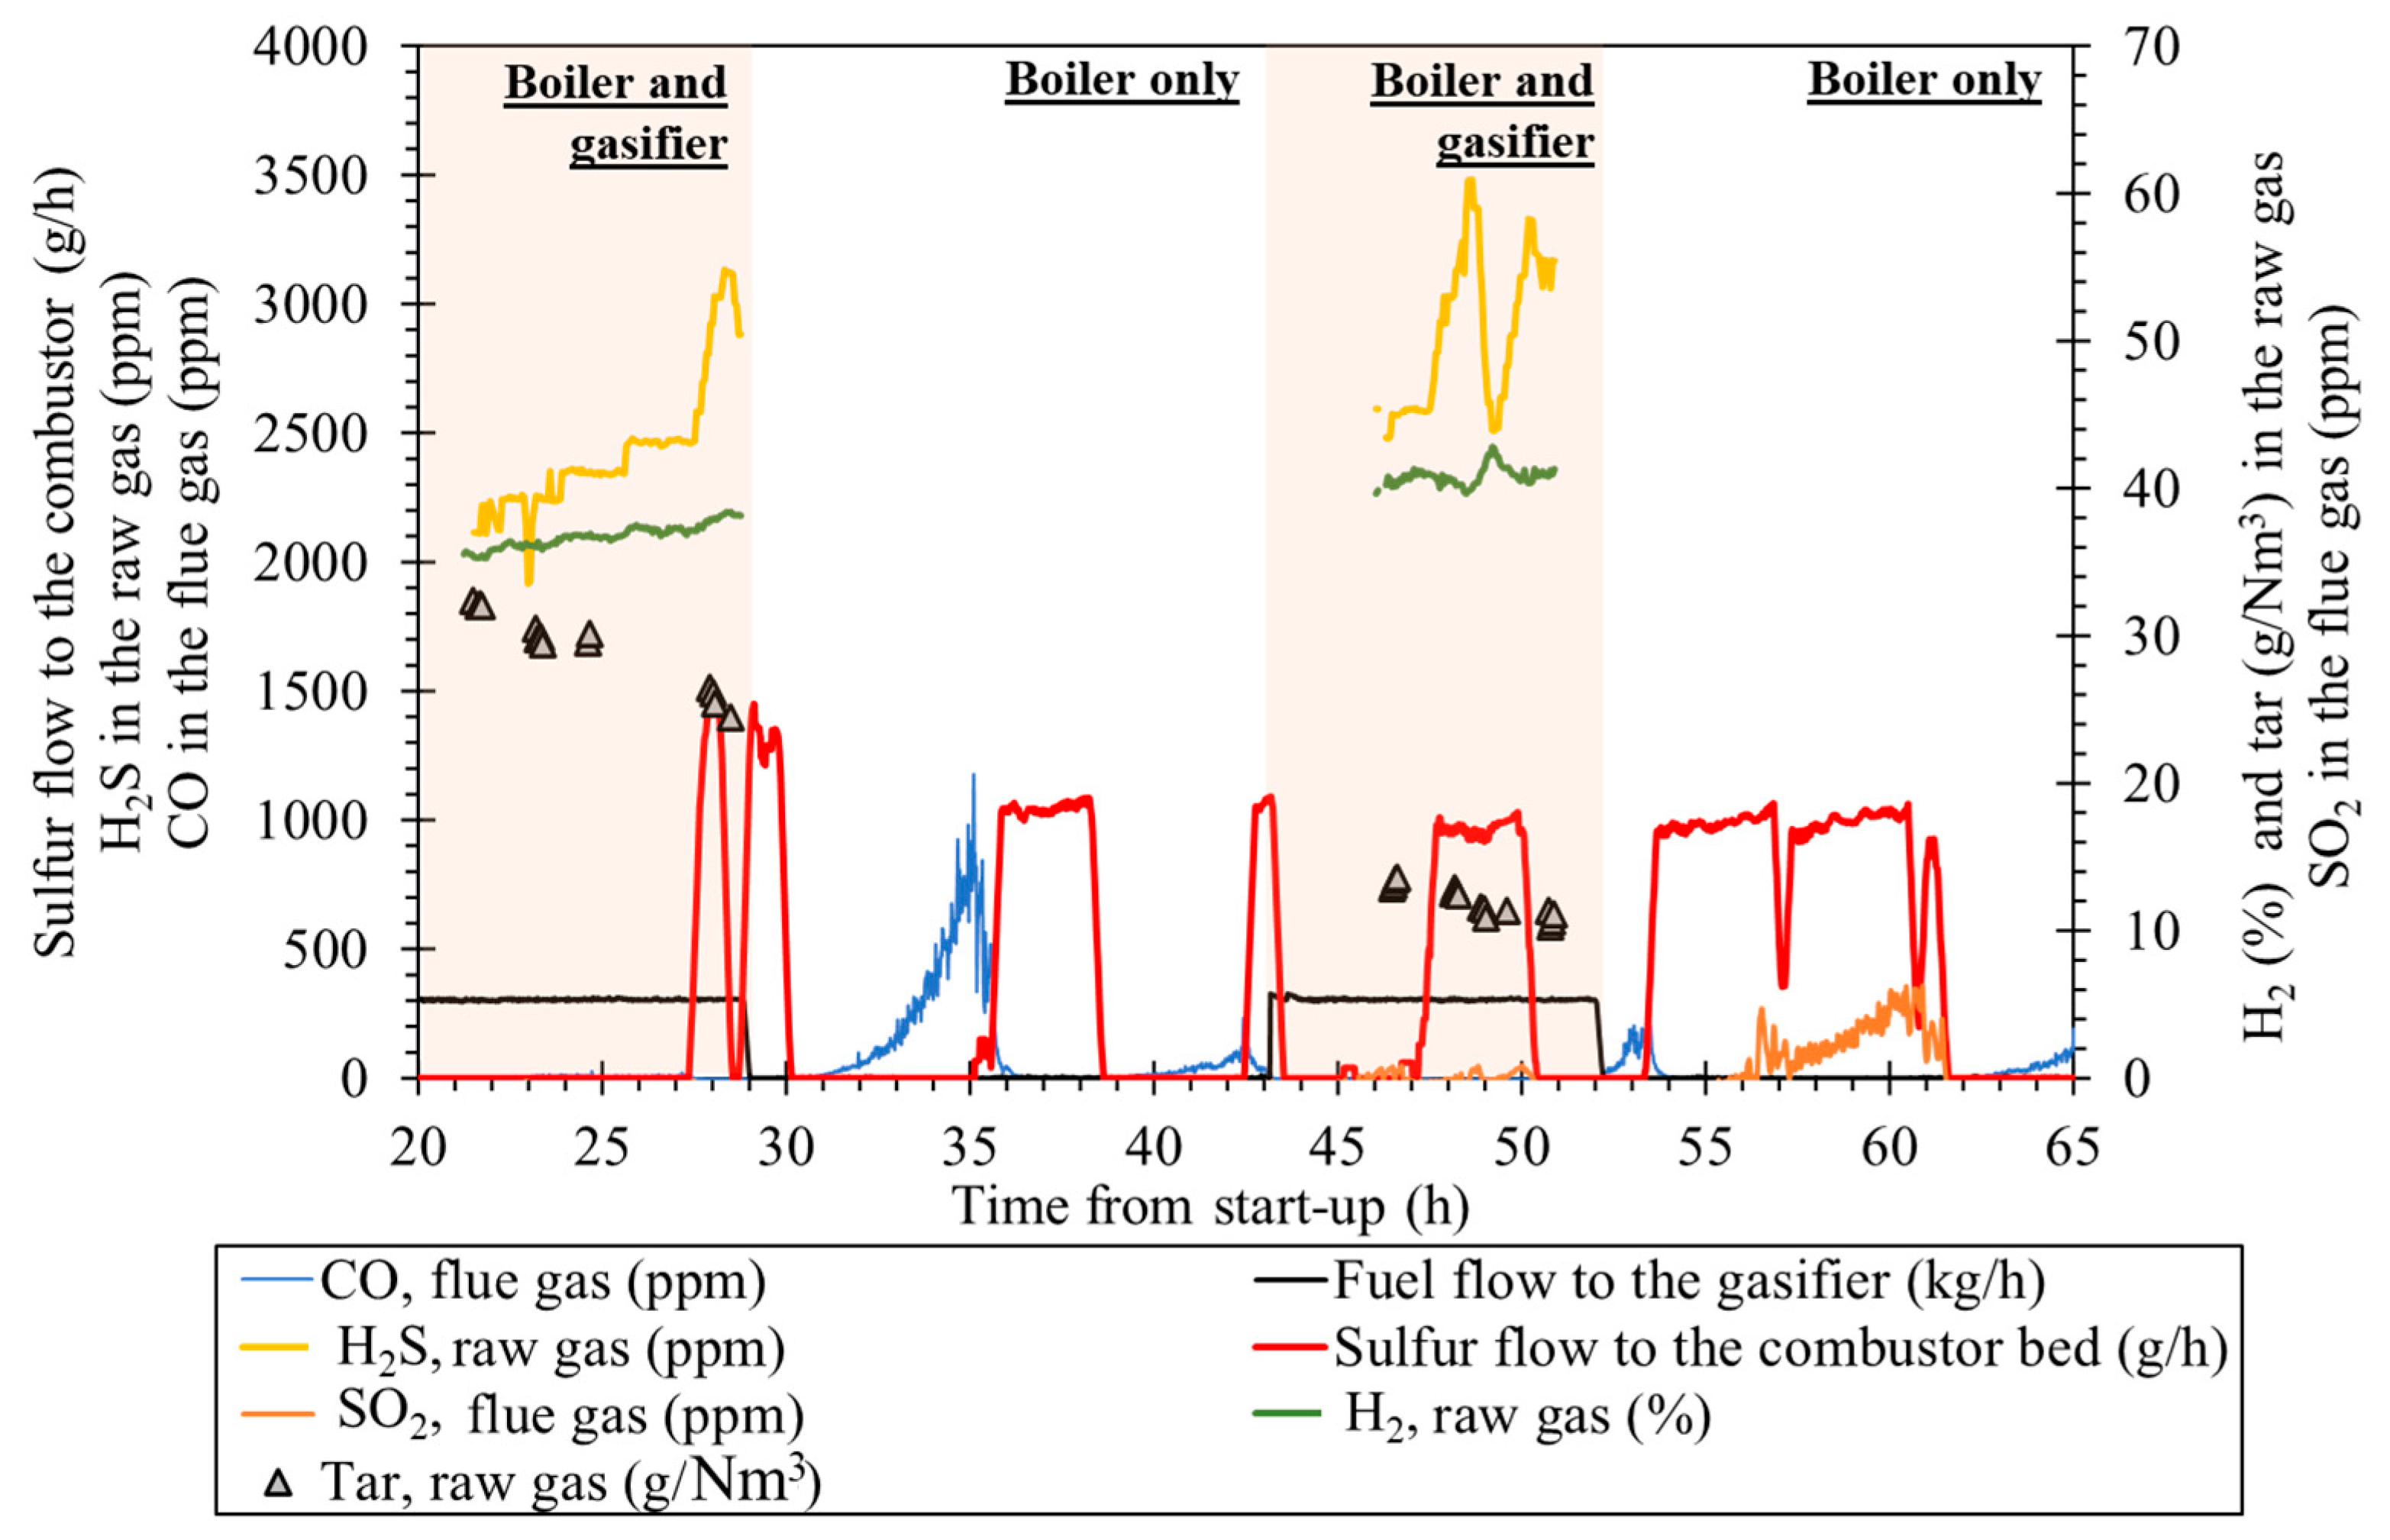
An extract of selected operating parameters during the first 65 h of the campaign is shown in
Figure 3, where the fuel feeding rates to the boiler and the gasifier as well as the addition of S and K
2CO
3 are detailed. During the measurements, process operation was kept as stable as possible unless a sharp transient was induced by the addition of S (red line in
Figure 3) or by the addition of K
2CO
3 to the gasifier (black arrow in
Figure 3). Transient periods were also connected to the switching of operation between cases with the boiler only and cases with both the gasifier and the boiler, as seen in
Figure 3. In particular, the fuel flow to the boiler was adjusted when fuel was fed to the gasifier to maintain a similar energy input to the system for all the cases. Careful and controlled setting of the operational parameters was designed to ensure that the observed variations of the boiler emissions (CO and SO
2) and raw gas composition (H
2S, H
2, and tar) could be attributed exclusively to the changes made to the bed properties.
Two runs with continuous feeding of wood pellets to the gasifier were conducted for approximately 10 h each (indicated by the orange shaded areas in
Figure 3). During the first 65 h of operation, the effects of K and S on the boiler part were also noticeable. To confirm these observations made in the first 65 h of operation and investigate further the effects of K and S on combustion emissions, two additional experiments with the boiler only were carried out later in the campaign (not shown in
Figure 3), as explained in
Section 2.2. The gas measurements for the gasifier and the boiler parts are presented separately in
Section 2.1 and
Section 2.2, respectively.
Analysis of the bed material sample taken after 65 h of operation (
Figure 4) confirmed accumulation of S and K in olivine particles. Potassium was stored in the regions with high concentrations of S, suggesting the formation of potassium sulfates or sulfides, which accords with previous observations [
16]. The molar ratio of K to S in the SEM–EDX analysis was approximately one, indicating that other S compounds are expected to be present in the layer.
2.1. Gasifier
The temperature of the gasifier bed was in the range of 800–810 °C, the fluidization steam flow was 160 kg/h, and the fuel feeding rate was 300 kg/h. The first run with the gasifier (18–29 h after start-up) provided the reference gas composition before any addition of S to the bed, as well as a measurement collected during the continuous feeding of S. In the second run with the gasifier (43–52 h after start-up), the bed had already been exposed to S for several h. In this case, a reference measurement was made, and thereafter, transient measurements during S and K
2CO
3 addition were performed. The raw gas composition was monitored during that time; the concentrations of H
2 and tar in the raw gas are summarized in
Figure 5 for the two gasifier runs (indicated with orange shading in the figure). The concentrations of H
2 and tar were selected as indicators of the catalytic activity of the bed material, i.e., higher catalytic activity is expected to yield a higher concentration of H
2 and a lower concentration of tar.
The raw gas concentration before any addition of chemicals to the system was sampled 21 h after start-up of the DFB system. At that timepoint, approximately 100 kg of fuel ash had already entered the system. The raw gas showed a tar concentration of 32 g/Nm
3, 35.5% H
2, and 2300 ppm H
2S. During the first few h, the H
2 and H
2S concentrations in the raw gas showed a slow and steady increase of 0.3%/h, in line with the enrichment of the bed with the fuel ash. The addition of S to the bed at t = 27 h intensified the increase in H
2 yield, as shown in
Figure 6. The increase in the H
2 yield was followed by an increase in the yield of CO
2 and a decrease in the CO yield, in line with the WGS reaction equilibrium. The yields of CH
4 and tar also decreased during the addition of S, reflecting the enhanced reforming reactions. In addition to the increased catalytic activity towards tar and the WGS reaction, the results show an increased char gasification rate with the addition of S. Based on the carbon balance calculations over the gasifier, the char gasification rate was estimated to be 6% at the reference measurement at t = 21 h, and it increased to approximately 19% during the feeding of S at t = 28 h.
In the second run carried out in the gasifier, the tar yield was even lower and the yield of H2 increased further, indicating an activated olivine bed. By that point, the bed had been exposed to 14 kg of S granules and the raw gas contained 2600 ppm H2S, which was 13% higher that the initial conditions measured before any S addition to the DFB. The raw gas contained 40.5% H2 and 13 g/Nm3 of tar, which was roughly 60% lower than the tar concentration measured before any addition of S to the bed (t = 21 h).
Before proceeding with the addition of K
2CO
3 to the gasifier, the flow of S was initiated. This resulted in a sharp increase in the level of H
2S in the raw gas similar to that obtained at t = 28 h. A moderate decrease in tar concentration followed the addition of S, such that it was 5% lower than before starting the S flow. It was noticeable that the effect of S on the tar concentration was less prominent this time, which can be attributed to the fact that the system had a high S/K ratio by that point. The addition of K
2CO
3 at t = 49 h caused a sudden drop in the H
2S concentration and a sharp increase in the concentration of H
2 in the raw gas, as shown in
Figure 5 (t = 49 h). The concentration of tar decreased by an additional 10% (relative to before the addition of S and K
2CO
3), reaching 11 g/Nm
3.
In
Figure 7, the tar results obtained during this campaign are compared with those obtained in the previous experiments with olivine, where the activation of olivine was carried out exclusively with the ash introduced by the fuel [
5]. The addition of S clearly accelerated and intensified the catalytic activation process. Naphthalene was chosen for this comparison as it is among the most accurately measured species in the tar fraction given its large share and high retention in the SPA columns applied in both campaigns.
2.2. Boiler
As shown in
Figure 3, the effects on the CO and SO
2 emissions in the boiler part were initially observed during the first 65 h of the campaign and in parallel with the gasifier runs described above. The boiler temperature was in the range of 840–860 °C and the fuel feeding rate 1.7–2.0 tonnes/h. The air supply to the boiler was adjusted so that the oxygen concentration at the stack was stable in the range of 3.0–3.5% (yellow line in the figure).
During the first 31 h of operation, the flue gases from the boiler were free of SO
2 and CO emissions. One h after the S flow to the bed stopped, the CO concentration in the flue gases started to ramp up steadily. When the concentration of CO reached approximately 1100 ppm at t = 36 h, the feeding of S to the bed was restarted, and the CO emissions started to decrease after a few min, reaching zero after approximately 1 h (
Figure 5). A similar response pattern was obtained in the period t = 39–43 h, i.e., the CO emissions from the boiler started to ramp up when the feeding of S to the bed was interrupted. In this case, S feeding was reinitiated as soon as the CO emissions exceeded 120 ppm. Remarkably, the SO
2 emissions from the boiler were still zero despite the extensive exposure of the system to S. After 51 h of operation and the addition of approximately 24 kg of elemental S to the system, the SO
2 concentration started to rise steadily, reaching 7 ppm. The concentration of SO
2 declined rapidly to zero when S feeding was discontinued at t = 62 h.
2.2.1. Additional Test with Sulfur Feeding to the Bed
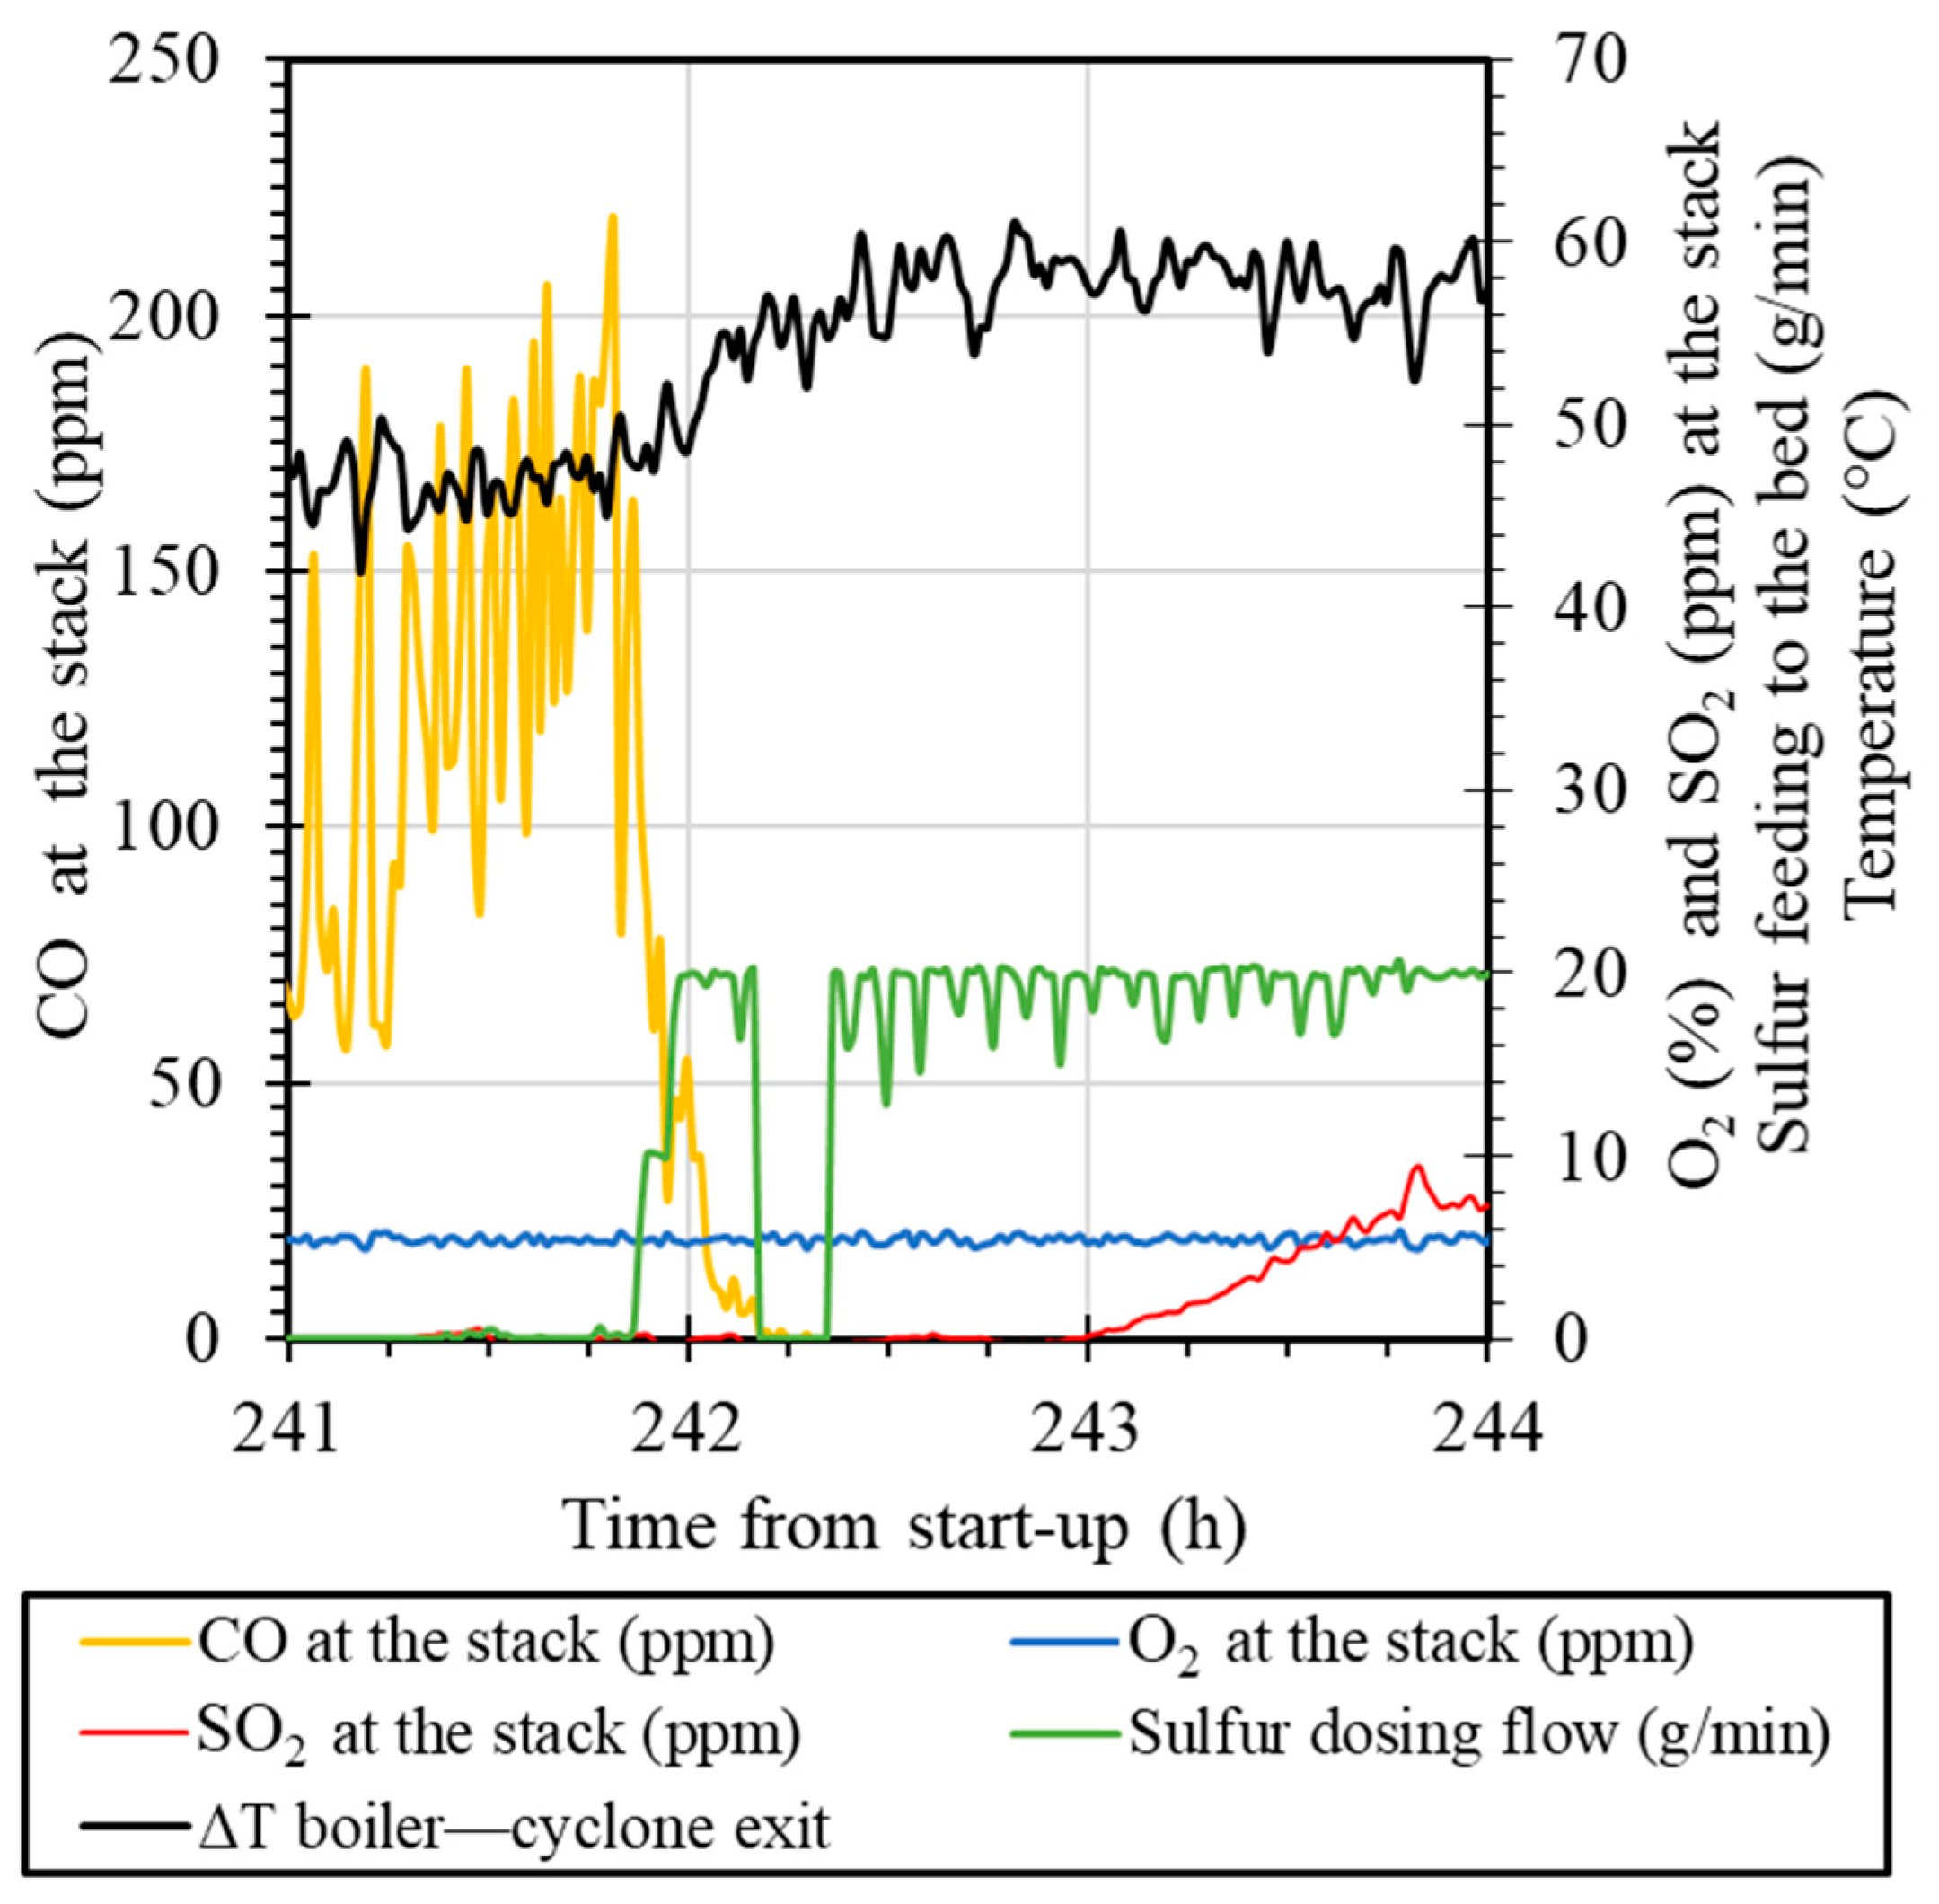
In the first additional test, a similar experiment with S fed to the boiler bed was reproduced. The concentrations of O
2, CO, and SO
2 were investigated at two different sampling positions: at the stack (SP-C1 in
Figure 2) and over the cross-section of the riser of the boiler (SP-C2 in
Figure 2). More details about the measurement are given in
Section 4.5. The O
2, CO, and SO
2 concentrations at the stack are shown in
Figure 8, and the flue gas concentration at the riser of the combustor is shown in
Figure 9.
This addition of S was carried out from t = 241 h to t = 244 h. Note that in the days preceding this experiment, 10 tonnes of the bed material had been replaced with unused olivine, yet the bed inventory was expected to behave as activated olivine given the extensive addition of S to the bed over the same period. The average CO concentration before S feeding was around 150 ppm and the SO2 concentration was zero ppm. The CO emissions started to decrease approximately 10 min after the S addition started and declined to zero after 30 min.
The SO
2 emissions at the stack started to increase 60–70 min after the addition of S started, as shown in
Figure 8. Considering the bed inventory of 3.5 tonnes and an average circulation time for the sand particles in the system of 8–12 min, this is a reasonable response time to (a) give all the K-loaded particles a chance to encounter S and (b) reach a level of S that is sufficiently high to generate excess S in the system leaving through the cyclone. This response time also supports the notion that the bed was already active and loaded with S, such that the response time of SO
2 was much shorter than that observed at the beginning of the campaign.
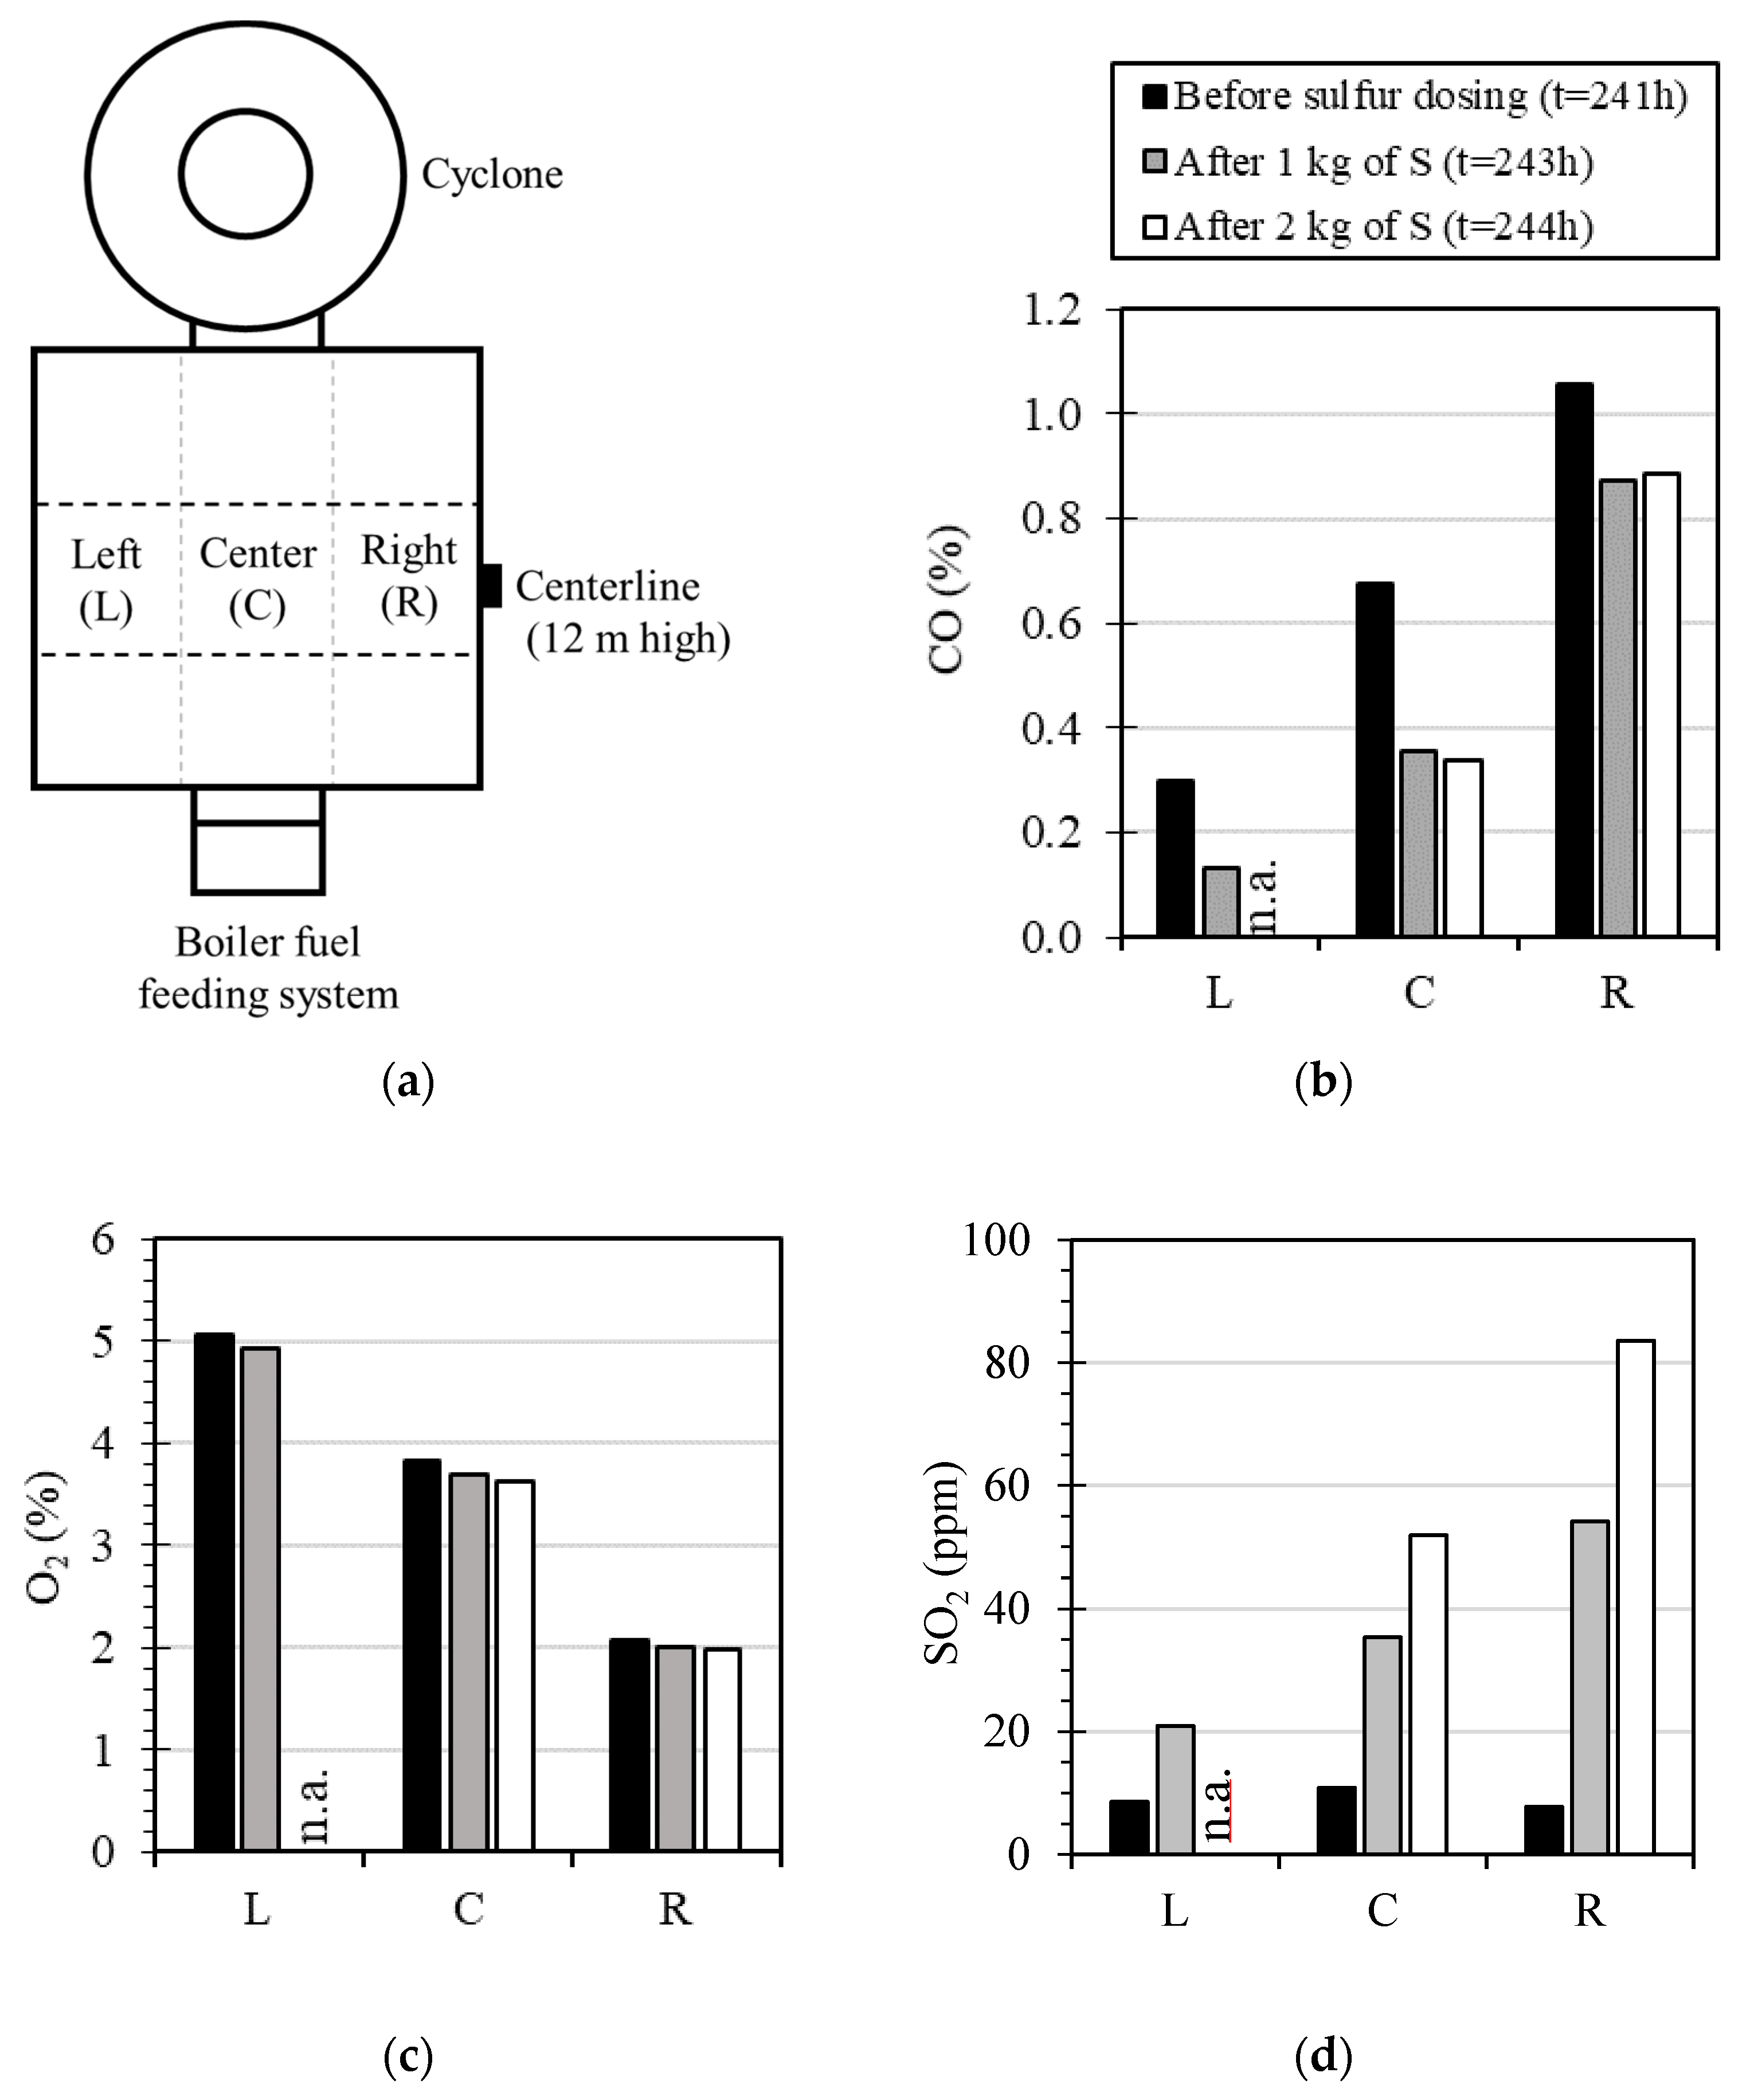
Inside the combustor, the trends obtained for the concentrations of SO
2, O
2, and CO are consistent with those observed at the stack. The concentrations measured at the riser (SP-C2 in
Figure 2) before and during the addition of S are shown in
Figure 9b–d. For this measurement, the cross-section of the combustion chamber was divided virtually into six cells, as shown in
Figure 9a, and the measurements were carried out over the three cells at the centerline. The concentration profile of CO was 0.1–1.0% along the centerline of the combustor before starting the addition of S (t = 241 h), which was 10–100 times higher than the concentration of CO at the stack. The concentration of CO at the riser decreased when S was added, while the SO
2 concentration increased. Furthermore, at the stack, the SO
2 concentration increased as the addition of S proceeded between t = 42 and t = 243 h, while the CO concentration stabilized. The O
2 concentration profile remained unaltered also inside the combustor, which further supports the idea that the changes in CO concentration are due to the chemical reactions rather than the distribution of oxygen.
Note that as S promotes the full conversion of CO inside the boiler, less combustion of unburnt species is expected at the cyclone position. This is in agreement with the change in the temperature distribution in the boiler where the temperature of the combustor increased while the temperature at the cyclone exit decreased correspondingly. As shown in
Figure 8, the difference in temperature between the combustor and the cyclone increased to 15 °C during the time period that the CO emissions decreased to zero and stabilized there.
2.2.2. Additional Test with Sulfur Feeding to the Cyclone
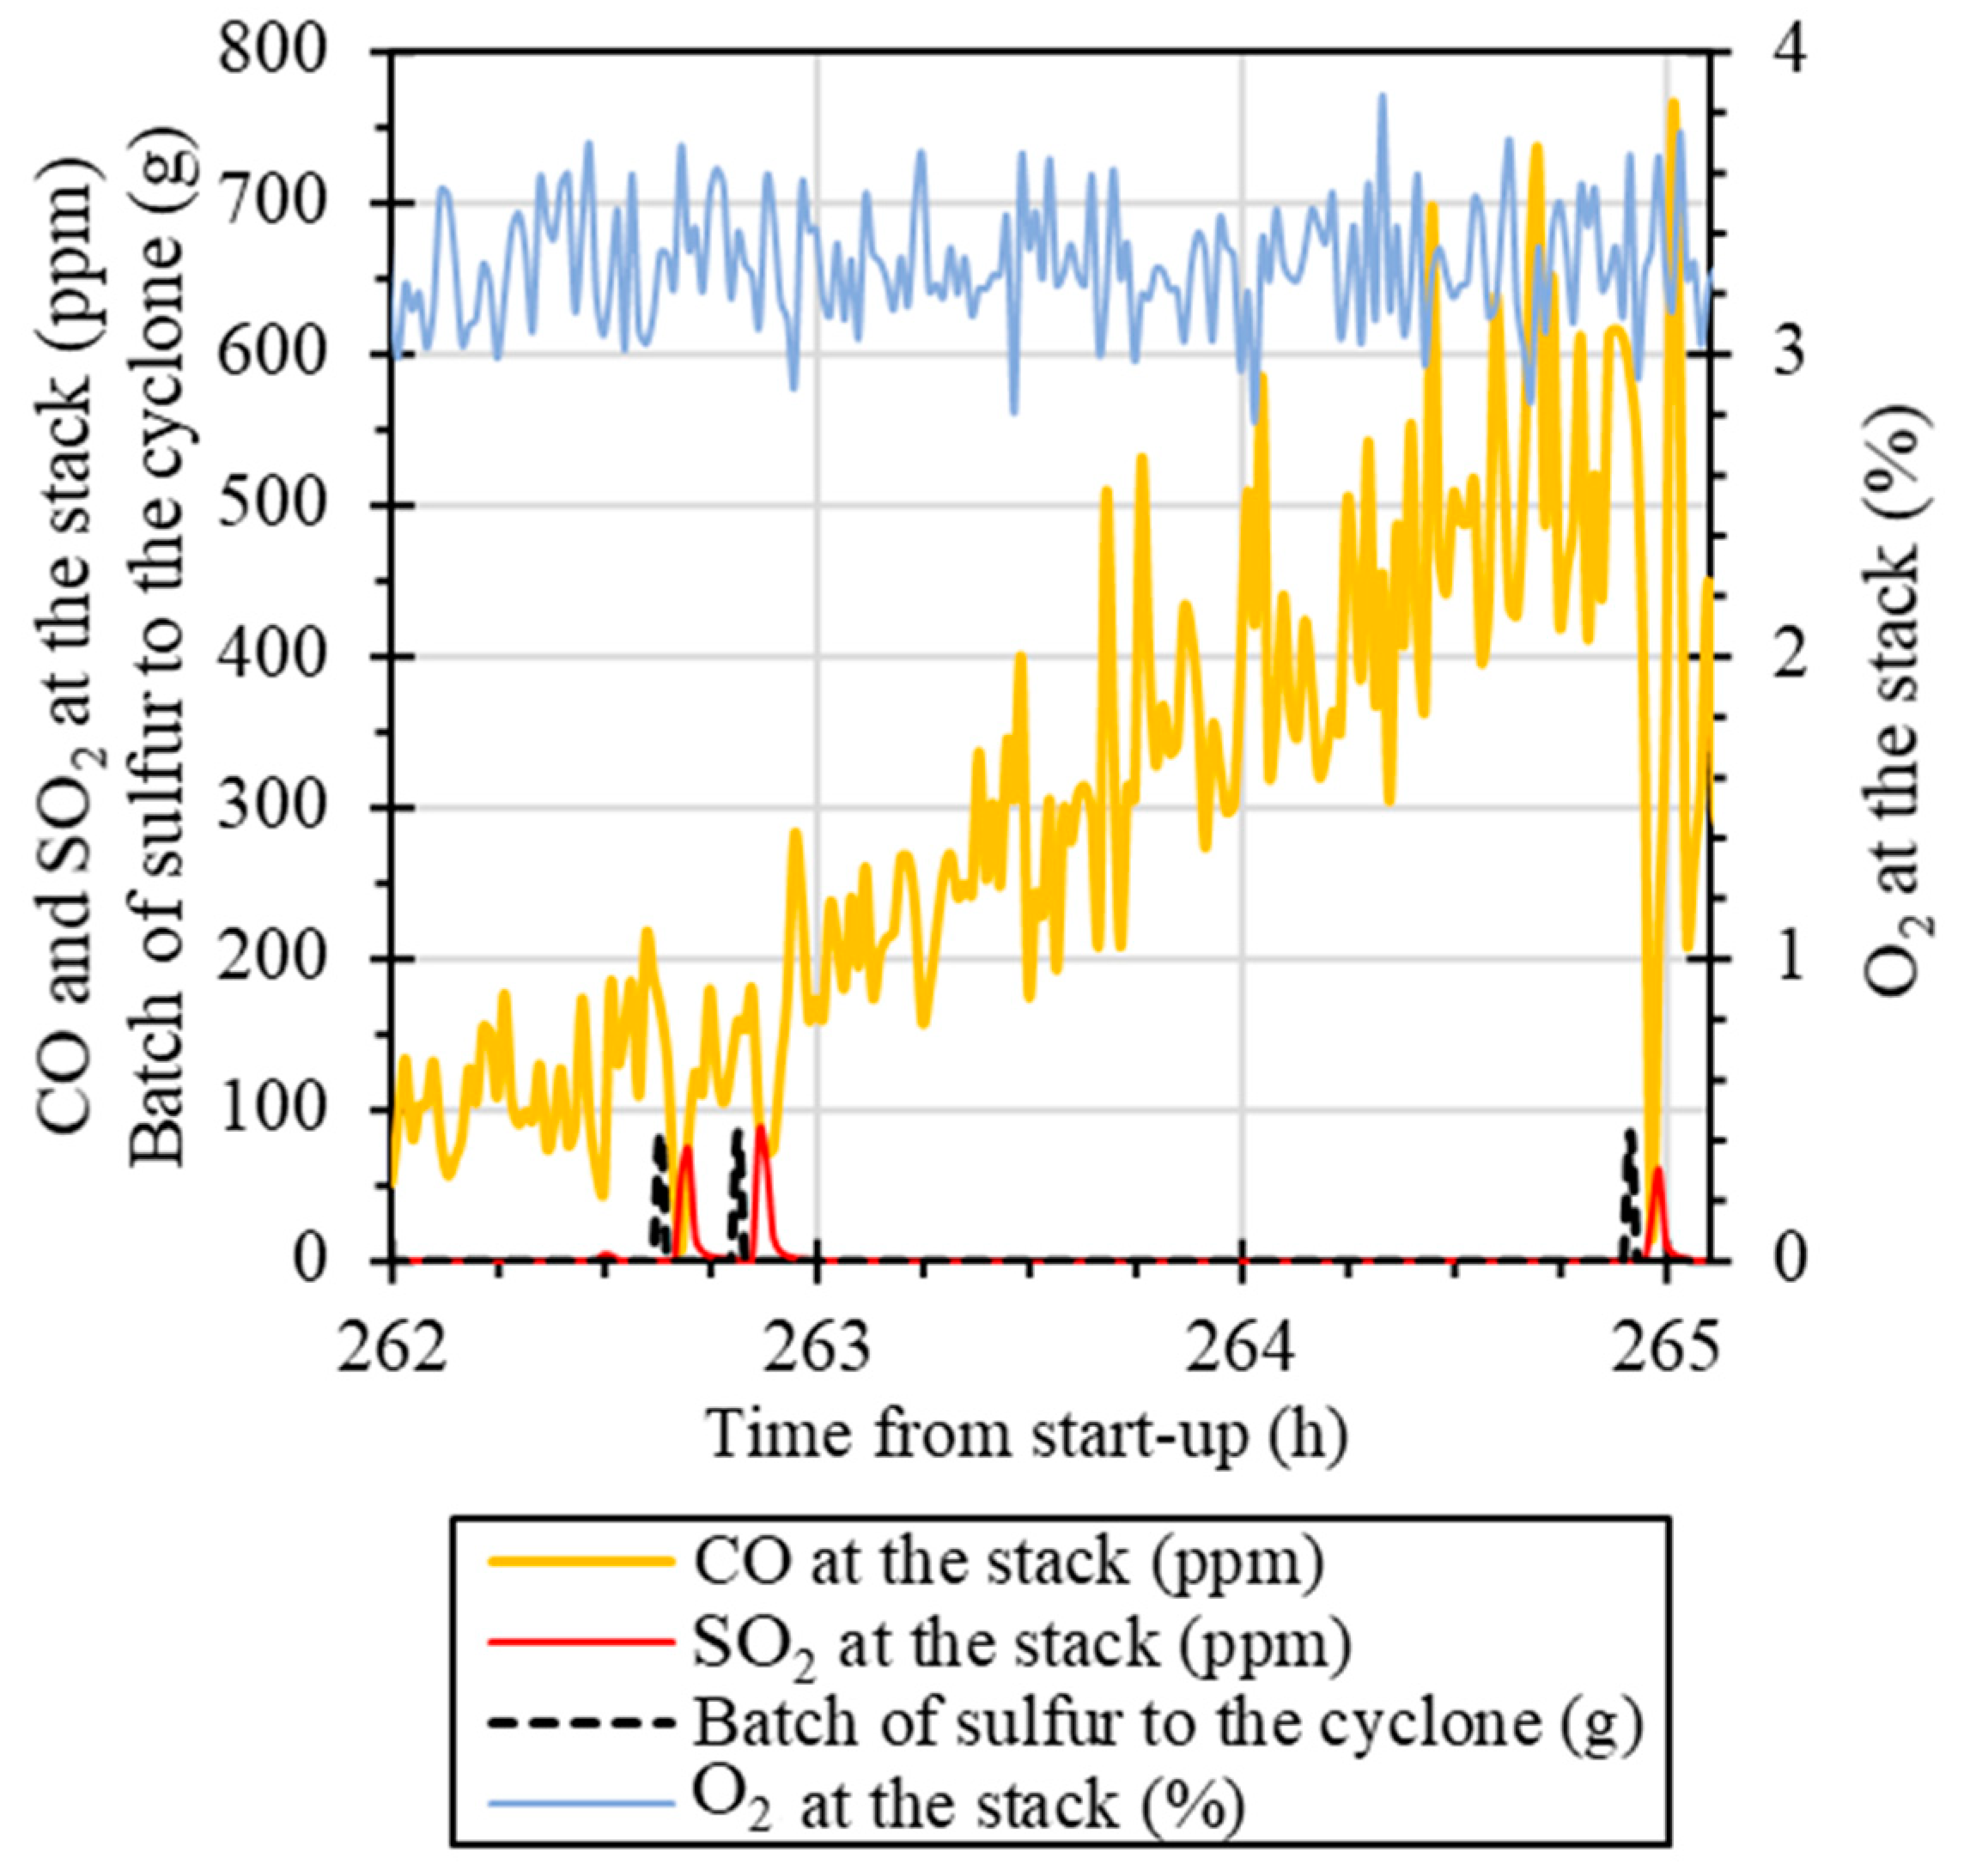
The second additional test with the boiler consisted only of the addition of three batches of 85 g of S granulates to the flue gas leaving the cyclone at the position indicated with a black arrow in
Figure 2. This test aimed to elucidate whether the reactions observed could occur in the gas phase without mediation by the bed material particles. The flue gas composition was measured continuously at the stack during the addition of S.
As shown in
Figure 10, three batches of S (black dotted line) were added when the CO concentration at the stack started to increase steadily from 100 ppm to 700 ppm. The three batches showed a similar response pattern: a peak drop of the CO concentration at the stack reaching 0% in 2–3 min, followed by a peak of SO
2 of approximately 80 ppm. This test confirmed the interaction between S, K, and the combustion chemistry that can be expected in the gas phase.
3. Discussion: Behavior of Potassium and Sulfur in a DFB System
The addition of S proved to be a good strategy for promoting retention of K in the bed. In other words, the addition of S favored the CS2 route (recall
Figure 1) without requiring higher partial pressures of KOH in the combustor to load the particles with K. Sulfur added by the fuel or artificially was, therefore, expected to be bound as sulfates to olivine particles, e.g., as K
2SO
4 (in line with the bed material analysis in
Figure 4), or released in the gasifier as predominantly H
2S, as shown in
Figure 5. In fact, the H
2S concentration of the raw gas at the beginning of the campaign was already 13-fold higher than the level of H
2S that the S content of the wood pellets fed into the gasifier could generate. This further confirms that S was transported from the boiler to the gasifier even with the natural input of ash with the biomass. The release of S in the gasifier in the form of H
2S in an H
2-rich atmosphere is in agreement with the thermodynamic calculations presented previously [
5].
In the boiler part, CO and SO2 emissions did not appear during the first 30 h and 55 h, respectively. This time delay in the emissions is also in line with the idea of an accumulation process. At the beginning of the campaign, a share of K is released from the biomass fed to the boiler part, as well as from the char coming from the gasifier. K is first expected to react partially with the silicon in the biomass ash and olivine. Considering the bed material composition, roughly 30% of SiO2 in the bed material can be expected to be readily available for further reactions with alkali and alkaline earth metals, whereas 70% of SiO2 is mostly present as Mg2SiO4 (fosterite) in the material in its initial state. This share of K is expected to be bound chemically to the material in the form of K silicate, which means that it is stable under all conditions prevailing in the DFB system. Indeed, as the concentration of free silicon to react in olivine is limited, this chemical reaction of K with the bed material is expected to be negligible after some h of operation, although it is highly relevant for the start-up with unused olivine.
After the free silicon in olivine is depleted by conversion into stable silicates, it is more likely that K from the fuel is released and remains in the forms of KOH and K
2CO
3 in the boiler (CG1) and predominantly as KOH (GG1) in the gasifier. The high catalytic activity of the bed material in the gasifier and the parallel increase of CO emissions in the boiler part can be explained by the presence of reactive gaseous K in the system. In the boiler, it is noteworthy that during the entire campaign, the O
2 concentration is sufficient for the complete combustion of the fuel at the temperature ranges applied. Yet, CO emissions clearly increase as olivine loses its capacity to bind K in a permanent manner. This trend is well in line with the inhibition of CO combustion by gaseous KOH as investigated under laboratory conditions [
17], as well as with the sulfation route presented in the context of corrosion mitigation [
22]. In fact, even the addition of S at the exit of the cyclone, as shown in
Figure 10, proved to be adequate to promote the full conversion of CO in an atmosphere that is rich in K species.
In the gasification chamber, the results presented in
Figure 5 confirm that the enrichment of the olivine bed with K and other ash elements promotes catalytic activity of the bed material towards char, tar, and the WGS reaction. Relating the catalytic activity to the expected release of KOH [
5,
10] is more complicated, although some evidence can be derived from the results presented here. On the one hand, the capability of the bed material to catalyze char gasification indirectly confirms that there is release of gaseous K from ash-loaded particles into the gasification environment [
16]. On the other hand, the enrichment of particles with reactive K shown here clearly enhances the catalytic properties of the bed as compared to the reference activation campaign without additives (recall the comparison in
Figure 7). This supports the notion that K is a key element in the observed catalytic processes. Furthermore, direct addition of K
2CO
3 to the gasifier and the rapid response obtained in terms of the raw gas composition suggest that K in the gas phase can catalyze reactions involving biomass-derived volatiles. The response of the tar concentration to the addition of K
2CO
3 into the gasifier was fast, albeit somewhat mild. Here, it should be noted that the catalytic activity in the gasifier was already at the highest level observed in the Chalmers gasifier at that point, as shown in
Figure 7. Therefore, it is speculated that a saturation effect may have been reached and no further influence on tar yield could be achieved by the addition of alkali to the system.
The results presented here confirm previous results obtained on a large scale that connect the activation process of olivine to the accumulation of ash elements in the bed [
2,
4,
6,
7], and we emphasize here the role of K in such catalytic activation. While it is difficult to distinguish between heterogeneous and homogeneous catalytic effects, the results suggest that both are important. Some homogeneous catalytic effects in line with the experimental results presented here involve the WGS reaction, inhibition of CO combustion, and tar reactions. In the context of combustion, a recent investigation [
17] confirmed that gaseous K influences the pool of radicals through a mechanism that reflects the responses in CO concentration obtained here. Similar mechanistic investigations of the potential effect of gas phase alkali on the pool of radicals created in a steam gasification environment are currently lacking. Understanding these mechanisms would elucidate the fast and potent effect of K on the H
2 concentration shown here, as well as the roles of alkali in tar formation, steam reforming, and secondary cracking reactions.


