
Mitigation of Particulate Matter and Airborne Pathogens in Swine Barn Emissions with Filtration and UV-A Photocatalysis

 ,
,  , , , and
Abstract
:1. Introduction
2. Results and Discussion
2.1. Treatment of PM by HEPA Filtration and UV-A Photocatalysis
2.2. Treatment of Airborne Pathogens with UV-A Photocatalysis
Normalization of the Data
3. Materials and Methods
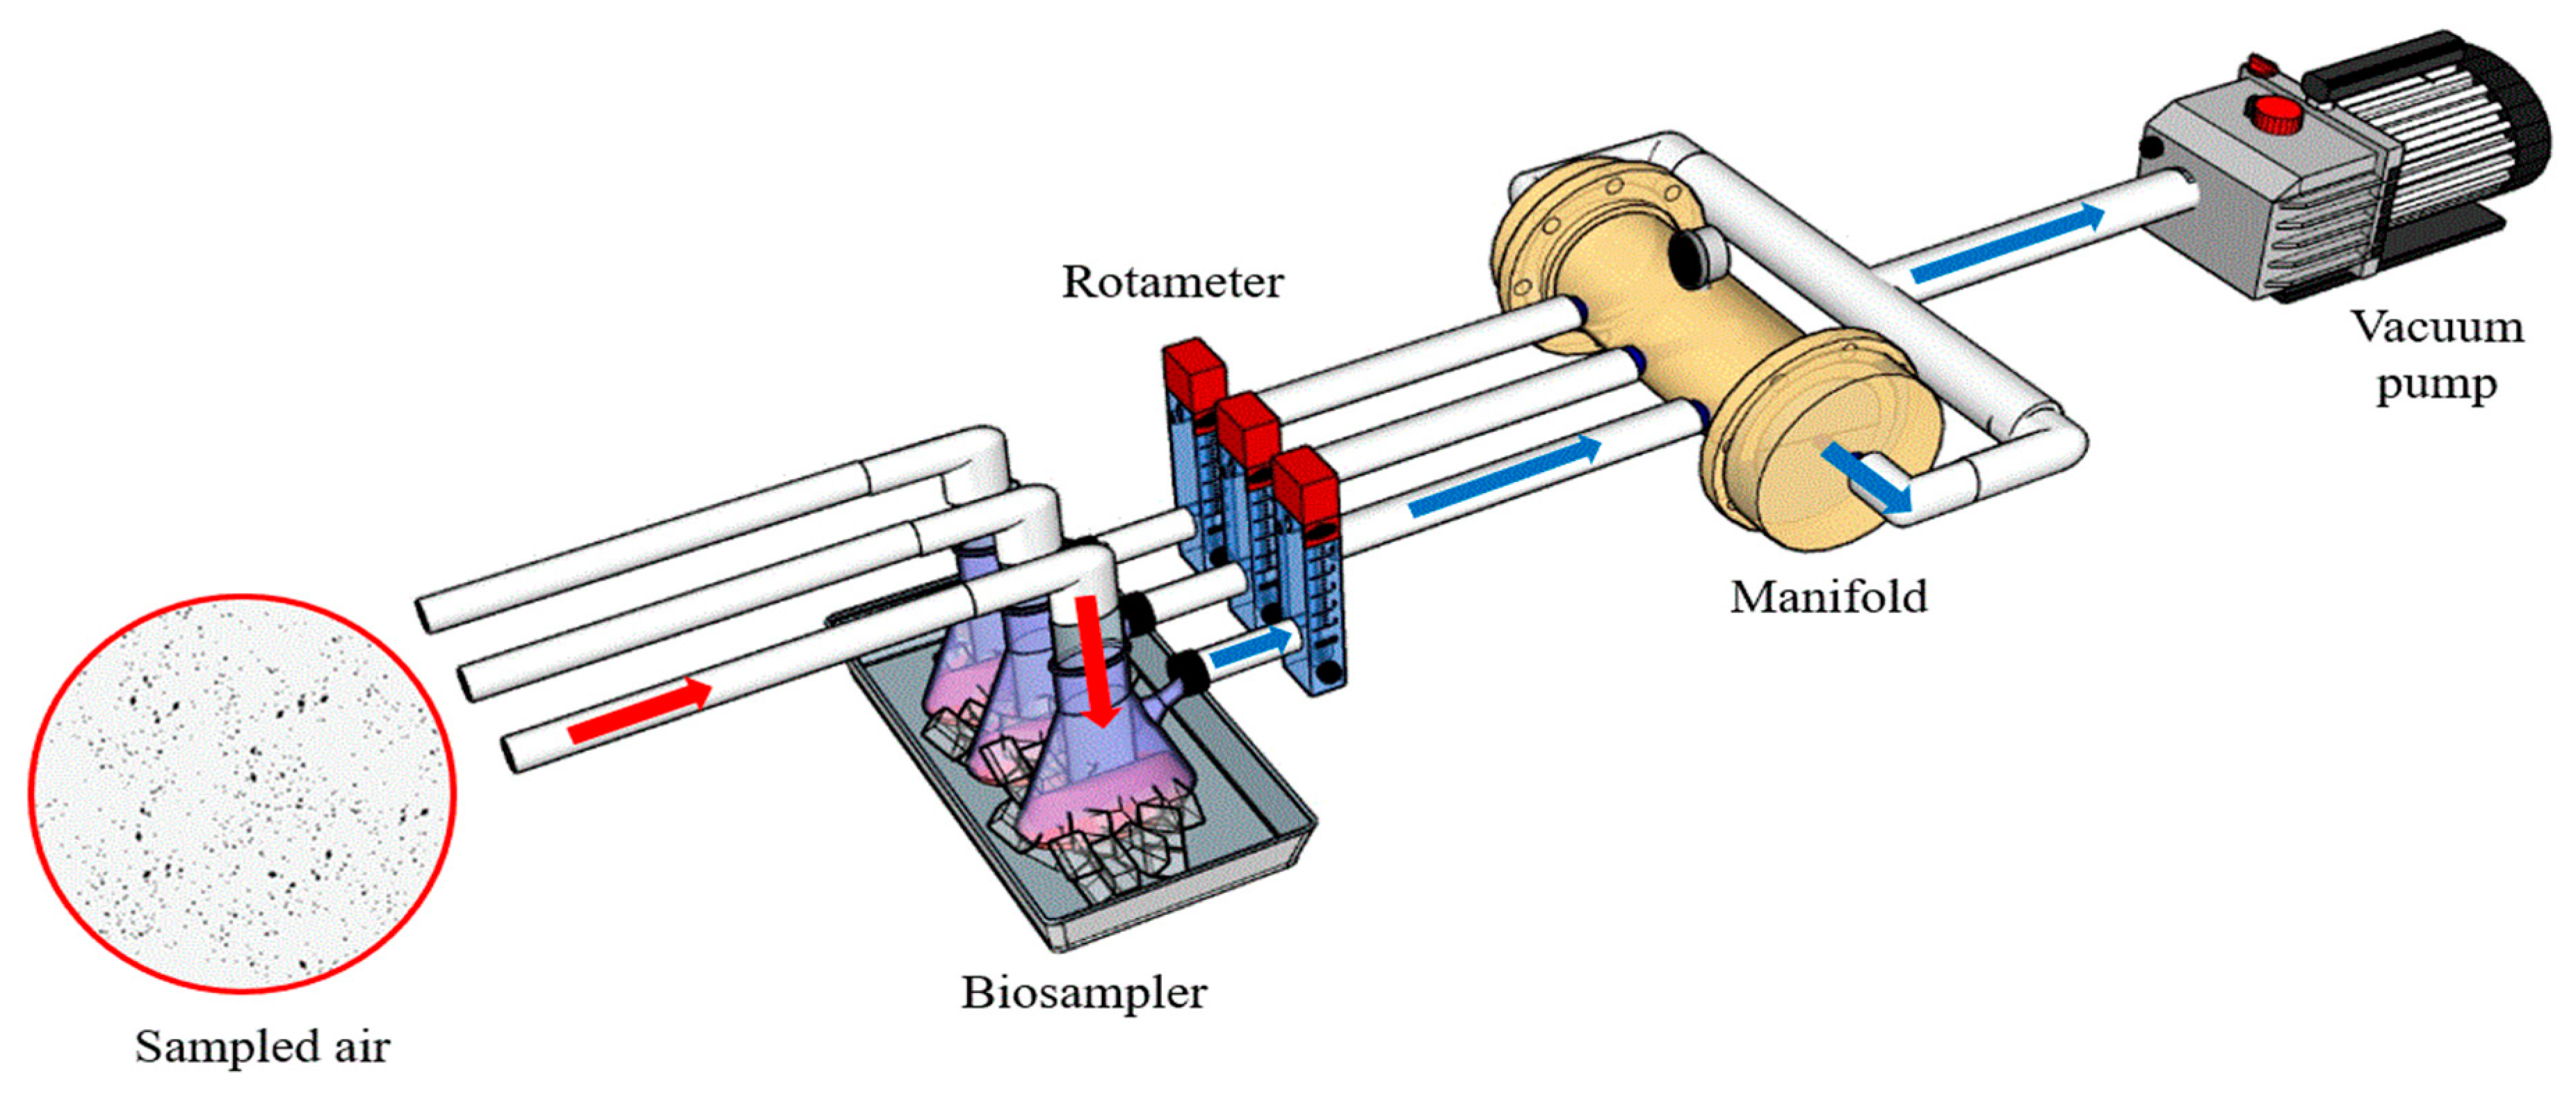
3.1. Viable Particulate Matter Sampling System
3.2. Mobile Lab Setup in the Swine Farm
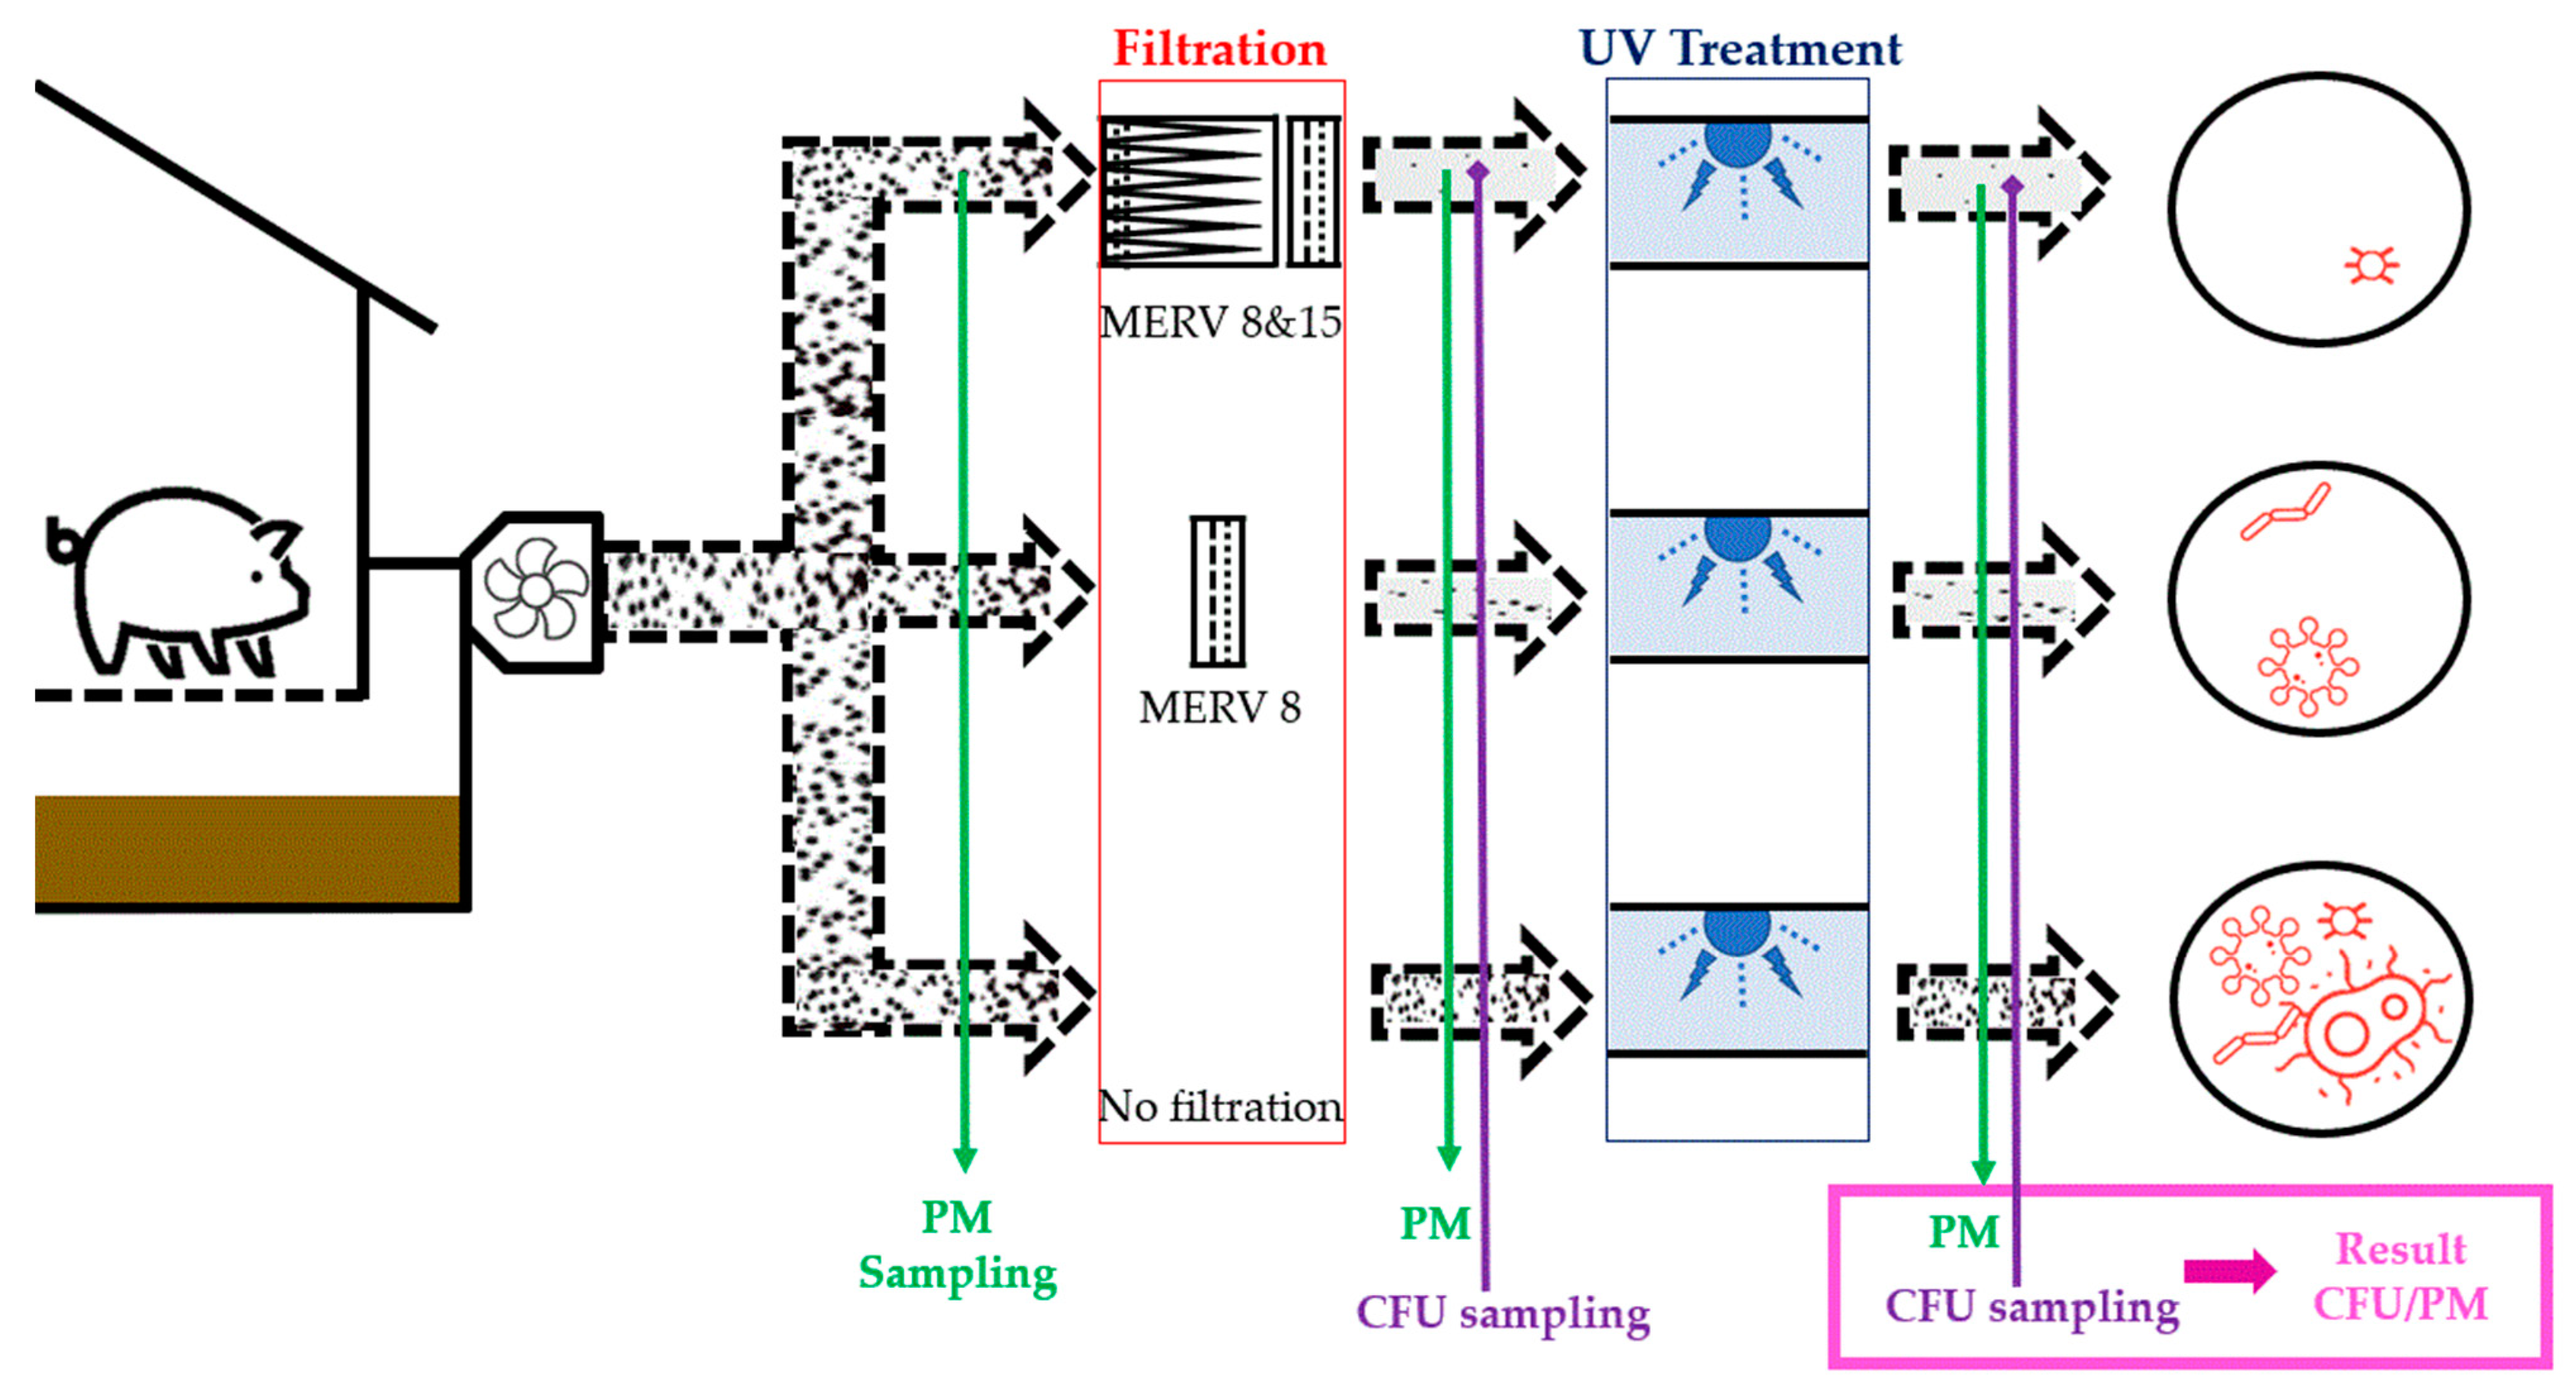
- The ‘best-case’ scenario—MERV 8 and 15 filters out most PM prior to UV treatment.
- The ‘midpoint’ scenario—partial filtration and a moderate PM load in the treated air. Only MERV 8 filter removes a fraction of airborne PM prior to the UV treatment.
- The ‘worst-case’ scenario—no PM filtration. Raw swine barn exhaust discharged from the manure pit is treated by UV.
3.3. UV-A Dose
3.4. Enumeration of Total Colony-forming Unit
3.5. Measurement of Non-Viable Particulate Matter Size and Concentrations
3.6. Photocatalyst (TiO2) Coating
3.7. Data Analysis
3.8. Statistical Analyses
4. Conclusions
- MERV 8 and15 effectively mitigated PM concentrations (96–98%, p ranged from < 0.01 to 0.04) in swine barn exhaust.
- UV-A photocatalysis does not affect PM concentrations in swine barn exhaust.
- UV-A photocatalysis treatment reduced CFU by 15–95%. The CFU percent reduction was higher when airborne PM concentration was low (‘best-case’ > ‘worst-case’). UV-A photocatalysis reduced the concentration of airborne pathogens (43% reduction, p = 0.04) in moderate PM concentration conditions.
- Despite p-values that did not meet the usual statistical cut-off of <0.05 for significance, the large variability of the CFU control samples, the numeric results suggested a real effect.
- Normalization of measured airborne pathogen concentrations by smaller PM size range concentrations led to emerging significant treatment differences for CFUs. Significant mitigation (49–51%, p ranged from 0.01 to 0.03) effect of UV-A photocatalysis on pathogen inactivation was observed when considered in the context of the PM load and PM size ranges in particular for the respirable, PM 2.5 and PM 1 (i.e., below the 10 micron range).
Supplementary Materials
Author Contributions
Funding
Institutional Review Board Statement
Informed Consent Statement
Data Availability Statement
Acknowledgments
Conflicts of Interest
References
- Seedorf, J. An emission inventory of livestock-related bioaerosols for Lower Saxony, Germany. Atmos. Environ. 2004, 38, 6565–6581. [Google Scholar] [CrossRef]
- Costa, A.; Borgonovo, F.; Leroy, T.; Berckmans, D.; Guarino, M. Dust concentration variation in relation to animal activity in a pig barn. Biosyst. Eng. 2009, 104, 118–124. [Google Scholar] [CrossRef]
- Donham, K.J. Association of environmental air contaminants with disease and productivity in swine. Am. J. Vet. Res. 1991, 52, 1723–1730. [Google Scholar] [PubMed]
- Li, P.; Koziel, J.A.; Zimmerman, J.J.; Zhang, J.; Cheng, T.; Yim-Im, W.; Jenks, W.S.; Lee, M.; Chen, B.; Hoff, S.J. Mitigation of Airborne PRRSV Transmission with UV Light Treatment: Proof-of-concept. Agriculture 2021, 11, 259. [Google Scholar] [CrossRef]
- Dee, S.; Batista, L.; Deen, J.; Pijoan, C. Evaluation of an air-filtration system for preventing aerosol transmission of porcine reproductive and respiratory syndrome virus. Can. J. Vet. Res. 2005, 69, 293–298. [Google Scholar]
- Dee, S.; Otake, S.; Deen, J. Use of a production region model to assess the efficacy of various air filtration systems for preventing airborne transmission of porcine reproductive and respiratory syndrome virus and Mycoplasma hyopneumoniae: Results from a 2-year study. Virus Res. 2010, 154, 177–184. [Google Scholar] [CrossRef] [PubMed]
- Holtkamp, D.J.; Johnson, C.; Koziel, J.A.; Li, P.; Murray, D.; Ruston, C.R.; Stephan, A.; Torremorell, M.; Wedel, K. Ultraviolet C (UVC) Standards and Best Practices for the Swine Industry. Agric. Biosyst. Eng. Tech. Rep. White Pap. 2020, 29. [Google Scholar]
- Costa, A.; Chiarello, G.L.; Selli, E.; Guarino, M. Effects of TiO2 based photocatalytic paint on concentrations and emissions of pollutants and on animal performance in a swine weaning unit. J. Environ. Manag. 2012, 96, 86–90. [Google Scholar] [CrossRef]
- Guarino, M.; Costa, A.; Porro, M. Photocatalytic TiO2 coating—to reduce ammonia and greenhouse gases concentration and emission from animal husbandries. Bioresour. Technol. 2008, 99, 2650–2658. [Google Scholar] [CrossRef]
- Lee, M.; Wi, J.; Koziel, J.A.; Ahn, H.; Li, P.; Chen, B.; Meiirkhanuly, Z.; Banik, C.; Jenks, W. Effects of UV-A light treatment on ammonia, hydrogen sulfide, greenhouse gases, and ozone in simulated poultry barn conditions. Atmosphere 2020, 11, 283. [Google Scholar] [CrossRef] [Green Version]
- Rockafellow, E.M.; Koziel, J.A.; Jenks, W.S. Laboratory-Scale Investigation of UV treatment of ammonia for livestock and poultry barn exhaust applications. J. Environ. Qual. 2012, 41, 281–288. [Google Scholar] [CrossRef] [PubMed] [Green Version]
- Koziel, J.A.; Yang, X.; Van Leeuwen, J.; Jenks, W.S.; Laor, Y. Treatment of odorous VOCs with ultraviolet light. Chem. Eng. Trans. 2010, 23, 363. [Google Scholar] [CrossRef]
- Zhu, W.; Koziel, J.A.; Maurer, D.L. Mitigation of livestock odors using black light and a new titanium dioxide-based catalyst: Proof-of-concept. Atmosphere 2017, 8, 103. [Google Scholar] [CrossRef] [Green Version]
- Lee, M.; Li, P.; Koziel, J.A.; Ahn, H.; Wi, J.; Chen, B.; Meiirkhanuly, Z.; Banik, C.; Jenks, W.S. Pilot-scale testing of UV-A light treatment for mitigation of NH3, H2S, GHGs, VOCs, odor, and O3 inside the poultry barn. Front. Chem. 2020, 8, 613. [Google Scholar] [CrossRef] [PubMed]
- Maurer, D.L.; Koziel, J.A. On-farm pilot-scale testing of black ultraviolet light and photocatalytic coating for mitigation of odor, odorous VOCs, and greenhouse gases. Chemosphere 2019, 221, 778–784. [Google Scholar] [CrossRef] [PubMed]
- Koziel, J.A.; Yang, X.; Cutler, T.; Zhang, S.; Zimmerman, J.J.; Hoff, S.J.; Jenks, W.S.; Laor, Y.; Ravid, U.; Armon, R. Mitigation of odor and pathogens from CAFOs with UV/TiO2: Exploring the cost effectiveness. In Proceedings of the Mitigating Air Emissions from Animal Feeding Operations, Des Moines, IA, USA, 19–21 May 2008; pp. 169–173. [Google Scholar]
- Yang, X.; Koziel, J.A.; Laor, Y.; Zhu, W.; Van Leeuwen, J.H.; Jenks, W.S.; Hoff, S.J.; Zimmerman, J.; Zhang, S.; Ravid, U. VOC removal from manure gaseous emissions with UV photolysis and UV-TiO2 photocatalysis. Catalysts 2020, 10, 607. [Google Scholar] [CrossRef]
- Lee, M.; Koziel, J.A.; Murphy, W.; Jenks, W.S.; Fonken, B.; Storjohann, R.; Chen, B.; Li, P.; Banik, C.; Wahe, L. Design and testing of mobile laboratory for mitigation of gaseous emissions from livestock agriculture with photocatalysis. Int. J. Environ. Res. Public Health 2021, 18, 1523. [Google Scholar] [CrossRef] [PubMed]
- Lee, M.; Koziel, J.A.; Murphy, W.; Jenks, W.S.; Chen, B.; Li, P.; Banik, C. Evaluation of TiO2 based photocatalytic treatment of odor and gaseous emissions from swine manure with UV-A and UV-C. Animals 2021, 11, 1289. [Google Scholar] [CrossRef]
- Lee, M.; Koziel, J.A.; Murphy, W.; Jenks, W.S.; Chen, B.; Li, P.; Banik, C. Mitigation of Odor and Gaseous Emissions from Swine Barn with UV-A and UV-C Photocatalysis. Atmosphere 2021, 12, 585. [Google Scholar] [CrossRef]
- Heber, A.J.; Lim, T.T.; Ni, J.Q.; Tao, P.C.; Schmidt, A.M.; Koziel, J.A.; Hoff, S.J.; Jacobson, L.D.; Zhang, Y.; Baughman, G.B. Quality assured measurements of animal building emissions: Particulate matter concentrations. J. Air Waste Manag. Assoc. 2006, 56, 1642–1648. [Google Scholar] [CrossRef] [Green Version]
- Le, T.T.N.; Nagata, H.; Takahashi, A.; Aihara, M.; Okamoto, T.; Shimohata, T.; Mawatari, K.; Akutagawa, M.; Kinouchi, Y.; Haraguchi, M. Sterilization effect of UV light on Bacillus spores using TiO2 films depends on wavelength. J. Med. Investig. 2012, 59, 53–58. [Google Scholar] [CrossRef] [Green Version]
- Ramesh, T.; Yaparatne, S.; Tripp, C.P.; Nayak, B.; Amirbahman, A. Ultraviolet light-assisted photocatalytic disinfection of Escherichia coli and its effects on the quality attributes of white grape juice. Food Bioprocess Technol. 2018, 11, 2242–2252. [Google Scholar] [CrossRef]
- Kühn, K.P.; Chaberny, I.F.; Massholder, K.; Stickler, M.; Benz, V.W.; Sonntag, H.G.; Erdinger, L. Disinfection of surfaces by photocatalytic oxidation with titanium dioxide and UVA light. Chemosphere 2003, 53, 71–77. [Google Scholar] [CrossRef]
- Gayán, E.; Condón, S.; Álvarez, I. Biological aspects in food preservation by Ultraviolet Light: A Review. Food Bioprocess Technol. 2013, 7, 1–20. [Google Scholar] [CrossRef]
- Wang, C.; Lu, S.; Zhang, Z. Inactivation of airborne bacteria using different UV sources: Performance modeling, Energy Utilization, and endotoxin degradation. Sci. Total Environ. 2019, 655, 787–795. [Google Scholar] [CrossRef] [PubMed]
- Song, K.; Mohseni, M.; Taghipour, F. Mechanisms investigation on bacterial inactivation through combinations of UV wavelengths. Water Res. 2019, 163, 114875. [Google Scholar] [CrossRef] [PubMed]
- Bosshard, F.; Riedel, K.; Schneider, T.; Geiser, C.; Bucheli, M.; Egli, T. Protein oxidation and aggregation in UvA-irradiated escherichia coli cells as signs of accelerated cellular senescence. Environ. Microbiol. 2010, 12, 2931–2945. [Google Scholar] [CrossRef] [PubMed]
- Girard, P.M.; Francesconi, S.; Pozzebon, M.; Graindorge, D.; Rochette, P.; Drouin, R.; Sage, E. UVA-induced damage to DNA and proteins: Directversusindirect photochemical processes. J. Phys. Conf. Ser. 2011, 261, 012002. [Google Scholar] [CrossRef]
- Hoerter, J.D.; Arnold, A.A.; Kuczynska, D.A.; Shibuya, A.; Ward, C.S.; Sauer, M.G.; Gizachew, A.; Hotchkiss, T.M.; Fleming, T.J.; Johnson, S. Effects of sublethal UVA irradiation on activity levels of oxidative defense enzymes and protein oxidation in escherichia coli. J. Photochem. Photobiol. B Biol. 2005, 81, 171–180. [Google Scholar] [CrossRef]
- Oppezzo, O.J.; Pizarro, R.A. Sublethal effects of ultraviolet a radiation on Enterobacter cloacae. J. Photochem. Photobiol. B Biol. 2001, 62, 158–165. [Google Scholar] [CrossRef]
- Ramabhadran, T.V.; Jagger, J. Mechanism of growth delay induced in escherichia coli by near ultraviolet radiation. Proc. Natl. Acad. Sci. USA 1976, 73, 59–63. [Google Scholar] [CrossRef] [PubMed] [Green Version]
- Zacarías, S.M.; Pirola, S.; Manassero, A.; Visuara, M.E.; Alfano, O.M.; Satuf, M.L. Photocatalytic inactivation of Bioaerosols in a fixed-bed reactor with Tio2-coated glass rings. Photochem. Photobiol. Sci. 2019, 18, 884–890. [Google Scholar] [CrossRef] [PubMed]
- Pal, A.; Min, X.; Yu, L.E.; Pehkonen, S.O.; Ray, M.B. Photocatalytic inactivation of bioaerosols by tio2 coated membrane. Int. J. Chem. React. Eng. 2005, 3. [Google Scholar] [CrossRef]
- Laird, D.T.; Gambrel-Lenarz, S.A.; Scher, F.M.; Graham, T.E.; Reddy, R. Microbiological Count Methods. In Standard Methods for the Examination of Dairy Products; Wehr, H.W., Frank, J.F., Eds.; American Public Health Association: Washington, DC, USA, 2004; pp. 153–186. [Google Scholar]
- Li, P.; Koziel, J.; Zimmerman, J.; Hoff, S.; Zhang, J.; Cheng, T.; Yim-Im, W.; Lee, M.; Chen, B.; Jenks, W. Designing and Testing of a System for Aerosolization and Recovery of Viable Porcine Reproductive and Respiratory Syndrome Virus (PRRSV): Theoretical and Engineering Considerations. Front. Bioeng. Biotechnol. 2021, 9, 659609. [Google Scholar] [CrossRef] [PubMed]


| Total PM | PM 10 | Respirable PM | PM 2.5 | PM 1 | ||||||
|---|---|---|---|---|---|---|---|---|---|---|
| Conc (mg∙m–3) | % R (p-Value) | Conc (mg∙m−3) | % R (p-Value) | Conc (mg∙m−3) | % R (p-Value) | Conc (mg∙m−3) | % R (p-Value) | Conc (mg∙m−3) | % R (p-Value) | |
| Control (before filtration, sampling port 1) | 0.224 ± 0.161 | - | 0.104 ± 0.128 | - | 0.094 ± 0.108 | - | 0.084 ± 0.084 | - | 0.105 ± 0.067 | - |
| Treatment I (after MERV 8 and 15 filtration, sampling port 2) | 0.0037 ± 0.0008 | 98.3 (0.01) | 0.0033 ± 0.0005 | 96.8 (0.01) | 0.0031 ± 0.0004 | 96.7 (0.03) | 0.0031 ± 0.0004 | 96.3 (0.04) | 0.0031 ± 0.0004 | 97.0 (<0.01) |
| Treatment II (after UV-A, sampling port 3) | 0.0037 ± 0.0008 | 0 (1.00) | 0.0031 ± 0.0004 | 4.5 (0.35) | 0.003 ± 0.0004 | 0 (1.00) | 0.0030 ± 0.0000 | 4.8 (0.35) | 0.0030 ± 0.0000 | 4.8 (0.35) |
| Total PM | PM 10 | Respirable PM | PM 2.5 | PM 1 | ||||||
|---|---|---|---|---|---|---|---|---|---|---|
| Conc (mg∙m−3) | % R (p-Value) | Conc (mg∙m−3) | % R (p-Value) | Conc (mg∙m−3) | % R (p-Value) | Conc (mg∙m−3) | % R (p-Value) | Conc (mg∙m−3) | % R (p-Value) | |
| Control (before filtration, sampling port 1) | 0.267 ± 0.241 | - | 0.205 ± 0.185 | - | 0.153 ± 0.175 | - | 0.146 ± 0.174 | - | 0.143 ± 0.174 | - |
| Treatment I (after MERV 8, sampling port 2) | 0.061 ± 0.028 | 77.1 (0.055) | 0.048 ± 0.018 | 76.6 (0.056) | 0.027 ± 0.009 | 82.6 (0.09) | 0.022 ± 0.007 | 84.7 (0.10) | 0.020 ± 0.006 | 86.3 (0.10) |
| Treatment II (after UV-A, sampling port 3) | 0.061 ± 0.016 | 0.7 (0.96) | 0.050 ± 0.011 | −3.2 (0.84) | 0.029 ± 0.005 | −7.0 (0.61) | 0.024 ± 0.005 | −7.1 (0.62) | 0.023 ± 0.005 | −14.9 (0.24) |
| Total PM | PM 10 | Respirable PM | PM 2.5 | PM 1 | ||||||
|---|---|---|---|---|---|---|---|---|---|---|
| Conc (mg∙m−3) | % R (p-Value) | Conc (mg∙m−3) | % R (p-Value) | Conc (mg∙m−3) | % R (p-Value) | Conc (mg∙m−3) | % R (p-Value) | Conc (mg∙m−3) | % R (p-Value) | |
| Control (Sampling port 1) | 0.203 ± 0.169 | - | 0.122 ± 0.116 | - | 0.070 ± 0.075 | - | 0.063 ± 0.075 | - | 0.061 ± 0.075 | - |
| Treatment I (Sampling port 2) | 0.201 ± 0.096 | 0.6 (0.98) | 0.124 ± 0.055 | −1.4 (0.97) | 0.064 ± 0.044 | 9.4 (0.85) | 0.057 ± 0.043 | 10.5 (0.85) | 0.054 ± 0.043 | 11.9 (0.84) |
| Treatment II (after UV-A, sampling port 3) | 0.201 ± 0.082 | 0.0 (0.99) | 0.139 ± 0.077 | −10.7 (0.72) | 0.081 ± 0.074 | −21.4 (0.64) | 0.073 ± 0.075 | −21.9 (0.67) | 0.067 ± 0.077 | −19.2 (0.73) |
| Scenario | Control (Inlet to UV Mobile Lab, Location #2, Figure 2) | UV Treatment (Outlet of UV Mobile Lab, Location #3, Figure 2) | % Reduction | p-Value | ||||||
|---|---|---|---|---|---|---|---|---|---|---|
| C1 (CFU) | C2 (CFU) | C3 (CFU) | Mean ± S.D. | T1 (CFU) | T2 (CFU) | T3 (CFU) | Mean ± S.D. | |||
| MERV 8 and 15 (Best) | 5.0 × 10³ | 2.0 × 10² | 3.6 × 10³ | 2930 ± 2470 | 4.0 × 10² | 0 | 0 | 133 ± 231 | 95 | 0.17 |
| 6.0 × 10² | 2.4 × 10³ | 0 | 1000 ± 1250 | 2.0 × 10² | 0 | 0 | 67 ± 115 | 93 | 0.34 | |
| MERV 8 (Midpoint) | 6.8 × 10³ | 7.2 × 10³ | 9.8 × 10³ | 7930 ± 1630 | 5.0 × 10³ | 5.0 × 10³ | 5.8 × 10³ | 5270 ± 462 | 34 | 0.06 |
| No filtration (Worst) | 1.3 × 10⁴ | 1.2 × 10⁴ | 1.1 × 10⁴ | 12,100 ± 1410 | 9.6 × 10³ | 7.8 × 10³ | 1.3 × 10⁴ | 10,300 ± 2860 | 15 | 0.52 |
| 6.4 × 10⁴ | 2.8 × 10⁴ | 1.6 × 10⁴ | 36,300 ± 24,700 | 2.4 × 10⁴ | 2.6 × 10⁴ | 1.6 × 10⁴ | 21,900 ± 5500 | 40 | 0.38 | |
| Scenario | Control | UV Treatment | % Reduction | p-Value | ||||||
|---|---|---|---|---|---|---|---|---|---|---|
| C1 (CFUPM) | C2 (CFUPM) | C3 (CFUPM) | Mean ± S.D. | T1 (CFUPM) | T2 (CFUPM) | T3 (CFUPM) | Mean ± S.D. | |||
| MERV 8 and 15 (Best) | 1890 | 76 | 1361 | 1110 ± 933 | 148 | 0 | 0 | 49 ± 86 | 96 | 0.17 |
| 965 | 241 | 0 | 402 ± 502 | 57 | 0 | 0 | 19 ± 33 | 95 | 0.29 | |
| MERV 8 (Midpoint) | 302 | 320 | 435 | 352 ± 72 | 192 | 192 | 222 | 202 ± 18 | 43 | 0.04 |
| No filtration (Worst) | 393 | 358 | 311 | 354 ± 41 | 228 | 186 | 319 | 244 ± 68 | 31 | 0.20 |
| 623 | 269 | 163 | 352 ± 241 | 174 | 189 | 117 | 160 ± 38 | 55 | 0.28 | |
| Scale | Mean Control | Mean Treatment | Mean Difference | Test Statistic | % Reduction | p-Value |
|---|---|---|---|---|---|---|
| Raw CFU | 12,000 | 7387 | 4613 | 1.80 | 38 | 0.147 |
| CFUD (CFU·m−3) normalized by Total PM | 514 | 135 | 379 | 2.15 | 64 | 0.098 |
| CFUD (CFU·m−3) normalized by PM 10 | 637 | 247 | 389 | 1.83 | 61 | 0.078 |
| CFUD (CFU·m−3) normalized by Respirable PM | 1053 | 519 | 534 | 3.35 | 51 | 0.014 |
| CFUD (CFU·m−3) normalized by PM 2.5 | 1236 | 608 | 628 | 4.24 | 51 | 0.007 |
| CFUD (CFU·m−3) normalized by PM 1 | 1293 | 660 | 633 | 4.03 | 49 | 0.008 |
Publisher’s Note: MDPI stays neutral with regard to jurisdictional claims in published maps and institutional affiliations. |
© 2021 by the authors. Licensee MDPI, Basel, Switzerland. This article is an open access article distributed under the terms and conditions of the Creative Commons Attribution (CC BY) license (https://creativecommons.org/licenses/by/4.0/).
Share and Cite
Lee, M.; Koziel, J.A.; Macedo, N.R.; Li, P.; Chen, B.; Jenks, W.S.; Zimmerman, J.; Paris, R.V. Mitigation of Particulate Matter and Airborne Pathogens in Swine Barn Emissions with Filtration and UV-A Photocatalysis. Catalysts 2021, 11, 1302. https://doi.org/10.3390/catal11111302
Lee M, Koziel JA, Macedo NR, Li P, Chen B, Jenks WS, Zimmerman J, Paris RV. Mitigation of Particulate Matter and Airborne Pathogens in Swine Barn Emissions with Filtration and UV-A Photocatalysis. Catalysts. 2021; 11(11):1302. https://doi.org/10.3390/catal11111302
Chicago/Turabian StyleLee, Myeongseong, Jacek A. Koziel, Nubia R. Macedo, Peiyang Li, Baitong Chen, William S. Jenks, Jeffrey Zimmerman, and R. Vincent Paris. 2021. "Mitigation of Particulate Matter and Airborne Pathogens in Swine Barn Emissions with Filtration and UV-A Photocatalysis" Catalysts 11, no. 11: 1302. https://doi.org/10.3390/catal11111302
APA StyleLee, M., Koziel, J. A., Macedo, N. R., Li, P., Chen, B., Jenks, W. S., Zimmerman, J., & Paris, R. V. (2021). Mitigation of Particulate Matter and Airborne Pathogens in Swine Barn Emissions with Filtration and UV-A Photocatalysis. Catalysts, 11(11), 1302. https://doi.org/10.3390/catal11111302