Article

A Combination of EPR, Microscopy, Electrophoresis and Theory to Elucidate the Chemistry of W- and N-Doped TiO2 Nanoparticle/Water Interfaces

1
Department of Chemistry, University of Aberdeen, Meston Building, Meston Walk, Aberdeen AB24 3UE, UK
2
Whitaker Laboratory, Department of Materials Science and Engineering, Lehigh University, 5 East Packer Ave, Bethlehem, PA 18015, USA
3
School of Chemistry, Cardiff University, Main Building, Park Place, Cardiff CF10 3AT, UK
*
Author to whom correspondence should be addressed.
Catalysts 2021, 11(11), 1305; https://doi.org/10.3390/catal11111305
Submission received: 8 September 2021 / Revised: 15 October 2021 / Accepted: 18 October 2021 / Published: 28 October 2021
(This article belongs to the Special Issue Electron Paramagnetic Resonance in Photocatalysis)

Abstract

:
The doping of T i O 2 -based nanomaterials for semiconductor-sensitised photoreactions has been a practice extensively studied and applied for many years. The main goal remains the improvement of light harvesting capabilities under passive solar irradiation, that in the case of undoped T i O 2 is limited and restricted to relatively low latitudes. The activity and selectivity of doped T i O 2 photocatalysts are generally discussed on the basis of the modified band structure; energetics of intrinsic or extrinsic band gaps including trapping states; redox potentials of band edges, including band bending at solid/fluid interfaces; and charge carriers scavenging/transfer by/to adsorbed species. Electron (and hole) transfer to adsorbates is often invoked to justify the formation of highly reactive species (e.g., H O . from water); however, a complete description of the nanoparticle surface chemistry dictating adsorption/desorption events is often missing or overlooked. Here, we show that by employing a surface electrochemical triple-layer (TLM) approach for the nanoparticles/water interface, in combination with electron paramagnetic resonance spectroscopy (EPR), transmission electron microscopy and electrophoretic measurements, we can elucidate the surface chemistry of doped T i O 2 nanoparticles and link it to the nature of the dopants. Exemplifying it for the cases of undoped, as well as W- and N-doped and codoped T i O 2 nanoparticles, we show how surface charge density; surface, Stern and ζ potentials; surface acidity constants; and speciation of surface sites are influenced by the nature of the dopants and their loading.

1. Introduction

The doping of T i O 2 nanomaterials for semiconductor-sensitised photoreactions has been a practice extensively studied and applied for many years; the use of undoped T i O 2 in passive solar applications is limited and restricted to relatively low latitudes [1]. The improvement of light harvesting capabilities under passive solar irradiation as well as the enhancement of activity and selectivity of T i O 2 -sensitised photoreactions remain the main goals for which this practice is employed. Doping strategies have been largely explored through the last three decades, including self-doping [2,3,4]; non-metal doping [5,6,7,8,9,10]; transitional metal doping [11,12,13,14,15,16,17,18,19,20,21,22,23,24]; metal, non-metal codoping [25,26,27,28,29,30,31,32,33]; and rare-earth metal doping [34,35]. The literature cited here is only representative of a few examples and by no means exhaustive. These works show that dopants can play a pivotal role in stabilising phases otherwise thermodynamically unstable, altering the electronic configuration and energetics of the host lattice, and therefore governing the magnetic, optical as well as chemical and catalytic properties of the host metal oxide. In the case of transition metal dopants, their partially filled d-orbitals allow for a series of new energy levels below the conduction band edge of the host semiconductor to be accessible. Often, the result is a red shift of the band-gap transition and a modulation of the semiconductor Fermi level. Furthermore, these new energy levels can alter the charge carrier equilibrium concentration by serving as electron-hole trapping centres, potentially suppressing charge carrier recombination (if both electron and hole are separately trapped) or enhancing charge carrier recombination (if both electron and hole are trapped by the same centre or, in the absence of charge scavengers, one of the two charge carriers is trapped while the other is not). An example of the latter case is elegantly demonstrated by D’Arienzo et al. [36] using N-doped T i O 2 . These authors found that dopant-induced recombination events can completely counterbalance the additional charge separation resulting from successful sensitisation of the photocatalyst with visible light photons [36]. Electron trapping generally occurs at a much faster rate than hole trapping, and in most of the cases the net result is a reduction of the oxidation state of the metal ions in the T i O 2 crystal lattice.
Electron Paramagnetic Resonance (EPR) spectroscopy has proven to be a technique of supreme elegance, sensitivity and wealth of information for analysing electron trapping as well as electron transfer events, the chemical and crystallographic nature of the trapping centres and reduced metal ions in doped T i O 2 , and it has proved imperative when designing high performance photocatalysts and semiconductor sensitisers.
Here, we show that EPR can also be used in combination with electron microscopy, electrophoresis and colloidal chemistry theory to provide unique insights into the nature of colloidal nanoparticles doped T i O 2 surfaces and aqueous interface chemistry. Structural and thermodynamic parameters that are derived allow to interpret adsorption/desorption mechanisms of reactive substrates in semiconductor photocatalysis, i.e., details that are often overlooked when assessing photocatalytic activity/selectivity of semiconductor sensitised photoreactions using doped T i O 2 nanoparticles. In this study, we are presenting an interpretation of the metal oxide/electrolyte (aqueous solution) interface for W and N codoped T i O 2 and comparing it to the case of undoped T i O 2 as well as monodoped W or N T i O 2 to ascertain the role of the single dopants in conditioning the surface/interface chemistry. EPR data are coupled to experimental and simulated data of surface charge densities, Stern and electrokinetic potentials which are analysed and interpreted using the interfacial model proposed by Blesa and Kallay [37].

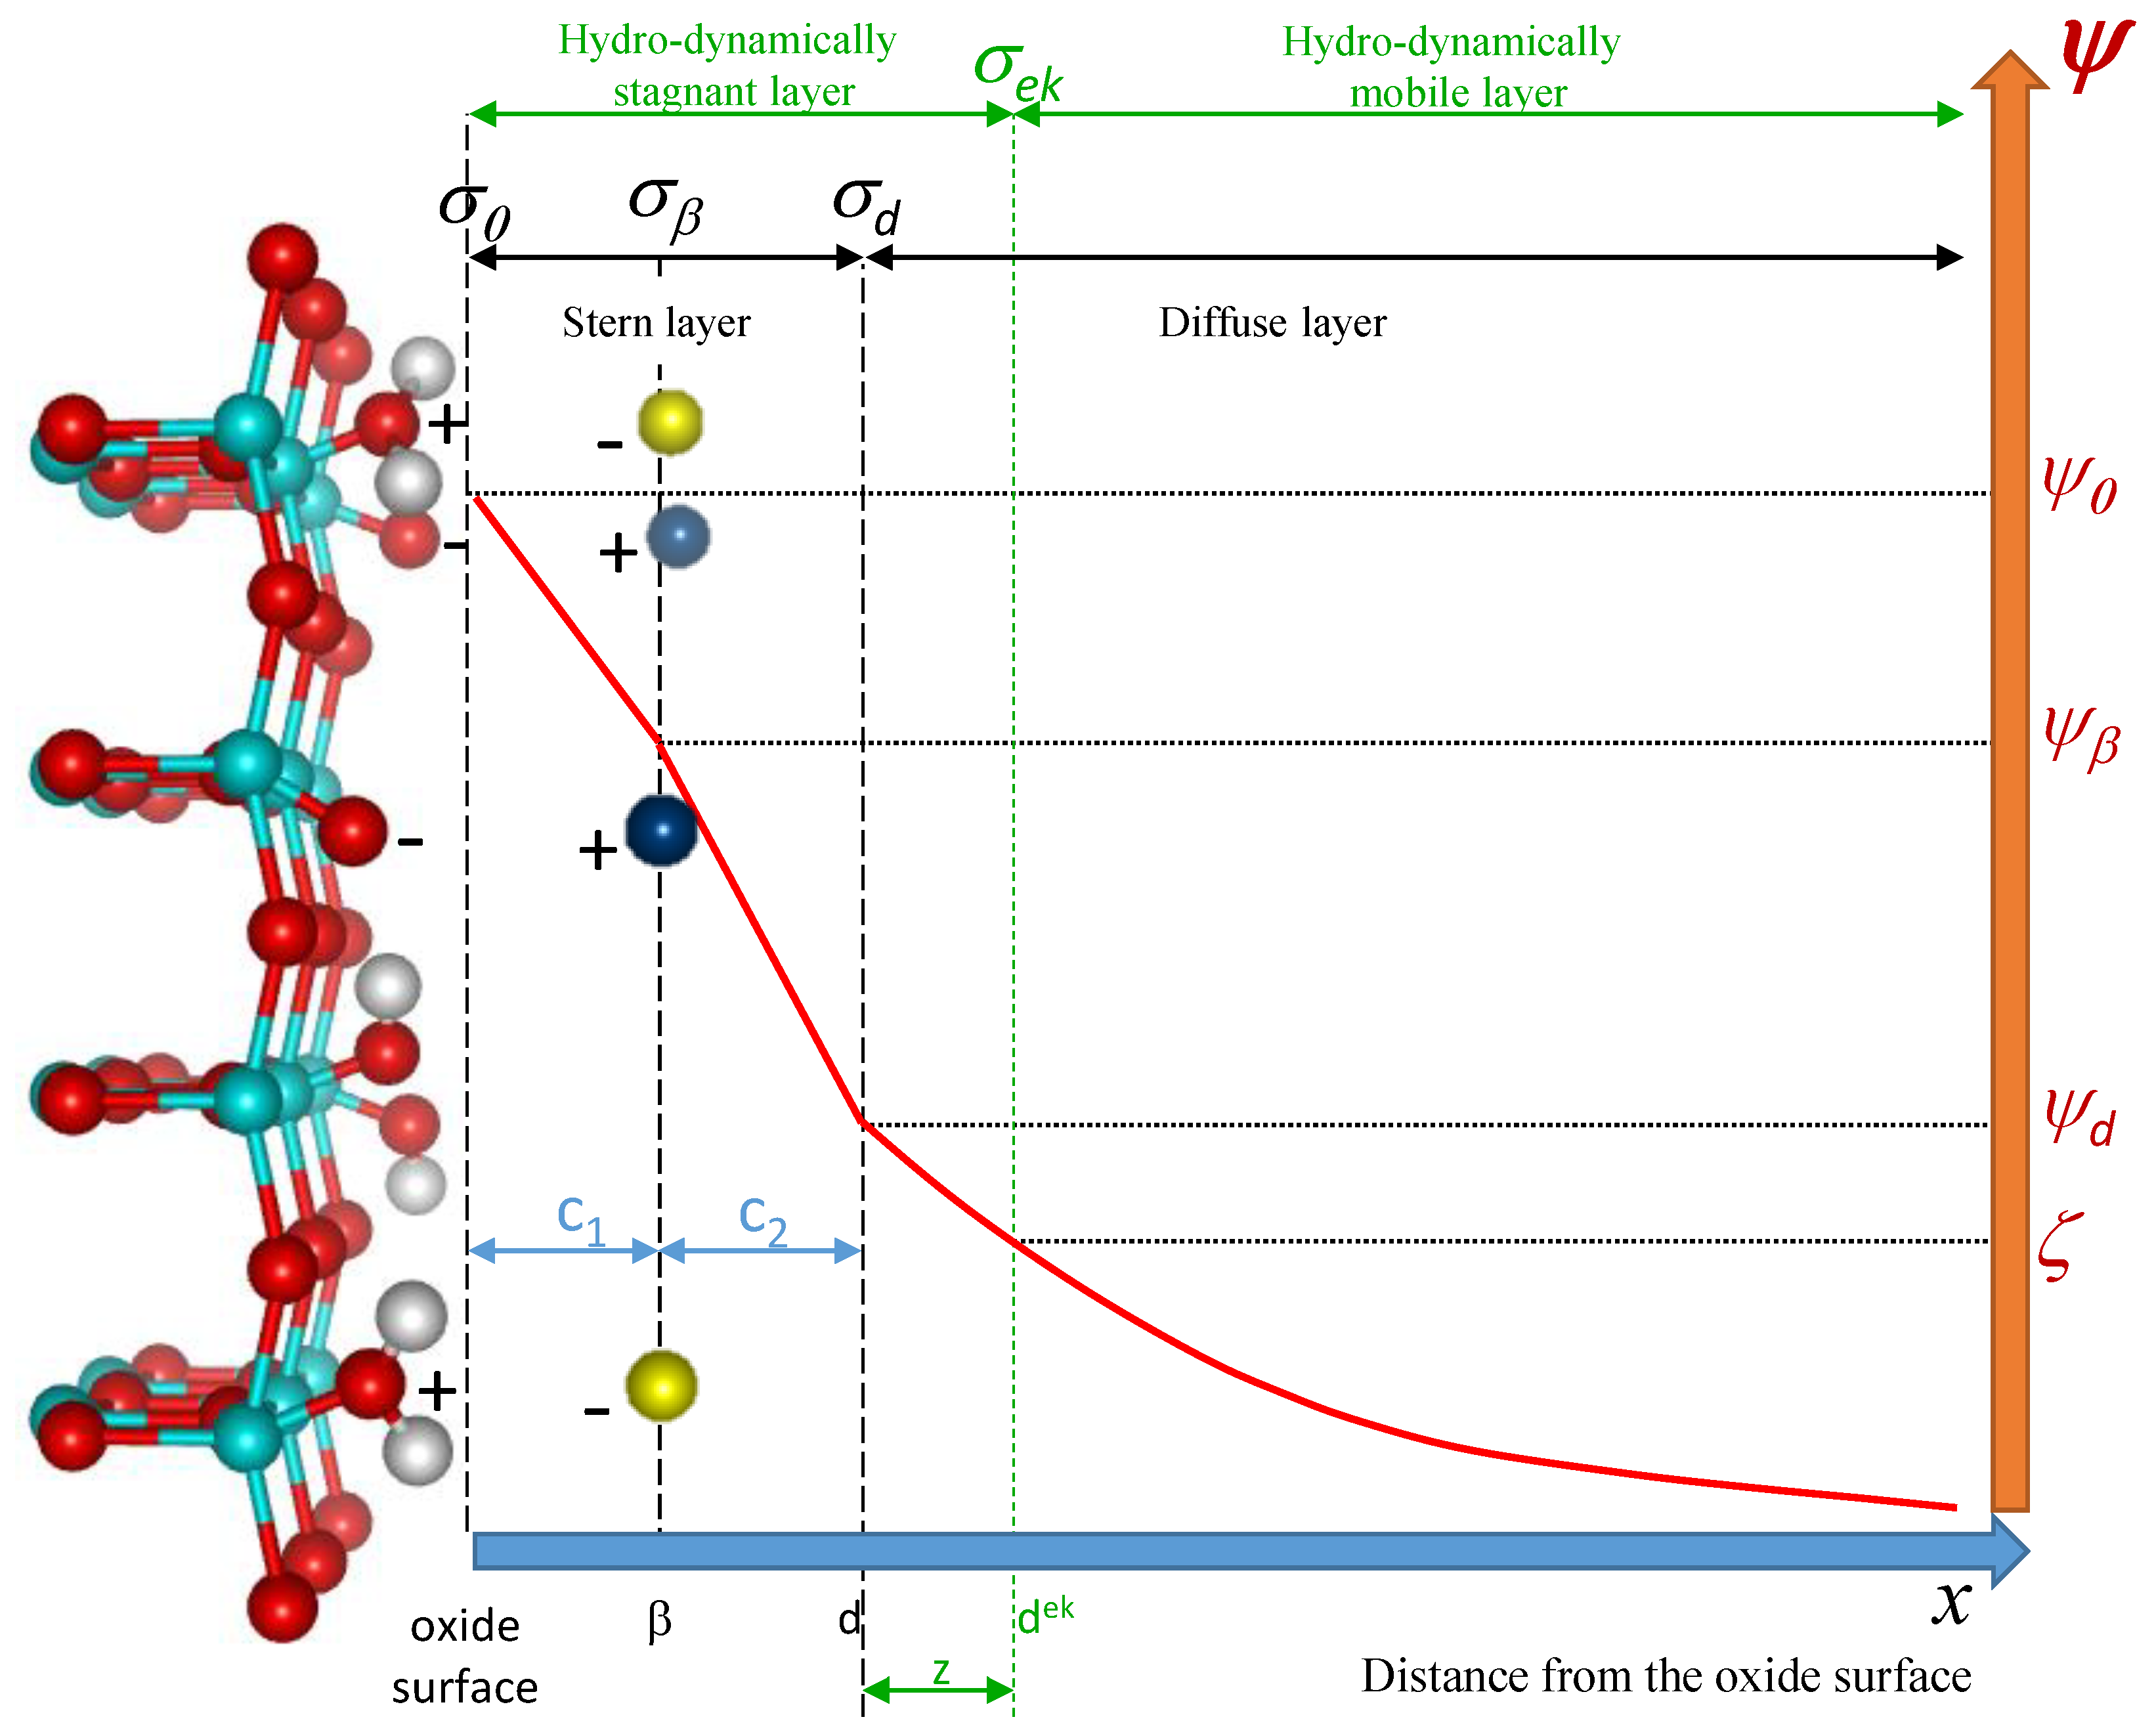
2. Theoretical Description and Simulation of the 2-pK Charging Triple-Layer Model (2-pK TLM) of the Oxide/Electrolyte Interface

2.1. Theoretical Description

A typical diagram of the triple-layer model (TLM) is shown in Figure 1. On the basis of the theoretical approach proposed by Piasecki et al. [38], S O is considered to be the free surface site (i.e., unoccupied surface oxygen), the concentration of which is denoted by [ S O ]. S is used to denote a surface metal atom. The potential determining ions, i.e., H + , together with the ions C + and A of the supporting electrolyte, can form surface complexes denoted as S O H , S O H 2 + , S O C + and S O S O H 2 + A with concentrations represented by [ S O H ], [ S O H 2 + ], [ S O C + ] and [ S O S O H 2 + A ], respectively. This chemistry is possible due to the amphoteric character of the surface S O H groups:
S O H 2 + SOH + H + K a 1 int
SOH SO + H + K a 2 int
and the counterions association with the charged surface sites, i.e., adsorption of counterions in the Stern layer. K a n i n t represent the dissociation constants of protonated surface sites.
SOH + C + SO C + + H + K C int
S O H 2 + A SOH + H + + A K A int
Association of counterions can be symmetric or asymmetric. Reactions (1)–(4) are characterised by the following equilibrium constants:
K a 1 int = [ SOH ] a H [ S O H 2 + ] exp F ψ 0 R T
K a 2 int = [ SO ] a H [ SOH ] exp F ψ 0 R T
K C int = [ SO C + ] a H [ SOH ] a C exp F ψ 0 ψ β R T
K A int = [ SOH ] a H a A [ S O H 2 + A ] exp F ψ 0 ψ β R T
In the above equations, a j are the activities of the species j in the bulk solution ( j = H , C , A , protons and ions of the supporting electrolyte) in contact with the oxide surface, F the Faraday constant, R the universal gas constant and T the absolute temperature. ψ 0 and ψ β are the potentials at the metal oxide surface and β plane, respectively. The TLM can be seen as a series of electrical capacitors at constant capacitance. The first capacitor is defined by the metal oxide surface and the β plane, and it is characterised by the capacitance c 1 . The TLM assumes an additional potential drop (before the diffuse layer) [37] represented by a second capacitor with capacitance c 2 , defining the onset of the diffuse layer. The introduction of this second capacitor does not reflect the existence of another charged plane; as Bleasa and Kallay [37] clearly pointed out, the capacitance c 2 is simply introduced to improve the fit. For an exhaustive discussion of the model and the significance of the capacitors, the reader should refer to the original paper of Blesa and Kallay [37]. Briefly, the fundamental assumption for the second capacitance is that the solvated ions from the diffuse layer cannot approach the β plane given their large size caused by the solvation shell. Therefore, two defined and different capacitances (in the Stern layer) hold only if the associated ions (determining the distance of the β plane) are stripped by their solvation shell (Stern’s assumption for metal surfaces). Tejedor-Tejedor and Anderson [39], however, could not find proof for this desolvation effect in metal oxide systems. Furthermore, if counterions only approach the d plane but not β plane, then a potential drop between the β and d cannot occur.
The final capacitor is the diffuse layer capacitor, defined between the d plane and the distribution of charges in the plane of the bulk side and characterised by the capacitance c d . The latter is not constant and depends on the potential, ionic strength, temperature and permittivity; it can be derived by the Gouy–Chapman theory. Given the type of metal oxides involved and the experimental conditions adopted in the present work, the potential profile of the TLM can be simplified with no intermediate potential drop between the metal surface and d plane. This rationalises the TLM to a simpler original Stern model. Mathematically, this corresponds to assuming the capacitance c 2 . The expressions for the capacitances c 1 and c 2 are
ψ 0 ψ β = σ 0 c 1
ψ β ψ d = σ d c 2
where σ 0 and ψ 0 are the charge density and potential of the metal oxide surface, ψ β the potential at the β plane, σ d and ψ d the charge density and potential at the d plane. Given that c 2 , ψ β = ψ d . ψ d is commonly referred to as Stern potential.
The Gouy–Chapman theory of the diffuse part of the interfacial layer can be used to determine the Stern potential as
ψ d = 2 R T z F ln [ σ d 8 ϵ 0 ϵ r R T I 1 / 2 + σ d 2 8 ϵ 0 ϵ r R T I + 1 1 / 2 ]
where ϵ r is the relative permittivity of the solvent (in this case water), ϵ 0 is the permittivity of free space and I is the ionic strength of the solution in mol   m 3 . Substituting Equations (9) and (10) in Equation (11), the surface potential ψ 0 can be derived:
ψ 0 = σ 0 c 1 σ d c 2 + 2 R T z F ln [ σ d 8 ϵ 0 ϵ r R T I 1 / 2 + σ d 2 8 ϵ 0 ϵ r R T I + 1 1 / 2 ]

2.2. Simulation of Surface Charge Density, σ 0 (pH) and Surface Site Speciation

For the simulation exercise, reactions (1)–(4) can be rewritten as formation reactions of the surface complexes from the free sites, potential determining ions and counterions:
SO + H + SOH K 0
SO + 2 H + S O H 2 + K +
SO + C + SO C + K C
SO + 2 H + + A S O H 2 + A K A
where equilibrium constants are, respectively,
K 0 = 1 K a 2 int = [ SOH ] [ SO ] a H exp F ψ 0 R T
K + = 1 K a 1 int K a 2 int = [ SOH 2 + ] [ SO ] a H 2 exp 2 F ψ 0 R T
K C = K C int K a 2 int = [ SO C + ] [ SO ] a C exp F ψ β R T
K A = 1 K a 2 int K A int = [ SOH 2 + A ] [ SO ] a H 2 a A exp F 2 ψ 0 ψ β R T
The total surface site density is the sum of the concentrations of all the species present on the oxide surface, being
N S = [ SO ] + [ SOH ] + [ SOH 2 + ] + [ SO C + ] + [ SOH 2 + A ]
therefore dividing both numerator and denominator of the right-hand sides of Equations (17)–(20) by N S , the concentrations become the fractional surface coverage θ , which can then be expressed as
θ 0 θ = K 0 a H exp F ψ 0 R T = K 0 exp F ψ 0 R T 2.303 p H = K 0 f 0
θ + θ = K + a H 2 exp 2 F ψ 0 R T = K + f 0 2
θ C θ = K C a C exp F ψ β R T = K C a C exp F ψ 0 R T + F σ 0 R T C 1 = K C f C
θ A θ = K A a H 2 a A exp F 2 ψ 0 ψ β R T = K A a A exp F ψ 0 R T F σ 0 R T C 1 4.606 p H = K A f A
where Equations (24) and (25) also include Equation (9). With some simple algebra, one can demonstrate that
θ = 1 i θ i = 1 1 + i K i f i with i = 0 , + , C , A
Substituting Equation (26), the system of nonlinear Equations (22)–(25) can be generalised as
θ i = K i f i 1 + i K i f i with i = 0 , + , C , A
representing a Langmuir-like form of the individual ion adsorption isotherms. The Coulombic definition of the surface charge density σ 0 can be easily deduced as the sum of all the charges present on the surface of the metal oxide, thus
σ 0 = F [ SOH 2 + ] + [ SOH 2 + A ] [ SO ] [ SO C + ] = N S F θ + + θ A θ θ C
Substituting Equations (27) and (26) in Equation (28), the following expression for the surface charge density can be derived:
σ 0 = N S F K + f + + K A f A K C f C 1 1 + i K i f i
Solving numerically the nonlinear Equation (29), the charge density of the metal oxide surface can be simulated for each value of pH, and consequently the fractional coverages of the different surface complexes can be derived as a function of the pH too.

2.3. Simulation of Electrokinetic Potential, ζ (pH)

The potential in the diffuse layer as a function of the distance from the d plane (exponential decay of ψ ( x ) with x = x d , see Figure 1), can be derived as a solution of the Poisson–Boltzmann equation within the domain of the Debye–Hückel approximation ( ψ ( 0 ) assumed to be small relative to k B T ) [37].
ψ ( x ) = 2 R T F ln 1 + g d exp ( ˇ x ) 1 g d exp ( ˇ x )
where g d is a function of the Stern potential ψ d (pH):
g d = exp ( F ψ d / 2 R T ) 1 exp ( F ψ d / 2 R T ) + 1
and κ , dependent on the ionic strength and temperature only, is the Debye–Hückel length or reciprocal of the double layer thickness, i.e., the distance from the surface at which the electrical potential drops to roughly 1/3 the value at the surface and beyond which the charges are electrically screened:
κ = 2 F 2 I ϵ r ϵ 0 R T 1 2
The simulated values of ψ d (pH) from the previous section can therefore be fed into Equation (31) and ψ ( x ) profiles over a given pH range at a given distance x simulated too. The profile that best fits the experimental values of ζ is then chosen as ζ -potential profile. For low values of surface potentials and low concentrations of electrolytes in the bulk phase, the identity ζ ψ d has been commonly accepted in the literature.

3. Results

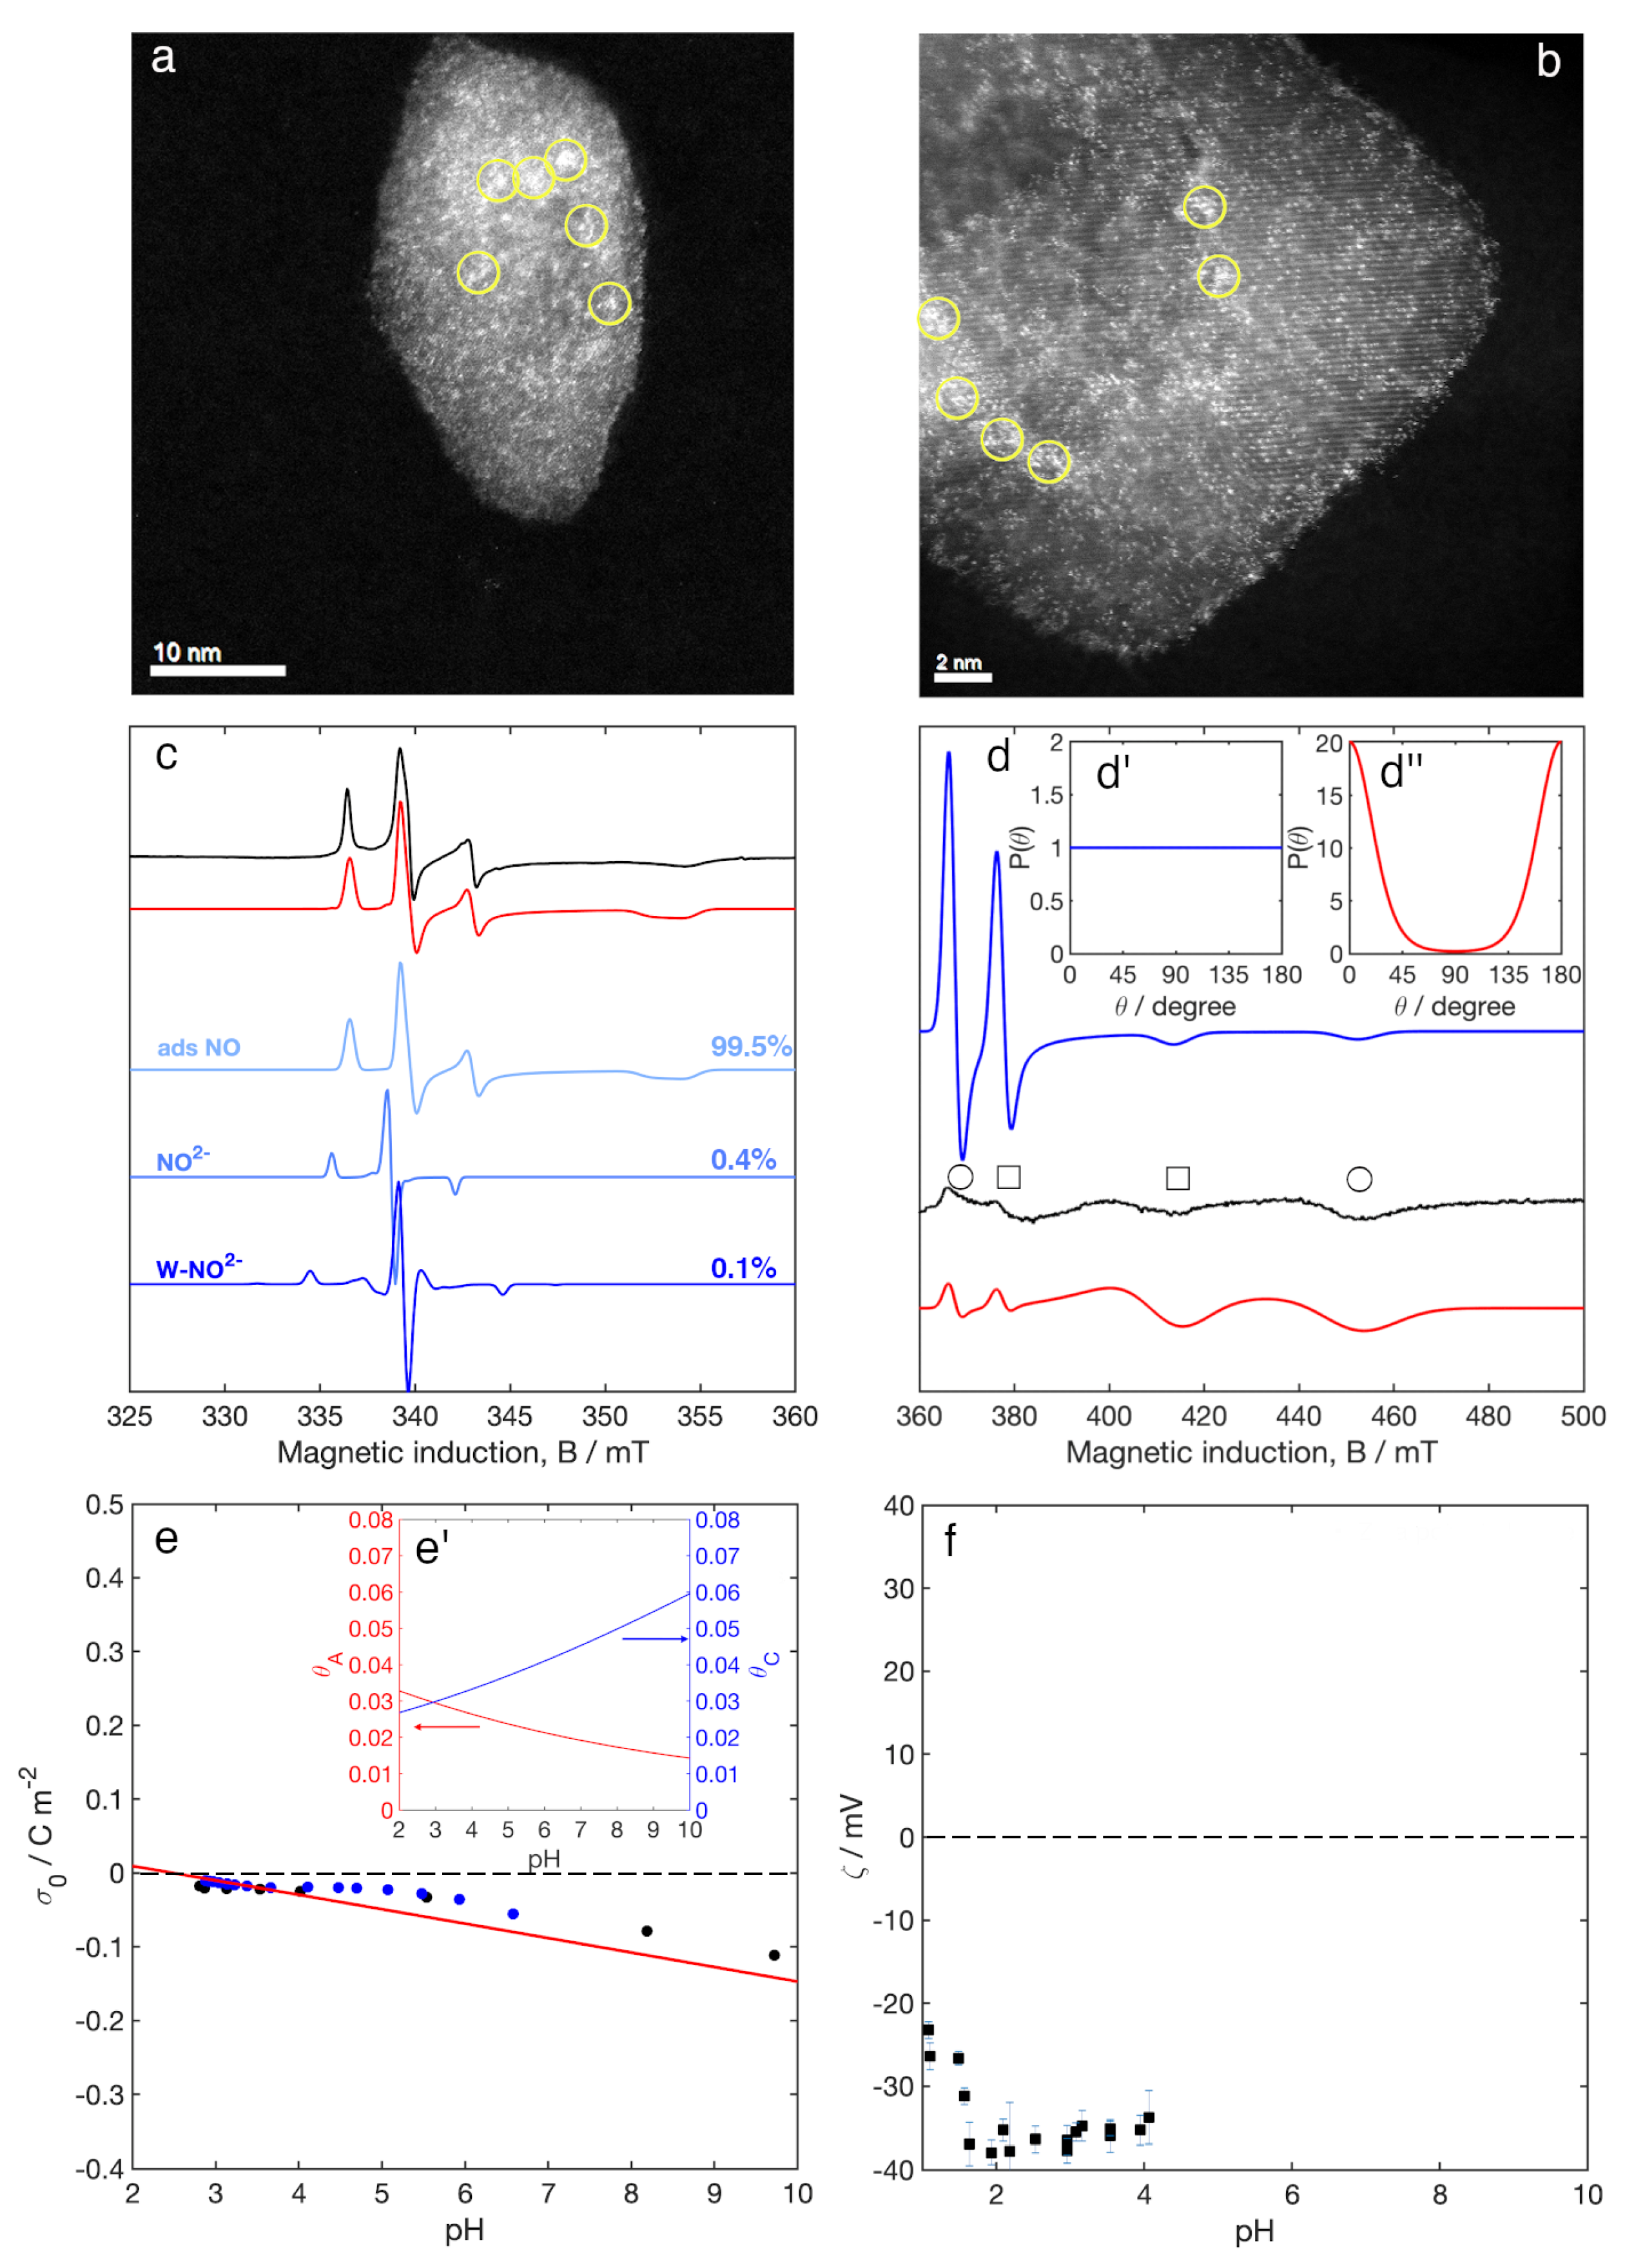
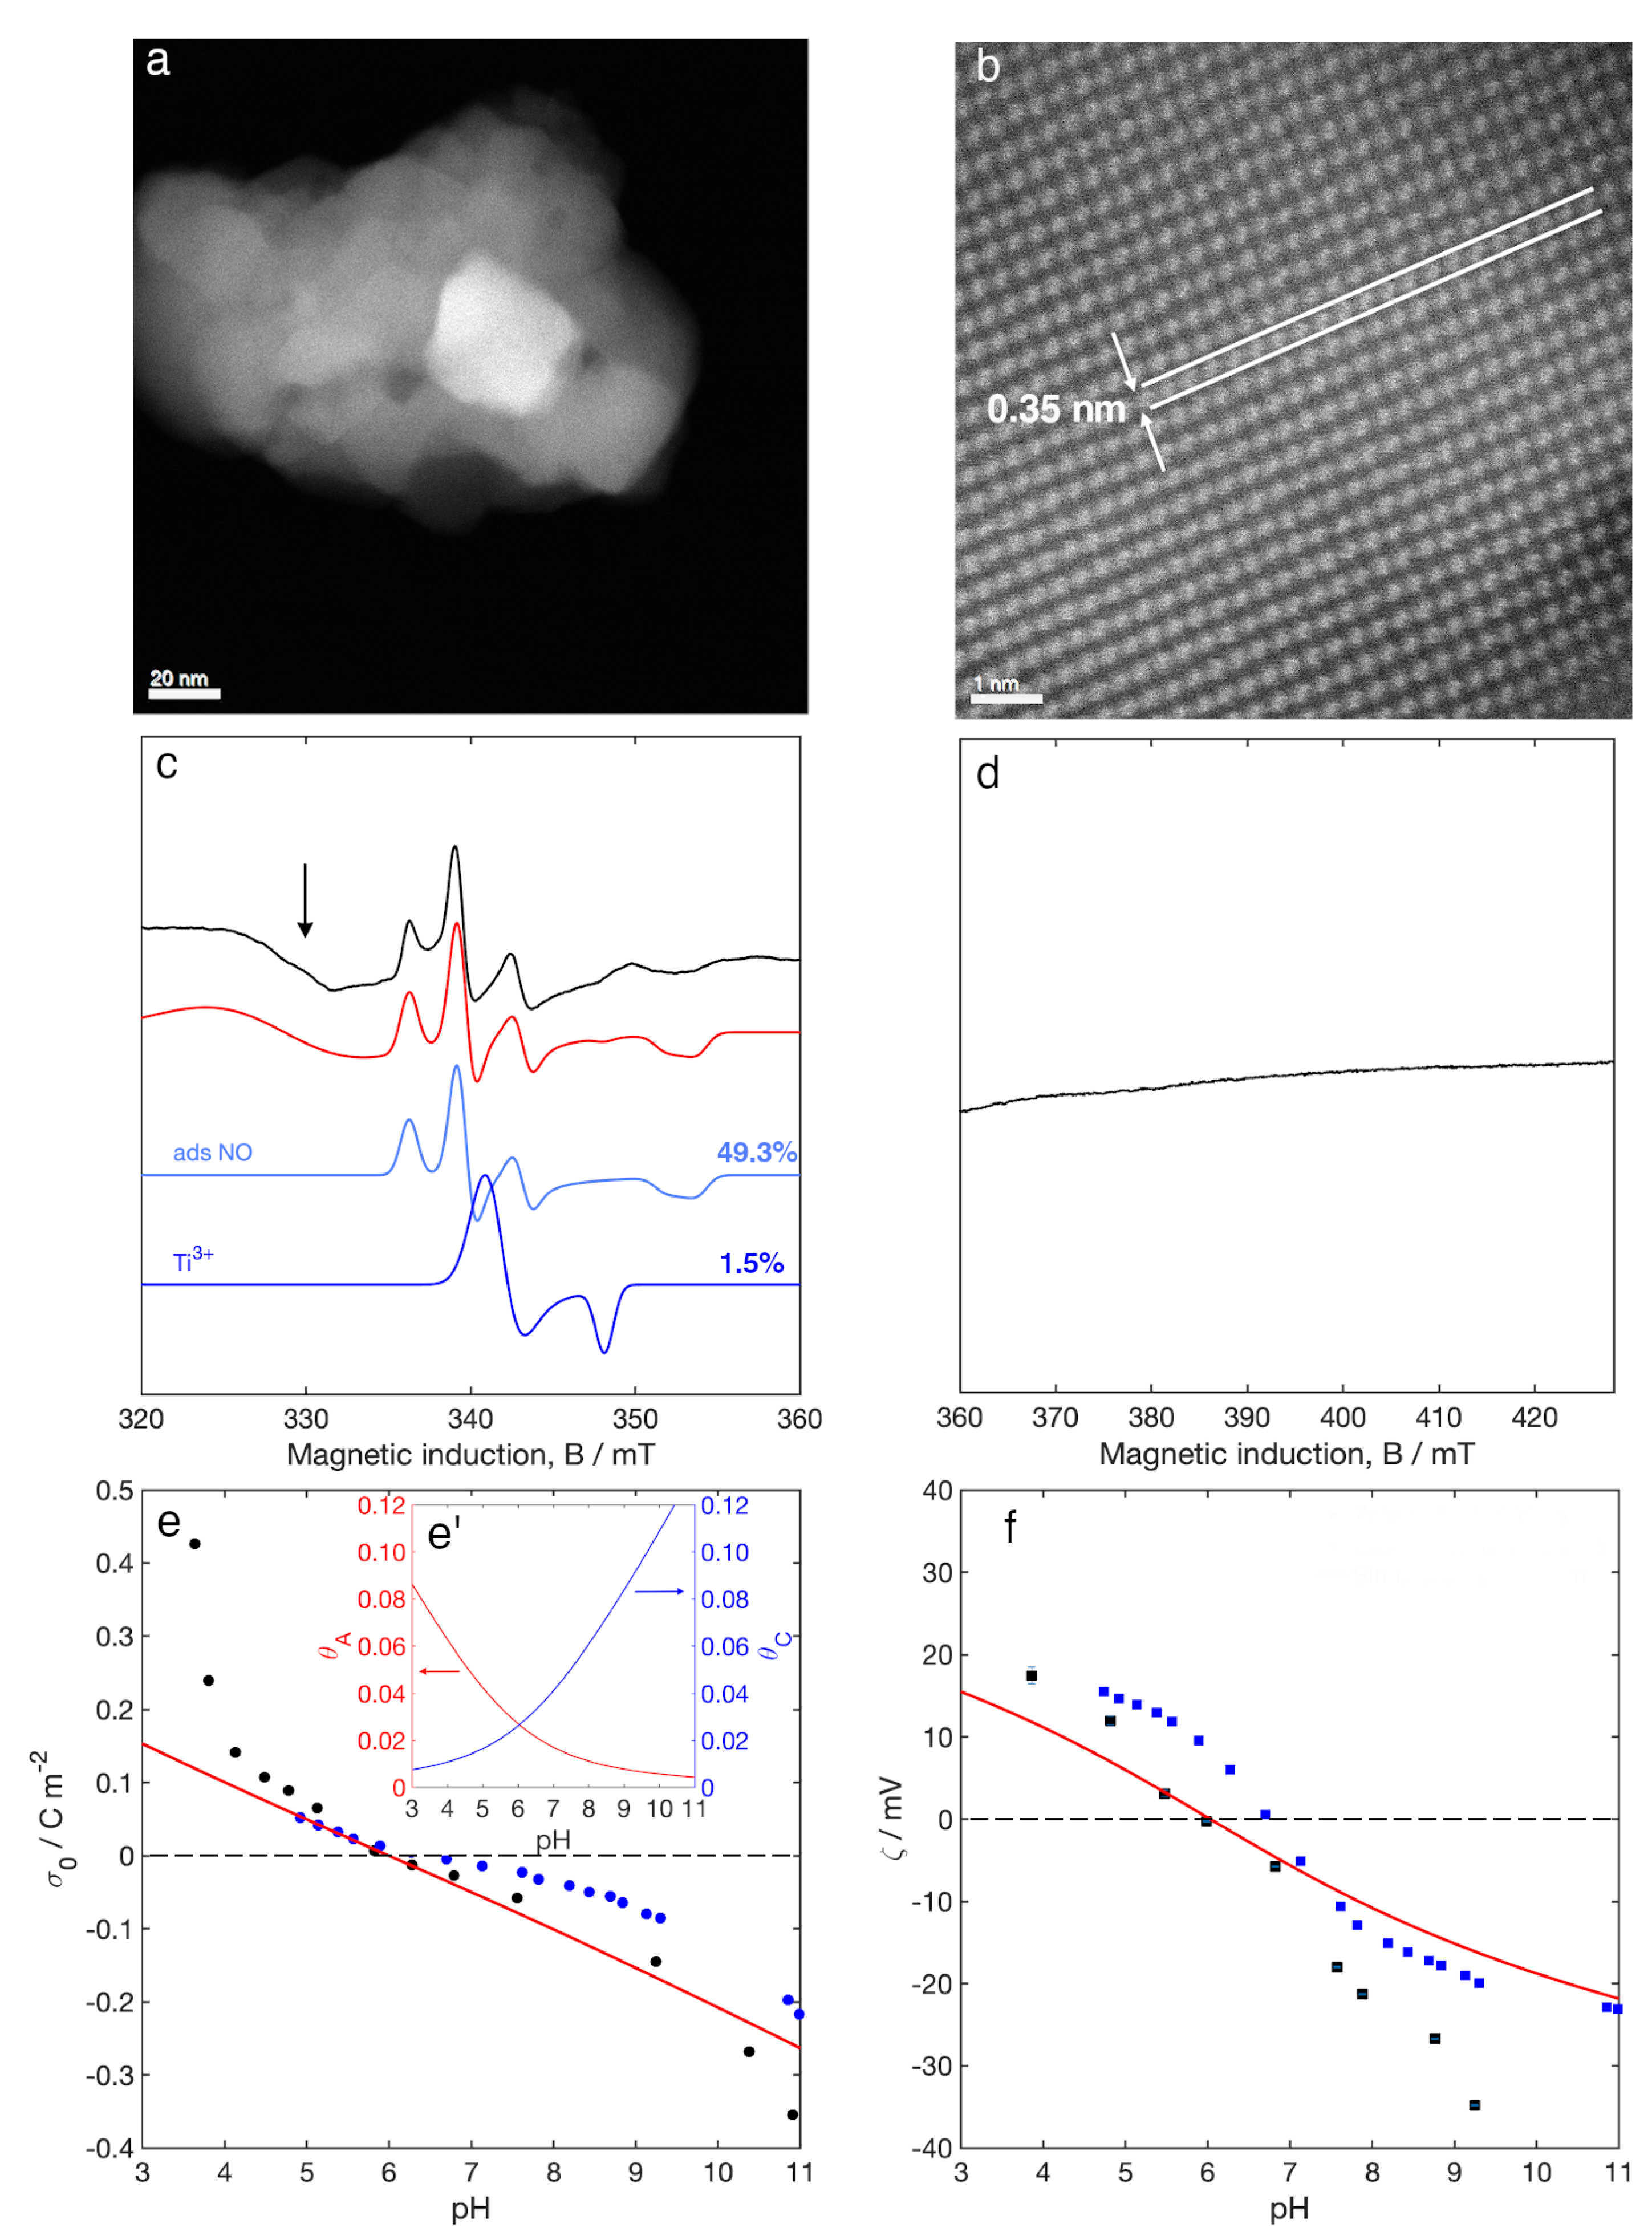
3.1. Aberration Corrected Scanning Transmission Electron Microscopy (STEM)

Representative high-angle annular dark-field (HAADF) scanning transmission electron microscope (STEM) images of a Ti 0.909 W 0.091 O 2 N x sample are shown in Figure 2a,b, in which the W component is readily visible via the mass contrast afforded by this technique. W has a tendency to incorporate substitutionally into the Ti cation sub-lattice sites, in good agreement with neutron diffraction results published elsewhere [31]. At this high concentration however, W also forms discrete clusters on the surface of the nanoparticles (extended bright areas circled in Figure 2a,b), corroborating results from XPS spectroscopy reported in one of our previous papers [31]. Our previous work showed that these clusters are not crystalline WO 3 , as anatase T i O 2 was the only crystalline phase detectable by neutron diffraction and no crystalline WO 3 phases were present [31]. Representative low and high magnification HAADF-STEM images of the undoped T i O 2 sample used as a reference throughout this work are shown in Figure 3a,b. Figure 3b is typical of the anatase polymorph of T i O 2 viewed along the [111] projection in which a set of (10-1) planes with d-spacing 0.35   n m is indicated.

3.2. Electron Paramagnetic Resonance (EPR) Spectroscopy

X band (i.e., ~ 9.5   G Hz ) continuous wave (CW) EPR spectra of Ti 0.909 W 0.091 O 2 N x in the absence of band gap excitation around the free spin region (Figure 2c) is dictated by an adsorbed N O molecule [30,31,41,42], exhibiting the spectrum of an 11 electrons π radical in the adsorbed form characterised by an anisotropic g tensor with principal values g 1 = 2.001 , g 2 = 1.998 , g 3 = 1.921 and a A tensor with principal values equal to | A 1 14 N | < 2.8   MHz , | A 2 N 14 | = 89.7   M Hz , | A 3 N 14 | = 26.9   M Hz . The EPR profile is present after the samples were evacuated for at least 12 h at 393 K and under dynamic vacuum, ~ 10 4 bar, signifying that this N O is not adsorbed on the exposed surface of the sample, rather encapsulated in bulk and sub-surface microvoids (or closed pores) generated during the synthetic process, as proved by previous studies on similar systems [42]. This species is due to calcination of the material in air in the presence of nitrogen. The photocatalyst powder needs to be milled at high rpm, in vacuum, for several hours in order to remove this signal [43]. The EPR spectrum is also indicative of an interstitial N chemically bound to a lattice O ion forming a N i O . group (an intraband gap N O 2 state) with spin density (and therefore the magnetic g and A tensors) differently polarised depending on whether the N i O . is adjacent to a substitutional W 6 + or not [30,31]. The g and A values for these two species are g 1 = 2.005 , g 2 = 2.004 , g 3 = 2.003 , | A 1 N 14 | = 6.5   M Hz , | A 2 N 14 | = 15.7   M Hz , | A 3 N 14 | = 89.7   M Hz ; and g 1 = 2.001 , g 2 = 2.000 , g 3 = 1.999 , | A 1 N 14 | = 42.0   M Hz , | A 2 N 14 | = 22.4   M Hz , | A 3 N 14 | = 140.1   M Hz , | A 1 W 183 | = 44.8   M Hz , | A 2 W 183 | < 2.8   M Hz , | A 3 W 183 | = 154.1   M Hz , respectively. In the absence of band gap excitation (presented in Figure 2c) the signal of N i O . is almost negligible ( 0.40 % and < 0.10 %, respectively), and significant spectral contributions are observed only under or post irradiation [30,31]. Given that the doped nanoparticles (which are sensitive to visible light as well as UV) were not left in complete darkness before recording the EPR spectra but had been exposed to ambient light, it is reasonable to assume that a small amount of these paramagnetic species were formed although the particles were not directly photosensitised. For a full description of this species, their photochemistry, and the physical-chemical significance of their spin Hamiltonian parameters (reported in Table 1), the reader should refer to our previous works [30,31].
At higher magnetic fields (Figure 2d), the EPR spectra revealed the presence of two paramagnetic species exhibiting anisotropic g tensors with axial symmetry. The first one is characterised by g = 1.85 and g = 1.50 and can be associated with coordinatively unsaturated W 5 + species in WxOy clusters strongly anchored to the surface of the host crystal [44,45,46]. The second one is characterised by g = 1.80 and g = 1.64 and corresponds to W 5 + in tungsten bronze-like superstructures, weakly bound to the surface of the host crystal [44,45,46]. This is in line with the presence of surface clusters identified by our HAADF aberration corrected-STEM (Figure 2a,b) as well as our X-ray Photoelectron Spectroscopy investigation that we presented elsewhere [31]. The low principal values of these two tensors are due to the d1 nature of the W 5 + ion in combination with the large spin–orbit coupling associated with W 5 + (i.e., 2700 cm−1) [47]. In Figure 2d, the experimental EPR spectrum is presented with two distinct simulations. The first one considers the orientational distribution of the paramagnetic centres (i.e., W 5 + ions) in the sample to be isotropic, i.e., all orientations occur with the same probability (inset Figure 2d’ and blue trace simulation), which corresponds to an ordinary powder spectrum. The second one refers to a non-isotropic orientational distribution of the paramagnetic centres in the sample (inset Figure 2d” and red trace simulation) that was computed according to the function
P ( θ ) = exp ( U ( θ ) )
where U ( θ ) is a second-order Legendre polynomial in cos θ weighted over an “ordering potential”, λ .
U ( θ ) = λ ( 3 cos 2 θ 1 ) 2
θ is the angle between the molecular z axis and the static magnetic field.
The experimental spectrum was best simulated and fitted to a non-isotropic orientational distribution of the W 5 + ions corresponding to a value of λ qual to 3. The spin Hamiltonian parameters of the paramagnetic W5+ species can be also found in Table 2. As expected, there is no signal in this portion of the magnetic field in the case of undoped T i O 2 , due to the absence of W doping (Figure 3d). Nevertheless, around the free spin region (Figure 3c), undoped T i O 2 exhibited an EPR signal comprising at least three different species. The first one, and with the highest spectral contribution is the same adsorbed N O molecule as described above. Although there is no N doping in this sample, it is not uncommon to find such signal in commercially available undoped T i O 2 . The inclusion of NO in the material pores mostly arises from the calcination in air conducted in large rotary kilns on T i O 2 production plants. The spectrum is also likely to contain minor contributions from T i 3 + ( g = 1.988 , g = 1.950 , Table 2) which is often found in T i O 2 due to the trapping of majority carriers (i.e., electrons) without necessarily the presence of trapped holes, unless under UV irradiation (the introduction of a minor contribution of this signal improves the fitting of the simulation). Finally, an unambiguous assignment to the broad resonance around g 2.05 (indicated by the arrow in Figure 3c) is challenging. Part of this signal could be due to Fe(III) impurities [48] (very common in commercially available anatase T i O 2 samples, especially if produced via the sulphate process). In addition, the signal could also comprise a contribution from the g of a lattice O with significant levels of cationic impurities, causing an increase in the splitting of the π orbitals of the O radical, which increase the g values compared to the cases of O radical in anatase ( g = 2.026 ) or O radical in rutile (multiple g with the largest values at 2.043) [49,50,51,52]. In the simulation, the broad resonance at g 2.05 was reproduced by means of an effective g value and big enough g strain to account for the signal and the large baseline observed in the experimental spectrum.

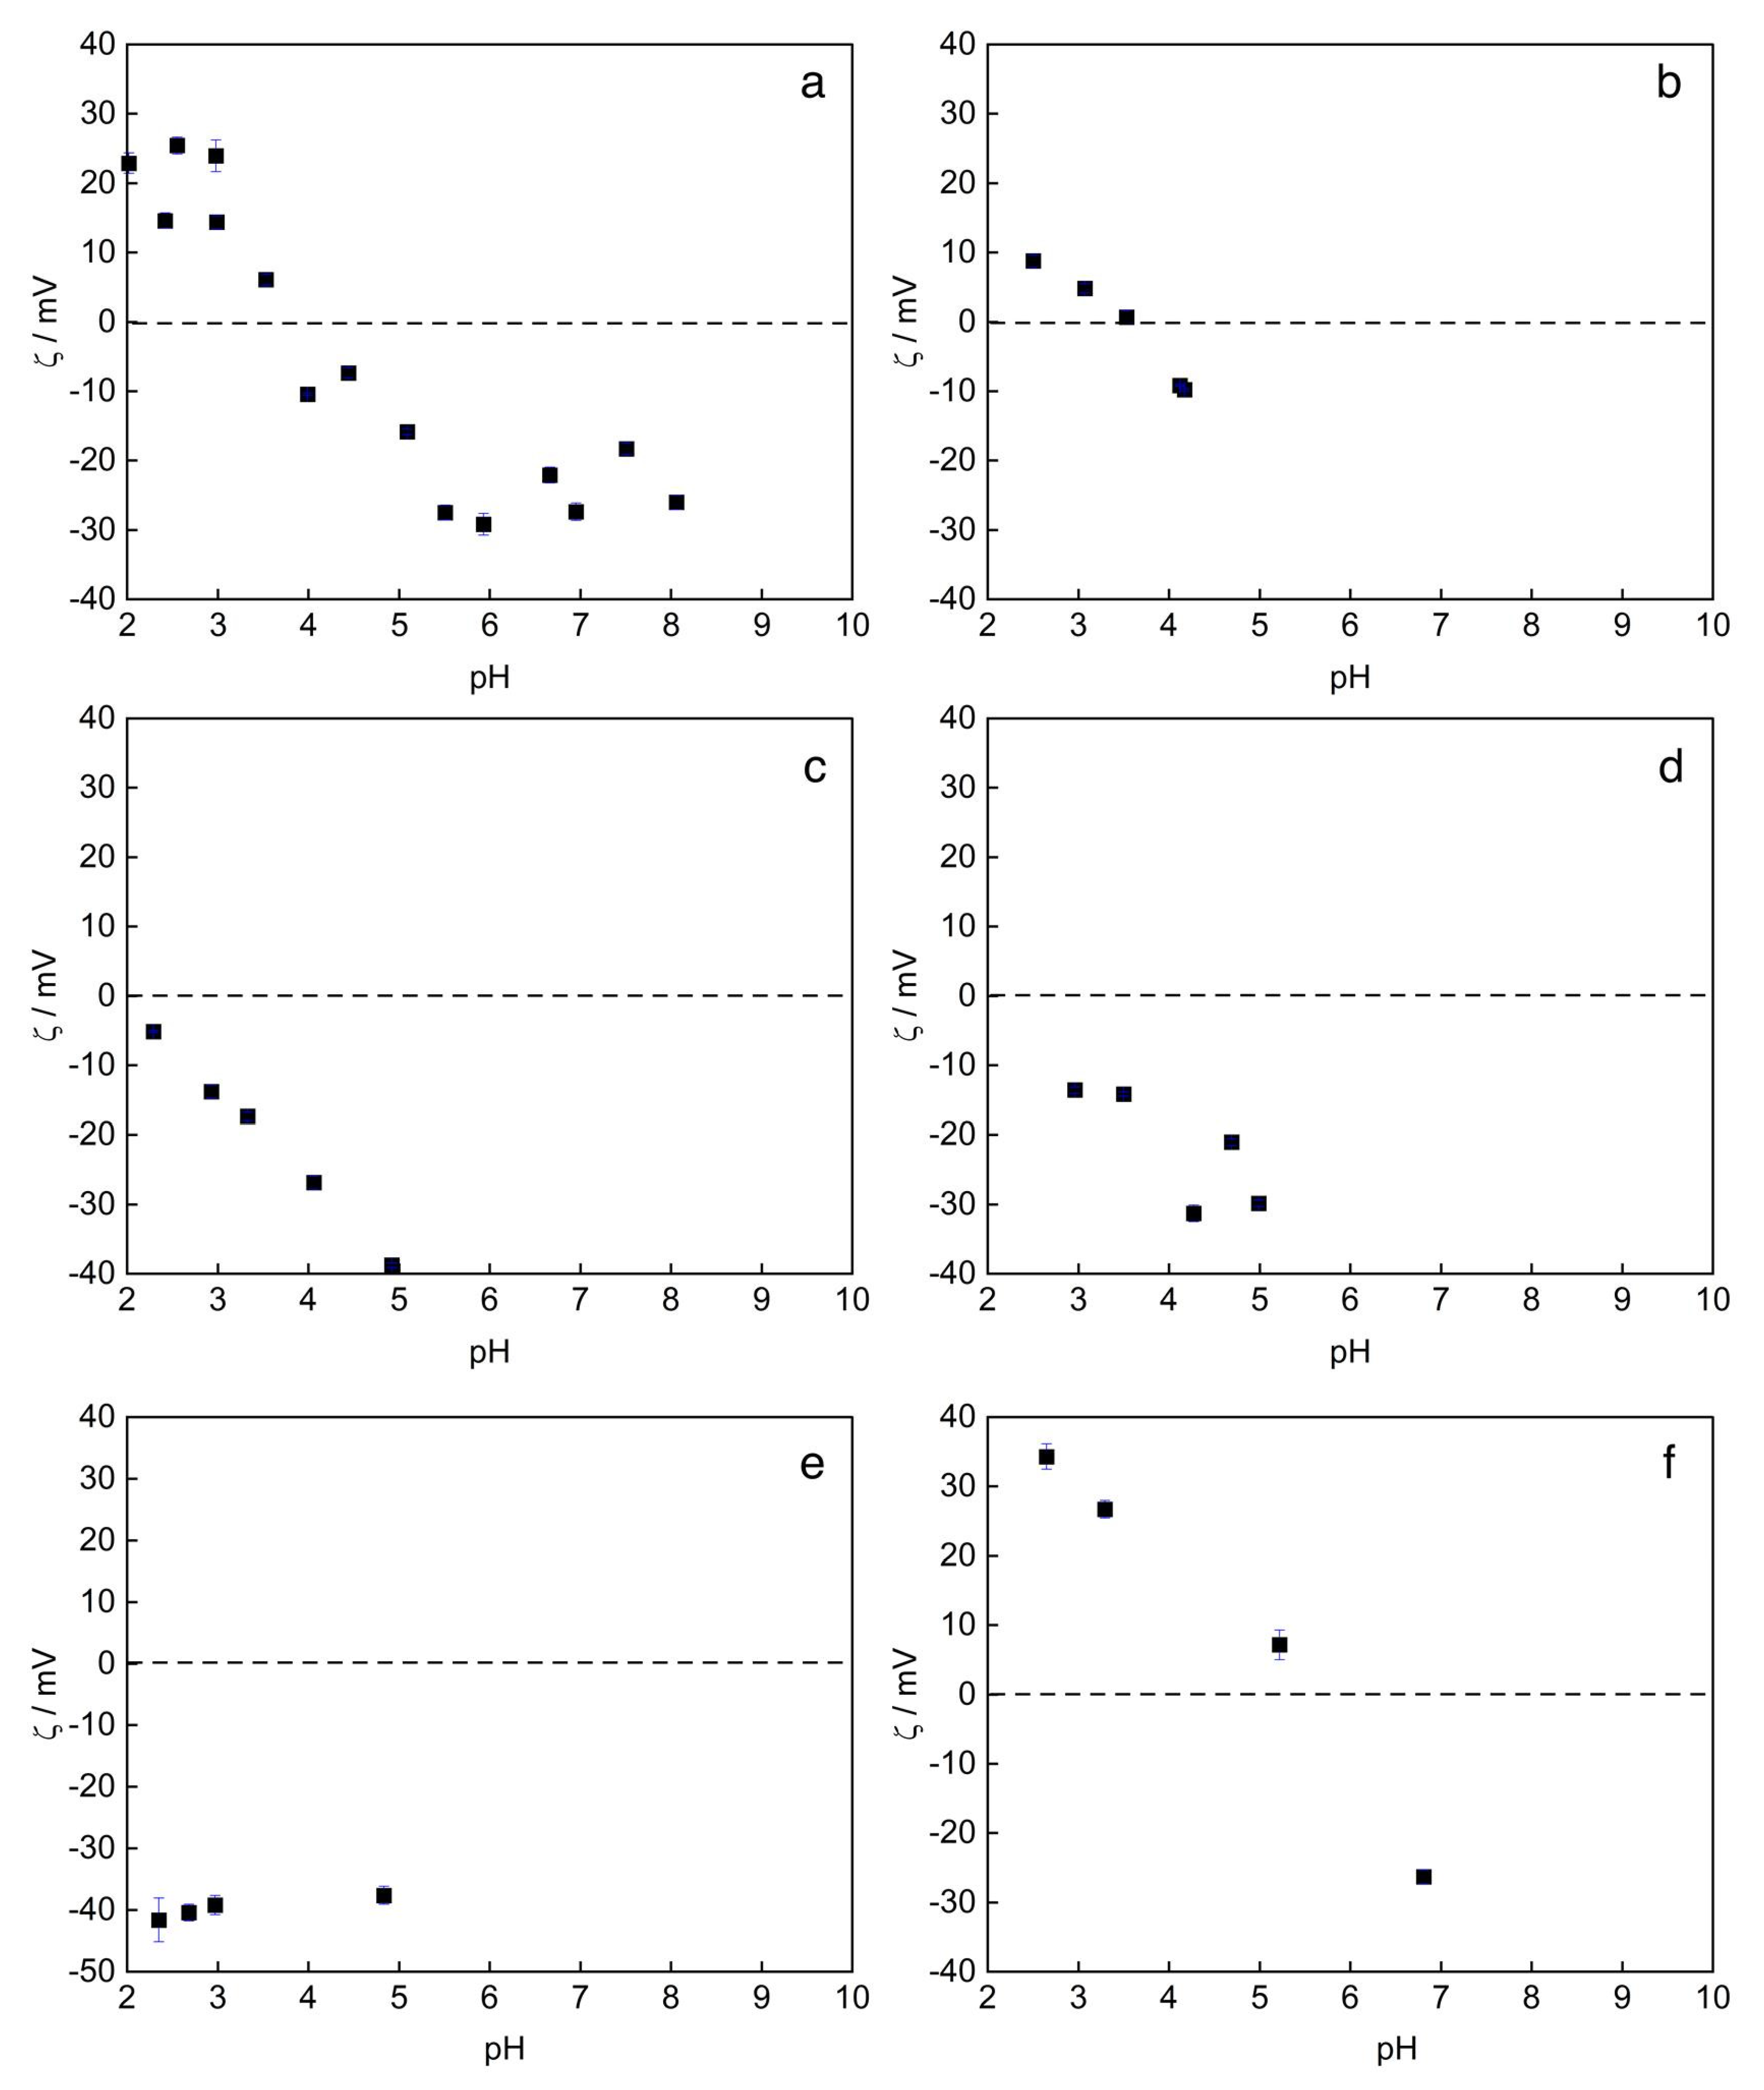
3.3. Surface Charge Density and Electrokinetic Parameters

The surface charge density profiles ( σ 0 vs. pH) for Ti 0.909 W 0.091 O 2 N x and undoped anatase T i O 2 (reference) measured at constant ionic strength I = 10 2   mol   L 1 using N A N O 3 as a supporting electrolyte are reported in Figure 2e and Figure 3e, respectively. The mass titration profiles (used to derive σ 0 ) are reported in Figures S1 and S2. In the course of a mass titration, the pH of the metal oxide dispersion changes gradually, approaching the constant value of pH in relation to which the absolute value of the slope of the pH ( γ ) function decreases until reaching zero, indicating that the absolute value of the surface charge density approaches zero. According to Equation (35), when a constant value of pH in mass titration of pure metal oxide ( u = 0 ) is achieved, the surface charge density σ 0 is equal to zero and pH is therefore a relatively accurate estimation of the pH of zero charge, pH p z c (also known as point of zero charge), i.e., the pH at which σ 0 = 0 . In the case u 0 , u must be determined experimentally so that σ 0 can be corrected. In the case of undoped T i O 2 , an electrolyte titration was also conducted. The small discrepancy between the P H p z c s obtained via mass titration vs. electrolyte titration is most likely due to the insufficient mass content of titania in the electrolyte titration experiment. It is believed that at higher mass concentrations this discrepancy might disappear, although it is hard to prove experimentally because the dispersion is too dense at high mass concentrations for carrying out an electrolyte titration. The values of σ 0 ( pH ) were calculated from the values of pH using the formalism proposed by Preočanin and Kallay [53]:
σ 0 = F u S F S γ c y ( 10 p H γ 10 p H i n 10 p H γ p K W + 10 p H i n p K W )
where γ is the mass concentration of the metal oxide of the specific surface area s. y denotes the activity coefficient of H + and O H ions in the bulk of the solution given by the extended Debye–Hückel equation and c is the standard value of concentration ( c = 1 mol dm−3). u is the degree of acid or base contamination and may be obtained from the potentiometric acid–base titration of the concentrated dispersion [54]. Simulation according to the approach described in Section 2 of the surface charge density profile obtained experimentally is also provided. Within the pH range examined σ 0 for Ti 0.909 W 0.091 O 2 N x colloidal nanoparticles remain negative and approaches zero around pH = 2.5. The positive branch of the σ 0 ( pH ) curve (i.e., at pH 2 ) was not possible to determine experimentally at I = 10 2   mol   L 1 because it would intrinsically imply ionic strength 10 2   mol   L 1 . Simulation of the experimental data allowed for an evaluation of the p K a s for reactions (1)–(4) and capacitance c 1 (capacitance of the inner Helmholtz layer). The best fitted parameters are reported in Table 3. To evaluate the extent to which W and N as dopants modify the chemical nature of the T i O 2 nanoparticle surface, the same experimental approach and analysis was conducted on undoped anatase T i O 2 . Figure 3e shows the experimental surface charge density obtained using the mass titration method as well as the electrolyte titration method. σ 0 was found to approach 0 at pH = 6 when using the mass titration and slightly above 6 when using the electrolyte titration. The simulated profile of σ 0 vs. pH is also proposed, from which the values of the p K a s for reactions (1)–(4) and capacitance c 1 were evaluated. It is important to highlight that, in order to apply Equation (35) to the potentiometric mass titrations, the value of the the degree of contamination u must be known. The degree of contamination for the undoped anatase T i O 2 used in this work was measured using the procedure proposed by Žalac and Kallay [54] (Figure S3). In the case of Ti 0.909 W 0.091 O 2 N x we applied Equation (35) considering u = 0 , signifying that the acid-base contaminations of the anatase T i O 2 surface are considered to be the W and N dopants, which therefore cause the shifting of the pH at which σ 0 = 0 when compared to undoped anatase T i O 2 .
The electrokinetic potential, ζ , for Ti 0.909 W 0.091 O 2 N x and T i O 2 is reported in Figure 2f and Figure 3f, respectively. The pH at which ζ = 0 , or isoelectric point pH i e p , is not achievable within a pH range which allows to have ionic strength I = 10 2   mol   L 1 (i.e., 2 < pH < 12 ), and it appears to be located at a pH significantly lower than 2. For the case of undoped anatase T i O 2 , laser doppler micro-electrophoretic experiments as well as simulations are pointing to a pH i e p = 6 . A discrepancy is appreciable between the laser doppler micro-electrophoretic experiment and the acoustic one, with the latter indicating a p H i e p = 6.8 . The electrokinetic potential was also measured for a series of other W- and N-doped T i O 2 samples containing different amount of W. In addition, two other samples, one exclusively N-doped, the other one exclusively W doped ( 10 at . % ), were also measured. Results are presented in Figure 4. As evident from Figure 4a–d, the pH i e p of the codoped samples approaches the value of undoped T i O 2 as the amount of W loading is reduced. In addition, the analysis of the monodoped materials revealed that whilst ζ and pH i e p for Ti 0.909 W 0.091 O 2 N x are comparable to Ti 0.909 W 0.091 O 2 N x , there is essentially no significant variation of ζ and pH i e p in the solely N doped sample when compared to undoped T i O 2 .

4. Discussion

4.1. Nature of the Surface W Species

HAADF aberration-corrected STEM images of Ti 0.909 W 0.091 O 2 N x (and our previous neutron diffraction/XPS work [31]) have confirmed the presence of W enriched non-crystalline clusters on the surface of anatase Ti 0.909 W 0.091 O 2 N x nanoparticles beside a significant level of W and N inclusion in the nanoparticles crystal lattice. Charge compensation of the extra positive charges brought by W 6 + when substituting for Ti 4 + in the Ti 4 + crystal lattice can occur via an increase of Ti 4 + vacancies as well as an excess of electrons [32,55]. The latter induces a noticeable increase in the donor density of the materials [32], making Ti 0.909 W 0.091 O 2 N x even more n-type than undoped T i O 2 . EPR then revealed that the non-crystalline W clusters on the surface of the nanoparticles are WxOy clusters and domains of W bronze-like superstructure. This was afforded via the detection of reduced W 5 + species (most likely due to majority carriers trapping) in two distinct oxygen-coordinating environments, which highlights the unique ability of EPR in ascertaining the chemical nature of discrete motifs and supramolecular arrangements in the solid state, where other techniques (i.e., x-ray/neutron diffraction) would fail. In addition, a careful simulation of the intensities of the EPR resonances associated with these reduced W 5 + species revealed that within the WxOy clusters and W bronzes-like superstructure, although not crystalline, a local order does exists, requiring the use of a suitable ordering potential λ (Equation (34)) for a correct simulation. According to the formalism adopted (Equations (33) and (34)), allowed values for λ are 10 λ + 10 . When λ is negative, the orientational distribution function P ( θ ) is maximum at θ = 90 , indicating a preferential orientation of the molecular z axis perpendicular to the externally applied magnetic field (i.e., preferential alignment in the molecular xy plane); when λ is positive, the orientational distribution function P ( θ ) is maximum at θ = 0 and 180 , indicating a preferential orientation of the molecular z axis along the externally applied magnetic field. As the g tensor frame in our simulation was taken collinear to the molecular frame of reference, this value of λ implies that the g tensors of the electron spins show a preferential orientation with their z axis along the external magnetic field. This is evident in the red simulation which shows a greater relative contribution of the parallel components of g with respect to the perpendicular ones when compared to the powder simulation in blue where all orientations occur with the same probability. Furthermore, as the orientational distribution becomes sharper as the magnitude of λ increases, a value of 3 on a scale out of 10, represents a relatively significant orientational bias for the non-crystalline clusters in the limits of a powder sample approximation (i.e., where the orientational dependence is not resolved). There might be different reasons for this preferential orientational distribution, including a preferential growth of these clusters during nanoparticles synthesis. Another interesting features of these non-crystalline surface W clusters is that, despite the significant level of N doping in the sample, no sign of superhyperfine interaction between the unpaired electron in W 5 + and the 14N nuclei was detected. A potential explanation for this is that there is no N incorporated in these WxOy clusters and W bronzes-like superstructures, and all the N remains inside the crystalline anatase Ti 0.909 W 0.091 O 2 N x phase. In fact, no hyperfine interaction to the only magnetic isotope of W, i.e., 183W was detected in these clusters either, although this is most likely due to its low natural abundance in conjunction with the very low EPR signal intensity. On the contrary, the paramagnetic N i O . species arising from N doping in the anatase Ti 0.909 W 0.091 O 2 N x phase, did indeed show superhyperfine coupling to the 183W nucleous (W- N O 2 in Figure 2c), owing to the much greater EPR signal intensity and the vicinity of substitutional W. In the Ti 0.909 W 0.091 O 2 N x phase, EPR failed to detect any substitutional W 5 + . To the best of our knowledge, substitutional W 5 + [56] has never been observed in anatase nanoparticles. On the contrary, substitutional W 5 + has been detected in rutile or mixed anatase-rutile nanoparticles [56], signifying that the presence of rutile phases might be necessary to generate a stable form of reduced W 5 + substituting for T i 4 + . The presence of reduced paramagnetic species induced by charge compensation following W doping can therefore be exploited by EPR as a valuable “probe” to ascertain details about surface species/clusters/phase-modifying domains contributing to dictate the surface chemistry of doped T i O 2 nanoparticles.

4.2. Dopant-Induced Surface Acidity

On the basis of the extensive degree of W-containing, surface covering clusters and the high level of substitutional W doping (both bulk and surface), and considering the much harder character of W 6 + when compared to Ti 4 + ( W 6 + has almost identical ionic radius as Ti 4 + , i.e., 74 p m vs. 74.5   p m , respectively, but much greater Pauli electronegativity, i.e., 2.36 compared to 1.54), one would infer that hydrated Ti 0.909 W 0.091 O 2 N x surfaces would exhibit a much more acidic character than undoped T i O 2 . As is evident from the surface charge density profiles and the p K a s values extracted from simulations, the effect of the doping is indeed to shift the protonation/deprotonation equilibria of the surface S O H of Ti 0.909 W 0.091 O 2 N x towards much lower pH when compared to undoped T i O 2 . It also corroborates an early measurement of increased acidity of W O x - T i O 2 surfaces by Li et al. [57]. In the case of undoped T i O 2 , simulations of the σ 0 ( pH ) trends, returned (within experimental and calculation errors) the same values of the acidity constants p K a 1 i n T and p K a 2 i n T of surface sites (Table 3) proposed by Piasecki et al. [38] (despite using NaCl rather than N A N O 3 as in the present work). The formation and dissociation constants of the surface site complexes with cations and anions p K C i n T and p K A i n T also match very well what was previously proposed [38]. The formation reaction for S O C + has been already provided by Equation (15) with equilibrium constant defined according to Equation (19). The formation reaction for S O H 2 + A can be seen as Equation (1) minus Equation (4), which implies an equilibrium constant equal to
K A = K a 1 i n t K A i n t
Equation (36) returns a value for K A = 2.24 × 10 2 = K C , i.e., a symmetric association of counterions condition is proven. The symmetric association condition imposes that the value of pH p z c corresponds to the state in which all electrical properties disappear, i.e., a true electroneutrality point: σ 0 = σ s = 0 and ψ 0 = ψ d = ζ = 0 , so that pH = pH p z c = pH i e p = pH p z p = pH e l n , where p H i e p is the iso-electric point, i.e., the pH at which ζ = 0 , pH p z p the pH of zero (surface) potential and pH e l n the pH of electroneutrality. This is corroborated by the ζ ( pH ) trend (experimental laser Doppler micro-electrophoresis and simulation) reported in Figure 3f, showing a pH i e p = 6 . We believe that the overestimation observed when using the acoustic method is due to the accuracy of the method, given that a value of 6.8 is significantly higher than what is normally reported in the literature for water suspensions of undoped T i O 2 in the presence of indifferent electrolyte only (as in this case). The situation for the Ti 0.909 W 0.091 O 2 N x colloidal nanoparticles is however quite different. Suspensions of these in I = 10 2   mol   L 1 aqueous solutions with N A N O 3 as a supporting electrolyte revealed that pH p z c ≠ pH i e p , as evident from the comparison between Figure 2e,f. While the pH p z c can still be obtained by the mass titration method also in the case of asymmetrical association of counterions [53], it is now expected to be shifted from the pH of electroneutrality pH e l n . By applying the same rationale as for undoped T i O 2 to Ti 0.909 W 0.091 O 2 N x , the formation constants for the surface site complexes with the counterions are now K C = 3.16 × 10 2 and K A = 3.16 × 10 4 , which would indicate a significant preferential association of anions, i.e., N O 3 , over cations, i.e., N A + . In this condition, the expectation is that pH p z c is shifted from the pH e l n to a higher pH value, pH p z c > pH e l n , while the pH i e p is shifted to a lower pH value with respect to pH e l n , pH i e p < pH e l n (the point of zero potential pH p z p remains close to pH e l n ). This is in agreement with the experimental ζ ( pH ) indicating a pH i e p < 1. Furthermore, ζ ( pH ) trend and pH i e p < 1 are corroborated by what reported for W O 3 [58,59].

4.3. Single Contributions of W and N Dopants on Surface Acidity

EPR, microscopy and surface charge/electrokinetic results demonstrate that a W loading of ~ 10 at . % in T i O 2 generates nanoparticles with surface chemistry more similar to that of W O 3 than that of T i O 2 , although maintaining the anatase crystal lattice typical of T i O 2 . In this regards, EPR and microscopy shed light on the chemical and crystallographic nature of the surface, including the W clusters coverage, which is a fundamental starting point to understand the TLM properties and the electrophoretic behaviour observed once the particles are in contact with an aqueous electrolyte solution. As the W content was reduced, we observed a gradual increase of the pH i e p towards that of undoped T i O 2 , as evident from the ζ ( pH ) curves in Figure 4a–d. Investigation of monodoped nanoparticles further confirmed the influence of W and N on the surface chemistry. In the case of solely W doping with ~ 10.0   at . % W doping, we obtained similar W 5 + EPR spectra (not shown here) and comparable ζ ( pH ) behaviour (Figure 4e) to that of Ti 0.909 W 0.091 O 2 N x . In the case of solely N doping (Figure 4f), the ζ ( pH ) profile was found almost identical as the one of undoped T i O 2 . It therefore appears that the shift of the pH i e p is attributable to W doping only. On one hand, this is perfectly in line with what is discussed above related to the acidity of hydrated surface tungsten species. On the other hand, these results help to understand the role of interstitial N doping as a contributor to the overall surface chemistry observed. Xu et al. [9] reported a ζ ( pH ) profile that was unchanged with respect to undoped T i O 2 ; exactly as we are reporting here. In Xu et al. [9] and in the present work, N was introduced via a wet chemistry route (sol–gel) with subsequent annealing in air. As per our EPR data above, other EPR works of ours [30,31] and other groups [5,9] have shown this procedure predominantly generates Ti-ON-Ti adducts, where the nitrogen is found in interstitial positions bound to lattice oxygen. It therefore appears that this doping arrangement is not altering significantly the acidic character of surface T i O H groups as evidenced by an unchanged pH i e p for the N-doped T i O 2 with no W. Note though that Miyauchi et al. [60] found a pH i e p between pH 0 and 1 for N doped T i O 2 nanoparticles. Miyauchi et al. [60] however prepared their specimen through high temperature nitridation (annealing T i O 2 in the presence of N H 3 at 600 C ), a synthetic route known to induce prevalently the substitution of lattice O with N, i.e., Ti-N-Ti. If substituting a surface oxygen, N can form surface N-H groups which Brœnsted acidity is higher than surface O-H groups (N less electronegative than O, thus Ti-N bonding more covalent than Ti-O bonding, i.e., N-H bonding weaker than O-H bonding).

4.4. Overall Applicability of the Proposed Approach

A final note should be made regarding the applicability and limitations of the solid/water interface model adopted here. The 2-pK charging TLM model has proved to be a useful approach to interpret the chemistry of doped T i O 2 /water interfaces, besides its already known validity for undoped single metal oxide/water interfaces. Nevertheless, if applying this model, one should always be mindful of its limitations. First, the model considers one single coordination type of surface site and does not discriminate amongst sites with different oxygen–metal coordination geometries, i.e., does not differentiate amongst terminal O H groups, bridging O H groups and adducts formed by non-dissociative adsorption of water molecules (see Folli et al. [61] for speciation, interconversion and stability of these different types of surface O H groups in anatase T i O 2 ). Second, the theoretical description of the 2-pK charging TLM model, considers H + as the potential-determining ion; however, it does not take into account possible intercalation of H + in the crystal structure. T i O 2 is commonly used in L i -ion batteries as L i + intercalates very well in the crystal lattice. Protons are even smaller than L i + , therefore one should expected a non-negligible degree of intercalation for H + , which implies that not all of the H + taken from the bulk of the electrolyte solution contribute to determining the surface potential according to Equations (1)–(4). This could be even more of a problem when considering Ti 0.909 W 0.091 O 2 N x colloidal nanoparticles. Our EPR results highlighted the presence of W bronze-like surface superstructures on the surface of the doped anatase nanoparticles. W bronzes are well known for intercalating H + when W 6 + reduces to W 5 + , compensating the extra negative charge associated with the reduction event. As a result, there is the possibility that not all the H + available play a surface potential determining role. Therefore, the absolute values of the acidity and complexation constants derived by simulating the surface charge density data (in particular for the case of doped nanoparticles) should be treated cautiously. As to the latter point, the solid–water interface of W doped T i O 2 is (microscopically) characterised by W O and T i O sites reacting with the potential determining ions (i.e., H + ), where the boundary limits represent the surface of undoped T i O 2 in one case and the surface of O H in the other. The 2-pK charging TLM model, as applied for the doped T i O 2 in the context of this work, does not discriminate between these sites but simply considers an overall surface as if it was characterised by one type of surface sites S O with overall acidity and counterion association constants equal to K a 1 int , K a 2 int , K C int , K A int . As a result, while the K a s for T i O 2 represents (within the limits described above about surface sites of different oxygen–metal coordination geometries) chemically specific acidity and counterion association constants of surface T i O sites, in the case of the doped nanoparticles, the values reflect macroscopic averages of the entire surface. Nevertheless, these are still informative when it comes to understand and predict the surface adsorption modes of substrates undergoing photocatalytic conversion. A typical example is the degradation of zwitterionic dyes. It has been shown that at 4 < pH < 6 Rhodamine B adsorbs on the surface of T i O 2 / S i O 2 particles via the positively charged diethylamino group rather than the negatively charged carboxyl group as expected on the surface of unmodified T i O 2 [62]. Similar results were obtained with T i O 2 nanoparticles where surface OH were replaced by F [63]. The intimate mix of the two oxides (i.e., T i O 2 and S i O 2 ) or the surface fluorination allowed for a significant drop of the pH i e p and a predominantly negatively charged oxide surface, in a very similar fashion as the W doping in the present study. Interestingly, the mechanism of photocatalytic Rhodamine B degradation was observed to be dependent on the way Rhodamine B adsorbs on the surface of the photocatalyst [62,63]. These findings in conjunction with the evidence provided by this work, showing that even low levels of W doping cause a significant change of the photocatalyst surface chemistry, demonstrate that the comparison of photocatalytic activities of doped vs. undoped T i O 2 cannot be carried out based on light harvesting and band structure exclusively. A clear understanding of the photocatalyst surface chemistry driving adsorption/desorption events needs to be in place.

5. Materials and Methods

5.1. Synthesis

All the doped T i O 2 photocatalysts used in this work were synthesised according to synthetic procedures described in our previous works [30,31,32,64].
A commercially available, undoped anatase T i O 2 , i.e., Tronox CristalACTiVTM PC-105, was used as a reference for comparison (Tronox, Stallingborough Grimsby, North East Lincolnshire, United Kingdom).

5.2. Aberration Corrected Scanning Transmission Electron Microscopy (STEM)

Samples for examination by scanning transmission electron microscopy (STEM) were prepared by dispersing the dry catalyst powder onto a holey carbon film supported by a 300 mesh copper TEM grid. STEM high-angle annular dark-field (HAADF) images of the samples were obtained using an aberration corrected JEM ARM-200CF STEM operating at 200 k V (JEOL, Peabody, MA, USA).

5.3. Electron Paramagnetic Resonance (EPR) Spectroscopy

The X-band CW-EPR spectra were recorded on a Bruker Elexsys E500 (Bruker Biospin, Rheinstetten, Germany) spectrometer equipped with an Oxford Instruments liquid-helium cryostat (Oxford Instruments, Abingdon, United Kingdom) and a Bruker ER4122 SHQE-W1 super high Q resonator (Bruker Biospin, Rheinstetten, Germany), operating at 50 K .
Before each measurement, the samples were evacuated for at least 12 h at 393 K and under dynamic vacuum, ca. 10 4 bar. Spectra were recorded in the absence of ultra band gap irradiation. Experimental spectra were simulated and fitted using the EasySpin MATLAB® toolbox [65].

5.4. Electrolyte and Mass Titrations

The experimental evaluation of the pH of zero charge (PZC) and the surface charge density was conducted according to the electrolyte titration method described in Folli et al. [40] and the mass titration method described in Preočanin and Kallay [53] as well as Reymond et al. [66]. Electrolyte as well as mass titrations were conducted in solutions of NANO 3 at a constant ionic strength of 10 2 mol L 1 . The evaluation of the degree of contamination—essential to correct the PZC derived by mass titration—was conducted according to the method reported in Žalac and Kallay [54].

5.5. Electroacoustics and Laser Doppler Micro-Electrophoresis

ζ potential of solid particle dispersions were measured using a Colloidal Dynamics Zetaprobe analyserTM (Colloidal Dynamics, Ponte Vedra Beach, FL, USA) based on a multi-frequency electroacoustic method, as well as using a Malvern Zetasizer Nano ZSTM (Malvern Panalytical, Malvern, United Kingdom) based on a laser Doppler micro-electrophoretic method. Photocatalyst suspensions were prepared in water at different pH and at a constant ionic strength of 10 2 mol L 1 through the use of NANO 3 as a supporting electrolyte. In the case of the acoustic method, 1% w/w of photocatalyst suspensions were used, while for the laser doppler micro-electrophoretic method, 0.01% w/w of photocatalyst suspensions were used. Before each measurement, the suspensions were stabilised by sonication in ultrasonic bath for 15 min .

6. Conclusions

A combination of EPR, microscopy, electrophoresis and simulations to study the surface chemistry of doped T i O 2 photocatalysts is proposed. We show that EPR, coupled to other analytical methods, can be a powerful technique for elucidating the surface nature and chemistry of transition metal oxides. The study has focused on the case of W- and N-doped T i O 2 . Using paramagnetic interstitial N centres and W 5 + as spin probes, EPR and microscopy allowed to identify the chemical and crystallographic nature of the doped T i O 2 nanoparticles surface. In the case of high levels of W doping (9 at . % –10 at . % ) the typical anatase surface modified by substitutional W was found to coexist with locally ordered WxOy and W bronze-like clusters preferentially grown during synthesis. In addition, mass titration, surface charge density/potential and zeta potential measurements/simulations revealed, that at these levels of W doping, the surfaces of W and N codoped T i O 2 and W-doped T i O 2 are significantly more acidic when compared to their undoped T i O 2 counterparts; as revealed by the pH p z c and pH i e p which were found to be comparable with those of W O 3 [58,59]. The results of our investigation also helped to understand the single role of nitrogen and tungsten as dopants on the anatase T i O 2 /electrolyte solution interface. The presence of interstitial N did not alter the ordinary surface chemistry typical of undoped T i O 2 as confirmed by a ζ profiles for solely (interstitial) N doped T i O 2 which were found to be almost identical as the one obtained for undoped titania. On the contrary, W dramatically altered this chemistry. Lattice W 6 + cations, as well as W containing clusters, generate very acidic surface W-OH groups compared to amphoteric Ti-OH. As a result, W has the major effect of changing the surface chemistry of T i O 2 whereas interstitial N seems to have no effect at all. Having identified how the T i O 2 /electrolyte interface chemistry is modified as a consequence of doping with W and N and having provided tools for analysing these changes, this work adds to our existing knowledge of W and N doped T i O 2 photocatalytic activities and selectivities by providing important details that aid the interpretation and understanding of adsorption/desorption mechanisms of species that are transformed during photocatalytic events.

Supplementary Materials

The following are available online at https://www.mdpi.com/article/10.3390/catal11111305/s1, Figure S1: captionMass titration of Ti 0.909 W 0.091 O 2 N x in deionised water and N A N O 3 as a supporting electrolyte to adjust the ionic strength at the constant value of I = 10 2   mol   L 1 . Two titrations (alkaline runs) were performed starting at a pH farer (black markers) and closer (blue markers) to the expected pH of zero charge pH p z c . The starting pH was obtained adding a a 0.1 mol L−1 solution of N A O H , Figure S2: Mass titration of undoped anatase T i O 2 in deionised water and N A N O 3 as a supporting electrolyte to adjust the ionic strength at the constant value of I = 10 2   mol   L 1 . The decaying curve represents the alkaline run (starting pH obtained adding a 0.1 mol L−1 solution of N A O H ) whilst the growing curve represents the acidic run (starting pH obtained adding a 0.1 mol L−1 solution of H N O 3 ), Figure S3: Titration for the determination of the degree of contamination u for the undoped anatase T i O 2 used in this work. Reference [67] is cited in the Supplementary Materials.

Author Contributions

Conceptualisation, A.F.; methodology, D.E.M. and A.F.; formal analysis, A.F.; investigation, S.G., K.R., L.L., C.J.K. and A.F.; resources, C.J.K., D.E.M. and A.F.; data curation, D.E.M. and A.F.; writing—original draft preparation, A.F.; writing—review and editing, C.J.K., D.E.M. and A.F.; supervision, D.E.M. and A.F.; project administration, A.F.; funding acquisition, C.J.K. and A.F. All authors have read and agreed to the published version of the manuscript.

Funding

The authors thank the European Commission (FP7-ENV-2011-ECO-INNO-TwoStage 283062) for funding. C.J.K. gratefully acknowledges funding from the National Science Foundation Major Research Instrumentation program (GR# MRI/DMR-1040229).

Conflicts of Interest

The authors declare no conflict of interest.

References

  1. Folli, A.; Bloh, J.Z.; Strøm, M.; Pilegaard Madsen, T.; Henriksen, T.; Macphee, D.E. Efficiency of Solar-Light-Driven TiO2 Photocatalysis at Different Latitudes and Seasons. Where and When Does TiO2 Really Work? J. Phys. Chem. Lett. 2014, 5, 830–832. [Google Scholar] [CrossRef]
  2. Liu, L.; Chen, X. Titanium Dioxide Nanomaterials: Self-Structural Modifications. Chem. Rev. 2014, 114, 9890–9918. [Google Scholar] [CrossRef] [PubMed]
  3. Zuo, F.; Bozhilov, K.; Dillon, R.J.; Wang, L.; Smith, P.; Zhao, X.; Bardeen, C.; Feng, P. Active Facets on Titanium(III)-Doped TiO2: An Effective Strategy to Improve the Visible-Light Photocatalytic Activity. Angew. Chem. 2012, 124, 6327–6330. [Google Scholar] [CrossRef]
  4. Xing, M.; Li, X.; Zhang, J. Synergistic effect on the visible light activity of Ti3+ doped TiO2 nanorods/boron doped graphene composite. Sci. Rep. 2014, 4, 1–7. [Google Scholar] [CrossRef]
  5. Livraghi, S.; Paganini, M.C.; Giamello, E.; Selloni, A.; Di Valentin, C.; Pacchioni, G. Origin of Photoactivity of Nitrogen-Doped Titanium Dioxide under Visible Light. J. Am. Chem. Soc. 2006, 128, 15666–15671. [Google Scholar] [CrossRef] [PubMed]
  6. Chen, X.; Burda, C. The Electronic Origin of the Visible-Light Absorption Properties of C-, N- and S-Doped TiO2 Nanomaterials. J. Am. Chem. Soc. 2008, 130, 5018–5019. [Google Scholar] [CrossRef] [PubMed]
  7. Czoska, A.M.; Livraghi, S.; Paganini, M.C.; Giamello, E.; Di Valentin, C.; Pacchioni, G. The nitrogen-boron paramagnetic center in visible light sensitized N-B co-doped TiO2. Experimental and theoretical characterization. Phys. Chem. Chem. Phys. 2011, 13, 136–143. [Google Scholar] [CrossRef]
  8. Barolo, G.; Livraghi, S.; Chiesa, M.; Paganini, M.C.; Giamello, E. Mechanism of the Photoactivity under Visible Light of N-Doped Titanium Dioxide. Charge Carriers Migration in Irradiated N-TiO2 Investigated by Electron Paramagnetic Resonance. J. Phys. Chem. C 2012, 116, 20887–20894. [Google Scholar] [CrossRef]
  9. Xu, J.; Wang, F.; Liu, W.; Cao, W. Nanocrystalline N-Doped TiO2 Powders: Mild Hydrothermal Synthesis and Photocatalytic Degradation of Phenol under Visible Light Irradiation. Int. J. Photoenergy 2013, 2013, 1–7. [Google Scholar]
  10. Yuan, W.; Li, J.; Wang, L.; Chen, P.; Xie, A.; Shen, Y. Nanocomposite of N-Doped TiO2 Nanorods and Graphene as an Effective Electrocatalyst for the Oxygen Reduction Reaction. ACS Appl. Mater. Interfaces 2014, 6, 21978–21985. [Google Scholar] [CrossRef]
  11. Bauer, D.; Roberts, A.J.; Matsumi, N.; Darr, J.A. Nano-sized Mo- and Nb-doped TiO2 as anode materials for high energy and high power hybrid Li-ion capacitors. Nanotechnology 2017, 28, 195403. [Google Scholar] [CrossRef] [PubMed]
  12. Chang, T.T. Paramagnetic Resonance Spectrum of W5+ in Rutile (TiO2). Phys. Rev. 1966, 147, 264–267. [Google Scholar] [CrossRef]
  13. De Trizio, L.; Buonsanti, R.; Schimpf, A.M.; Llordes, A.; Gamelin, D.R.; Simonutti, R.; Milliron, D.J. Nb-Doped Colloidal TiO2 Nanocrystals with Tunable Infrared Absorption. Chem. Mater. 2013, 25, 3383–3390. [Google Scholar] [CrossRef]
  14. Nosaka, Y.; Takahashi, S.; Sakamoto, H.; Nosaka, A.Y. Reaction Mechanism of Cu(II)-Grafted Visible-Light Responsive TiO2 and WO3 Photocatalysts Studied by Means of ESR Spectroscopy and Chemiluminescence Photometry. J. Phys. Chem. C 2011, 115, 21283–21290. [Google Scholar] [CrossRef]
  15. Yang, Y.; Wang, H.; Li, X.; Wang, C. Electrospun mesoporous W6+-doped TiO2 thin films for efficient visible-light photocatalysis. Mater. Lett. 2009, 63, 331–333. [Google Scholar] [CrossRef]
  16. Zimmermann, P.H. Temperature Dependence of the EPR Spectra of Niobium-Doped TiO2. Phys. Rev. B 1973, 8, 3917–3927. [Google Scholar] [CrossRef]
  17. Yue, J.; Suchomski, C.; Voepel, P.; Ellinghaus, R.; Rohnke, M.; Leichtweiss, T.; Elm, M.T.; Smarsly, B.M. Mesoporous niobium-doped titanium dioxide films from the assembly of crystalline nanoparticles: Study on the relationship between the band structure, conductivity and charge storage mechanism. J. Mater. Chem. A 2017, 5, 1978–1988. [Google Scholar] [CrossRef] [Green Version]
  18. Atashbar, M.Z.; Sun, H.T.; Gong, B.; Wlodarski, W.; Lamb, R. XPS study of Nb-doped oxygen sensing TiO2 thin films prepared by sol-gel method. Thin Solid Films 1998, 326, 238–244. [Google Scholar] [CrossRef]
  19. Tobaldi, D.M.; Pullar, R.C.; Gualtieri, A.F.; Seabra, M.P.; Labrincha, J.A. Sol-gel synthesis, characterisation and photocatalytic activity of pure, W-, Ag- and W/Ag co-doped TiO2 nanopowders. Chem. Eng. J. 2013, 214, 364–375. [Google Scholar] [CrossRef]
  20. Tasaki, C.; Oka, N.; Yagi, T.; Taketoshi, N.; Baba, T.; Kamiyama, T.; Nakamura, S.-I.; Shigesato, Y. Thermophysical Properties of Transparent Conductive Nb-Doped TiO2 Films. Jpn. J. App. Phys. 2012, 51, 035802. [Google Scholar]
  21. Lee, S.; Noh, J.H.; Han, H.S.; Yim, D.K.; Kim, D.H.; Lee, J.-K.; Kim, J.Y.; Jung, H.S.; Hong, K.S. Nb-Doped TiO2: A New Compact Layer Material for TiO2 Dye-Sensitized Solar Cells. J. Phys. Chem. C 2009, 113, 6878–6882. [Google Scholar] [CrossRef]
  22. Lee, H.Y.; Robertson, J. Doping and compensation in Nb-doped anatase and rutile TiO2. J. App. Phys. 2013, 113, 213706. [Google Scholar] [CrossRef]
  23. Couselo, N.; GarciaEinschlag, F.; Candal, R.; Jobbagy, M. Tungsten-Doped TiO2 vs. Pure TiO2 Photocatalysts: Effects on Photobleaching Kinetics and Mechanism. J. Phys. Chem. C 2008, 112, 1094–1100. [Google Scholar] [CrossRef]
  24. Tung, W.S.; Daoud, W.A. New Approach Toward Nanosized Ferrous Ferric Oxide and Fe3O4-doped Titanium Dioxide Photocatalysts. ACS Appl. Mater. Interfaces 2009, 1, 2453–2461. [Google Scholar] [CrossRef]
  25. Thind, S.S.; Wu, G.; Chen, A. Synthesis of mesoporous nitrogen–tungsten co-doped TiO2 photocatalysts with high visible light activity. Appl. Catal. B Environ. 2012, 111–112, 38–45. [Google Scholar] [CrossRef]
  26. Çelik, V.; Mete, E. Range-separated hybrid exchange-correlation functional analyses of anatase TiO2 doped with W, N, S, W/N, or W/S. Phys. Rev. B 2012, 86, 205112. [Google Scholar] [CrossRef] [Green Version]
  27. Biedrzycki, J.; Livraghi, S.; Giamello, E.; Agnoli, S.; Granozzi, G. Fluorine- and Niobium-Doped TiO2: Chemical and Spectroscopic Properties of Polycrystalline n-Type-Doped Anatase. J. Phys. Chem. C 2014, 118, 8462–8473. [Google Scholar] [CrossRef]
  28. Kubacka, A.; Colón, G.; Fernández-García, M. N- and/or W-(co)doped TiO2-anatase catalysts: Effect of the calcination treatment on photoactivity. Appl. Catal. B 2010, 95, 238–244. [Google Scholar] [CrossRef]
  29. Sajjad, A.K.L.; Shamaila, S.; Zhang, J. Study of new states in visible light active W, N co-doped TiO2 photo catalyst. Mater. Res. Bull. 2012, 47, 3083–3089. [Google Scholar] [CrossRef]
  30. Folli, A.; Bloh, J.Z.; Beukes, E.P.; Howe, R.F.; Macphee, D.E. Photogenerated Charge Carriers and Paramagnetic Species in (W,N)- Codoped TiO2 Photocatalysts under Visible-Light Irradiation: An EPR Study. J. Phys. Chem. C 2013, 117, 22149–22155. [Google Scholar] [CrossRef]
  31. Folli, A.; Bloh, J.Z.; Armstrong, K.; Richards, E.; Murphy, D.M.; Lu, L.; Kiely, C.J.; Morgan, D.J.; Smith, R.I.; Mclaughlin, A.C.; et al. Improving the Selectivity of Photocatalytic NOx Abatement through Improved O2 Reduction Pathways Using Ti0.909W0.091O2Nx Semiconductor Nanoparticles: From Characterization to Photocatalytic Performanc. ACS Catal. 2018, 8, 6927–6938. [Google Scholar] [CrossRef]
  32. Bloh, J.Z.; Folli, A.; Macphee, D.E. Adjusting Nitrogen Doping Level in Titanium Dioxide by Codoping with Tungsten: Properties and Band Structure of the Resulting Materials. J. Phys. Chem. C 2014, 118, 21281–21292. [Google Scholar] [CrossRef]
  33. Folli, A.; Bloh, J.Z.; Walker, R.; Lecaplain, A.; Macphee, D.E. Properties and Photochemistry of Valence-Induced-Ti3+ Enriched (Nb,N)-Codoped Anatase TiO2 Semiconductors. Phys. Chem. Chem. Phys. 2015, 17, 4849–4853. [Google Scholar] [CrossRef]
  34. Borlaf, M.; Colomer, M.T.; De Andrés, A.; Cabello, F.; Serna, R.; Moreno, R. TiO2/Eu3+ thin films with high photoluminescence emission prepared by electrophoretic deposition from nanoparticulate sols. Eur. J. Inorg. Chem. 2014, 2014, 5152–5159. [Google Scholar] [CrossRef]
  35. us Saqib, N.; Adnan, R.; Shah, I. A mini-review on rare earth metal-doped TiO2 for photocatalytic remediation of wastewater. Environ. Sci. Pollut. Res. 2016, 23, 15941–15951. [Google Scholar] [CrossRef]
  36. D’ Arienzo, M.; Siedl, N.; Sternig, A.; Scotti, R.; Morazzoni, F.; Bernardi, J.; Diwald, O. Solar light and dopant-induced recombination effects: Photoactive nitrogen in TiO2 as a case study. J. Phys. Chem. C 2010, 114, 18067–18072. [Google Scholar] [CrossRef]
  37. Blesa, M.A.; Kallay, N. The metal oxide - electrolyte solution interface revisited. Adv. Colloid Interf. Sci. 1988, 28, 111–134. [Google Scholar] [CrossRef]
  38. Piasecki, W.; Rudzinski, W.; Charmas, R. 1-p K and 2-p K Protonation Models in the Theoretical Description of Simple Ion Adsorption at the Oxide/Electrolyte Interface: A Comparative Study of the Behavior of the Surface Charge, the Individual Isotherms of Ions, and the Accompanying Electrokinetic. J. Phys. Chem. B 2001, 105, 9755–9771. [Google Scholar] [CrossRef]
  39. Tejedor-Tejedor, M.I.; Anderson, M.A. In situ attenuated total reflection fourier transform infrared studies of the Goethite (alpha-FeOOH)-acqueous solution interface. Langmuir 1986, 2, 203–210. [Google Scholar] [CrossRef]
  40. Folli, A.; Pochard, I.; Nonat, A.; Jakobsen, U.; Shepherd, A.; Macphee, D. Engineering photocatalytic Cements: Understanding TiO2 surface chemistry to control and modulate photocatalytic performances. J. Amer. Ceram. Soc. 2010, 93, 3360–3369. [Google Scholar] [CrossRef]
  41. Di Valentin, C.; Finazzi, E.; Pacchioni, G.; Selloni, A.; Livraghi, S.; Paganini, M.C.; Giamello, E. N-doped TiO2: Theory and Experiment. Chem. Phys. 2007, 339, 44–56. [Google Scholar] [CrossRef]
  42. Livraghi, S.; Chierotti, M.R.; Giamello, E.; Magnacca, G.; Paganini, M.C.; Cappelletti, G.; Bianchi, C.L. Nitrogen-Doped Titanium Dioxide Active in Photocatalytic Reactions with Visible Light: A Multi-Technique Characterization of Differently Prepared Materials. J. Phys. Chem. C 2008, 112, 17244–17252. [Google Scholar] [CrossRef]
  43. Messai, Y.; Vileno, B.; Martel, D.; Turek, P.; Mekki, D.E. Milling effect on the photo-activated properties of TiO2 nanoparticles: Electronic and structural investigations. Bull. Mater. Sci. 2018, 41, 1–11. [Google Scholar] [CrossRef] [Green Version]
  44. Kuba, S.; Heydorn, P.; Grasselli, R.K.; Gates, B.C.; Chec, M.; Kno, H. Redox Properties of Tungstated Zirconia Catalysts: Relevance to the Activation of n-Alkanes. Phys. Chem. Chem. Phys. 2001, 3, 146–154. [Google Scholar] [CrossRef]
  45. Occhiuzzi, M.; Cordischi, D.; De Rossi, S.; Ferraris, G.; Gazzoli, D.; Valigi, M. Pd-Promoted WOx/ZrO2 Catalysts: Characterization and Catalytic Activity for n-Butane Isomerization. Appl. Catal. A 2008, 351, 29–35. [Google Scholar] [CrossRef]
  46. Occhiuzzi, M.; Cordischi, D.; Gazzoli, D.; Valigi, M.; Heydorn, P.C. WOx/ZrO2 Catalysts Part 4. Redox Properties as Investigated by Redox Cycles, XPS and EPR. Appl. Catal. A 2004, 269, 169–177. [Google Scholar] [CrossRef]
  47. Weil, J.A.; Bolton, J.R.; Wertz, J.E. Electron Paramagnetic Resonance: Elementary Theory and Practical Applications, 1st ed.; John Wiley & Sons: New York, NY, USA, 1994; p. 568. [Google Scholar]
  48. Castner, T.; Newell, G.S.; Holton, W.C.; Slighter, C.P. Note on the paramagnetic resonance of iron in glass. J. Chem. Phys. 1960, 32, 668–673. [Google Scholar] [CrossRef]
  49. Howe, R.F.; Gratzel, M. EPR observation of trapped electrons in colloidal titanium dioxide. J. Phys. Chem. 1985, 89, 4495–4499. [Google Scholar] [CrossRef]
  50. Micic, O.I.; Zhang, Y.; Cromack, K.R.; Trifunac, A.D.; Thurnauer, M.C. Photoinduced Hole Transfer from TiO2 to Methanol Molecules in Aqueous Solution Studied by Electron Paramagnetic Resonance. J. Phys. Chem. 1993, 97, 13284–13288. [Google Scholar] [CrossRef]
  51. Micic, O.I.; Zhang, Y.; Cromack, K.; Trifunac, A.D.; Thurnauer, M.C. Trapped holes on TiO2 colloids studied by electron paramagnetic resonance. J. Phys. Chem. 1993, 97, 7277–7283. [Google Scholar] [CrossRef]
  52. Jenkins, C.A.; Murphy, D.M. Thermal and photoreactivity of TiO2 at the gas-solid interface with aliphatic and aromatic aldehydes. J. Phys. Chem. B 1999, 103, 1019–1026. [Google Scholar] [CrossRef]
  53. Preocanin, T.; Kallay, N. Point of zero charge and surface charge density of TiO2 in aqueous electrolyte solution as obtained by potentiometric mass titration. Croat. Chem. Acta 2006, 79, 95–106. [Google Scholar]
  54. Zalac, S.; Kallay, N. Application of Mass Titration to the Point of Zero Charge Determination. J. Colloid Interf. Sci. 1992, 149, 233–240. [Google Scholar] [CrossRef]
  55. Fernandez-Garcia, M.; Martínez-Arias, A.; Fuerte, A.; Conesa, J.C. Nanostructured Ti-W Mixed-Metal Oxides: Structural and Electronic Properties. J. Phys. Chem. B 2005, 109, 6075–6083. [Google Scholar] [CrossRef]
  56. Spencer, J.; Folli, A.; Richards, E.; Murphy, D.M. Applications of electron paramagnetic resonance spectroscopy for interrogating catalytic systems. In Electron Paramagnetic Resonance; Chechik, V., Murphy, D.M., Eds.; Royal Society of Chemistry: Cambridge, UK, 2019; Volume 26, pp. 130–170. [Google Scholar]
  57. Li, X.Z.; Li, F.B.; Yang, C.L.; Ge, W.K. Photocatalytic activity of WOx-TiO2 under visible light irradiation. J. Photochem. Photobiol. A 2001, 141, 209–217. [Google Scholar] [CrossRef]
  58. Park, H.; Yang, D.-J.; Yoo, J.-S.; Mun, K.-S.; Kim, W.-R.; Kim, H.-G.; Choi, W.-Y. Surface passivation of highly ordered TiO2 nanotube arrays and application to dye-sensitized solar cells using the concept of isoelectric point. J. Ceram. Soc. Japan 2009, 117, 596–599. [Google Scholar] [CrossRef] [Green Version]
  59. Andersson, K.M.; Bergström, L. DLVO interactions of tungsten oxide and cobalt oxide surfaces measured with the colloidal probe technique. J. Colloid Interf. Sci. 2002, 246, 309–315. [Google Scholar] [CrossRef]
  60. Miyauchi, M.; Ikezawa, A.; Tobimatsu, H.; Irie, H.; Hashimoto, K. Zeta potential and photocatalytic activity of nitrogen doped TiO2 thin films. Phys. Chem. Chem. Phys. 2004, 6, 865–870. [Google Scholar] [CrossRef]
  61. Folli, A.; Campbell, S.B.; Anderson, J.A.; Macphee, D.E. Role of TiO2 Surface Hydration on NO Oxidation Photo-Activity. J. Photochem. Photobiol. A 2011, 220, 85–93. [Google Scholar] [CrossRef]
  62. Chen, F.; Zhao, J.; Hidaka, H. Highly selective deethylation of rhodamine B: Adsorption and photooxidation pathways of the dye on the TiO2/SiO2 composite photocatalyst. Intern. J. Photoenergy 2003, 5, 209–217. [Google Scholar] [CrossRef] [Green Version]
  63. Wang, Q.; Chen, C.; Zhao, D.; Ma, W.; Zhao, J. Change of Adsorption Modes of Dyes on Fluorinated TiO2 and Its Effect on Photocatalytic Degradation of Dyes under Visible Irradiation. Langmuir 2008, 24, 7338–7345. [Google Scholar] [CrossRef]
  64. Macphee, D.E.; Bloh, J.Z.; Folli, A.; Greenhalgh, D. A method of photocatalytically oxidising nitrogen oxides. Patent WO/2016/005760A1, 14 January 2016. [Google Scholar]
  65. Stoll, S.; Schweiger, A. EasySpin, a Comprehensive Software Package for Spectral Simulation and Analysis in EPR. J. Magn. Reson. 2006, 178, 42–55. [Google Scholar] [CrossRef] [PubMed]
  66. Reymond, J.P.; Kolenda, F. Estimation of the point of zero charge of simple and mixed oxides by mass titration. Powder Tech. 1999, 103, 30–36. [Google Scholar] [CrossRef]
  67. Sonnefeld, J. On the influence of background electrolyte concentration on the position of the isoelectric point and the point of zero charge. Colloids Surfaces Physicochem. Eng. Asp. 2001, 190, 179–183. [Google Scholar] [CrossRef]
Figure 1. Schematic representation of the charge densities and potentials in a triple-layer model (TLM) configuration with three charged planes: metal oxide surface; β plane, where associated counter ions are located; d plane, onset of the diffuse layer. The 2 different pKs are a consequence of the amphoteric character of the surface hydroxyl groups. In the figure, the hydro-dynamically stagnant and mobile layers are also depicted in green.
Catalysts 11 01305 g001
Figure 2. Ti 0.909 W 0.091 O 2 N x : (a,b) Representative HAADF-STEM images. The presence of both substitutional W (brighter dots) and W-containing surface clusters (extended brighter areas highlighted by yellow circles) are evident in the images. (c) Experimental (black) and simulated (red) X-band CW EPR spectra recorded at 50 K around the free-spin region. The simulated spectrum is deconvoluted into its three components. The relative spectral contributions are 99.5% adsorbed NO, 0.4% NO 2 and ~0.1% W NO 2 . (d) Experimental (black) and simulated (red and blue) X-band CW EPR spectra measured at 50 K at higher magnetic induction. The relative spectral contributions are 66.7 % W 5 + in WxOy (circles) and 33.3% W 5 + in W bronzes superstructures (squares). The blue simulation refers to a powder spectrum with orientational probability distribution of the paramagnetic W 5 + centres given by inset (d’). The red simulation refers to a powder spectrum with orientational probability distribution of the paramagnetic W 5 + centres given by inset (d”). The experimental spectra were recorded at 100 k Hz field modulation frequency, 0.2 m T field modulation amplitude, 2 μW microwave power, and 72 dB receiver gain. (e) Experimental (discrete points) and simulated (red solid line) surface charge density plot at constant ionic strength I = 10 2 mol L−1. Both black and blue points are the experimental σ 0 obtained from the mass titrations in Figure S1 and are two different replicates of the same measurement. Inset (e’) shows the simulated surface sites speciation relative to the surface site complexes with cations ( N a + ) and anions ( N O 3 ). (f) Experimental electrokinetic ( ζ ) potential measured at constant ionic strength I = 10 2 mol L−1 using the laser doppler microelectrophoretic method.
Catalysts 11 01305 g002
Figure 3. Undoped anatase T i O 2 : (a,b) Representative low and higher magnification HAADF-STEM images. (c) Experimental (black) and simulated (red) X-band CW EPR spectra recorded at 50 K around the free-spin region. The two major EPR signals identified are deconvoluted. The relative spectral contributions are 49.3% adsorbed NO and 1.5% T i 3 + . The black arrow indicated the broad resonance at approximately g = 2.05 with spectral contribution equal to 49.2%. (d) Experimental X-band CW EPR spectra measured at 50 K at higher magnetic induction. The experimental spectra were recorded at 100 k Hz field modulation frequency, 0.2   m T field modulation amplitude, 2 μW microwave power and 72 dB receiver gain. (e) Experimental (discrete points) and simulated (red solid line) surface charge density plot at constant ionic strength I = 10 2   mol   L 1 . The black points are the experimental σ 0 obtained from the mass titrations in Figure S2, while the blue points are the experimental σ 0 obtained according to the electrolyte titration as in Folli et al. [40]. Inset (e’) shows the simulated surface sites speciation relative to the surface site complexes with cations ( Na + ) and anions ( NO 3 ). (f) Experimental (discrete points) and simulated (red solid line) electrokinetic ( ζ ) potential measured at constant ionic strength I = 10 2   mol   L . The black points represent ζ measured using the laser Doppler microelectrophoretic method, while the blue points are ζ measured using the acoustic method.
Catalysts 11 01305 g003
Figure 4. Experimental electrokinetic ( ζ ) potential measured at constant ionic strength I = 10 2   mol   L 1 using the laser doppler microelectrophoretic method. (a) Ti 0.999 W 0.001 O 2 N x ; (b) Ti 0.990 W 0.010 O 2 N x ; (c) Ti 0.980 W 0.020 O 2 N x ; (d) Ti 0.950 W 0.050 O 2 N x ; (e) Ti 0.909 W 0.091 O 2 N x ; (f) T i O 2 N x .
Catalysts 11 01305 g004
Table 1. Spin Hamiltonian parameters of the N O centres associated with N doping.
SpeciesTemp./K g 1 g 2 g 3 | A 1 N 14 | /MHz | A 2 N 14 | /MHz | A 3 N 14 | /MHz | A 1 W 183 | /MHz | A 2 W 183 | /MHz | A 3 W 183 | /MHz
ads NO502.001 a 1.998 a 1.921 a <2.8 b 89.7 c 26.9 c
N O 2 502.005 a 2.004 a 2.003 a 6.5 c 15.7 c 89.7 c
W- N O 2 502.001 a 2.000 a 1.999 a 42.0 c 22.4 c 140.1 c 44.8 c <2.8 b 154.1 c
a ±0.001; b not accurately measurable on the EPR spectrum; c ±2.8 MHz . Simulated spectral linewidths were computed using g strain for g 1 , g 2 and g 3 , respectively, ads NO: 0.0071 0.0032 0.0022; NO 2 : 0.002   0.004   0.003 ; W NO2−: 0.003 0.004 0.003.
Table 2. Spin Hamiltonian parameters of the paramagnetic metal ion centres.
SpeciesTemp. g g
/ K
W 5 +   in WxOy501.85 e1.50 e
W 5 +   in   bronze-like   superstructures 501.80 e1.64 e
T i 3 + 501.9881.950
e ±0.01. Simulated spectral linewidths were computed using g strain for g and g , respectively, W 5 + in WxOy: 0.015 0.06; W 5 +   in   bronze-like   superstructures : 0.015 0.06; Ti3+: 0.014 0.006.
Table 3. 2-pK TLM modelled parameters for T i O 2 and Ti 0.909 W 0.091 O 2 N x colloidal nanoparticles aqueous solutions with I = 10 2   mol   L 1 adjusted with N A N O 3 .
Sample pK a 1 int pK a 2 int pK C int pK A int c 1 c 2 N s
/Fm−2/Fm−2/mol m−2
(anatase) T i O 2 3.208.805.556.451.05inf1.99 × 10−5
Ti 0.909 W 0.091 O 2 N x −1.504.502.003.000.35inf3.00 × 10−5
Publisher’s Note: MDPI stays neutral with regard to jurisdictional claims in published maps and institutional affiliations.

