Article

Integrating Syngas Fermentation into a Single-Cell Microbial Electrosynthesis (MES) Reactor

Department of Process, Energy and Environmental Technology, University of South-Eastern Norway, 3918 Porsgrunn, Norway
*
Author to whom correspondence should be addressed.
Catalysts 2021, 11(1), 40; https://doi.org/10.3390/catal11010040
Submission received: 30 November 2020 / Revised: 25 December 2020 / Accepted: 28 December 2020 / Published: 31 December 2020
(This article belongs to the Special Issue Catalysts for Production and Conversion of Syngas)

Abstract

:
This study presents a series of experiments to test the integration of syngas fermentation into a single-cell microbial electrosynthesis (MES) process. Minimal gas–liquid mass transfer is the primary bottleneck in such gas-fermentation processes. Therefore, we hypothesized that MES integration could trigger the thermodynamic barrier, resulting in higher gas–liquid mass transfer and product-formation rates. The study was performed in three different phases as batch experiments. The first phase dealt with mixed-culture fermentation at 1 bar H2 headspace pressure. During the second phase, surface electrodes were integrated into the fermentation medium, and investigations were performed in open-circuit mode. In the third phase, the electrodes were poised with a voltage, and the second phase was extended in closed-circuit mode. Phase 2 demonstrated three times the gas consumption (1021 mmol) and 63% more production of acetic acid (60 mmol/L) than Phase 1. However, Phase 3 failed; at –0.8 V, acetic acid was oxidized to yield hydrogen gas in the headspace.

1. Introduction

Pyrolysis and gasification technologies are attractive organic waste decomposition strategies that result in a gaseous product known as syngas, which is a mixture of carbon monoxide (CO), carbon dioxide (CO2), and hydrogen (H2). Due to its energy content, syngas is considered as an energy vector for heat- and power-generation processes [1]. CO2, the final product of such processes, has no energy value, and requires a further capturing process. A typical CO2 capturing process involves either a chemical or mass transfer. Such methods are energy-intensive and expensive. Homoacetogens are microorganisms that perform CO2 fixation at room temperature and pressure using hydrogen gas as the energy source. Therefore, syngas fermentation in a homoacetogenic culture has been considered as one of the most sustainable methods of CO2 fixing.
The CO present in the syngas mixture can serve as both the carbon and energy source for fermentation, while CO2 and H2 serve only as the carbon and energy sources, respectively. Acetate is the primary end-product of homoacetogenesis (Equation (1)). Acetate synthesis from CO2 and H2 flows through the acetyl-CoA pathway, an intermediate reductive pathway also known as the Wood–Ljungdahl (WLJ) pathway [2]. The primary challenge in this fermentation process is the gas–liquid mass transfer, especially for hydrogen gas, which has lower solubility. Increasing the gas headspace pressure is one approach to improve the gas solubility and, consequently resulting in the gas–liquid mass transfer and product formation [3].
4 H 2 + 2 CO 2 CH 3 COOH + 2 H 2 O   Δ G 0 = 74.3   kJ / mol
Microbial electrosynthesis (MES) is an evolving bioprocess that transforms electrical energy into chemical energy. It uses CO2 as the substrate to synthesis-reduced forms of carbon compounds, such as methane, acetate, and other short- and medium-chain acids and alcohols [4,5]. Renewable energy is used to keep the desired potential at the cathode [6,7]. The mild potential induces nonspontaneous reactions to overcome the thermodynamic barrier [8] and reduces the activation energy. Microorganisms present at the cathode are specific to the applied potential, and consequently synthesize particular products. For example, methane synthesis from CO2 occurs at −0.65 V, while acetate formation requires a more negative potential [9]. Reducing CO2 into valuable organic chemicals is receiving more attention than transforming it into methane [10,11,12] due to challenges in handling gaseous products and the demand for the synthesized organic chemicals.
This research investigated the impact of the partial pressure of hydrogen gas on the gas consumption rate increment as a baseline. The process was extended by introducing MES to increase the gas consumption rate even further. The experiment was performed in three successive phases: (1) A mixed-culture homoacetogenic reactor was pressurized with hydrogen gas, and the gas uptake rate and fermentation products were investigated; (2) Phase 1 was repeated with surface-electrodes installed in the reactor, which was operated in open-circuit mode (OCM); and (3) Phase 2 was continued in closed-circuit mode (CCM).
Having only H2 gas in the headspace simplified the experiments; therefore, the syngas was mimicked as a mixture of CO2 and H2. Only pure H2 was supplied in the headspace at approximately one bar elevated pressure, while CO2 was provided indirectly as sodium bicarbonate salt in the liquid medium [5,13]. During the two-month operation period, hydrogen gas consumption ceased. After that, the MES process was integrated within the elevated pressure in the syngas fermentation reactor, with the intention to enhance the gas uptake and product formation rate.
Elevating the partial pressure of a gas increases its solubility and consumption rate. Many studies of MES integration with fermentation to enhance gas uptake and product synthesis have been performed. However, most studies were carried out in two-chamber MES reactors [5,11,14], which mainly focus on CO2 use and the formation of methane and acetic acid. A two-chamber reactor arrangement is mostly preferred for MES because the oxygen gas evolution at the anode could poison the anaerobic environments by oxidizing the redox species. No known studies have examined a single-cell MES to enhance H2 gas consumption rate in a mixed-culture homoacetogenic syngas fermentation process. However, Nelabhotla and Dinamarca have performed several MES experiments with a single-cell MES reactor setup, and found a significantly higher product-synthesis efficiency without oxygen gas evolution [15,16,17]. These studies also sought to decrease the CO2 content in the biogas.

2. Results and Discussion

2.1. Experimental Results

The pressure time series and cumulative hydrogen-consumption profiles found in Phases 1 and 2 are shown in Figure 1 and Figure 2, respectively. The hydrogen pressure drop was significantly improved by the presence of biofilm in Phase 2. Phase 1, which was conducted without biofilm, had a shorter lag phase, but also a slower and limited H2 consumption rate, which flattened at the 10th injection (Figure 1a) when the accumulated hydrogen uptake reached 342 mmol (Figure 2). In comparison, the reactor run with electrodes had a longer lag phase, with a higher H2 consumption rate that resulted in a total hydrogen accumulation of 1021 mmol H2 (Figure 2). The key results from Phases 1 and 2 are shown in Table 1.
The total amount of consumed H2 gas and the gas uptake rate during Phase 2 was 3 and 2.3 times higher than during Phase 1, respectively, and there was 63% more acetic acid production during Phase 2 (Figure 3b). Phase 2 required 90 days to reach the saturation level, while Phase 1 required only 60 days. The relative abundance of active biofilm on the electrodes caused more H2 gas dissociation and enhanced the acetic acid synthesis. In both phases, acetic acid was the primary product of the total VFAs matrix.
The open-circuit potential in Phase 2 is presented together with the headspace pressure change in Figure 1b. During the first two weeks of the experiment, the gas consumption rate was significantly lower. The rate then began to increase, and reached 13.5 mmol/L·day on day 43, then subsequently slowed to zero by the end of day 90. During the first 60 days, the OCP fluctuated widely between –350 and –80 mV, and then reached a stable range of around −70 mV on day 75. This could be a notable indication of a steady biofilm on the cathode.
When a saturation in gas consumption and a stable OCP were reached, the reactor was pressurized with H2 to 1 bar, and the cathode was poised with −0.8 V. We expected to observe a higher gas consumption during Phase 3; however, the reactor behaved in the opposite manner, and an increase in headspace pressure was observed due to significant acetate oxidation. The headspace was depressurized when it rose above 1 bar to avoid reactor rupture, and the gas was collected to perform a composition analysis. Even though the reactor produced gas instead of uptaking it, we decided to continue with Phase 3, and quantified the product formation and gas composition for a short time. We think that sharing these negative results could be a good starting point for the development of a process integration.
Phase 3 was prolonged for 10 more days. Figure 3a shows the gas-composition variation and the generated current. At the beginning of Phase 3, H2 was the only gas product (100%). After five days of operation, a trace amount (3%) of CO2 started to evolve, followed by methane (CH4) evolution (6%) on day 7. The H2 gas occupied more than 90% of the headspace. It is difficult to conclude whether the produced hydrogen had an abiotic or biotic origin; this will require several more experiments at different potentials to establish the shares of hydrogen production. However, the decrease in acetic acid concentration (Figure 3b) in CCM partially confirmed that hydrogen could be produced abiotically at the cathode. The decline in acetic acid concentration implied that acetic acid could be the source of the protons and electrons for the produced gases.
There was no oxygen gas measured in the gas mixture. This absence confirmed that single-cell MES could be integrated with the fermentation process without any countereffect due to oxygen evolution at the anode, which may oxidize redox fermentation intermediates, reducing efficiency. If the oxygen evolution is considerably large, it could result in aerobic conditions in MES, which cause severe damage to the anaerobic fermentation process. At the start of CCM, the generated current was −200 mA, which was gradually raised, reaching a peak at –600 mA (current density = 8.57 A/m2) when methane was formed. After that, it fell to –400 mA and remained stable.
Figure 3b shows the generation of VFAs throughout Phases 2 and 3. Though acetic acid and propionic acid were the primary fermentation products, at the end of Phase 2, 85% of the total VFAs was acetic acid. The added amount of bicarbonate limited the concentration of VFAs. Once the CCM started, a reduction in acetic acid was observed, which corresponded to the rise in H2 evolution.
Even though the inoculum underwent heat treatment, methane production confirmed that methanogens could not be completely eliminated by heat treatment. However, during the first 96 days of operation, the reactor did not exhibit any methane evolution. Once the electrodes were poised with voltage only, methane evolution was observed. It appeared that the electroactive methanogens were activated during Phase 3 due to the applied potential.

2.2. Why Studying Bioelectrochemical-Mediated Syngas Fermentation Is Essential?

The availability of organic waste will not be sufficient to meet the future demand for biomethane. It is expected that heavy transport, both land-based and maritime, will expand and diversify the use of this commodity, especially in Nordic countries. To meet this demand, it is necessary to increase production. The sources of organic waste for methane are limited, but CO2 from industrial exhaust is readily available, while equivalent electrons from water, sulfides, and ammonium are also available.
Additional methane can be co-generated during the bioelectrochemical reduction of CO2 and the fermentation of energy gases in one single reactor. Syngas can be converted directly to methane through hydrogenotrophic methanogenesis, or indirectly using acetate as an intermediate. To meet energy demands while safeguarding the environment with near-circular economy, we think that future biogas plants will use anaerobic digestion (AD), syngas fermentation, and bioelectrochemical systems (BES) in an integrated manner (Figure 4).
In an integrated AD-BES process as described by Nelabhotla and Dinamarca [10], an electric potential will drive electrons from water, organics, sulfides [18], and ammonium [7] to the cathode, where CO2 will be reduced to methane. We propose that methane can be produced from syngas using the same process. However, H2, CO, and CO2 may take different metabolic routes depending on the applied potential. Our experiment showed that in a BES system with a titanium-anode and carbon-felt cathode poised at a −0.8 V potential, hydrogen was produced due to acetate oxidation, while the main goal was to achieve a higher rate of hydrogen consumption. This is because syngas cannot be injected directly to AD due to the higher partial pressure of hydrogen, which inhibited the propionate degradation that halts biogas production. We set a goal of a combining AD-BES with syngas fermentation. In that combined system, hydrogen gas is converted directly to either methane or acetic acid while avoiding acetic acid oxidation, as was observed in our study.
Although Phases 1 and 2 of our experiment demonstrated a promising value addition to the syngas fermentation process, we recognize that Phase 3 was a preliminary attempt to integrate a single-cell MES into a syngas fermentation to improve the gas consumption and product-formation rates. A detailed study of optimized voltage (which would facilitate an increase in the H2 gas-uptake rate and would not oxidize the acetic acid) is necessary for proper process implications. Microbial analysis was vital at every phase to better understand the biochemical process involved. However, this attempt at a successful process integration suggested that the voltage optimization and microbial consortia analysis are essential elements in future research. Mathematical models for the reactor and the processes are also important in verifying the experimental results, and could constitute the objective of future studies.

3. Materials and Methods

3.1. Inoculum Preparation

Anaerobic digested sludge from the local wastewater treatment plant (Knarrdalstrand, Porsgrunn, Norway) was used to seed the reactor. The inoculum went through several treatment steps. First, it was sieved via 600 microns and incubated at 35 °C for a week to eliminate readily biodegradable organics. The inoculum was then heat-treated at 105 °C for 48 h to eliminate methanogens, while spore-forming acetogens were retained. The fermentation medium was facilitated with a nutrient solution composed of a mixture of salts (10 mL/L), trace elements (10 mL/L), and vitamins (10 mL/L). The nutrient solution’s composition was adapted from a similar study performed by Dinamarca and Bakke [19] (Table 2).

3.2. Phase 1

Phase 1 of the experiment was performed in a 4.125 L borosilicate glass reactor (FG Mellum AS, Akershus, Norway). It was modified as a lab-scale bioelectrochemical syngas fermentation reactor with a maximum pressure tolerance of 3 bar. The reactor was filled with 3.25 L of treated inoculum with incorporated nutrient solution and 3.4 g NaHCO3/L (CO2). A Heidolph MR 3001 magnetic stirrer (Heidolph Instruments, Schwabach, Germany) was used to provide proper agitation at 1000 rpm. The inoculum was purged with N2 gas for 5 min to strip off the oxygen, followed by a flushing with pure hydrogen gas (laboratory 5.5 = ≥ 99.9995%, Linde Gas AS, Oslo, Norway). The headspace pressure was then elevated to approximately 1 bar with H2, and the changes were logged using a CPG 1500 digital pressure gauge (WIKA, Bavaria, Germany) at 10 min intervals. Once the headspace pressure reached approximately zero, the reactor was repressurized to 1 bar and continued until no change in the pressure reading was observed. This experiment lasted 60 days.

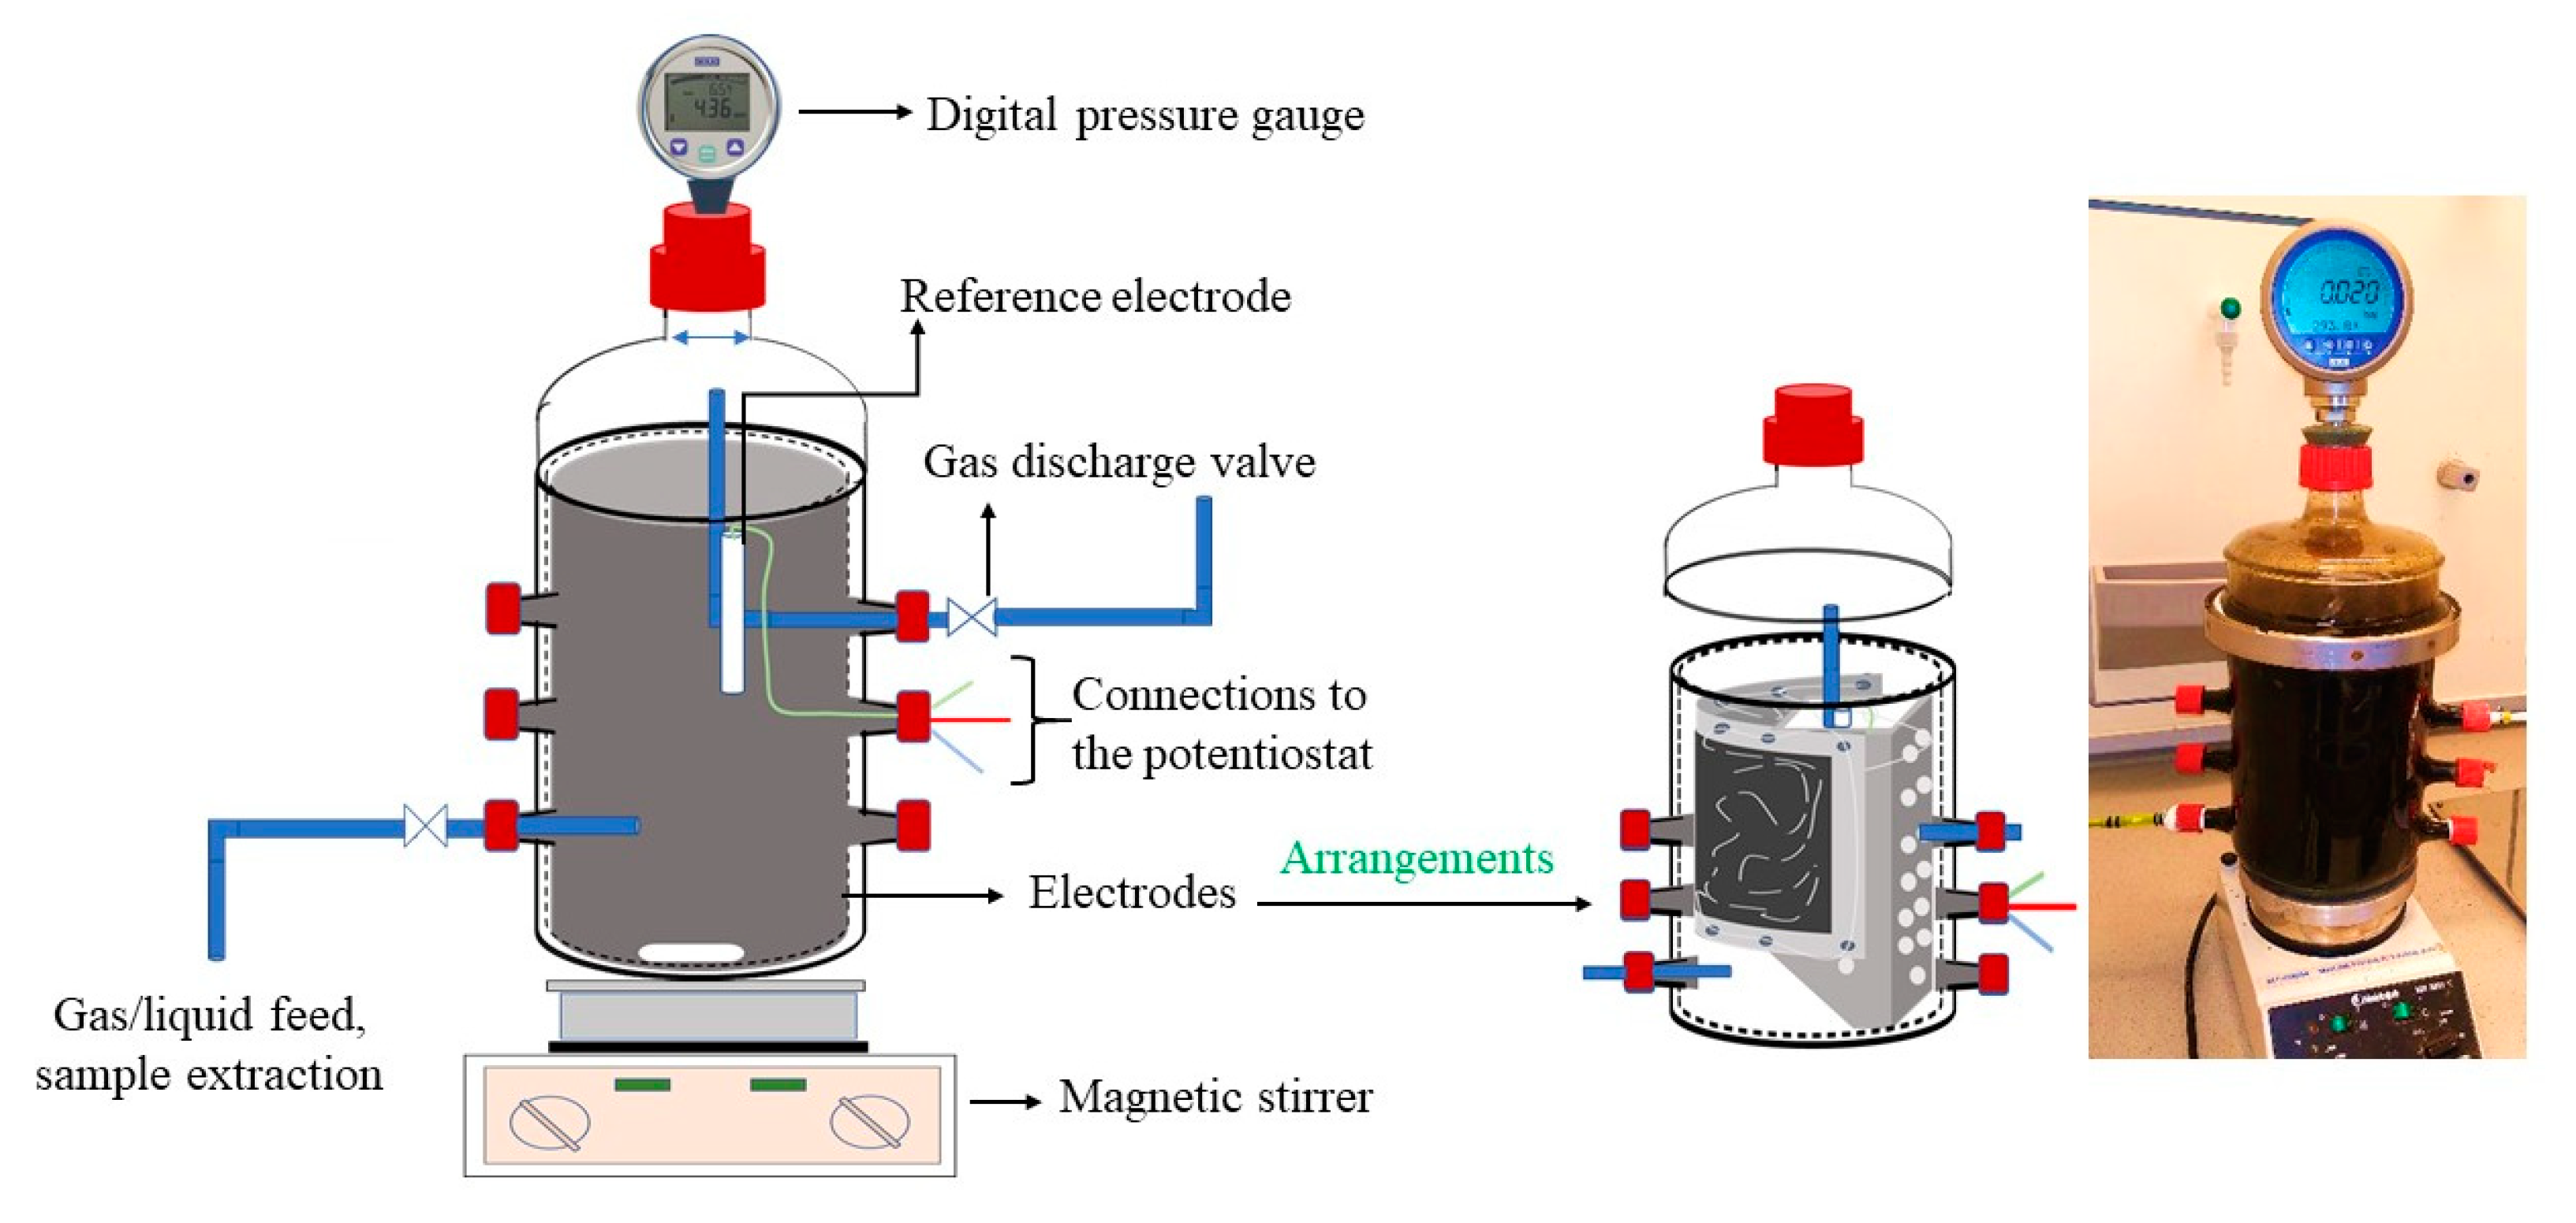
3.3. Electrode Design and Experimental Setup

The anode and cathode were designed based on the reactor’s volume to achieve the optimum surface area. Carbon felt (3.18 mm thickness, 99.0% 2.4 g/10 × 10 cm) from Alfa Aesar (GmbH, Kandel, Germany) was used as the cathode. The cathode was framed with a titanium sheet (1 cm) to keep it stable inside the reactor, and wrapped with titanium wire to enhance the electrical contact. A titanium metal sheet was used as the anode. It was modified to a particular shape to fit into the reactor and achieve more efficient agitation of the fermentation medium (Figure 5). The designs of the anode and cathode and an upper cross-sectional view of the reactor is presented in Figure 1. The surface area of anode and cathode were approximately 700 cm2. An Ag/AgCl electrode (3 M NaCl, QVMF2052, ProSense, BB Oosterhout, The Netherlands) was used as the reference electrode. A Gamry 1010B Potentiostat-Galvanostat-ZRA (Gamry Instruments, Philadelphia, PA, USA) was used to perform electrochemical measurements.

3.4. Phase 2: Open-Circuit Mode

The electrodes were installed into the same glass reactor used in Phase 1 (Figure 6), and the Phase 1 procedure with fresh inoculum was repeated until it reached the stable headspace pressure. During this phase, the electrodes were not poised with voltage, and the experiments were performed in OCM. During this phase, it took 90 days to for the gas consumption or saturated gas consumption to cease.

3.5. Phase 3: Closed-Circuit Mode

Once the saturated gas-consumption level was reached in Phase 2, it was prolonged in CCM. During CCM, the cathode was poised with −0.8 V vs. SHE by using a Gamry 1010B Potentiostat-Galvanostat-ZRA (Gamry Instruments, Philadelphia, PA, USA). This particular potential value was selected in accordance with similar studies performed by Nelabhotla et al. [16], during which they observed significant acetic acid production within the potential range of −0.8 to −0.9 V vs. SHE in a single-cell MES reactor.
We intended to pressurize the reactor with hydrogen gas during Phase 1 when the cathode was poised with −0.8 V. However, the reactor produced some gases (H2, CH4, and CO2) when the cathode was poised with voltage, so the hydrogen feeding was stopped. Since the glass rector had limited pressure tolerance, the gas that accumulated in the headspace was released when it approached 1 bar of pressure, and gas composition analyses were performed, along with measurements of volatile fatty acids (VFAs).

3.6. Analytical Measurements

The concentration of VFAs was measured using a Clarius 500 PE auto-system gas chromatograph integrated with a built-in autosampler (Perkin Elmer, Waltham, MA, USA). The instrument was equipped with a capillary column (scion-wax temperature 20–250 °C) and a flame ionization detector (FID). The dimensions of the column were 25 m length, 0.25 mm diameter, and 0.2 µm film. The carrier gas was H2 at a rate of 45 mL/min. The injector and detector temperatures were 270 and 250 °C, respectively. The initial oven temperature was set at 80 °C and maintained for 0.7 min, then was increased at a rate of 25 °C/min to 200 °C, followed by 20 °C increments until attaining an operating temperature of 240 °C.
The gas-composition analyses were performed using an 8610C gas chromatograph (SRI Instruments, Torrance, CA, USA) equipped with 6’ Haysep-D (MXT-1) and 6’ Molecular Sieve (MS13X) columns. The oven was operated at a constant 80 °C, with helium as the carrier gas at 2.1 bar pressure and a 20 mL/min flow rate. The thermal conductivity detector (TCD) was operated at 150 °C with helium and airflow rates of 25 and 250 mL/min, respectively.

4. Conclusions

The biofilm that formed on the electrodes facilitated an H2 gas dissociation three times higher than the reactor without electrode surface, resulting in 63% more acetic acid production. Our hypothesis that an increase in gas consumption would be realized by negatively poising −0.8 V at the cathode failed; instead, gas production was observed, with 90% of the gas in the form of hydrogen. The reduction in acetic acid concentration and the evolution of gaseous products occurred simultaneously, which suggested that hydrogen and CO2 products can be produced from acetic acid. As the findings of our study provided a good starting point toward integrating a successful syngas fermentation process into a single-cell AD-MES. The interface of MES and syngas fermentation could also be used to control product formation. Short-chain organic products can be obtained at a high rate due to the presence of densely packed biomass on the electrodes, and overproduced compounds can be oxidized as hydrogen gas to maintain target product concentration in the liquid medium.

Author Contributions

Conceptualization, C.D.; methodology, V.S. and C.D.; software, V.S., C.D., V.A., and O.B.; validation, V.S. and C.D.; formal analysis, V.S., C.D., V.A., and O.B.; investigation, V.S. and C.D.; resources, C.D.; data curation, V.S. and V.A.; writing—original draft preparation, V.S.; writing—review and editing, V.S. and C.D.; visualization, V.S.; supervision, C.D.; project administration, C.D.; funding acquisition, C.D. All authors have read and agreed to the published version of the manuscript.

Funding

This research was funded by the Norwegian Ministry of Education and Research through the Ph.D. program in Process, Energy and Automation Engineering at the University of South-Eastern Norway, grant number 2700095. The University of South-Eastern Norway funded the APC.

Acknowledgments

The authors wish to thank the Norwegian Ministry of Education and Research for funding.

Conflicts of Interest

The authors declare no conflict of interest.

References

  1. Solarte-Toro, J.C.; Chacón-Pérez, Y.; Cardona-Alzate, C.A. Evaluation of biogas and syngas as energy vectors for heat and power generation using lignocellulosic biomass as raw material. Electron. J. Biotechnol. 2018, 33, 52–62. [Google Scholar] [CrossRef]
  2. Phillips, J.R.; Huhnke, R.L.; Atiyeh, H.K. Syngas fermentation: A microbial conversion process of gaseous substrates to various products. Fermentation 2017, 3, 28. [Google Scholar] [CrossRef] [Green Version]
  3. Stoll, I.; Herbig, S.; Zwick, M.; Boukis, N.; Sauer, J.; Neumann, A.; Oswald, F. Fermentation of H2 and CO2 with clostridium ljungdahlii at elevated process pressure—First experimental results. Chem. Eng. Trans. 2018, 64, 151–156. [Google Scholar]
  4. Ganigué, R.; Puig, S.; Batlle-Vilanova, P.; Balaguer, M.D.; Colprim, J. Microbial electrosynthesis of butyrate from carbon dioxide. Chem. Commun. 2015, 51, 3235–3238. [Google Scholar] [CrossRef]
  5. Mohanakrishna, G.; Abu Reesh, I.M.; Vanbroekhoven, K.; Pant, D. Microbial electrosynthesis feasibility evaluation at high bicarbonate concentrations with enriched homoacetogenic biocathode. Sci. Total Environ. 2020, 715, 137003. [Google Scholar] [CrossRef] [PubMed]
  6. Rago, L.; Pant, D.; Schievano, A. Chapter 14—Electro-Fermentation—Microbial Electrochemistry as New Frontier in Biomass Refineries and Industrial Fermentations. In Advanced Bioprocessing for Alternative Fuels, Biobased Chemicals, and Bioproducts; Hosseini, M., Ed.; Woodhead Publishing: Cambridge, UK, 2019; pp. 265–287. ISBN 978-0-12-817941-3. [Google Scholar]
  7. Sivalingam, V.; Dinamarca, C.; Samarakoon, G.; Winkler, D.; Bakke, R. Ammonium as a carbon-free electron and proton source in microbial electrosynthesis processes. Sustainability 2020, 12, 3081. [Google Scholar] [CrossRef] [Green Version]
  8. Jiang, Y.; Jianxiong Zeng, R. Expanding the product spectrum of value added chemicals in microbial electrosynthesis through integrated process design—A review. Bioresour. Technol. 2018, 269, 503–512. [Google Scholar] [CrossRef] [PubMed]
  9. Nelabhotla, A.B.T.; Dinamarca, C. Bioelectrochemical CO2 reduction to methane: MES integration in biogas production processes. Appl. Sci. 2019, 9, 1056. [Google Scholar] [CrossRef] [Green Version]
  10. Nevin, K.P.; Hensley, S.A.; Franks, A.E.; Summers, Z.M.; Ou, J.; Woodard, T.L.; Snoeyenbos-West, O.L.; Lovley, D.R. Electrosynthesis of organic compounds from carbon dioxide is catalyzed by a diversity of acetogenic microorganisms. Appl. Environ. Microbiol. 2011, 77, 2882–2886. [Google Scholar] [CrossRef] [PubMed] [Green Version]
  11. Jiang, Y.; Su, M.; Zhang, Y.; Zhan, G.; Tao, Y.; Li, D. Bioelectrochemical systems for simultaneously production of methane and acetate from carbon dioxide at relatively high rate. Int. J. Hydrogen Energy 2013, 38, 3497–3502. [Google Scholar] [CrossRef]
  12. Lehtinen, T.; Efimova, E.; Tremblay, P.-L.; Santala, S.; Zhang, T.; Santala, V. Production of long chain alkyl esters from carbon dioxide and electricity by a two-stage bacterial process. Bioresour. Technol. 2017, 243, 30–36. [Google Scholar] [CrossRef] [PubMed] [Green Version]
  13. del Pilar Anzola Rojas, M.; Zaiat, M.; Gonzalez, E.R.; De Wever, H.; Pant, D. Effect of the electric supply interruption on a microbial electrosynthesis system converting inorganic carbon into acetate. Bioresour. Technol. 2018, 266, 203–210. [Google Scholar] [CrossRef] [PubMed]
  14. Batlle-Vilanova, P.; Puig, S.; Gonzalez-Olmos, R.; Balaguer, M.D.; Colprim, J. Continuous acetate production through microbial electrosynthesis from CO2 with microbial mixed culture. J. Chem. Technol. Biotechnol. 2016, 91, 921–927. [Google Scholar] [CrossRef]
  15. Nelabhotla, A.B.T.; Khoshbakhtian, M.; Chopra, N.; Dinamarca, C. Effect of hydraulic retention time on MES operation for biomethane production. Front. Energy Res. 2020, 8. [Google Scholar] [CrossRef]
  16. Nelabhotla, A.B.T.; Bakke, R.; Dinamarca, C. Performance analysis of biocathode in bioelectrochemical CO2 reduction. Catalysts 2019, 9, 683. [Google Scholar] [CrossRef] [Green Version]
  17. Nelabhotla, A.B.T. Electrochemical Unit Integration with Biogas Production Processes. Ph.D. Thesis, University of South-Eastern Norway, Porsgrunn, Norway, 2020. [Google Scholar]
  18. Bian, B.; Bajracharya, S.; Xu, J.; Pant, D.; Saikaly, P.E. Microbial electrosynthesis from CO2: Challenges, opportunities and perspectives in the context of circular bioeconomy. Bioresour. Technol. 2020, 122863. [Google Scholar] [CrossRef] [PubMed] [Green Version]
  19. Dinamarca, C.; Bakke, R. Apparent hydrogen consumption in acid reactors: Observations and implications. Water Sci. Technol. J. Int. Assoc. Water Pollut. Res. 2009, 59, 1441–1447. [Google Scholar] [CrossRef] [PubMed]
Figure 1. (a) The Phase 1 headspace pressure time series; (b) the Phase 2 headspace pressure time series and OCM at the cathode vs. the reference electrode (Ag/AgCl, 3 M NaCl).
Catalysts 11 00040 g001
Figure 2. The cumulative hydrogen-consumption profiles for Phases 1 and 2.
Catalysts 11 00040 g002
Figure 3. (a) The gas composition and the current variation during Phase 3. (b) The fermentation-product formation throughout Phases 2 and 3 (separated by a red vertical line).
Catalysts 11 00040 g003
Figure 4. Integrated anaerobic digestion, syngas fermentation, and BES.
Catalysts 11 00040 g004
Figure 5. An upper cross-section of the reactor with electrode arrangements and electrode design with dimensions. (a) The upper cross-section, (b) the cathode, and (c) the anode.
Catalysts 11 00040 g005
Figure 6. A sketch of the designed reactor (left), the anode and cathode arrangements within the reactor (center), and the complete reactor setup (right).
Catalysts 11 00040 g006
Table 1. The comparison of essential results for Phases 1 and 2.
MeasuresPhase 1Phase 2
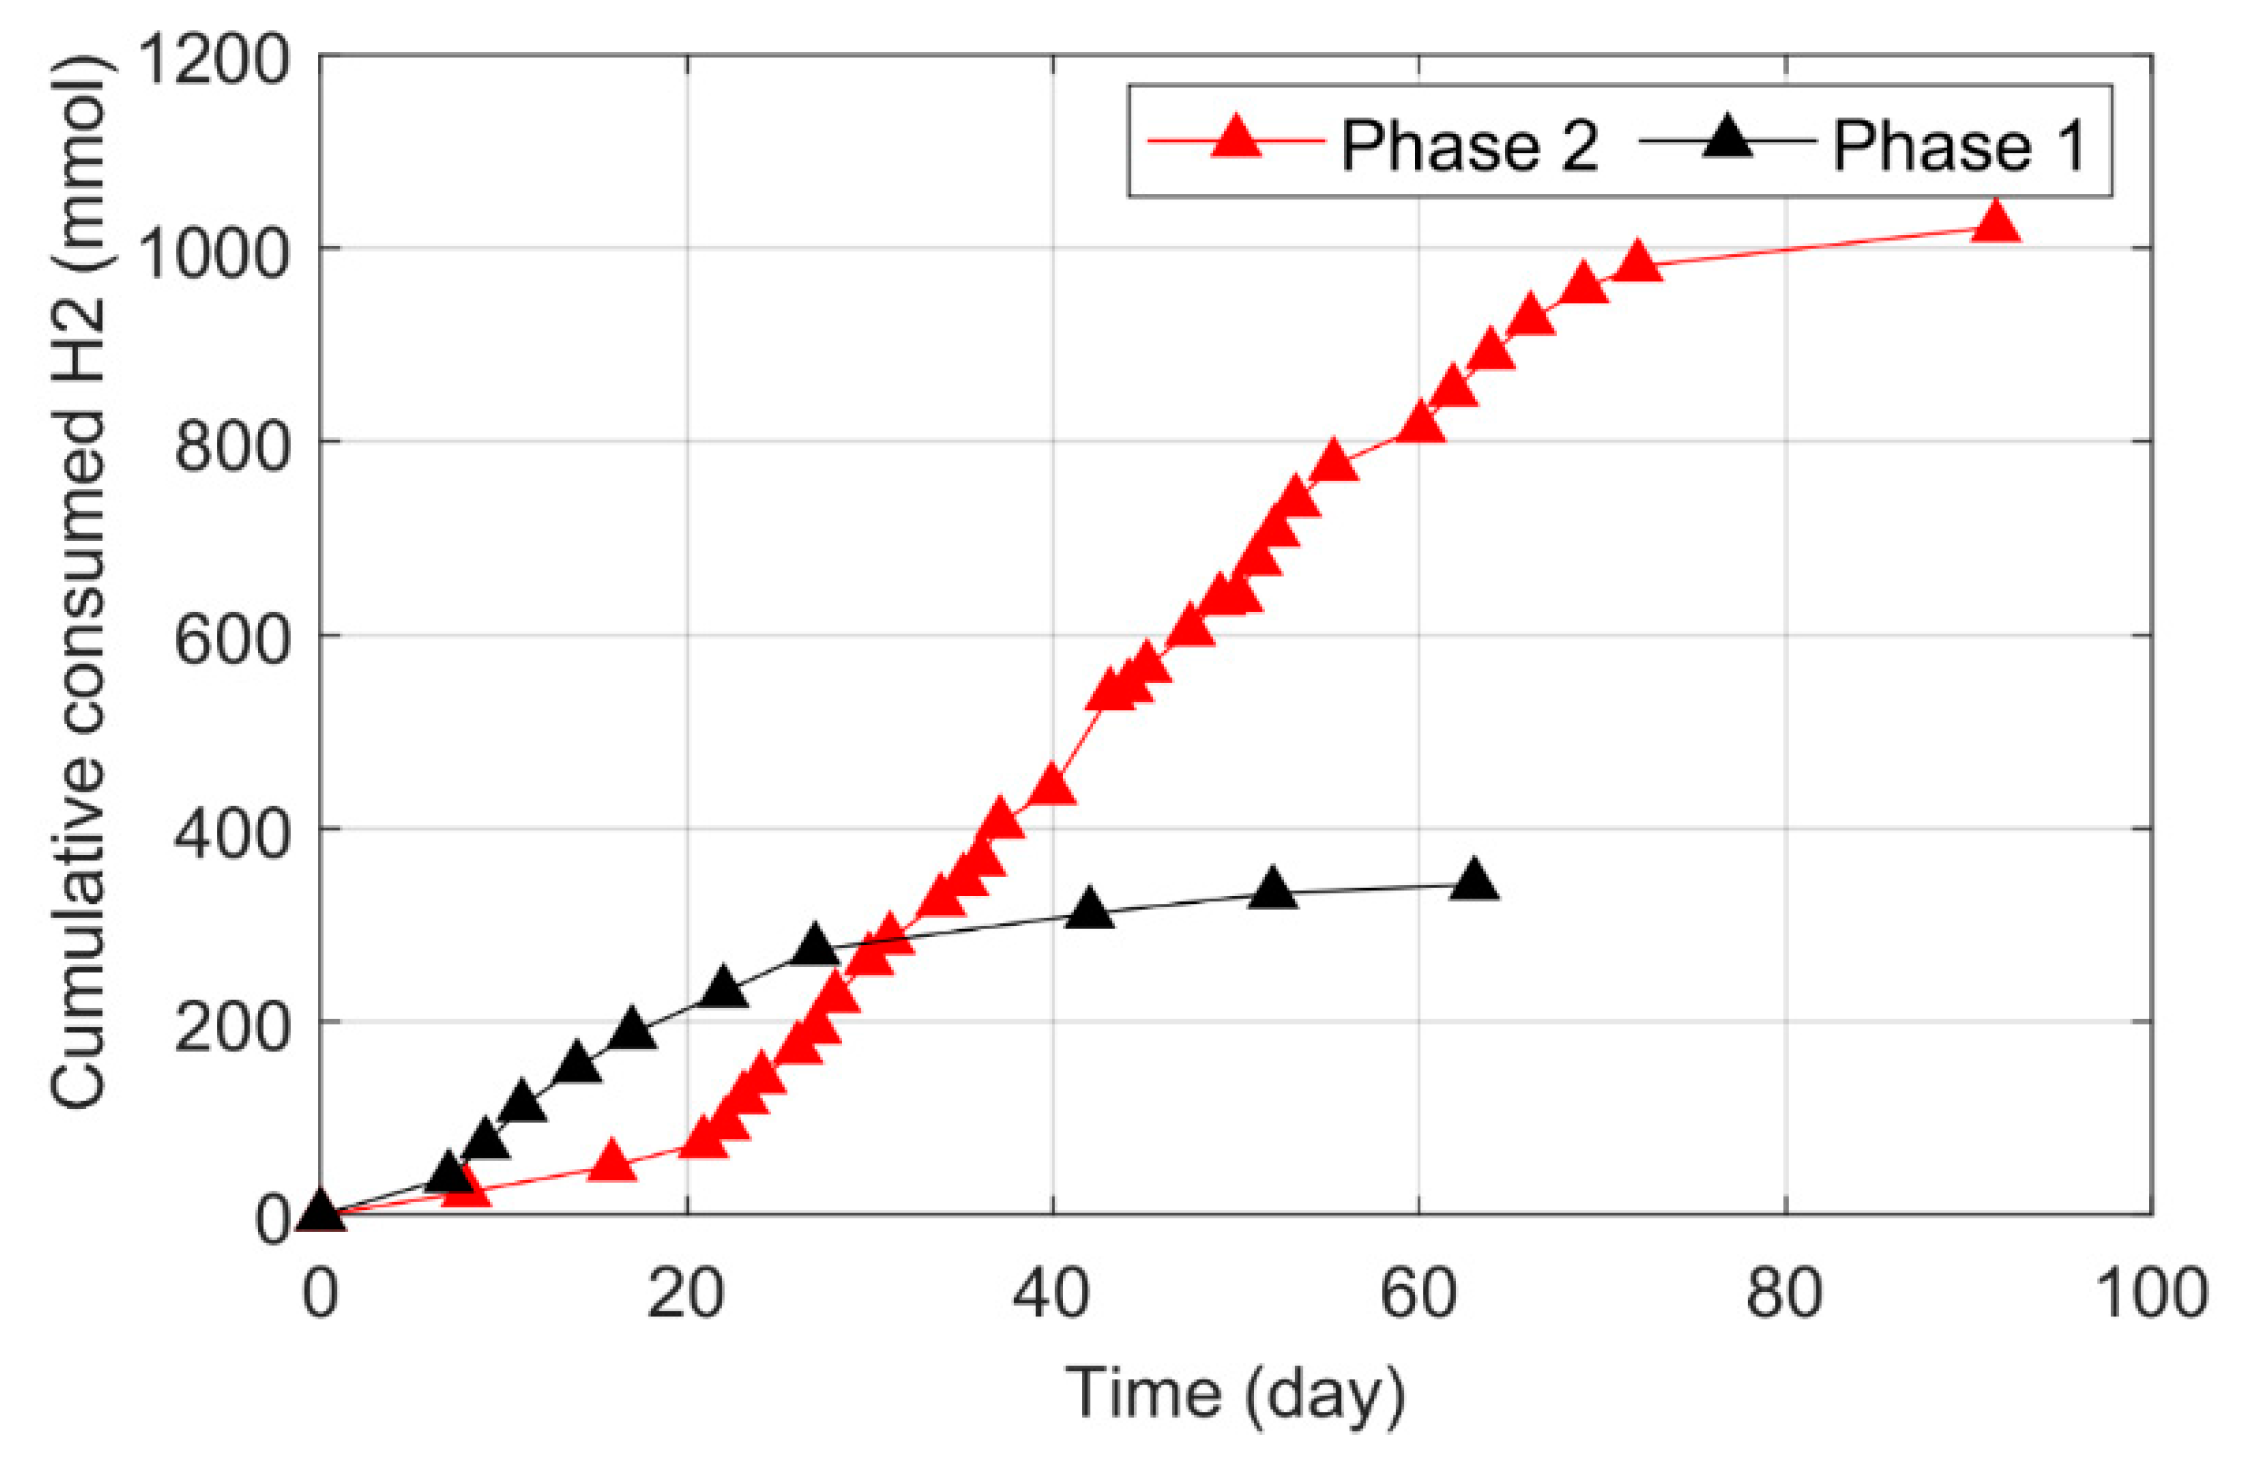
Highest achieved gas uptake rate (mmol/L·day)613.5
Time to reach the highest gas uptake rate (day)1143
Total consumed H2 (mmol)3421021
Time to reach the saturated gas consumption level (day)6090
Highest acetic acid concentration (mmol/L)3557
Acetic acid content in total VFAs (%)8085
Table 2. The content of the nutrient base media used to support the growth of the homoacetogenic culture.
Vitamin Solution (g/L)Mineral Solution (g/L)Salt Solution (g/L)
Biotin: 0.02MnSO4·H2O: 0.04NH4Cl: 100
Folic acid: 0.02FeSO4·7H2O: 2.7NaCl: 10
Pyridoxine hydrochloride: 0.1CuSO4·5H2O: 0.055MgCl2·6H2O: 10
Riboflavin: 0.05NiCl2·6H2O: 0.1CaCl2·2H2O: 5
Thiamine: 0.05ZnSO4·7H2O: 0.088-
Nicotinic acid: 0.05CoCl2·6H2O: 0.05-
Pantothenic acid: 0.05H3BO3: 0.05-
Vitamin B12: 0.001--
p-aminobenzoic acid: 0.05--
Thioctic acid: 0.05--
Publisher’s Note: MDPI stays neutral with regard to jurisdictional claims in published maps and institutional affiliations.

