Article

Ordered Mesoporous Carbon as a Support for Palladium-Based Hydrodechlorination Catalysts

1
School of Chemistry, University of St Andrews, North Haugh, St Andrews, Fife KY16 9ST, UK
2
Departamento de Ingeniería Química, Facultad de Ciencias, Universidad Autónoma de Madrid, Cantoblanco, 28049 Madrid, Spain
*
Author to whom correspondence should be addressed.
Catalysts 2021, 11(1), 23; https://doi.org/10.3390/catal11010023
Submission received: 28 October 2020 / Revised: 21 December 2020 / Accepted: 23 December 2020 / Published: 28 December 2020
(This article belongs to the Special Issue Progress in Catalytic Hydrodechlorination)

Abstract

:
Ordered mesoporous carbon (OMC) was employed as a support for palladium nanoparticles in catalysts for the gas phase hydrodechlorination (HDC) of trichloromethane (TCM). 1 wt% palladium was incorporated using three methods: incipient wetness (IW); a dilute solution (DS) method; and a solid-liquid (SL) method. The effect of the preparation method on catalyst structure and activity was investigated. Catalyst composition and nanostructure were studied using gas physisorption, high specification transmission electron microscopy and X-ray photoelectron spectroscopy. Catalytic conversion and product selectivities were determined in steady-state activity tests at temperatures between 70 and 300 °C. Two of the catalysts (IW and DS) showed excellent dispersion of fine Pd nanoparticles of average diameter ~2 nm. These materials showed excellent activity for HDC of TCM which compares favourably with the performance reported for Pd on amorphous carbon catalysts. In addition, they showed relatively high selectivities to the more valuable higher hydrocarbons. However, the SL method gave rise to catalysts with larger particles (~3 nm) and a less uniform palladium distribution. This resulted in lower conversion and lower selectivities to higher hydrocarbons and in more severe catalyst deactivation at the highest reaction temperatures.

1. Introduction

Trichloromethane (TCM), commonly known as chloroform, like many other chlorinated hydrocarbons, is a highly toxic and carcinogenic pollutant. Its emission into the atmosphere contributes to photochemical smog, ozone depletion and global warming [1,2,3,4]. Despite all of this, it is extensively used in industry, especially as a solvent and for cleaning, and as a result, it is one of the most common chlorinated compounds in residual gas streams, presenting a widespread and serious environmental threat. Among the methods for its removal, gas-phase catalytic hydrodechlorination (HDC) has been a subject of growing interest due to its economic and environmental advantages over other techniques [4,5]. HDC of chlorinated compounds has been reported using catalysts consisting of several precious metals supported on porous supports [4,6]. Supported Pd catalysts were found to show the highest activity in the complete HDC of chloromethanes [6]. The support material has a strong influence on the activity, selectivity and especially deactivation of these catalysts [7]. Supports, such as Al2O3, AlF3, SiO2, MgO, ZrO2 and TiO2, can be attacked by the HCl produced during HDC resulting in an increase of surface acidity and a decrease in surface area, which would worsen the effects of both HCl poisoning and coke deposition [7,8,9,10,11]. High surface area activated carbon is highly stable under acidic or alkaline conditions and is, therefore, commonly used as the catalyst support [12]. Previous studies have reported the use of Pd/C catalysts in the HDC of TCM and these catalysts were found to be unaffected by HCl under test conditions [4,5,6,7]. The drawback of using activated carbon is its irregular shaped micropores and broad pore size distribution. In addition, these textural properties vary considerably depending on the original source of the material, which is often biological [12]. Ordered mesoporous carbon had a much more uniform and well-defined pore structure which could favour high dispersion of the metal nanoparticles within the pores and also decrease the sintering of these particles by holding them in separate pores, so making particle coalescence less probable. OMCs may therefore be good alternative supports and may show better catalytic behaviour during HDC experiments.
The synthesis of ordered mesoporous carbon (OMC) was first reported by Rayoo et al. in 1999 by nanocasting using mesoporous silica MCM-48 as the hard template [13]. Although this method produced highly ordered mesoporous materials, its high cost and multistep nature was not practical for industrial-scale production and stimulated the search for other ways to synthesize OMC materials [14]. Using a soft templating method highly ordered mesoporous carbon materials have been produced using different routes, such as evaporation induced self-assembly (EISA) [15], an aqueous route [16] and phase separation [17]. Among these routes, the phase separation-or two-phase method-was found to be more simple, practicable and scalable [14]. Recently, some of us have reported a metal- and halogen-free synthesis of OMCs with a two-dimensional hexagonal arrangement of cylindrical pores using a two-phase method [18]. In the present study we used OMCs prepared using this method as catalyst supports for HDC of TCM. The absence of metals in the preparation method has the advantage of avoiding the risk of retention of these species which can act as catalyst poisons in the final product. Pd at a loading of 1 wt% was employed as the active phase and three different methods were studied for its incorporation into the mesoporous support: incipient wetness, dilute solution and solid-liquid methods. Textural and compositional information was obtained by gas physisorption, X-ray Photoelectron Spectroscopy (XPS) and Transmission Electron Microscopy and this was related to the catalytic activity of the samples for HDC of TCM. The effects of preparation method on the nanostructure and composition of the catalysts and, in turn, on their catalytic activity and product selectivity, were investigated.

2. Results and Discussion

2.1. Characterisation of Catalysts

Figure 1 shows the N2 adsorption-desorption isotherms recorded at −196 °C and the pore size distribution plots obtained from these for all three fresh Pd/C catalysts. It can be seen that all catalysts show Type IV isotherms, which, according to the IUPAC classification system, are characteristic of mesoporous materials, and Type H1 hysteresis loops, that indicate the presence of cylindrical mesopores. The pore size distributions in Figure 1b show that pores were uniform in size in all samples and very similar across the three materials. The plots in Figure 1b are very similar to those obtained for the corresponding bare OMC templates given in Figure S1 in Supplementary Information. In all cases, the quantity adsorbed in the desorption branch does not return completely to the initial value at low relative pressure. This phenomenon is ascribed to some small expansion and contraction of these materials, which can be considered to be polymeric, during the physisorption experiment [18]. The specific surface area (SSA), pore volume (Vp), micropore volume (Vmicro) and pore diameter (DP) of these catalysts, obtained from the isotherm and the pore size distribution plots, are given in Table 1. All three catalysts showed high and similar surface area values of around 550 m2·g−1. These SSA values are slightly lower than those obtained in this previous work in which the same synthesis procedure of OMCs was followed, indicating some influence of the impregnation processes on SSA [18]. Textural data for the OMC templates used to make these catalysts is presented in Table S1, Supplementary Information, and it can be seen that the impregnation procedures had little effect on the porosity of the final catalysts.
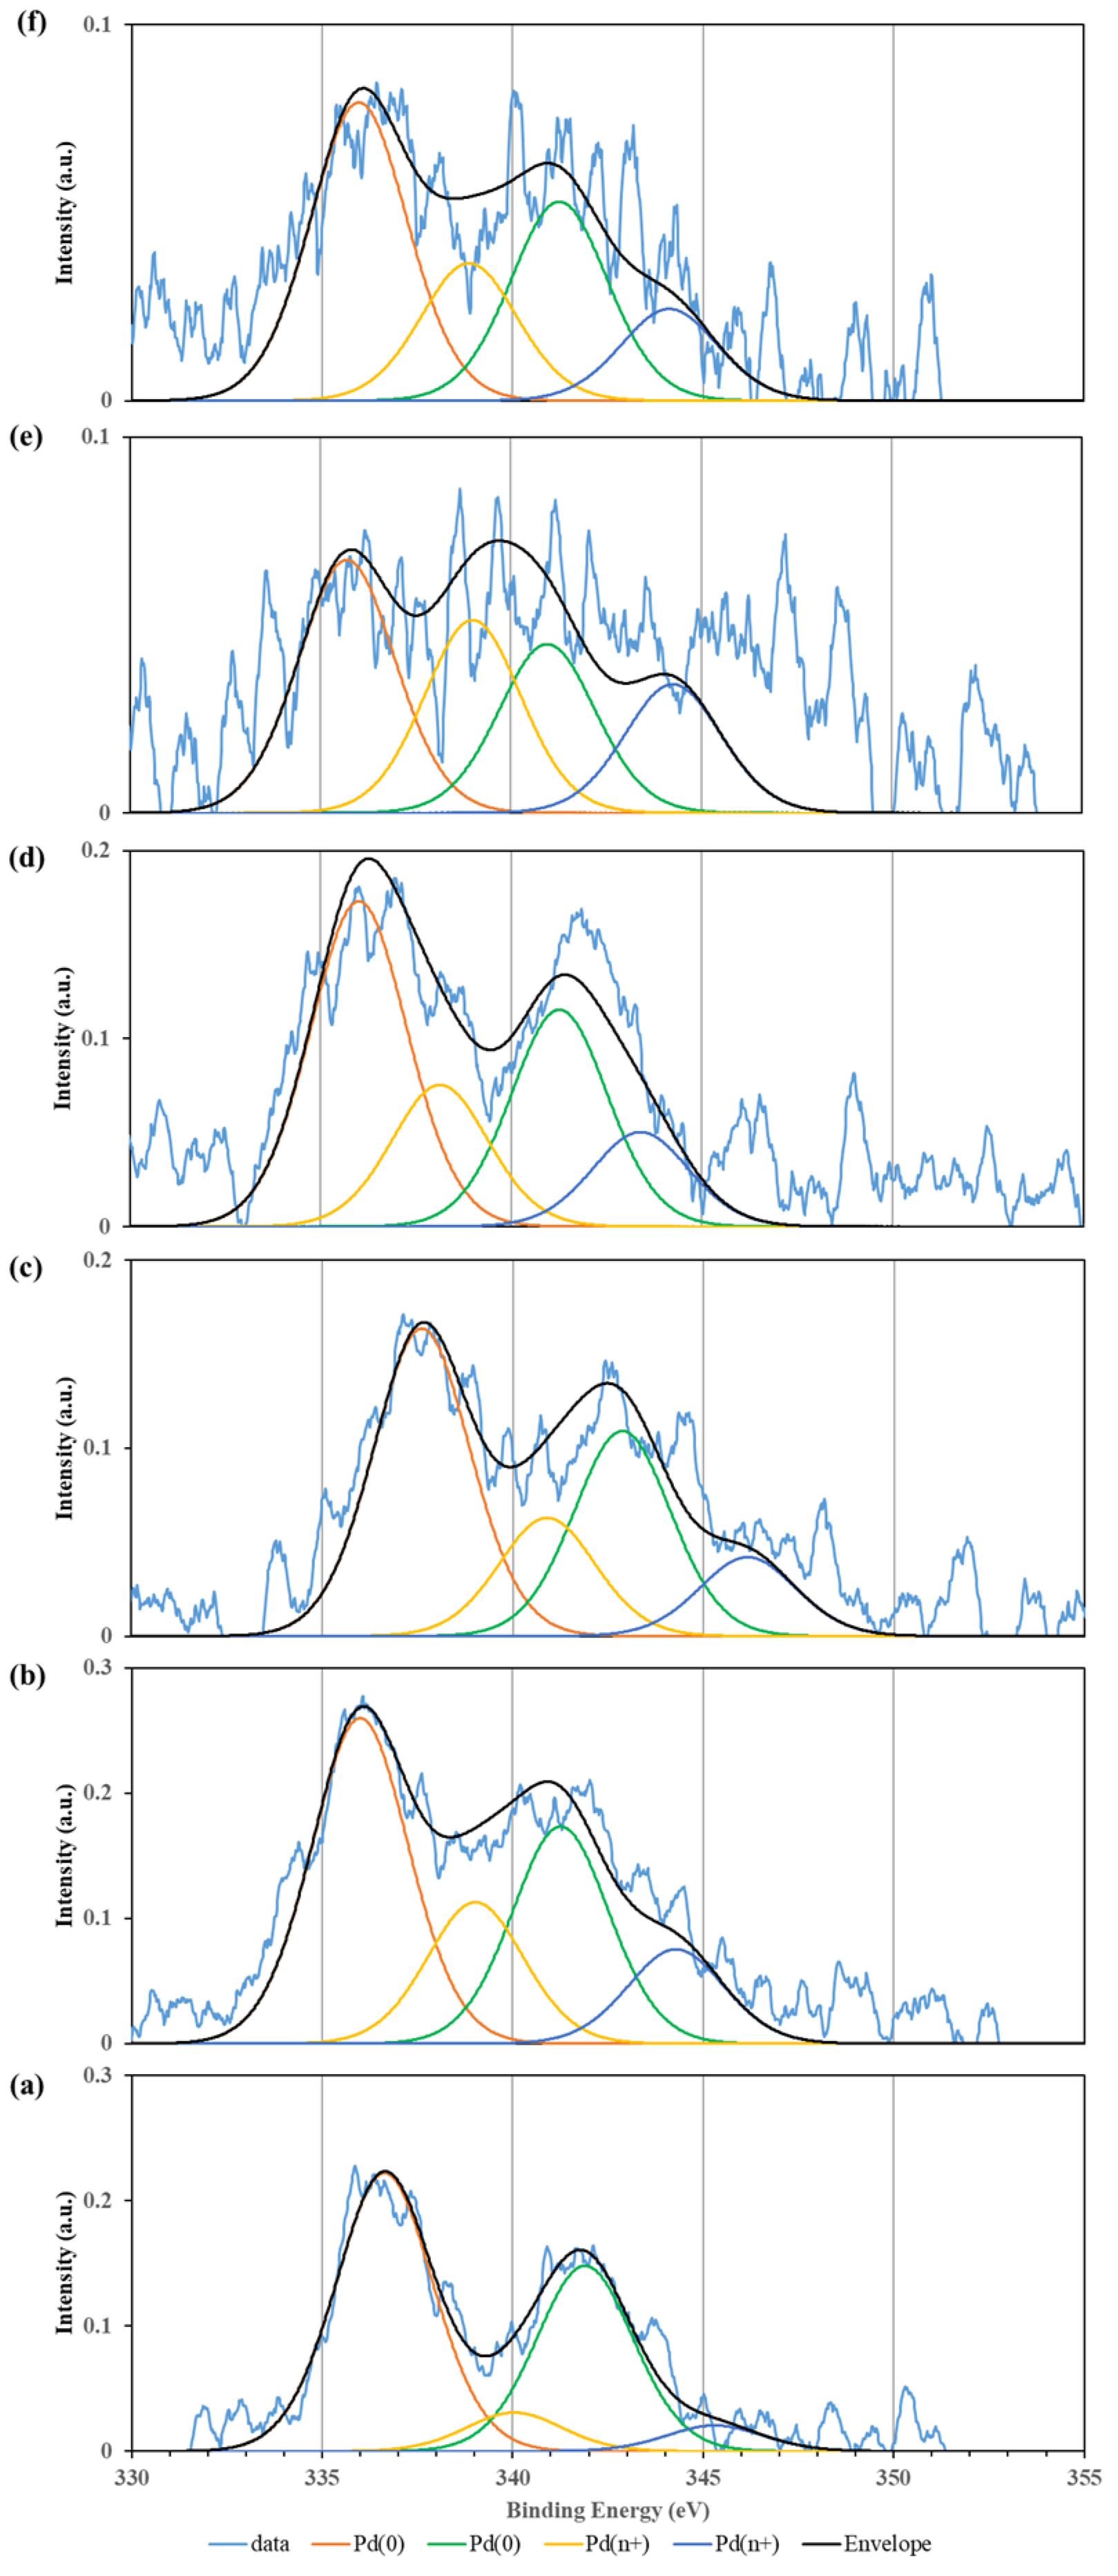
The surface concentrations of carbon, oxygen and palladium, and the oxidation state of palladium at the surface, were analysed by XPS. No N or Cl was detected in the XPS survey scans of any of the fresh, reduced or used catalyst samples. Deconvoluted Pd3d XPS spectra of the three fresh reduced and used catalysts are presented in Figure 2. The Pd3d region presents a doublet that corresponds to Pd5/2 and Pd3/2, separated by 5.3 eV, caused by spin-orbital splitting [19]. Two Pd5/2 peaks are observed in Figure 2, one at approximately 336.0 eV, which can be assigned to metallic palladium (Pd0), and another at about 338.0 eV, corresponding to electrodeficient-palladium (Pdn+) [20]. Table 2 summarizes the mass surface concentrations of C, O and Pd and the Pd0/Pdn+ ratios of the fresh reduced and used catalysts. The surface concentrations of carbon and oxygen are remarkably similar for all catalysts, both fresh and used. The high concentration of oxygen suggests that many hydroxide, carbonyl and ether groups persist on the surface of the support, which was prepared at 400 °C. This is in agreement with previous work in which significant loss of surface functional groups occurred only after heating the OMC at 600 °C and above [18]. All the catalysts showed somewhat higher Pd surface concentrations than the theoretical bulk value (1% wt), which suggests a small degree of preferential deposition of Pd particles on the external surface of the OMC support, especially in the case of the IW-Pd and DS-Pd samples. The values of the Pd0/Pdn+ ratio of the fresh catalysts follows the order IW-Pd > DS-Pd > SL-Pd, which highlights the strong influence of the deposition method on the oxidation state of the active phase. After the HDC reaction, the IW-Pd and DS-Pd catalysts showed an increased contribution of Pdn+, which was more marked for the IW-Pd catalyst. On the contrary, SL-Pd showed a decrease in the contribution of Pdn+ after use in the HDC reaction. The three used catalysts showed similar Pd0/Pdn+ ratios (≈2.30), which suggests that under reaction conditions there is sufficient time for the surface Pd to reach some redox steady state which is common across all three catalysts. After reaction, besides the changes in the Pd0/Pdn+ ratio, only small changes in the amount of surface palladium were observed in IW-Pd and DS-Pd but there was a more significant drop for SL-Pd, suggesting either some migration of the Pd particles into the support, or partial coverage or sintering of the Pd particles, during the HDC reaction.
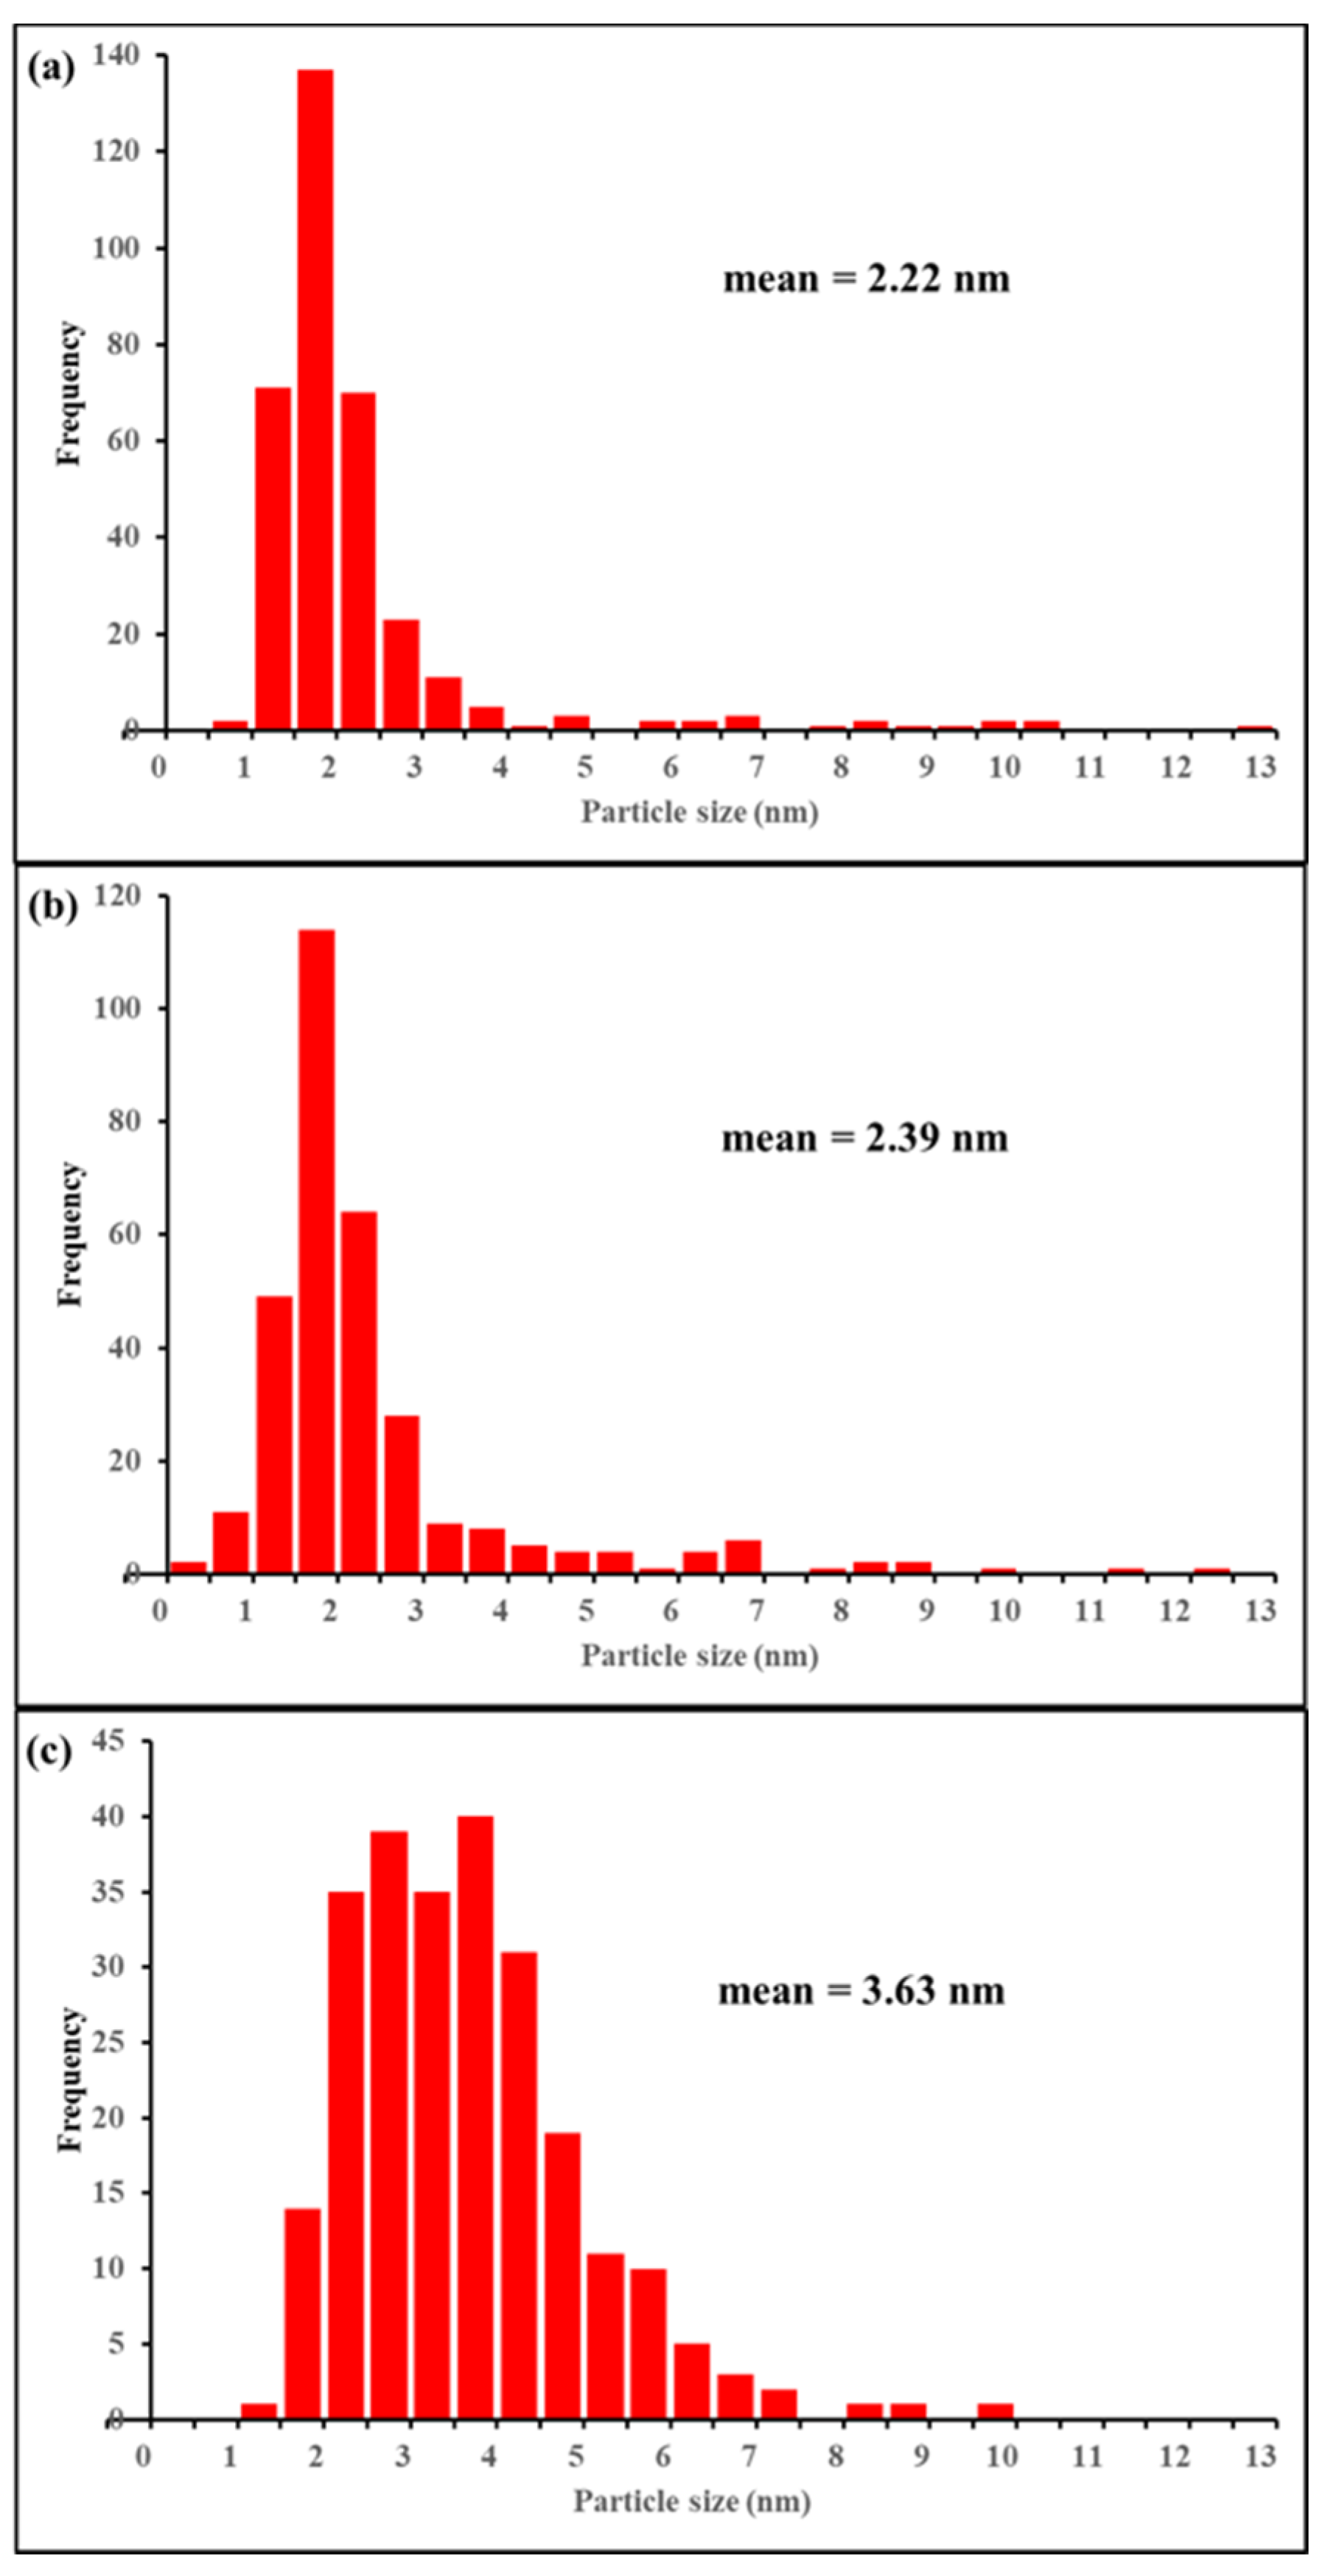
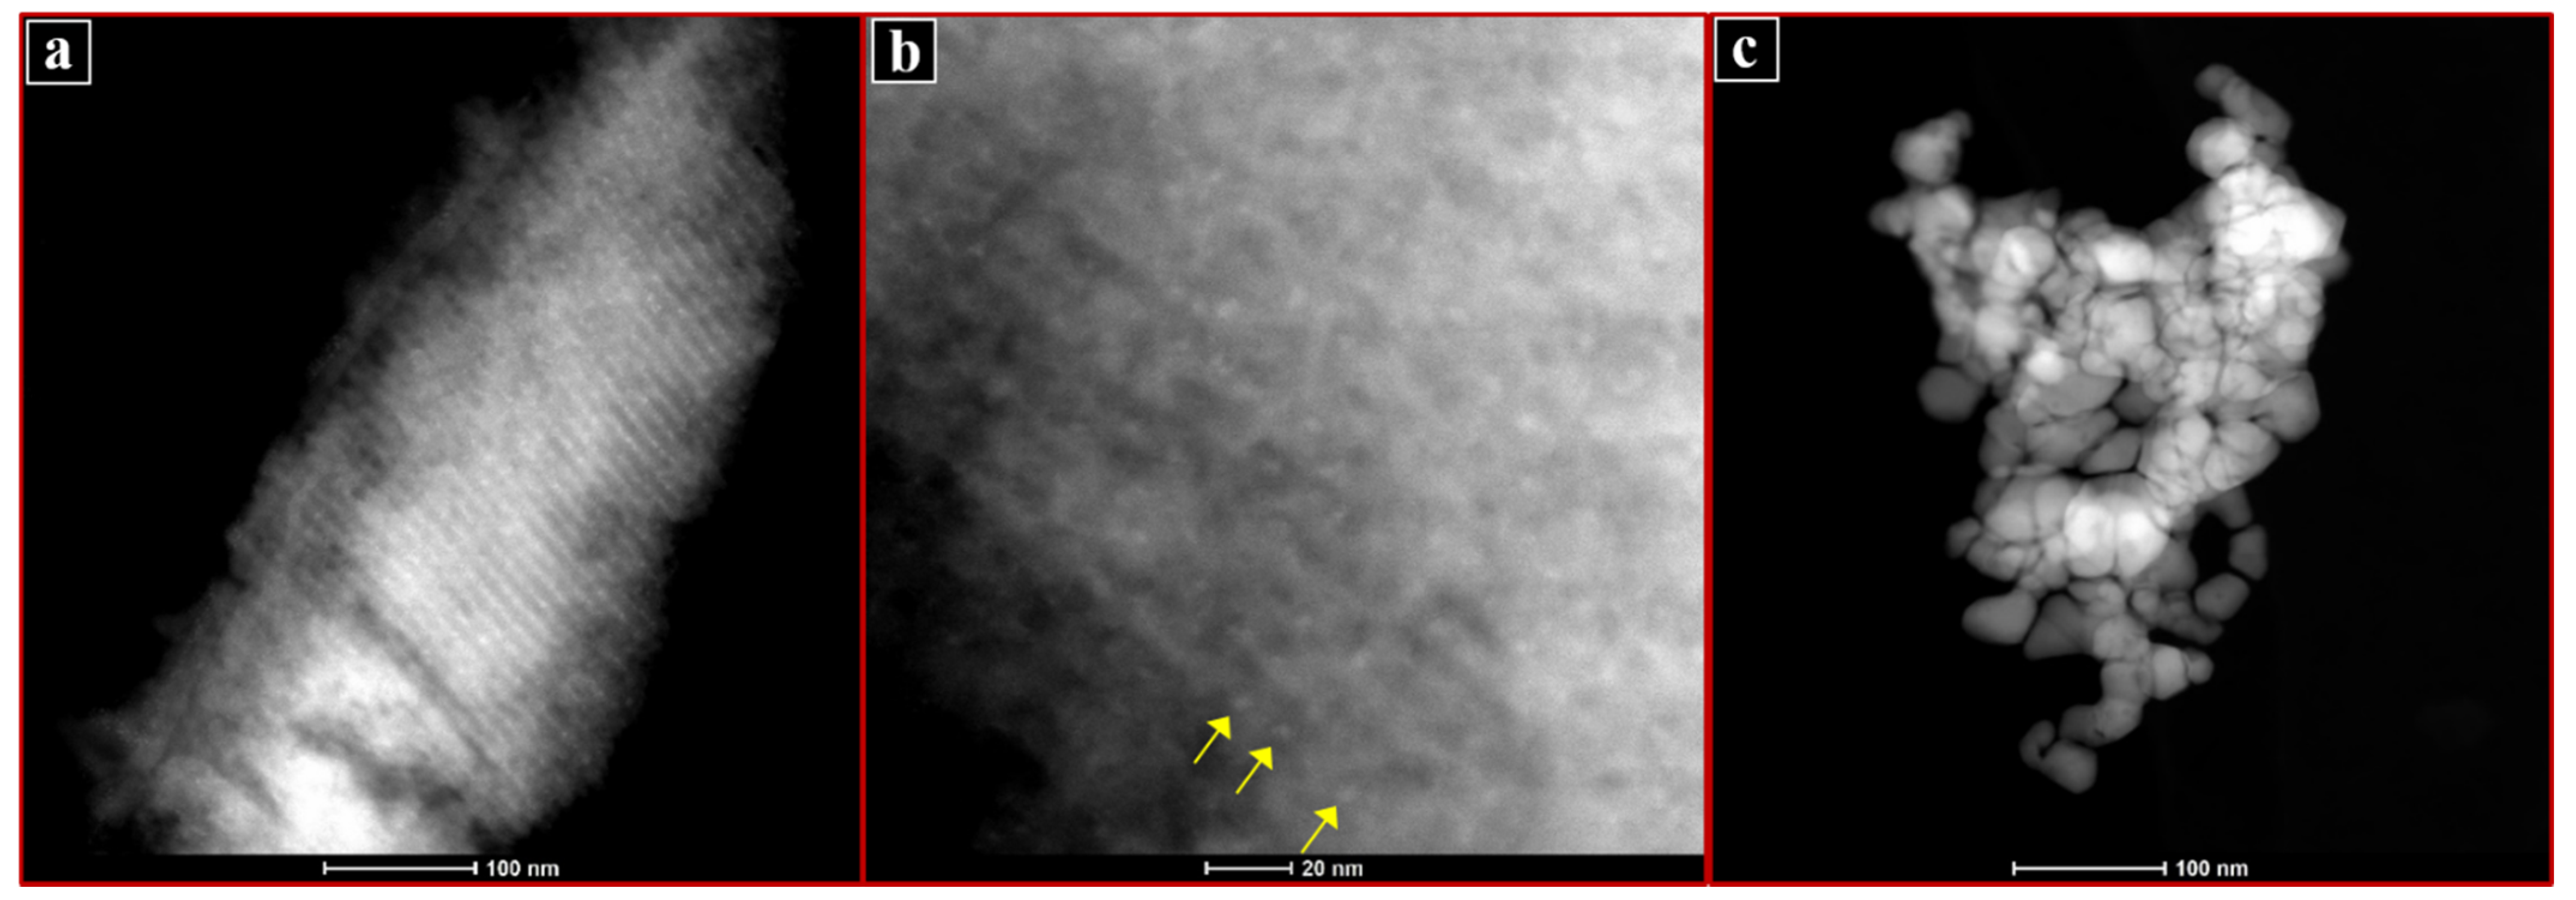
Electron microscopy results for the catalyst samples after they had been used in the HDC tests are presented in Figure 3, Figure 4, Figure 5, Figure 6, Figure 7 and Figure 8. Particle size distribution histograms obtained by measuring ~300 particles for each of the three used catalysts are given together in Figure 3. For clarity, the few large Pd particles and Pd agglomerations (see below) external to the mesopore support which were seen in some images are not included in these histograms. In all three samples, Pd is present in the form of very small, roughly spherical nanoparticles. In each case, nearly all particles are smaller than the diameter of the mesopores (~7 nm) of the OMC support, which is consistent with their residing within these pores rather than being simply on the external surface. The nanoparticles are particularly small in the IW-Pd and DS-Pd catalysts, and noticeably larger in SL-Pd, having mean particle sizes of 2.2, 2.4 and 3.6 nm, respectively. All three distributions are bimodal, with a small second peak or shoulder at around 7 nm.
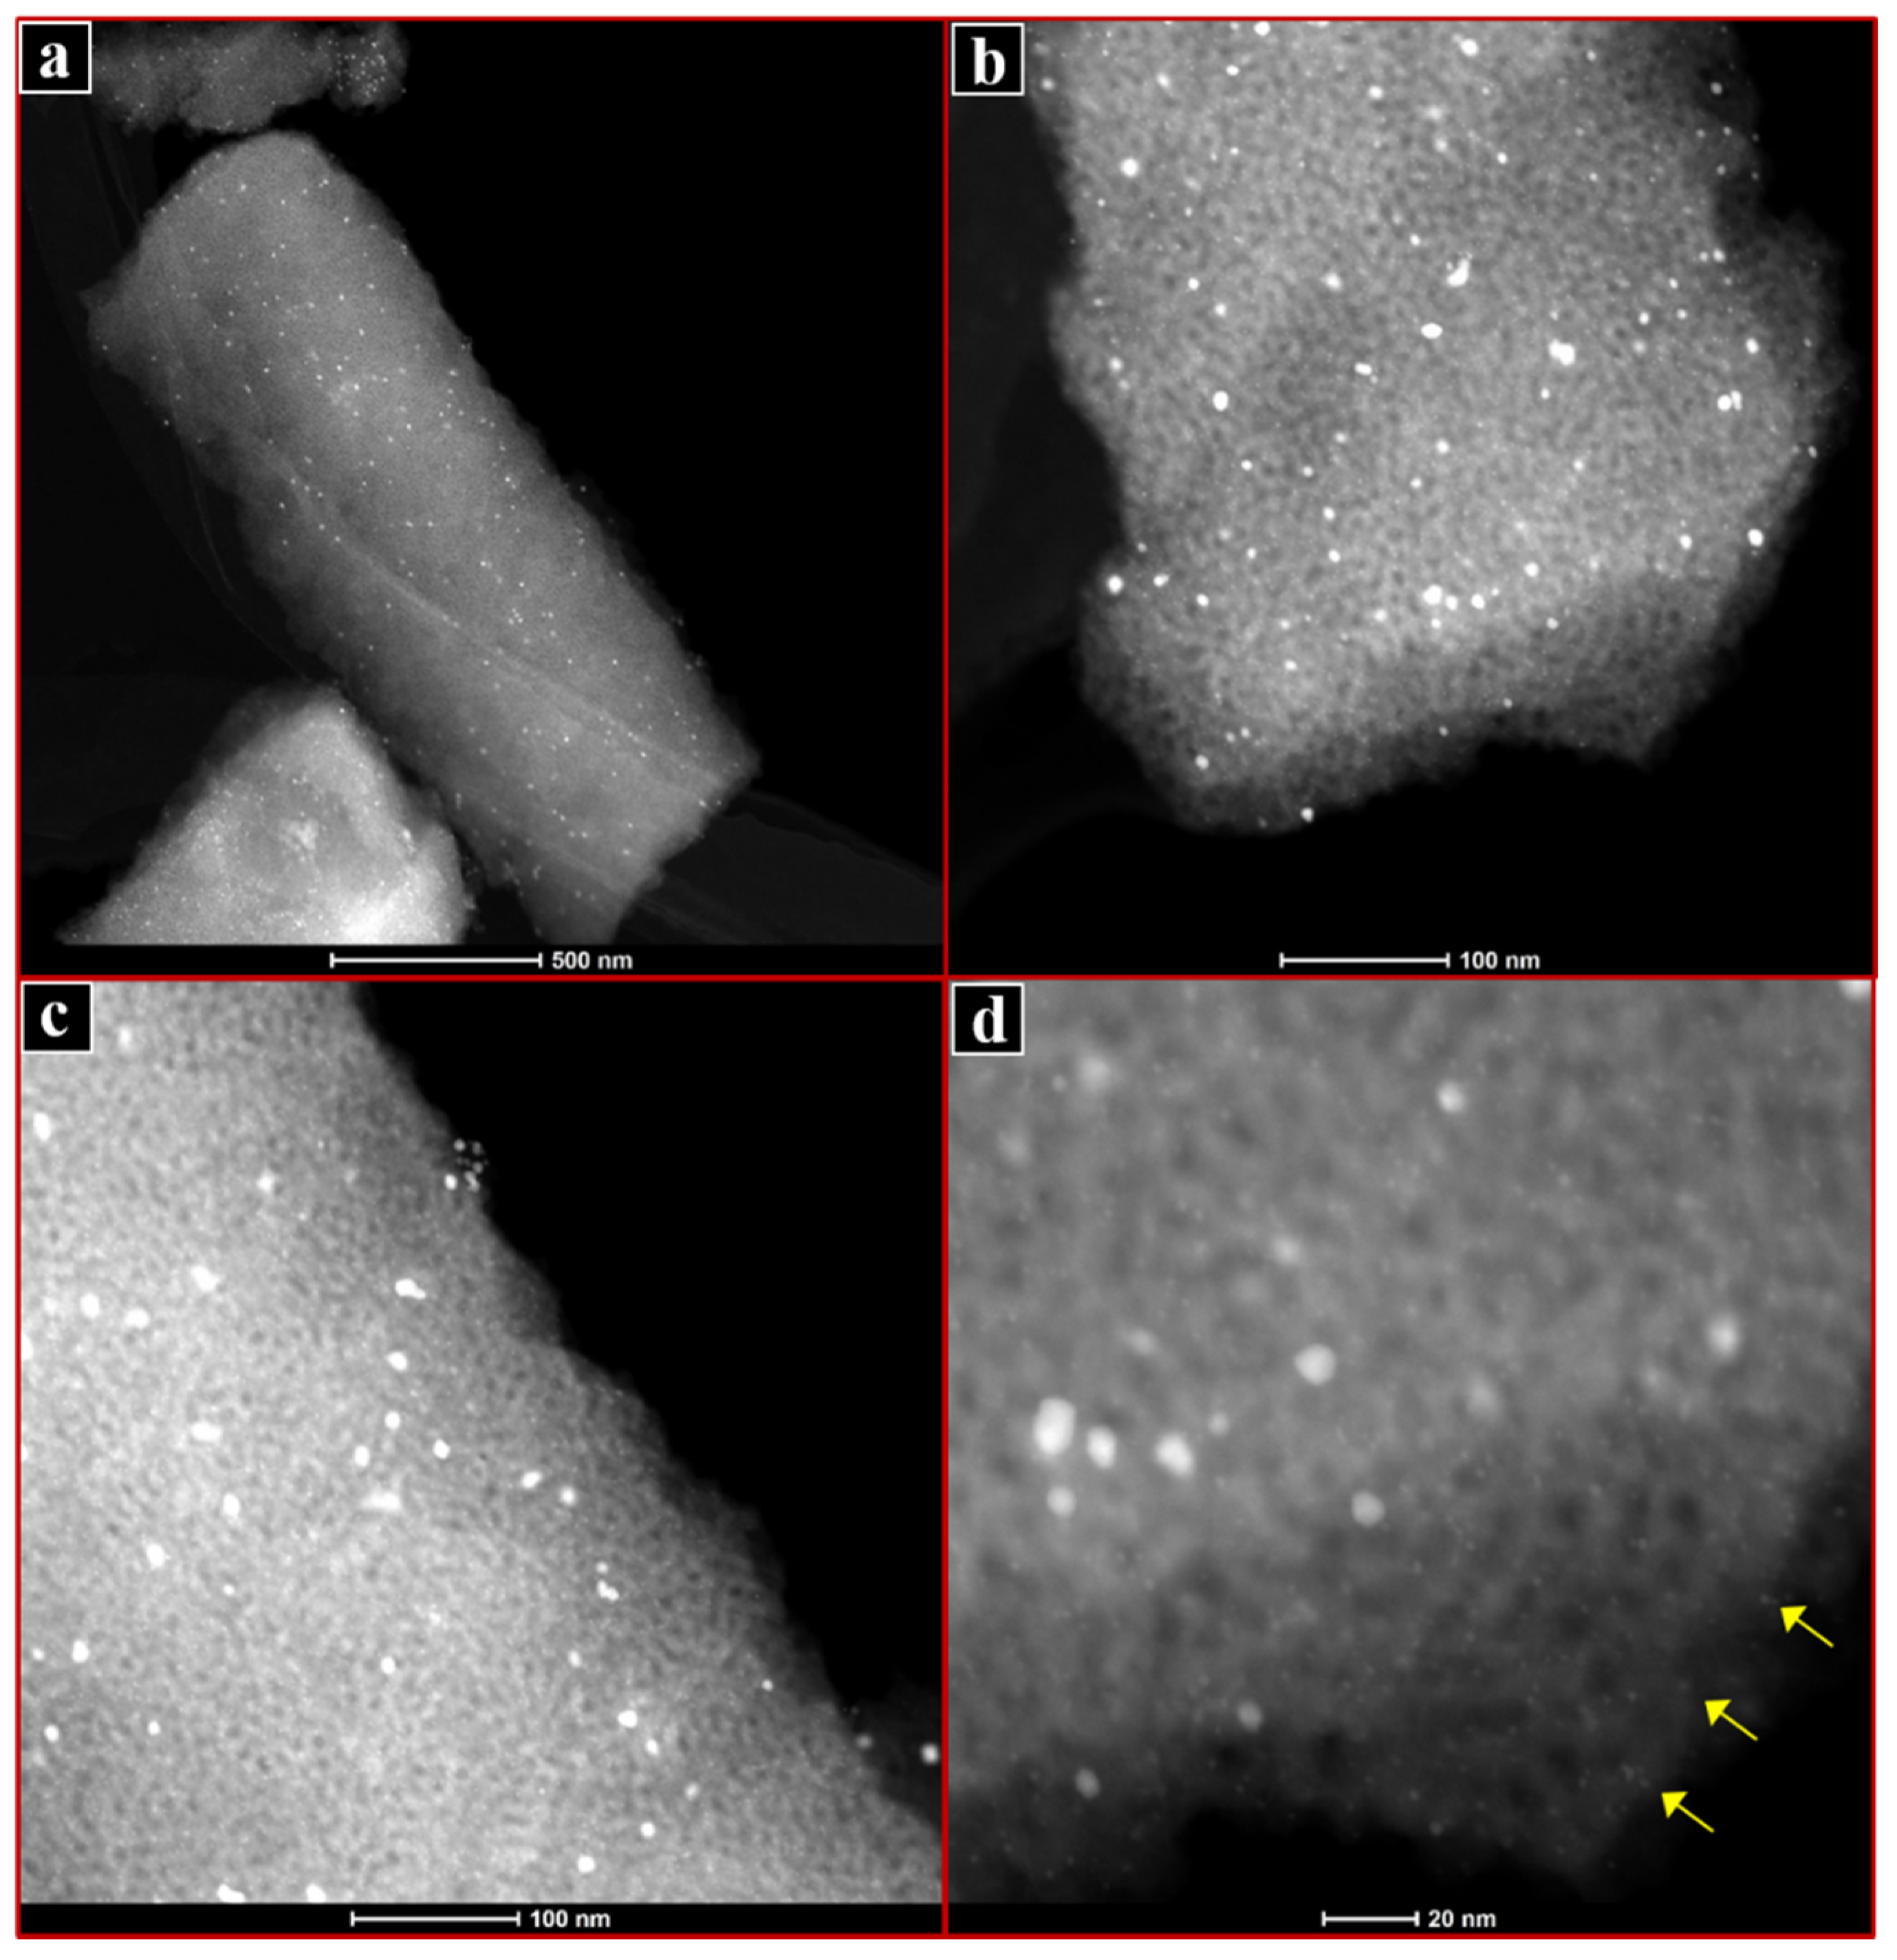
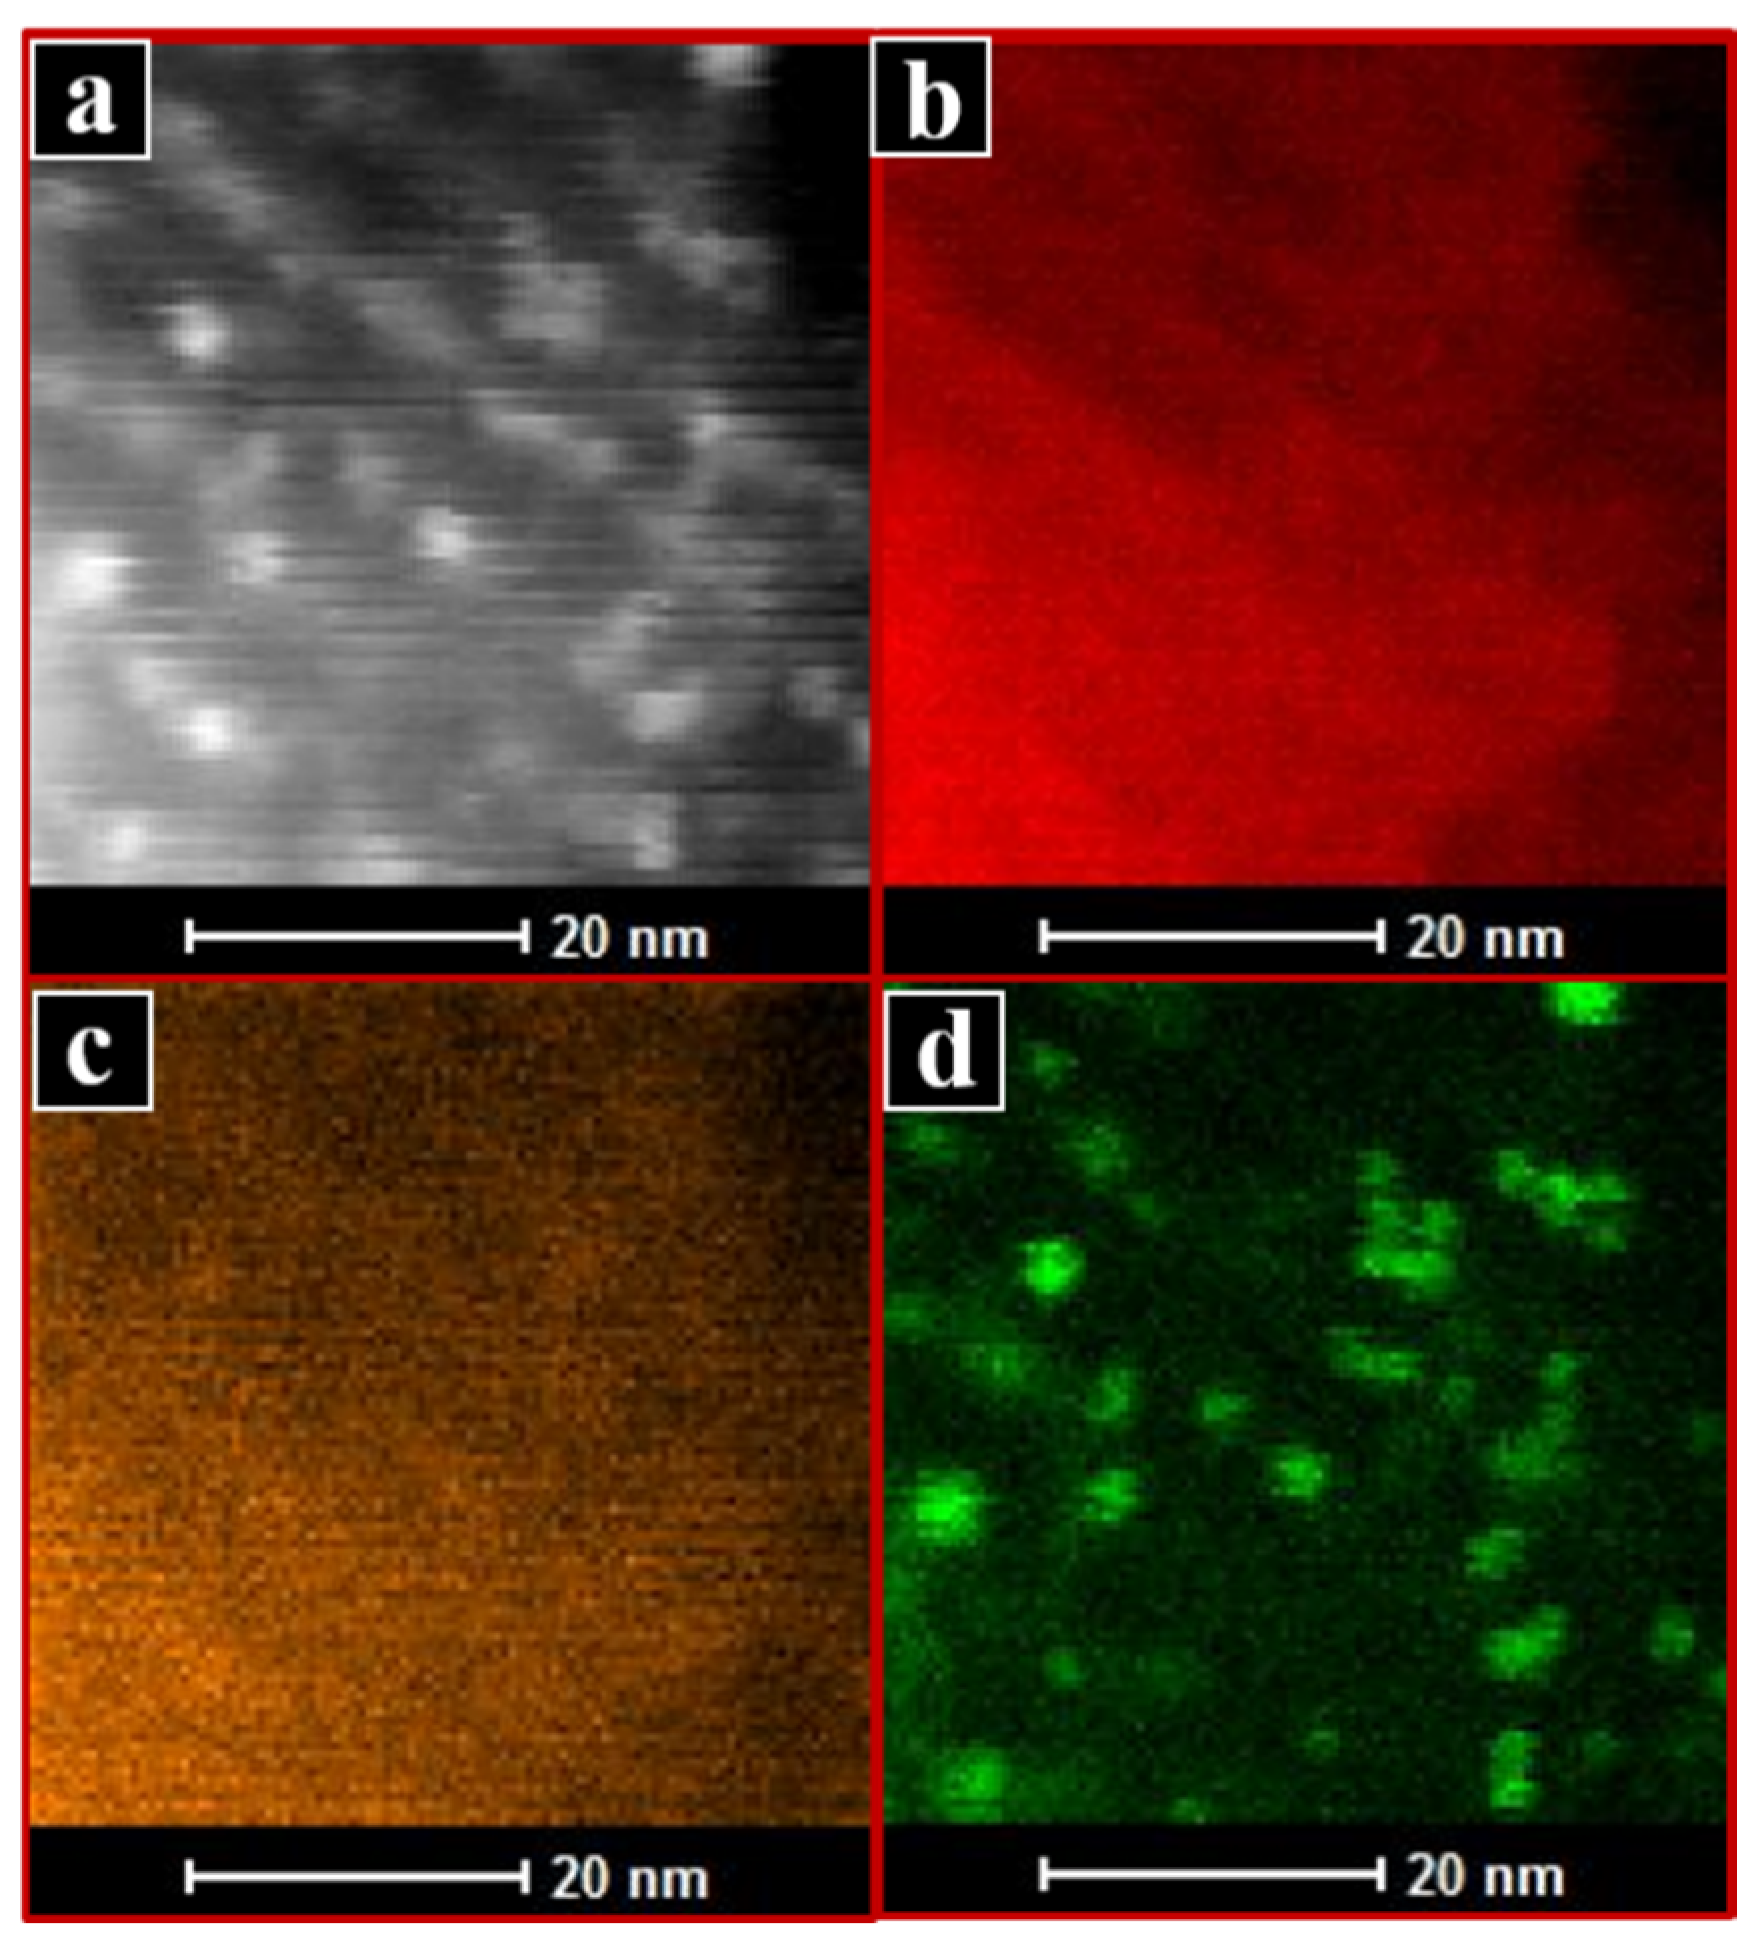
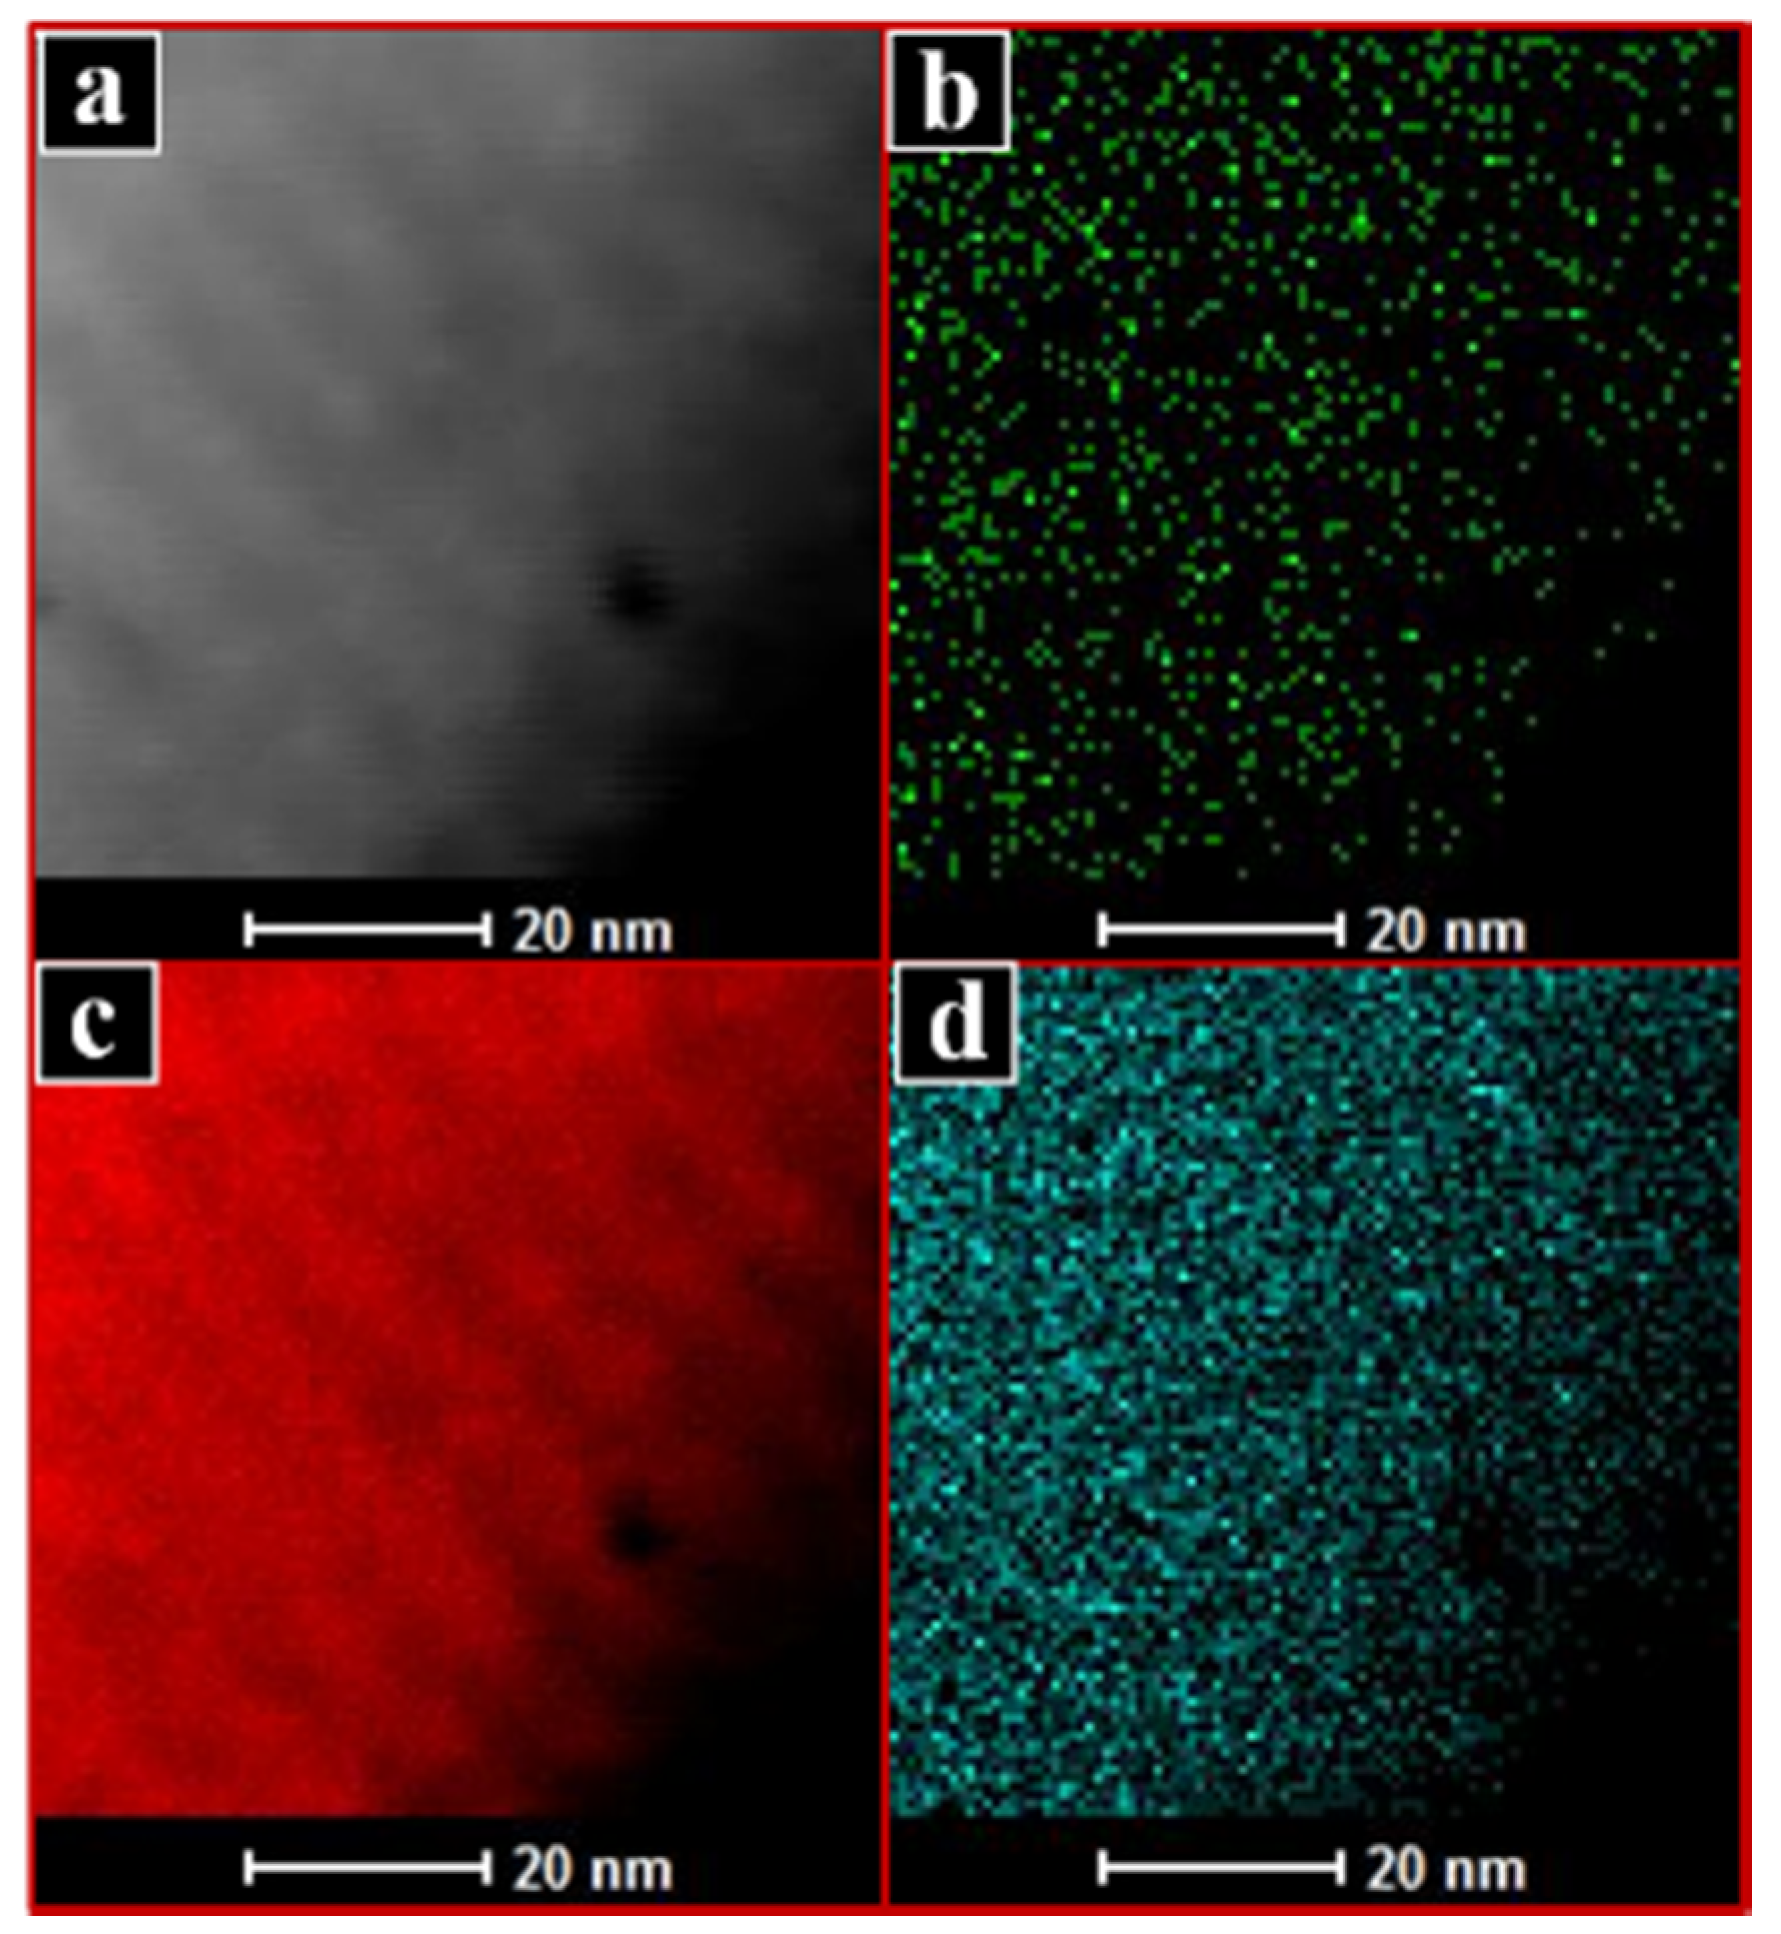
Figure 4. presents HAADF images of the catalyst, IW-Pd, after catalytic activity testing. The intensity in HAADF images increases with density. This means that Pd particles have high brightness and can be easily distinguished from the low-density carbon support. The low magnification image in Figure 4a shows the excellent dispersion of Pd nanoparticles, of uniform size, within a particle of the OMC support. In Figure 4b–d, intermediate and high magnification images show Pd nanoparticles and the pore structure of the support (not aligned with the microscope beam in these images) in more detail. The Pd particles appear to reside in the mesopores of the support. In addition to the nanoparticles of ~3–8 nm diameter, even smaller features of diameter ~1–2 nm, possibly Pd clusters, can be seen. Some of these are indicated using yellow arrows in Figure 4d, which also clearly exemplifies the bimodal particle size distribution seen in the histograms of Figure 3 and discussed above. Images and EDS elemental maps are presented for the used catalysts, DS-Pd and SL-Pd, in Figure 5 and Figure 6, and Figure 7 and Figure 8, respectively. In Figure 5a, in the HAADF image of DS-Pd, a small number of relatively large Pd particles are seen. Their diameters, at ~10–40 nm, are larger than the diameter of the mesopores of the support (~7 nm), indicating that they must be on the external surface of the support particle. In this image, and more clearly, in Figure 5b, many small Pd nanoparticles are seen inside the parallel cylindrical pores of the carbon support. This is a very desirable nanostructure because it is expected to favour excellent dispersion of the Pd and also hinder coalescence and sintering of the Pd nanoparticles during the time on stream. The high magnification image in Figure 5c shows a number of uniform Pd particles of diameter ~1–2 nm which appear to be located mainly on the walls of the cylindrical pores in the OMC support. These pores are viewed end-on here and appear as dark circles in the lower part of the image. A high-resolution TEM image is presented in Figure 5d in which the amorphous structure of the carbon of the support and some of the crystal lattice planes of the 3–5 nm diameter Pd particles (arrowed) can both be resolved. Lattice spacings are ~2.2 Å, which is consistent with the (111) planes of metallic Pd. EDS elemental maps corresponding to the HAADF image shown in Figure 6a are given in Figure 6b–d. The parallel pore structure of the carbon support can be seen in the HAADF image and the O and C maps whereas Figure 6d clearly confirms the location of the Pd nanoparticles inside the mesopores. The used catalyst, SL-Pd, showed fewer Pd nanoparticles to be associated with the OMC support, as can be seen in the relatively low number of bright features in Figure 7a. The region of support images in Figure 7b does contain Pd nanoparticles (some examples are arrowed) but this was not generally the case and much of the support contained little Pd. This can be explained by the large agglomerate of Pd metal seen in Figure 7c. It appears that the palladium precursor was not impregnated completely into the support and this gave rise to large concentrations of Pd separated from the support, which is clearly undesirable for catalysis. In confirmation of this, very little Pd is detected in the mesoporous material itself, as imaged and mapped in Figure 8, although the mesopore structure of the support is clearly seen in the image and C map.

2.2. Catalytic Activity

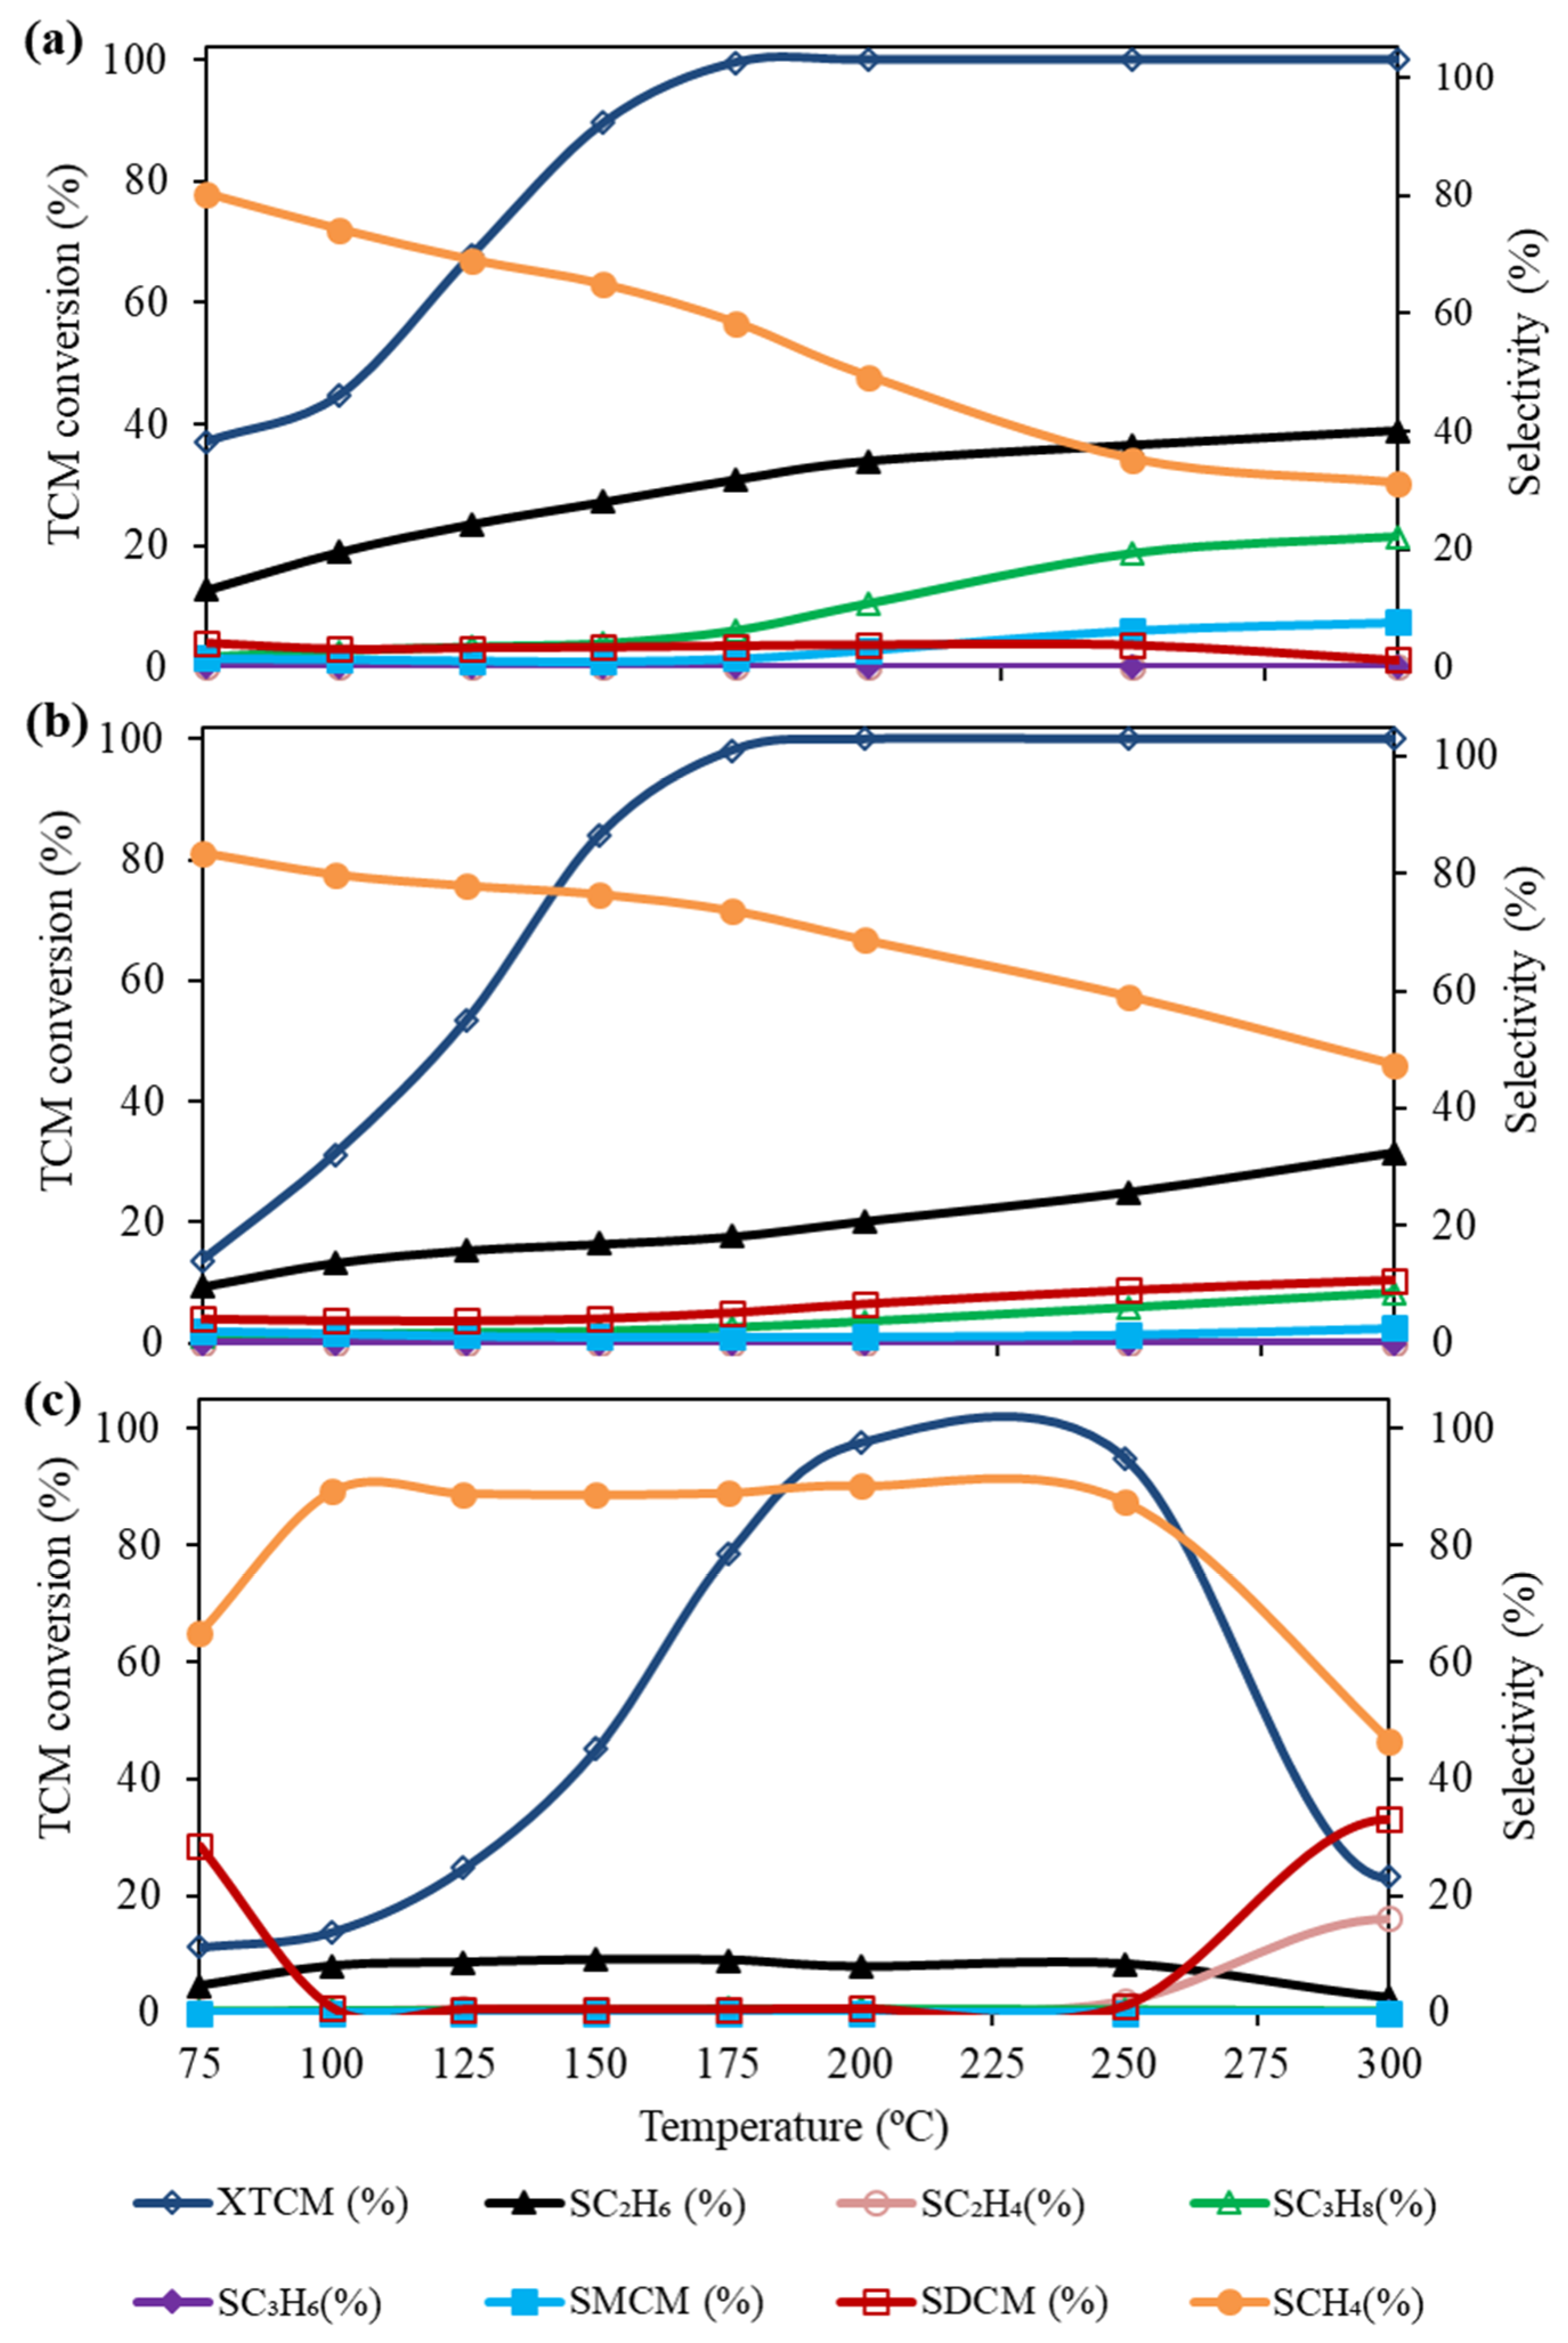
Figure 9 presents the evolution of TCM conversion and selectivities as a function of reaction temperature during the HDC process for the three catalysts prepared. All the catalysts showed high activity for the reaction but there were also significant differences in their conversion and selectivity patterns. In the reaction temperature range up to 175 °C, the conversion follows the order IW-Pd >DS-Pd>SL-Pd. IW-Pd and DS-Pd showed significantly higher conversion values than SL-Pd, which can be explained by their smaller average Pd particle sizes and the more uniform distribution of Pd particles throughout the support as shown in the TEM study. IW-Pd had the smallest average particle size (2.2 nm) and showed the highest conversion. Above 175 °C, both IW-Pd and DS-Pd achieved total TCM conversion. These TCM conversion values compare favourably with that reported for the same loading of Pd on a commercial carbon from Merck and tested under the same operating conditions by Gómez-Sainero et al. [21]. The authors reported a similar average Pd particle size of 1.8 nm [22]. In contrast, SL-Pd displayed a noticeable decrease in conversion at reaction temperatures of above 250 °C. Initially, the conversion of TCM increased with reaction temperature up to 200 °C at which point it reached a value of 98%. Conversion remained high and almost constant till 250 °C but then decreased to 23% at 300 °C. Results suggest that the larger Pd particles and their preferential location on the outer surface of the catalyst allowed the deactivation of SL-Pd catalyst. This deactivation appears to be favoured by the presence of large agglomerates of Pd separate from the OMC support and a sparser and non-uniform distribution of Pd nanoparticles within the support. The differences in Pd distribution, leading to dissimilar catalytic activity, seems to be related to the different catalyst preparation methods. While, in the preparation of IW-Pd and DS-Pd, palladium nitrate solution was continuously mixed using a pestle and mortar for more than 1 h, in the preparation of SL-Pd, the carbon template and palladium nitrate were simply ground together using a pestle and mortar. The thorough mixing in the preparation of IW-Pd and DS-Pd would be expected to result in well-distributed, small Pd particles, enhancing the performance during HDC. Another reason for the lower activity of SL-Pd and its loss of activity at high reaction temperatures may be the reduction of surface Pd concentration (from 1.56 to 1.04%) observed on used catalysts by XPS analysis. As mentioned above, deposition of carbon species formed during HDC tests probably deactivated the catalyst by blocking access of the reaction gas to the catalytically active surface of the Pd particles.
The selectivity patterns of the three catalysts to the reaction products are plotted in Figure 9 and presented in detail in Table 3, Table 4 and Table 5. In all cases, the reaction products detected were methane, ethane, propane, ethane and propene in addition to the incompletely dechlorinated species, dichloromethane (DCM) and monochloromethane (MCM). At low reaction temperatures, the main products, for all catalysts, were methane followed by ethane. The three catalysts showed an increase in the selectivity to C2-C3 hydrocarbons at the expense of CH4 as reaction temperature increased. IW-Pd showed the highest selectivity to ethane, which increased from 12.8% at 75 °C to around 40% at 300 °C. At this latter temperature, the selectivity to ethane is higher than that to methane. In addition, this catalyst also showed the highest selectivity to propane, which reached a maximum value of ca. 21% at 300 °C. The DS-Pd catalyst also showed an increase in selectivity to ethane from 9 to 31% at the expense of methane, and relatively high selectivity to propane at 300 °C (8%). On the contrary, for SL-Pd, the selectivity to C2-C3 alkanes was significantly lower than those obtained using IW-Pd and DS-Pd. This can be ascribed to the poorer distribution of the Pd phase in the SL-Pd catalysts because no significant differences in Pd oxidation state were observed between the catalysts (Table 2). Furthermore, with the SL-Pd catalyst, both conversion and selectivity to ethane dropped significantly at temperatures above 250 °C and selectivity to DCM increased, probably as a consequence of the deactivation of the catalyst. It is worth noting that SL-Pd was the only catalyst that showed ethene as a reaction product, with almost 20% ethene selectivity at 300 ℃, although with TCM conversion hardly higher than 20%. As ethane is obtained from the subsequent hydrogenation of the ethene intermediate [22], the higher selectivity to ethene can be attributed to the partial deactivation of the Pd active centres so hindering H2 adsorption and hydrogenation capability, as demonstrated by the high selectivity to DCM obtained at the highest reaction temperatures with this catalyst.
Several authors propose that HDC of TCM occurs via the methylene species (:CH2) as a reaction intermediate [5,21,23]. This species could be (i) completely hydrogenated to give methane, (ii) could react with a second methylene group to give ethene (which, in turn, may be hydrogenated to ethane) or (iii) be partially hydrogenated then react with a CH3 group to give ethane. Route (i) is considered to be more energetically favoured because the methane intermediate is more stable and energy barriers to generate the catalytic intermediate are lower. Because of this, only at low reaction temperatures is selectivity to methane high. As reaction temperature increases, these intermediates become relatively stabilised and the activation energy barriers to C1+ products are increasingly overcome, so selectivity to C1+ species increases. The morphology of the catalyst has also found to be important. In previous work, some of the authors found that increasing Pd particle size increased selectivity to C1+ products. This was attributed to an increased probability of two adsorbed CH3 species meeting and reacting on these larger particles.

3. Experimental Section

3.1. Catalysts Preparation

The 2D hexagonal OMCs were prepared using a two-phase method described elsewhere [20]. Briefly, in a typical preparation, a precursor solution is made by mixing 2.20 g of resorcinol with 2.26 g of 37 wt% formaldehyde solution. 2 mL of 0.1 M NH4OH was added to catalyse the polymerisation of the resorcinol and formaldehyde, and the solution was stirred for a further 1 h to obtain the resorcinol-formaldehyde resin, known as RF resol. This was cooled to 18 °C and mixed with a solution containing 1.60 g of the block copolymer, F127 (of the form H-[-O-CH2CH2-]x[-OCH(CH3)-CH2-]y-[O-CH2-CH2-]z-OH), 8 g of water and 10 g of ethanol. 0.225 g of oxalic acid—the polymer condensation catalyst was added with continuous stirring. The molar ratios of these reagents, resorcinol: formaldehyde: F127: NH4OH: oxalic acid, was 1:1.39:0.00635:0.01:0.125. After 5–10 min, the clear solution became cloudy indicating phase separation. After constant stirring for a further 1 h, the mixture was left standing overnight to obtain the polymer gel phase. This was dried for at least 12 h at room temperature, cured at 80 °C for 24 h then heated at 400 °C for 3 h (heating rate, 1 °C min−1) under flowing N2 (100 cm3 min−1) to obtain the OMC product. The catalysts were made by impregnating 1 wt% Pd into this 2D hexagonal OMC by incipient wetness (IW), dilute solution (DS) and solid-liquid methods (SL) and they were named as IW-Pd, DS-Pd and SL-Pd, respectively. In the IW method, 0.0505 g of Pd(NO3)2·2H2O dissolved in 3 mL of acetone was mixed with the OMC template using a pestle and mortar. The precursor solution was added a few drops at a time to 2 g of the OMC, and the powder mixed thoroughly to allow it to dry before making the next addition. 2 mL of additional acetone was used to rinse the last solution from the vial and added to the OMC in the same way. In the dilute solution (DS) method, 0.0511 g of Pd(NO3)2·2H2O was added to 7.59 g of acetone together with 2 g of the OMC template, to form a suspension. The mixture was stirred continuously for 24 h at room temperature and then heated at 40 °C with continuous stirring to evaporate the acetone. In the solid-liquid (SL) method, 0.0507 g of solid Pd(NO3)2·2H2O was mixed with 2 g of 2D hexagonal mesoporous carbon template in a pestle and mortar for several minutes. After impregnation, all three catalysts were dried overnight at 60 °C in the air in a muffle furnace.

3.2. Catalyst Characterisation

Nitrogen physisorption isotherms were measured using a Micromeritics TriStar II 3020 instrument (Norcross, GA, USA) with liquid nitrogen at −196 °C. Before analysis, samples were degassed at 120 °C for at least 12 h under vacuum. Micrometrics software was used to obtain specific surface areas using the BET (Brunauer–Emmett–Teller) equation and the micropore volume was calculated using the t-plot method. BJH (Barrett, Joyner, Halenda) pore size distributions were obtained from the adsorption branches of the isotherms.
XPS was performed with a Scienta 300, operating at 1 × 10⁻⁹ mbar and using an unmonochromated Al Kα source (photon energy 1486.6 eV). The pass energy was set to 75 eV. Survey scans were collected at a dwell time of 133 msec with a step size of 200 meV and two scans were added. For detailed scans, two scans were added and dwell time was 533 msec with a 20 meV step. Pd 3d Spectra were background-subtracted and deconvoluted using Casa-XPS software (Teignmouth, UK). The C1s peak (284.6 eV) was considered as an internal standard and used for corrections of changes occurring in BE caused by sample charging. For XPS analysis, fresh, as-prepared samples were pre-reduced at 250 °C for 2 h in flowing H2, to replicate the pre-reduction carried out prior to catalytic activity tests (see below). These samples are described as “fresh reduced” in this paper.
For TEM examination, the samples were suspended in acetone by ultrasonication and deposited onto holey carbon-coated Cu grids. A Titan Themis 200 keV (FEI) transmission and scanning transmission electron microscope (city, State Abbr. (if has), country) (S/TEM) equipped with an X-FEG Schottky field emission gun and a spherical aberration corrector was employed to obtain electron images in bright field, dark field and High Angle Angular Dark Field (HAADF) mode. HAADF images were particularly useful for studying the Pd/OMC catalysts because the intensity in the image increases with density. Since Pd has a much higher atomic number than the C of the support, Pd nanoparticles are observed very clearly. The Super-X high sensitivity windowless Energy Dispersive Spectroscopy (EDS) X-ray detector of the microscope was used to generate two-dimensional maps of the elemental composition of the samples. The diameters of ~300 Pd particles were measured from high magnification HAADF images of each of the used catalyst samples using the image analysis software, ImageJ, (Hillsboro, OR, USA) and these data were plotted as particle size distribution histograms.

3.3. Catalytic Activity Tests

The hydrodechlorination (HDC) experiments were carried out in a continuous flow reaction system described by Gómez-Sainero and co-workers [5,19], consisting of a quartz fixed-bed microreactor having an internal diameter of 4.0 mm, coupled to a gas chromatograph equipped with a flame ionization detection (FID) detector for the analysis of the reaction products. The catalysts were reduced in situ under an H2 flow (50 Ncm3 min−1) at 250 °C for 2 h prior to reaction. The experiments were performed at atmospheric pressure using a total flow rate of 100 Ncm3 min−1 and an inlet trichloromethane (TCM) concentration of 1000 ppm with a H2/TCM molar ratio of 100:1. The temperature was increased in steps from 75 to 300 °C at a heating rate of 10 °C min−1 and catalytic activity tests were performed under isothermal conditions for 90 min each at temperatures of 75, 100, 125, 150, 175, 200, 250 and 300 °C. In each experimental run, 0.213 g of catalyst was used resulting in a space time of 0.8 kg h mol−1 TCM. The performance of the catalysts was evaluated in terms of TCM conversion (X) and selectivities to different reaction products.

4. Conclusions

Three catalysts were prepared by incorporating 1 wt% Pd in a mesoporous carbon template using IW, DS and SL preparation methods. The catalysts were used in the gas-phase HDC of TCM at temperatures in the range of 75–300 °C with a space-time of 0.8 kg h mol−1. High conversion of the TCM along with low selectivities to chlorinated intermediates and high selectivities to alkanes, especially the higher alkanes, are all desirable properties of a catalyst for HDC. Interestingly, the Pd/C catalysts studied here show performance which is comparable with materials developed specifically for this reaction [4,7,21]. IW-Pd was found to be the best catalyst in terms of TCM conversion, this reaching 100% already at 175 °C and remaining constant on further increasing the reaction temperature. Its selectivity to non-chlorinated products was always higher than 90%, under the conditions used in this study, and this catalyst exhibited higher selectivity to the higher alkanes than the other two catalysts. The SL-Pd showed poor performance due to its lower dispersion and to the agglomeration of relatively large Pd particles on the outer catalyst surface, and indeed outside the OMC completely. This poor impregnation leads to lower conversion values and lower selectivity to the desired products, as well as a strong deactivation of the catalyst. This deactivation proceeded most likely through the blocking of active Pd sites by deposition of carbonaceous species. The performance of the catalysts can be explained by their nanostructure, as determined by TEM and XPS, and this is, in turn, a function of the preparation route used. The use of ordered mesoporous carbon as a support in these HDC catalysts presents an interesting avenue for future studies.

Supplementary Materials

The following are available online at https://www.mdpi.com/2073-4344/11/1/23/s1, Figure S1: Pore size distributions for OMC templates used to prepare Pd/OMC catalysts; Table S1: Nitrogen physisorption data of the OMC templates used to prepare the IW-Pd, DS-Pd and SL-Pd catalysts; Figure S2: Additional HAADF image of the catalyst IW-Pd in which the position of the intermediate particles predominantly in the mesopores can be seen.

Author Contributions

Conceptualization, L.G.-S. and R.T.B.; funding acquisition, L.G.-S. and R.T.B.; investigation, F.S., C.F.-R. and J.B.; supervision, L.G.-S. and R.T.B. All authors have read and agreed to the published version of the manuscript.

Funding

This research received financial support from FEDER/Ministerio de Ciencia, Innovación y Universidades-Agencia Estatal de Investigación/CTM2017-85498-R. C. Fernández Ruiz acknowledges MINECO for his research grant.

Acknowledgments

The authors thank the University of St Andrews for a PhD scholarship for FS. Electron microscopy and XPS were carried out at the Electron Microscopy Facility and the surface science laboratories, respectively, at the School of Chemistry, University of St Andrews.

Conflicts of Interest

The authors declare no conflict of interest.

References

  1. Bedia, J.; Gómez-Sainero, L.M.; Grau, J.M.; Busto, M.; Martin-Martinez, M.; Rodriguez, J.J. Hydrodechlorination of dichloromethane with mono- and bimetallic Pd–Pt on sulfated and tungstated zirconia catalysts. J. Catal. 2012, 294, 207–215. [Google Scholar] [CrossRef]
  2. Lee, S.R.; Cho, J.M.; Son, M.; Park, M.J.; Kim, W.Y.; Kim, S.Y.; Bae, J.W. Selective hydrodechlorination of trichloromethane to dichloromethane over bimetallic Pt-Pd/KIT-6: Catalytic activity and reaction kinetics. Chem. Eng. J. 2018, 331, 556–569. [Google Scholar] [CrossRef]
  3. Dobrzyńska, E.; Pośniak, M.; Szewczyńska, M.; Buszewski, B. Chlorinated Volatile Organic Compounds—Old, However, Actual Analytical and Toxicological Problem. Crit. Rev. Anal. Chem. 2010, 40, 41–57. [Google Scholar] [CrossRef]
  4. Álvarez-Montero, M.A.; Gómez-Sainero, L.M.; Martín-Martínez, M.; Heras, F.; Rodriguez, J.J. Hydrodechlorination of chloromethanes with Pd on activated carbon catalysts for the treatment of residual gas streams. Appl. Catal. B Environ. 2010, 96, 148–156. [Google Scholar] [CrossRef]
  5. De Pedro, Z.M.; Casas, J.A.; Gomez-Sainero, L.M.; Rodriguez, J.J. Hydrodechlorination of dichloromethane with a Pd/AC catalyst: Reaction pathway and kinetics. Appl. Catal. B Environ. 2010, 98, 79–85. [Google Scholar] [CrossRef]
  6. Martin-Martinez, M.; Gómez-Sainero, L.M.; Alvarez-Montero, M.A.; Bedia, J.; Rodriguez, J.J. Comparison of different precious metals in activated carbon-supported catalysts for the gas-phase hydrodechlorination of chloromethanes. Appl. Catal. B Environ. 2013, 132–133, 256–265. [Google Scholar] [CrossRef]
  7. Álvarez-Montero, M.A.; Gómez-Sainero, L.M.; Mayoral, A.; Diaz, I.; Baker, R.T.; Rodriguez, J.J. Hydrodechlorination of chloromethanes with a highly stable Pt on activated carbon catalyst. J. Catal. 2011, 279, 389–396. [Google Scholar] [CrossRef]
  8. Ordoñez, S.; Díez, F.V.; Sastre, H. Minimization of the deactivation of palladium catalysts in the hydrodechlorination of trichloroethylene in wastewaters. Appl. Catal. B Environ. 2001, 31, 113–122. [Google Scholar] [CrossRef]
  9. Coq, B.; Cognion, J.M.; Figueras, F.; Tournigant, D. Conversion under hydrogen of dichlorodifluoromethane over supported palladium catalysts. J. Catal. 1993, 141, 21–33. [Google Scholar] [CrossRef]
  10. Moon, D.J.; Chung, M.J.; Park, K.Y.; Hong, S.I. Deactivation of Pd Catalyst in the Hydrodechlorination of Chloropentafluoroethane. Appl. Catal. A 1988, 168, 159–170. [Google Scholar] [CrossRef]
  11. Kim, S.Y.; Choi, H.C.; Yang, O.B.; Lee, K.H.; Lee, J.S.; Kim, Y.G. Hydrodechlorination of tetrachloromethane over supported Pt catalysts. Chem. Commun. 1995, 21, 2169–2170. [Google Scholar] [CrossRef] [Green Version]
  12. Shao, Y.; Xu, Z.; Wan, H.; Wan, Y.; Chen, H.; Zheng, S.; Zhu, D. Enhanced liquid phase catalytic hydrodechlorination of 2,4-dichlorophenol over mesoporous carbon supported Pd catalysts. Catal. Commun. 2011, 12, 1405–1409. [Google Scholar] [CrossRef]
  13. Ryoo, R.; Joo, S.H.; Jun, S. Synthesis of Highly Ordered Carbon Molecular Sieves via Template-Mediated Structural Transformation. J. Phys. Chem. B 1999, 103, 7743–7746. [Google Scholar] [CrossRef]
  14. Wang, X.; Liang, C.; Dai, S. Facile Synthesis of Ordered Mesoporous Carbons with High Thermal Stability by Self-Assembly of Resorcinol−Formaldehyde and Block Copolymers under Highly Acidic Conditions. Langmuir 2008, 24, 7500–7505. [Google Scholar] [CrossRef]
  15. Meng, Y.; Gu, D.; Zhang, F.; Shi, Y.; Cheng, L.; Feng, D.; Wu, Z.; Chen, Z.; Wan, Y.; Stein, A. A Family of Highly Ordered Mesoporous Polymer Resin and Carbon Structures from Organic−Organic Self-Assembly. Chem. Mater. 2006, 18, 4447–4464. [Google Scholar] [CrossRef]
  16. Zhang, F.; Meng, Y.; Gu, D.; Chen, Z.; Tu, B.; Zhao, D. An Aqueous Cooperative Assembly Route to Synthesize Ordered Mesoporous Carbons with Controlled Structures and Morphology. Chem. Mater. 2006, 18, 5279–5288. [Google Scholar] [CrossRef]
  17. Xu, J.; Wang, A.; Zhang, T. A two-step synthesis of ordered mesoporous resorcinol–formaldehyde polymer and carbon. Carbon 2012, 50, 1807–1816. [Google Scholar] [CrossRef]
  18. Sakina, F.; Baker, R.T. Metal- and halogen-free synthesis of ordered mesoporous carbon materials. Microporous Mesoporous Mater. 2019, 289, 1096222. [Google Scholar] [CrossRef]
  19. Moulder, J.F.; Stickle, W.F.; Sobol, P.E.; Bomben, K.D.; Chastain, J.; King, R.C., Jr. Handbook of X-ray Photoelectron Spectroscopy; Physical Electronics Inc.: Eden Prairie, MN, USA, 1995. [Google Scholar]
  20. Fernandez-Ruiz, C.; Bedia, J.; Bonal, P.; Rodriguez, J.J.; Gómez-Sainero, L.M. Chloroform conversion into ethane and propane by catalytic hydrodechlorination with Pd supported on activated carbons from lignin. Catal. Sci. Technol. 2018, 8, 3926–3935. [Google Scholar] [CrossRef]
  21. Gómez-Sainero, L.M.; Palomar, J.; Omar, S.; Fernández, C.; Bedia, J.; Álvarez-Montero, A.; Rodriguez, J.J. Valorization of chloromethanes by hydrodechlorination with metallic catalysts. Catal. Today 2018, 310, 75–85. [Google Scholar] [CrossRef] [Green Version]
  22. Martin-Martinez, M.; Gómez-Sainero, L.M.; Bedia, J.; Arevalo-Bastante, A.; Rodriguez, J.J. Enhanced activity of carbon-supported Pd–Pt catalysts in the hydrodechlorination of dichloromethane. Appl. Catal. B Environ. 2016, 184, 55–63. [Google Scholar] [CrossRef] [Green Version]
  23. Xu, L.; Bhandari, S.; Chen, J.; Glasgow, J.; Mavrikakis, M.T. Chloroform Hydrodechlorination on Palladium Surfaces: A Comparative DFT Study on Pd(111), Pd(100), and Pd(211). Top. Catal. 2020, 63, 762–776. [Google Scholar] [CrossRef]
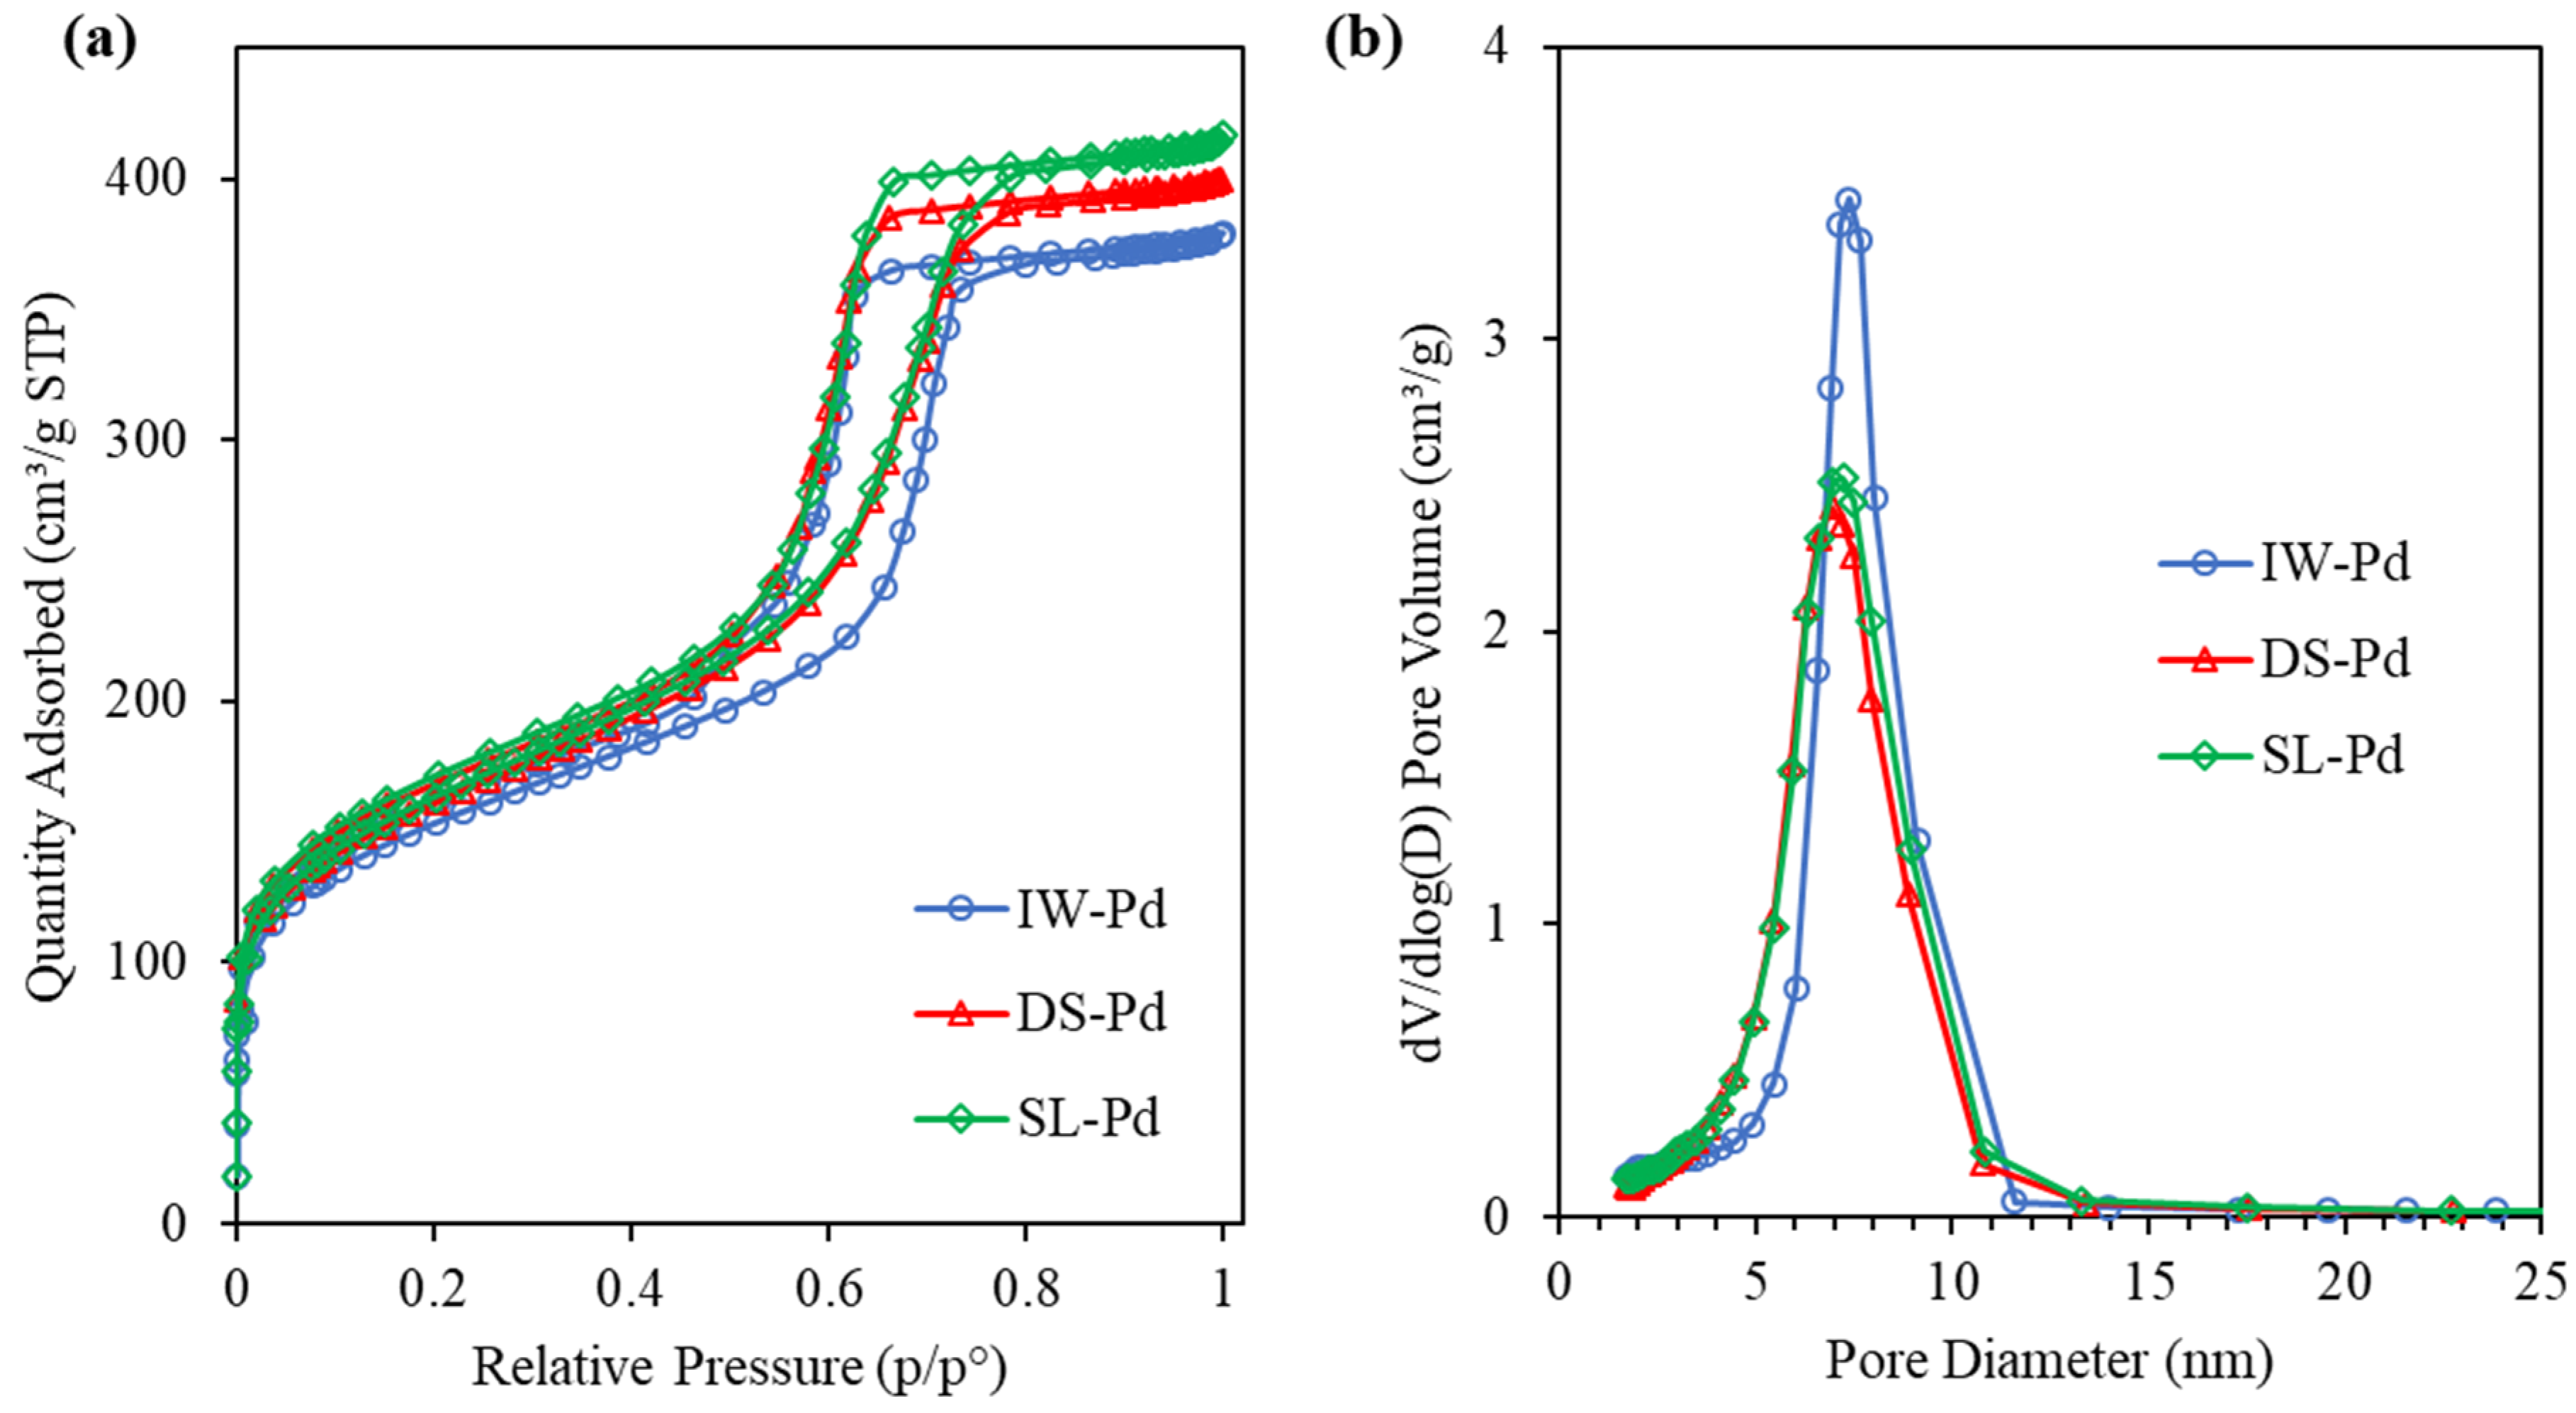
Figure 1. Physisorption isotherms (a) and pore size distributions (b) for the Pd/OMC catalysts.
Catalysts 11 00023 g001
Figure 2. Pd 3d XPS spectra for the following catalysts: fresh, reduced (a) and used (b) IP-Pd; fresh reduced (c) and used (d) DS-Pd; fresh reduced (e) and used (f) SL-Pd. See text for details.
Catalysts 11 00023 g002
Figure 3. Pd nanoparticle size distribution histograms obtained from TEM images for catalyst samples after catalyst testing: (a) IW-Pd (b) DS-Pd; (c) SL-Pd.
Catalysts 11 00023 g003
Figure 4. HAADF images of the catalyst IW-Pd after HDC testing in which Pd has bright contrast: (a) at low magnification showing the excellent dispersion of Pd nanoparticles within a particle of the mesoporous carbon support; (b,c) at intermediate magnification showing Pd nanoparticles and the pore structure more clearly; (d) at high magnification showing that in addition to the nanoparticles of ~3–8 nm diameter, even smaller features, possibly Pd clusters are visible (examples arrowed). The intermediate-sized Pd particles appear to coincide predominantly with the mesopores (dark contrast) of the support. A further image is given in Supplementary Information.
Catalysts 11 00023 g004
Figure 5. HAADF images of the catalyst DS-Pd after HDC testing in which Pd has bright contrast: (a) at low magnification showing a few large Pd particles outside the mesopore structure; (b) at intermediate magnification showing the alignment of the Pd particles within the cylindrical pores; and (c) ~1 nm Pd particles located on the mesopore edges (examples arrowed). (d) TEM image showing the lattice planes of 3–5 nm Pd particles (arrowed).
Catalysts 11 00023 g005
Figure 6. HAADF image of the catalyst DS-Pd after HDC testing in which Pd has bright contrast (a), and corresponding EDS elemental maps for: C (b), showing the parallel pore structure; O (c); and Pd (d), confirming the presence of Pd nanoparticles inside the mesopores of the support.
Catalysts 11 00023 g006
Figure 7. HAADF images of the catalyst SL-Pd after catalyst testing showing: (a) the ordered mesoporous carbon structure with few visible Pd particles; (b) Pd nanoparticles within the mesopore structure (examples arrowed); and (c) a large agglomerate of Pd metal.
Catalysts 11 00023 g007
Figure 8. HAADF image of SL-Pd after catalyst testing (a), and corresponding EDS elemental maps of: Pd (K emission) (b); C (c), showing parallel pore structure; Pd (L emission) (d).
Catalysts 11 00023 g008
Figure 9. Conversion of TCM, XTCM, and selectivities, S, to the products indicated, as a function of temperature for the catalysts: (a) IW-Pd; (b) DS-Pd and (c) SL-Pd.
Catalysts 11 00023 g009
Table 1. Nitrogen physisorption data of IW-Pd, DS-Pd and SL-Pd.
Sample IDSSA
(m2/g)
VP
(cm3/g)
Vmicro
(cm3/g)
Dp(nm)
IW-Pd5230.540.0377.4
DS-Pd5510.580.0407.0
SL-Pd5600.610.0327.1
SSA: Specific surface area; VP: Pore volume; Vmicro: Micropore volume; DP: Pore diameter.
Table 2. Chemical compositions and oxidation states of Pd obtained from XPS analyses for the fresh reduced and used Pd/OMC catalysts.
%IW-Pd FreshIW-Pd TCMDS-Pd FreshDS-Pd TCMSL-Pd FreshSL-Pd TCM
C (1s)77.5477.6478.278.2879.2578.73
O (1s)20.0319.819.3519.4119.1920.23
Pd (3d)2.432.562.442.311.561.04
Pd087.869.7172.2269.6556.7468.45
Pdn+12.230.2927.7930.3543.2631.54
Table 3. Selectivities to methane (SCH₄), C2 hydrocarbons (SC2s), hydrocarbons with more than two (SC2+), and more than one (SC1+), carbon atom(s), and to MCM and DCM (SCMs) for IW-Pd.
Reaction Temperature (°C)SCH₄ (%)SC2sSC2+ (%)SC1+ (%)SCMs (%)
7580.312.81.614.45.4
10074.219.02.621.64.2
12569.023.63.226.84.2
15064.927.23.831.04.2
17558.330.95.936.84.9
20049.333.910.444.36.4
25035.236.618.655.29.6
30031.238.921.460.38.5
Table 4. Selectivities to methane (SCH₄), C2 hydrocarbons (SC2s), hydrocarbons with more than two (SC2+), and more than one (SC1+), carbon atom(s), and to MCM and DCM (SCMs) for DS-Pd.
Reaction Temperature (°C)SCH₄ (%)SC2sSC2+ (%)SC1+ (%)SCMs (%)
7583.69.41.010.46.1
10079.813.31.514.85.4
12577.915.41.817.25.0
15076.416.42.018.45.2
17573.617.62.620.26.1
20068.620.13.623.77.6
25059.025.05.930.810.2
30047.431.48.339.812.8
Table 5. Selectivities to methane (SCH₄), C2 hydrocarbons (SC2s), hydrocarbons with more than two (SC2+), and more than one (SC1+), carbon atom(s), and to MCM and DCM (SCMs) for SL-Pd.
Reaction Temperature (°C)SCH₄ (%)SC2sSC2+ (%)SC1+ (%)SCMs (%)
7564.94.61.96.528.6
10089.28.21.710.00.9
12588.89.31.310.60.6
15088.69.61.210.80.6
17588.99.11.310.40.6
20090.17.81.39.10.7
25087.410.41.011.41.2
30046.318.71.920.533.1
Publisher’s Note: MDPI stays neutral with regard to jurisdictional claims in published maps and institutional affiliations.