Article

Partial Hydrogenation of Palm Oil-Derived Biodiesel over Ni/Electrospun Silica Fiber Catalysts

by
Supanut Phumpradit
1,2,
Prasert Reubroycharoen
1,2,3,
Prapan Kuchonthara
1,2,3,
Chawalit Ngamcharussrivichai
1,2,3 and
Napida Hinchiranan
1,2,3,*
1
Department of Chemical Technology, Faculty of Science, Chulalongkorn University, Bangkok 10330, Thailand
2
Center of Excellence on Petrochemical and Materials Technology (PETROMAT), Chulalongkorn University, Bangkok 10330, Thailand
3
Center of Excellence in Catalysis for Bioenergy and Renewable Chemicals (CBRC), Faculty of Science, Chulalongkorn University, Bangkok 10330, Thailand
*
Author to whom correspondence should be addressed.
Catalysts 2020, 10(9), 993; https://doi.org/10.3390/catal10090993
Submission received: 26 June 2020 / Revised: 16 August 2020 / Accepted: 27 August 2020 / Published: 1 September 2020
(This article belongs to the Special Issue Metal/Metal Oxide-Support Interactions in Heterogeneous Catalysis)

Abstract

:
Given the high accessibility of reactants to the active metal sites of fibrous catalysts, in this research, an electrospun silica fiber was applied as a support of nickel catalysts (Ni/SF) for the partial hydrogenation of palm oil fatty acid methyl ester (FAME) in a fixed-bed reactor. The textural properties, reducibility, Ni dispersion and morphology of Ni/SF catalysts were characterized and compared to those of a Ni/porous silica ball (Ni/SB). Under 1 bar H2 pressure at 140 °C, the 30 wt% Ni/SF catalyst exhibited a high turnover frequency (TOF) of 1396 h−1 to convert methyl linoleate (C18:2) to more saturated structures. On the other hand, the system using Ni/SB catalysts showed a TOF of only 141 h−1. This result was due to the effect of the higher acidity of the silica fiber, which promoted the higher adsorption of polyunsaturated portions in FAME. The non-porous characteristics and open morphology of the Ni/SF catalysts also allowed FAME and H2 molecules to easily access the Ni active sites deposited on the surface of the silica fiber and suppressed the selectivity to cis–trans isomerization. Stability testing of the Ni/SF catalyst showed that the C18:2 conversion decreased from 71% to 60% after long-term operation for 16 h possibly due to the weak metal–support interaction that facilitated Ni particle loss from the catalyst surface.

Graphical Abstract

1. Introduction

Recently, various regulations related to environmental concerns have been enforced for all countries to follow. As of 1 January 2020, the International Maritime Organization (IMO) set a limit of 0.5% (w/w) for the sulfur content in fuel oil used onboard ships operating outside the designed emission control areas [1]. Thus, low-sulfur fuels like fatty acid methyl ester (FAME) or biodiesel produced from vegetable oils or animal fats are expected to replace the conventional bunker oil derived from the high-sulfur residue obtained from crude oil distillation [2]. However, the existence of polyunsaturated fractions in the fatty acid composition of FAME results in poor oxidation stability and difficulty of storage [3]. To solve this problem, partial hydrogenation is applied to FAME to enhance its saturation degree and increase its quality. However, hydrogenated FAME (H-FAME) with over-saturation has inferior cold flow properties, resulting in the potential blockage of the fuel system of vehicles [3,4]. Thus, the optimum conditions for the partial hydrogenation of FAME have been investigated for each catalytic system to maximize the amount of monounsaturated structures (methyl oleate (C18:1) and methyl palmitoleate (C16:1)) to balance the oxidation stability with the cold flow properties of H-FAME [3,4,5].
Among the catalysts applied in the partial hydrogenation of FAME are the noble transition metals, such as platinum (Pt) and palladium (Pd), which are limited for use in mass-scale production due to their high cost and limited availability. Moreover, the Pd catalyst has a greater selectivity for cis–trans isomerization to promote the formation of a trans-C18:1 structure, which can induce a higher crystallization point and thus affect the cold flow properties [3]. From a commercial perspective, nickel (Ni) is a practical catalyst for hydrogenation due to its good catalytic activity and availability at a relatively low cost [6]. Among the porous materials, silica (SiO2) is commonly selected as the catalyst support for partial hydrogenation due to its high specific surface area, thermal-mechanical stability, and low metal–support interaction [6,7].
For reactions performed in a fixed-bed reactor, porous supports normally suffer from poor mass transfer and high pressure drop due to the long diffusion distance, which results in pore blockage with high opportunity for coke formation, especially in steam reforming [8]. In addition, large molecules, such as FAME, cannot diffuse easily into the small pores of the catalysts. Numwong et al. [9] reported that the pore size of the SiO2 support significantly affected the activity of the Pd/SiO2 catalyst for the partial hydrogenation of FAME derived from rapeseed oil. The small pore size could promote cis–trans isomerization during partial hydrogenation to obtain trans-isomers. This phenomenon was also observed for the partial hydrogenation of Jatropha oil biodiesel over CNi/bentonite catalysts prepared from a [Ni(NH3)6](NO3)2 precursor. The pore size of this catalyst was 8.1 nm and provided the fraction of trans-C18:1 at 24.06 wt% in the obtained H-FAME [10]. To overcome the disadvantages of the porous catalysts, silica fiber prepared via the electrospinning technique has been successfully applied as a catalyst support in gas-phase reactions such as Fischer–Tropsch synthesis [11]. However, the application of silica fiber is rarely observed in liquid-phase systems. An example for using silica fiber as the support of Ni catalysts is the hydrogenation of the small molecule such as citral [12].
Thus, the aim of this research was to apply silica fiber as a support of Ni catalysts (Ni/SF) in the partial hydrogenation of large molecules such as palm oil-derived FAME in a continuous fixed-bed reactor. The catalytic activity of Ni/SF catalysts was also compared to that of the Ni supported on the commercial porous silica ball (Ni/SB). The large length-to-diameter ratio of silica fiber and the open morphology of Ni particles deposited on the silica fiber surface was expected to provide a higher mass/heat transfer and availability to access the Ni active sites, in contrast to conventional porous silica supports. The effects of the support morphology, Ni loading level, hydrogen (H2) pressure and reaction temperature on the activity of the catalysts in terms of turnover frequency (TOF) and the distribution of C18 compositions in the H-FAME were evaluated. Moreover, the catalyst stability for long operation times of both Ni/SB and Ni/SF catalysts was comparatively investigated. The fuel properties (oxidation stability, pour point, flash point and heating value) of FAME before and after partial hydrogenation were also examined.

2. Results and Discussion

2.1. Catalyst Characterization

The commercial porous silica support of Ni catalysts for comparing the catalytic efficiency with silica fiber was CARiACT Q10 in the bead form (particle size = 1.18–2.36 mm; bulk density of 0.41 g cm−3), obtained from Fuji Silysia Chemical Co., Ltd. (Kasugai Aichi, Japan). CARiACT Q10 in the powder form was used as the support of palladium (Pd) for the partial hydrogenation of biodiesel derived from rapeseed oil reported by Numwong et al. [9]. They found that the Pd/Q10 catalyst had the appropriate pore size for the pore diffusion of C18:2 and facilitates hydrogenation to get the monounsaturated C18:1 easily. This was suitable for palm oil-derived FAME containing a high fraction of C18:2 with a very small amount of C18:3 composition.
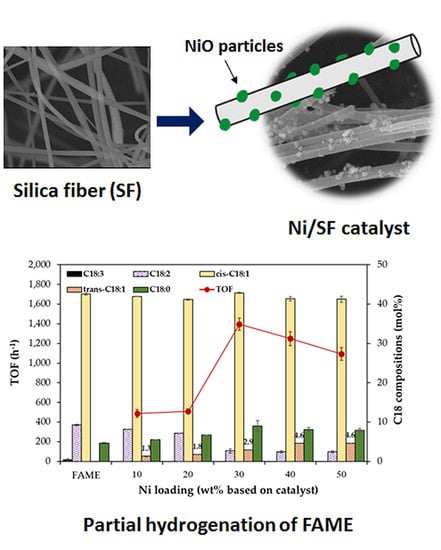
In the case of Ni/SF catalysts, the silica fiber was synthesized via a sol–gel electrospinning technique using tetraethylorthosilicate (TEOS) as a silica precursor. The obtained silica fiber had a bulk density of ca. 0.08 g cm−3 with a diameter of 320 ± 80 nm. The textural properties, in terms of the surface area, pore volume and pore diameter, of both the porous silica ball and silica fiber supports were measured by the N2 adsorption–desorption technique, as shown in Figure 1a and summarized in Table 1. It was found that the BET surface area of the silica ball was 38.1 m2 g−1, with a 0.14 cm3 g−1 pore volume and 14.6 nm average pore diameter. Since the commercial silica used in this research was in the bead form, the pore size distribution shown in Figure 1b indicated the large pore size in the range of 20–40 nm due to the effect of interparticle voids between the silica beads. The obtained average pore size at 14.6 nm of the commercial silica ball was sufficient for the diffusion of FAME into the pores (the size of the FAME molecules was estimated from the size of methyl oleate as having ~2.5 nm for C–C segments and ~0.5 nm for the cross-section [13]). Regarding the silica fiber (Figure 1c), the BET surface area of the silica fiber was only 7.10 m2 g−1. Moreover, the hysteresis loop of the N2 adsorption–desorption isotherm of the silica fiber was not observed (Figure 1a), which reflects the characteristics of non-porous materials [8]. To evaluate the phase of silica, Figure 1d shows the broad XRD peak at 2θ of 22° corresponded to the (101) plane of the amorphous silica for both the silica ball and silica fiber supports [8,14]. However, the peak intensity of the silica fiber was significantly lower than that of the silica ball, implying that the silica fiber had lower crystallinity. This was possibly due to the low calcination temperature (500 °C) for preparing the silica fiber. This phenomenon was also observed by Mitra et al. [14], and they explained that the calcination temperature affected the preferential growth of the silica crystallites. For the acidity of the silica supports, Table 1 shows that the silica fiber had higher acidity (0.587 mmol NH3/g) than the silica ball (0.162 mmol NH3/g). This was also a function of the preparation conditions [9].
For the Ni-based catalysts, the amount of Ni loading was controlled at 10–50 wt%, and the actual Ni content for each catalyst, as confirmed using ICP-OES analysis, was in good agreement (Table 2). It was observed that the surface area of the Ni/SB catalyst significantly decreased when the Ni loading was increased due to the partial blockage of the mesopores in the silica ball. To confirm the results from the N
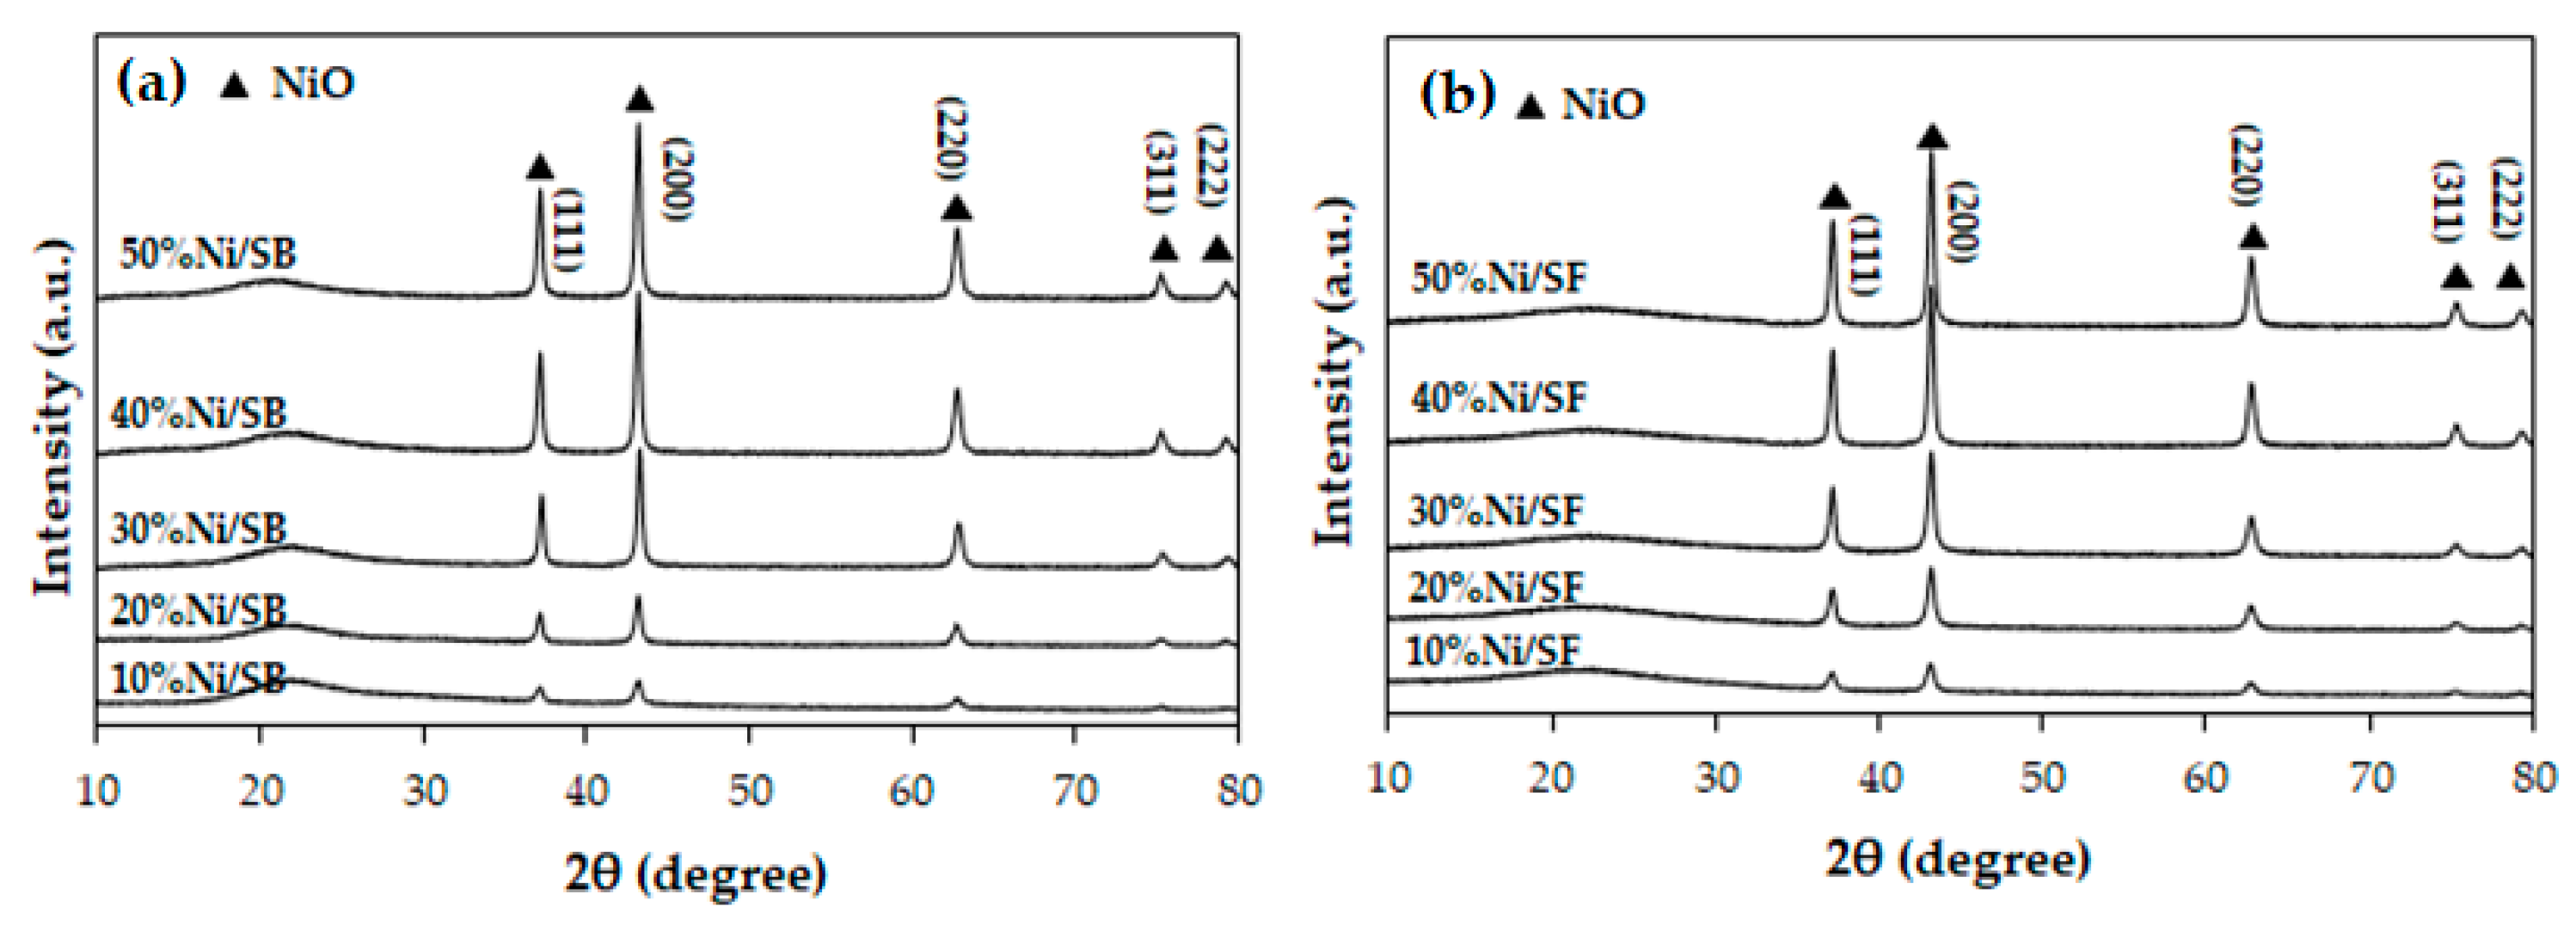
2 adsorption–desorption, the XRD analyses and SEM images of the calcined Ni-based catalysts are shown in Figure 2 and Figure 3, respectively. Regarding the XRD patterns, the cubic structures of the NiO phase in both calcined Ni/SB and Ni/SF catalysts are observed at 2θ of 37.3°, 43.3°, 62.9°, 75.4° and 79.4°, attributed to the (111), (200), (220), (311) and (222) planes, respectively [8]. Although the XRD pattern of the NiO phase was not affected by the shape of the silica support, the NiO crystallite size was dependent on the form of the silica. 
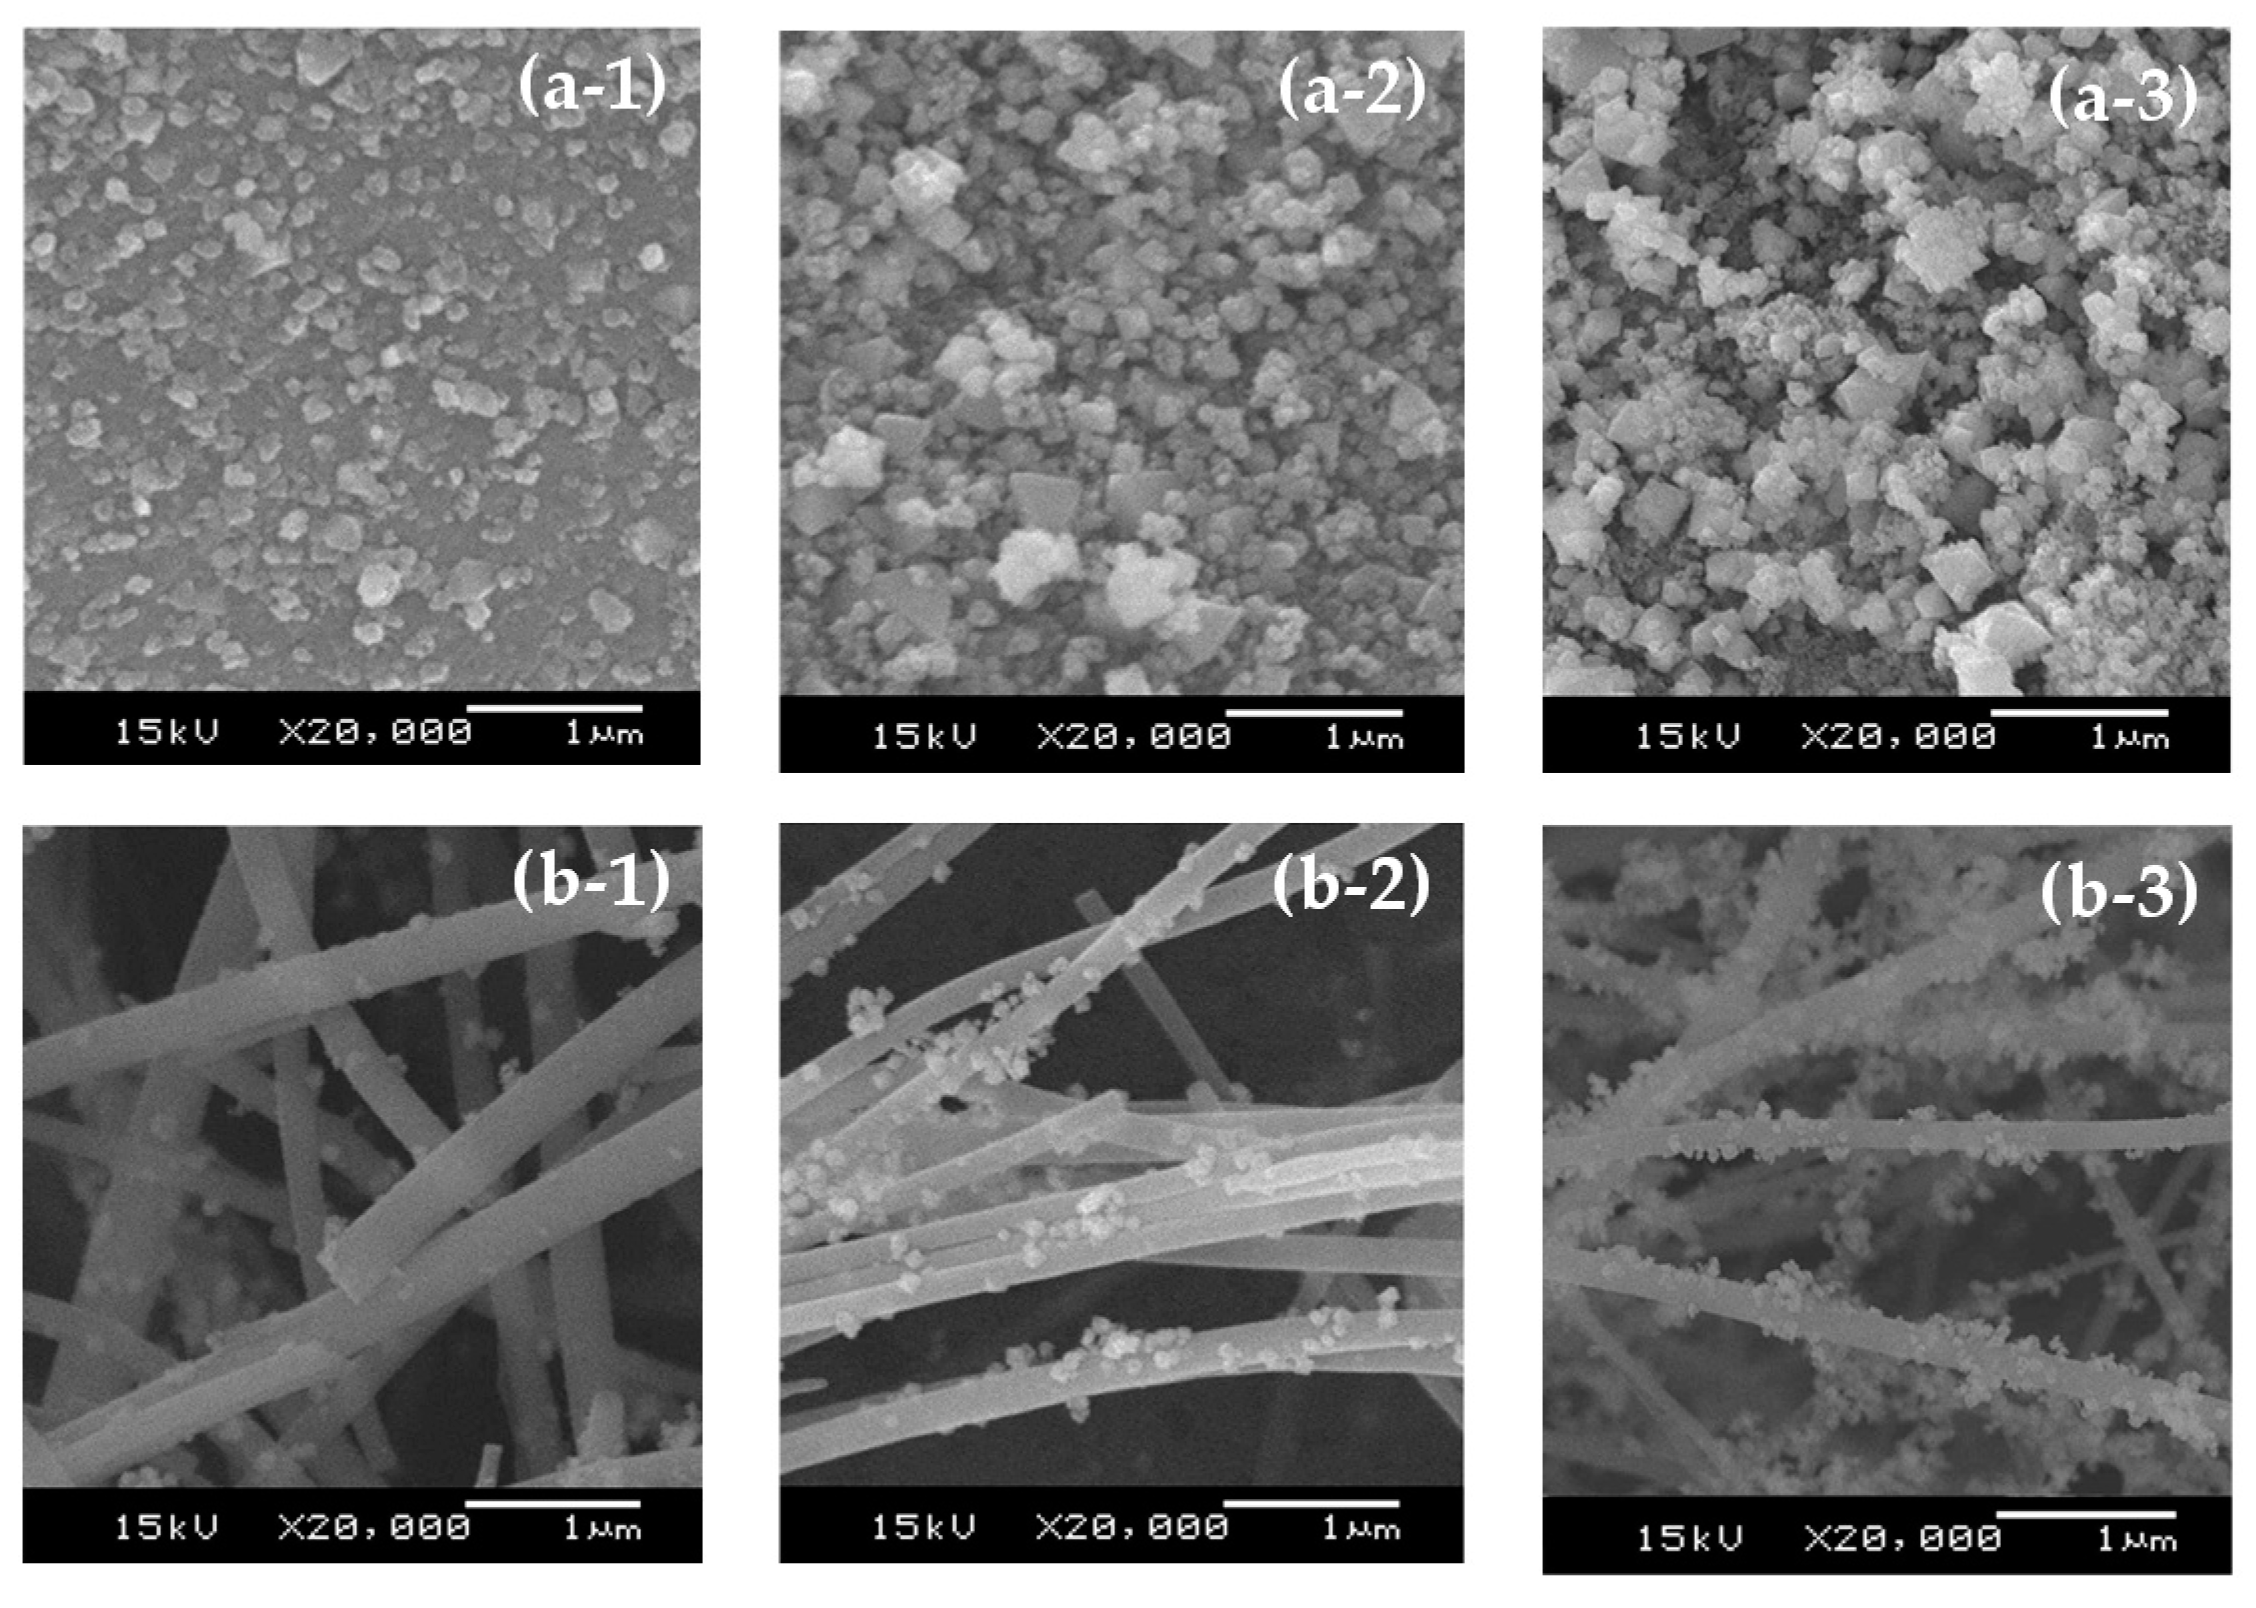
Table 2 indicated that the increase in the amount of Ni loading from 10–50 wt% for Ni/SB catalysts significantly enlarged the NiO crystallite size from 21.8 to 36.6 nm. It is possible that the porous characteristics of the silica ball could retard the diffusion of the Ni precursor solution, resulting in the agglomeration and formation of larger NiO particles on the outer surface of the silica ball, as seen in the SEM images (Figure 3(a-1–a-3)). This phenomenon, in general, has been previously observed for porous Ni/SiO2 catalysts prepared via impregnation using a high concentration of Ni aqueous solutions [15].
To consider the Ni/SF catalysts, the NiO particles deposited on the surface of the silica fiber induced the higher BET surface area from 7.10 to 10–12 m2 g−1. Although the pore volume and average pore diameter of Ni/SF catalysts could be calculated from the Barrett–Joyner–Halenda (BJH) desorption data, the fluctuate pore diameters with very small pore volume in the range of 0.01–0.03 cm3 g−1 were observed. These values were generated from the overlap of the fibers (Figure 3(b-1,b-2)) [8]. To detect the NiO crystallite size, this value slightly increased with increasing Ni loading levels, staying in the range of 21–24 nm. The clusters of agglomerated NiO particles were rarely observed, as shown in Figure 3(b-1–b-3). These results suggested that the silica fiber prevented the agglomeration of Ni and could thus be applied as a support in the preparation of catalysts requiring a high loading level of the active metals.
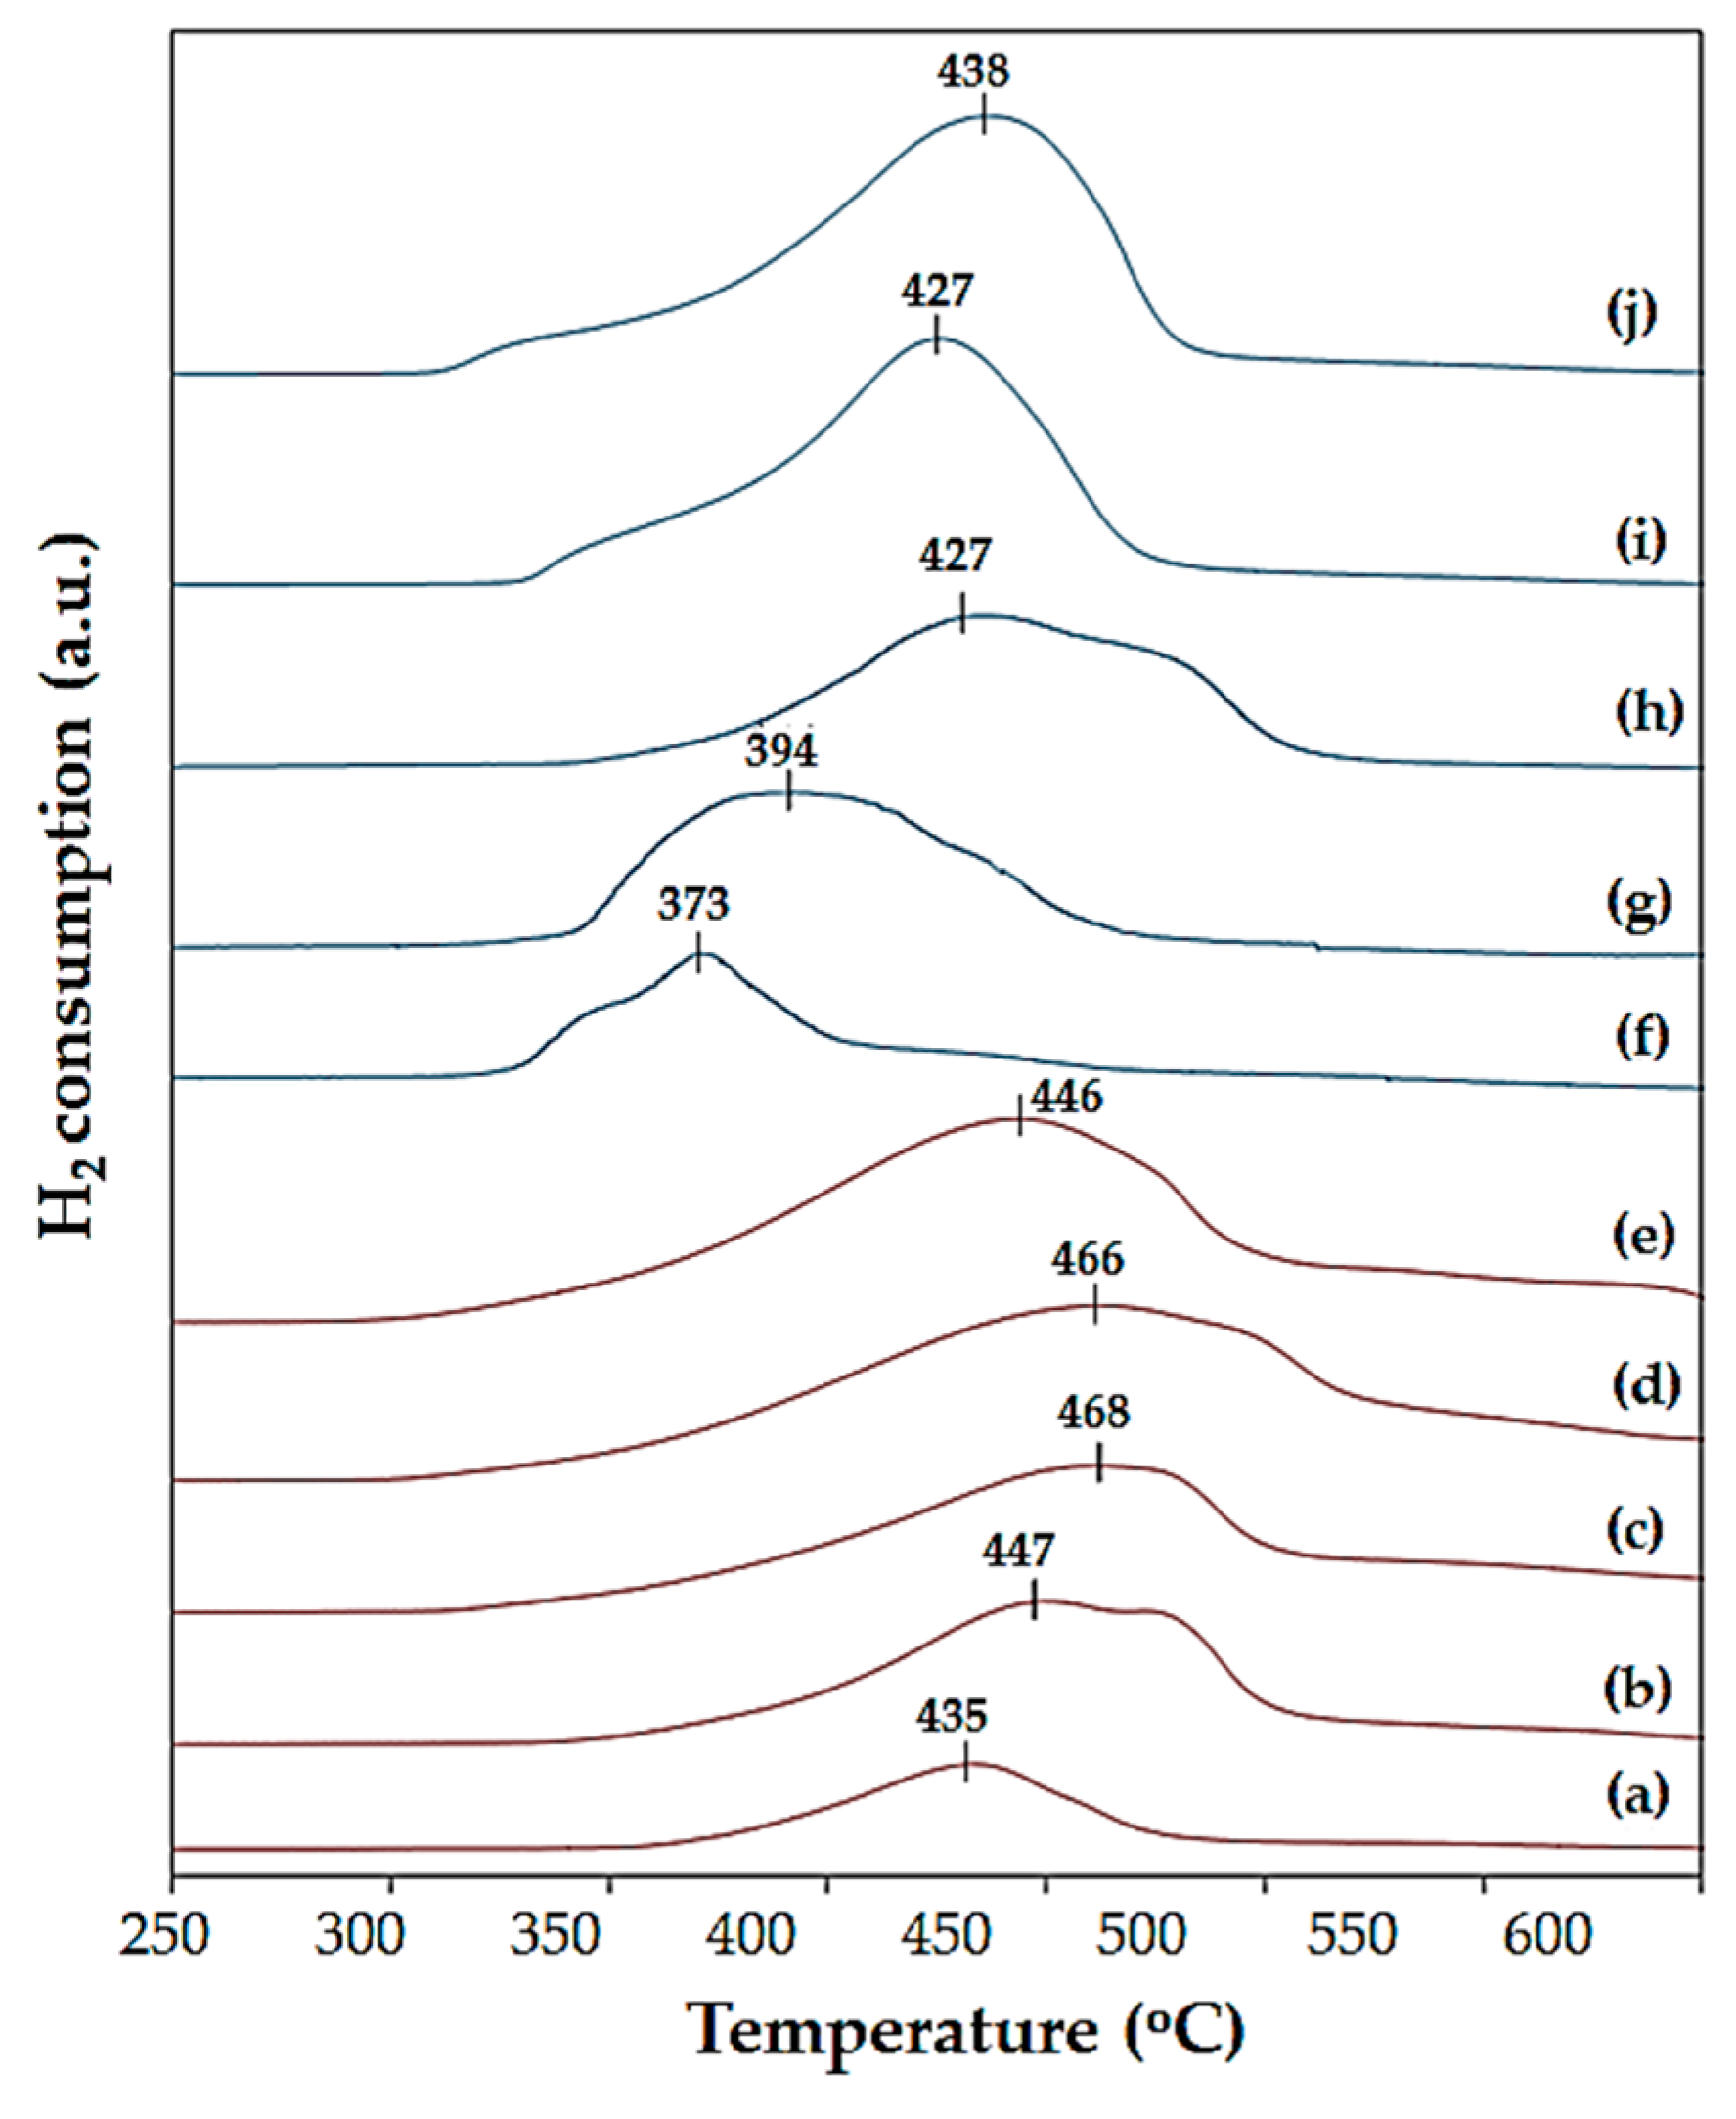
The reduction temperature of the calcined Ni catalysts was investigated using the H2-TPR technique as depicted in Figure 4. The reducibility of the Ni(II)O phase in all catalysts was also calculated by comparison of the total H2 consumption detected by the H2-TPR analysis and the theoretic value obtained from Ni(II)O + H2 → Ni(0) + H2O, as summarized in Table 2. From Figure 4, the H2-TPR profiles indicated that the maximum peak of H2 consumption for the reduction in NiO in the Ni/SB catalysts increased from 435 to 466 °C as the amount of NiO loading increased from 10 wt% to 40 wt% (Figure 4a–d). The reduction temperature lower than 578 °C indicated the weak interaction between NiO particles and the support [16]. The traditional impregnation on the porous support could also easily induce the uncontrolled size and dispersion of the metal on the surface of the supports [17]. The larger size of NiO particles might block the pores of catalysts resulting in the difficulty of H2 diffusion into the pores of catalyst. The higher reduction temperature was thus required to activate the NiO phase as the Ni active form. Although the H2 consumption of Ni/SB catalysts increased from 1.10 to 2.07 mmol gcat−1 with increasing the NiO content, it was not proportional to the level of Ni loading, resulting in the lower degree of reducibility from 63.3% to 30.9%. In the case of the 50 wt% Ni/SB catalyst, the results in Table 2 showed that the NiO crystallite size of the 50 wt% Ni/SB catalyst was 36.6 nm reflecting the weak interaction between the bulk NiO particles and silica ball [15]. It is possible that the precursor solution with a high Ni concentration hardly diffused into the pores of the support, resulting in the agglomeration of some portion of the NiO particles on the outer surface of the silica ball, which made their reduction easier at a lower temperature of 446 °C (Figure 4e). This phenomenon also provided the lowest H2 consumption (1.66 mmol gcat−1) and reducibility (22.6%). This explanation was also confirmed by the CO pulse chemisorption analysis. The results in Table 2 indicated that the Ni dispersion of Ni/SB catalysts was in the range of 1.3–3.4%, which depended on the amount of Ni loading and was slightly lower than that of Ni/SF catalysts (Ni dispersion = 1.9–3.4%). This implied that some of the Ni particles were agglomerated and mostly deposited on the outer surface of the silica ball at high Ni content.
Providing a comparison of the Ni/SF catalysts at similar Ni loading levels, Figure 4f–j shows that the maximum peak in the H2-TPR profiles for the calcined Ni/SF catalyst appeared in the range of 373–438 °C for 10–50 wt% Ni content, with a higher level of H2 consumption indicating a higher reduction in NiO particles [18]. It was also observed that the degree of reducibility was in the range of 66.7–76.5% (Table 1). The lower reduction temperature of the NiO phase in the Ni/SF catalysts compared to that of the porous catalysts was attributed from the open morphology of the NiO particles deposited on the surface of the silica fiber, which could provide a higher opportunity for a direct reaction with the reducing H2. Moreover, the weaker interaction between NiO particles and the silica fiber surface would facilitate the reduction of NiO to a Ni active phase [19].

2.2. Comparative Performance of the Ni/SF and Ni/SB Catalysts for the Partial Hydrogenation of FAME

To compare the catalytic performance of the Ni/SB and Ni/SF catalysts, the partial hydrogenation of palm oil-derived FAME was performed in a fixed-bed reactor after the in situ reduction of catalysts in the presence of H2 at 450 °C for 2 h. The central condition for the partial hydrogenation of FAME was conducted under 1 bar H2 pressure at 140 °C with the feed flow rate of H2 and FAME streams at 100 mL min−1 and 0.44 g min−1, respectively. The volume of the catalyst bed was controlled at ca. 5 cm3. According to the different bulk densities of the silica supports, the amount of applied Ni-based catalysts was kept constant at 1.97 and 0.40 g for the Ni/SB and Ni/SF catalysts, respectively.
The obtained liquid product was collected for 4 h and then sampled to analyze the C18 compositions, i.e., methyl stearate (C18:0), cis-methyl oleate (cis-C18:1), trans-methyl oleate (trans-C18:1), methyl linoleate (C18:2) and methyl linolenate (C18:3), using gas chromatography equipped with a flame ionization detector (GC-FID). 
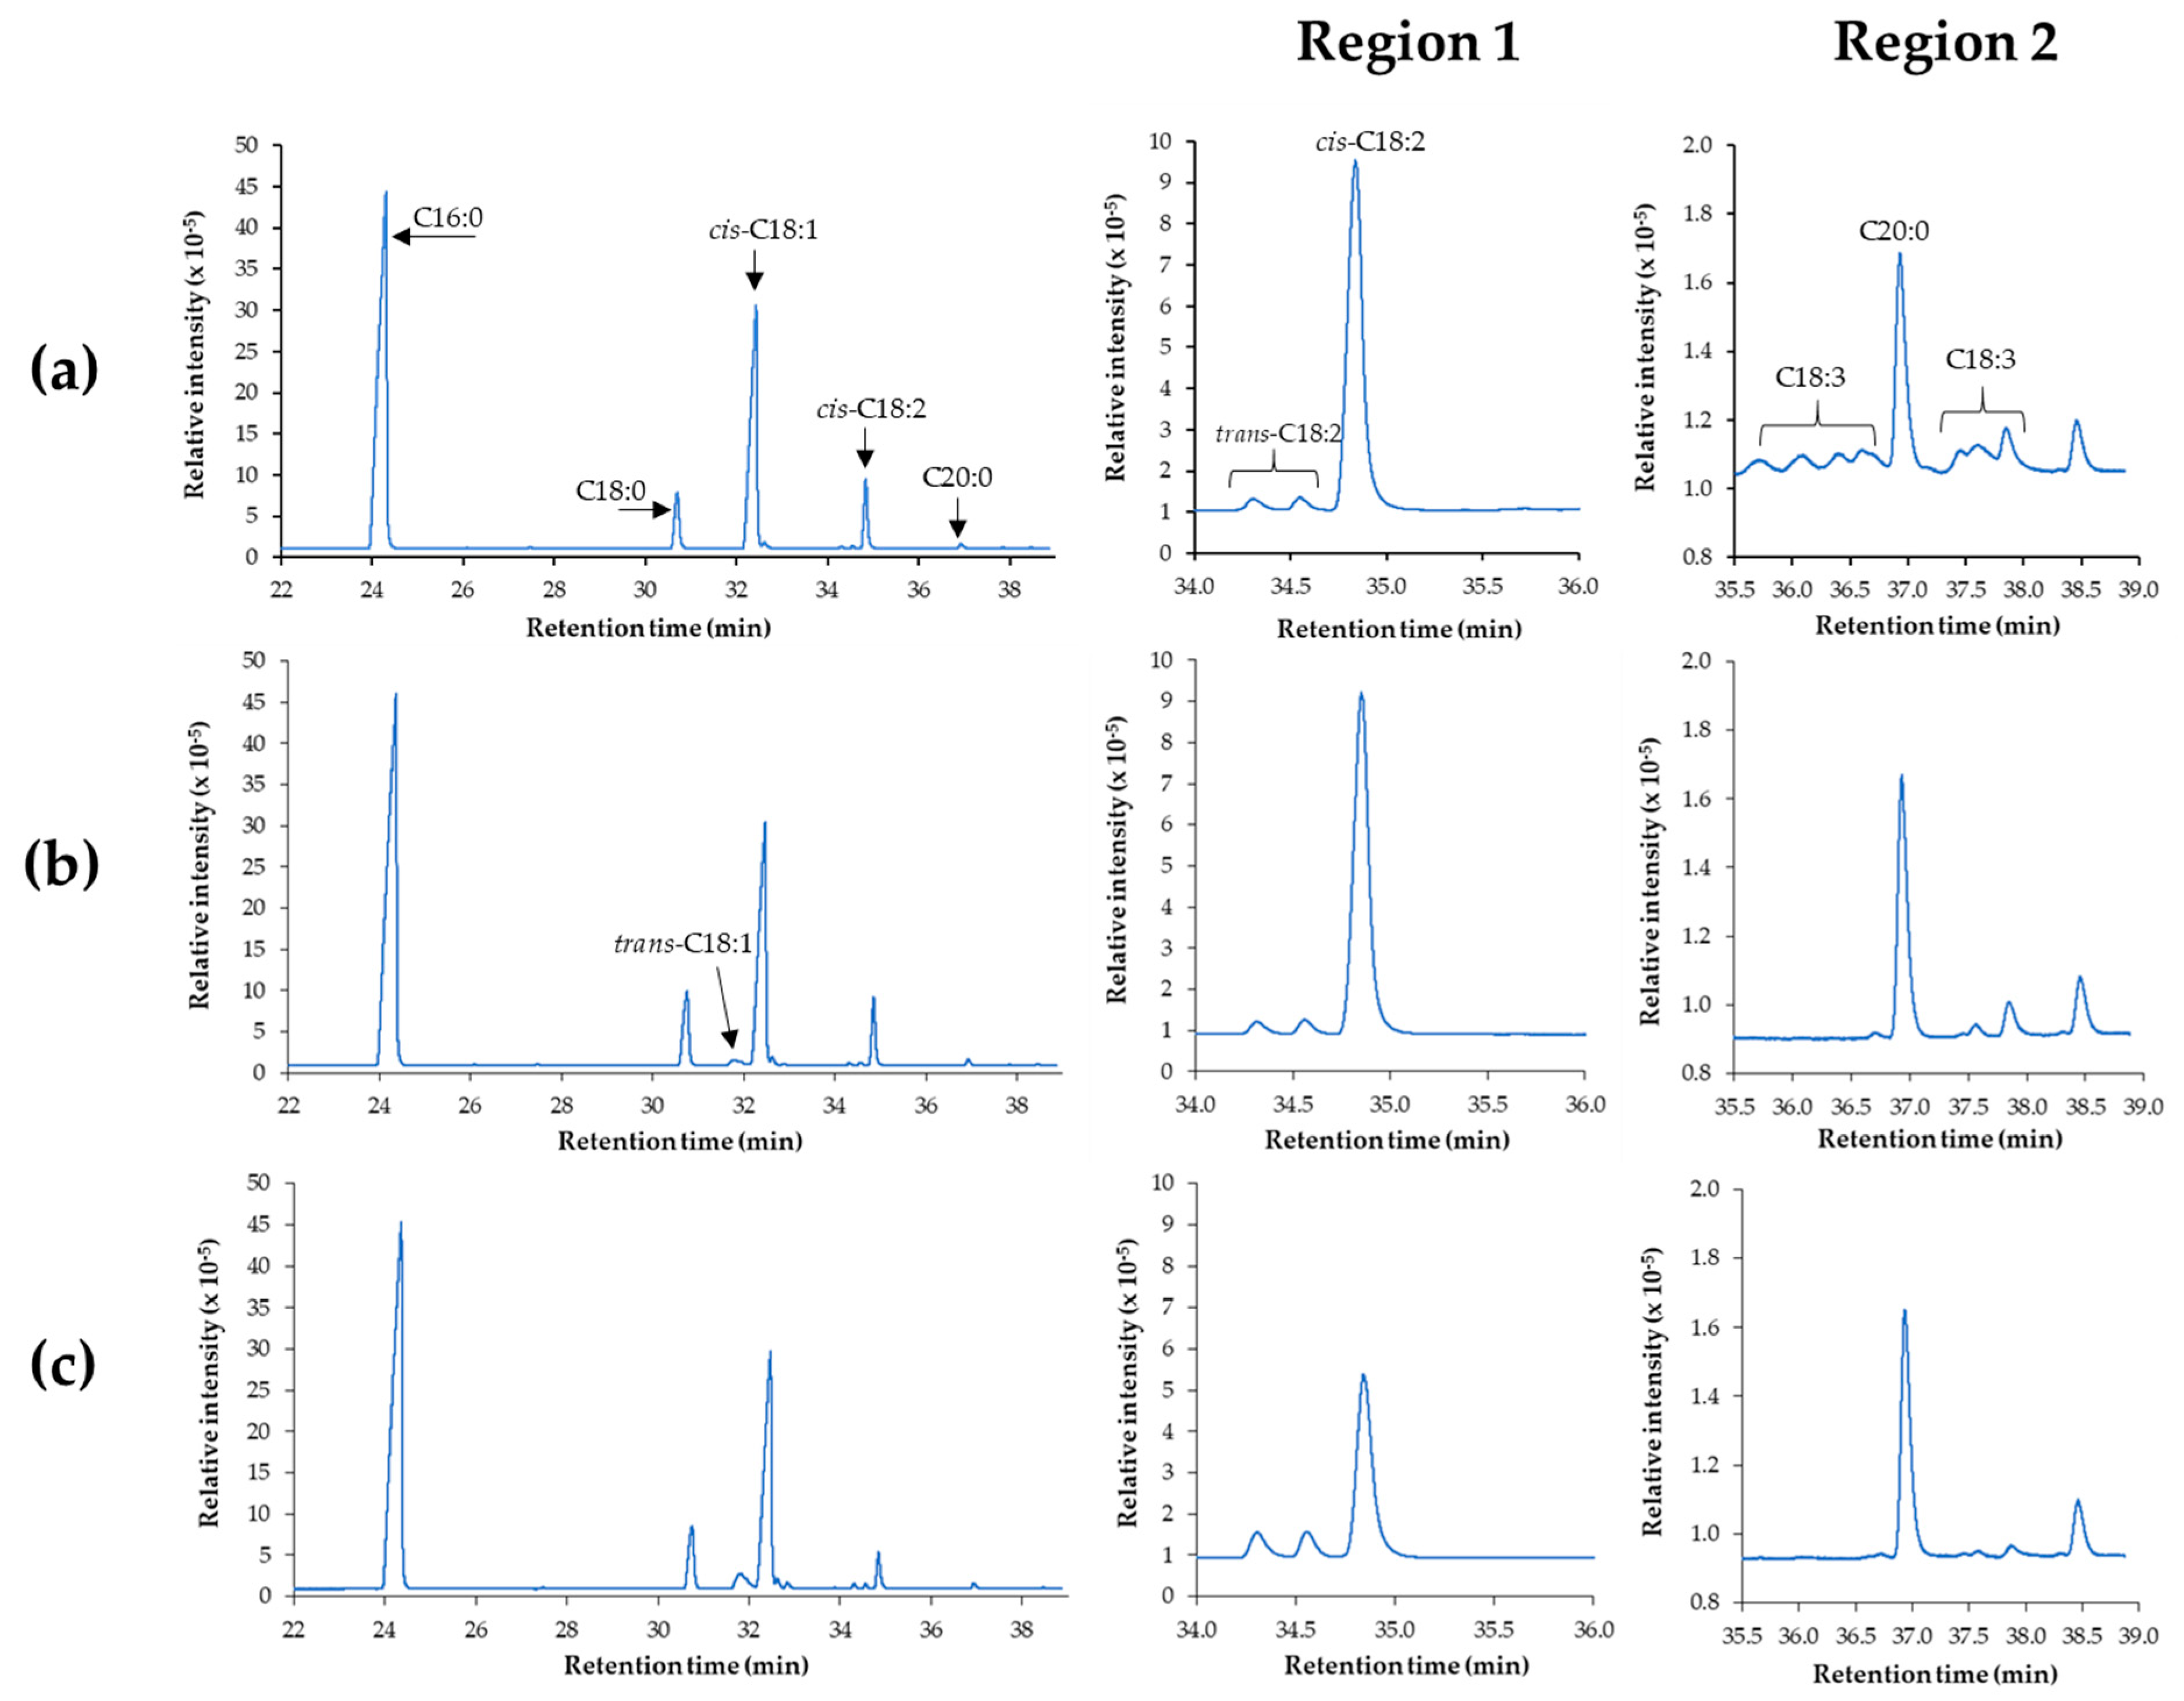
Figure 5a shows a representative GC chromatogram of the FAME, which indicated that it contained a high fraction of methyl palmitate (C16:0; 43.9 mol%) and cis-C18:1 (40.8 mol%) with smaller amounts of C18:0 (4.4 mol%), C18:2 (9 mol%) and C18:3 (0.4 mol%). Moreover, it was observed that the peak of C20:0 was eluted before some peaks of C18:3 due to the effect of the high polarity of the HP-88 column. This result was consistent with the previous literature that used CP-Sil 88 or SILAR columns [20,21]. Chen et al. [17] reported that the peaks of C18:3 appeared before the peak of C20:0 was in the form of a trans-structure, while C18:3 eluted after C20:0 contained both trans- and cis-configurations. Although the amounts of C18:2 and C18:3 were not large in this palm oil-derived FAME, they had to be minimized due to their fast oxidation rate [22]. The oxidation rate of linolenic acid containing three C=C bonds was reported to be 2500- and 25-fold greater than those for stearic and oleic acids, respectively [23,24]. After partial hydrogenation, the intensity of the cis-C18:2 and C18:3 peaks decreased with the formation of a small amount of the trans-C18:1 configuration, especially for the Ni/SF catalyst system (Figure 5b,c).
Based on the difference in the shape and bulk density of the catalysts affecting the total amount of the Ni active phase, the effects of the studied parameters on the activity of the Ni/SB and Ni/SF catalysts in converting the C18:2 structure in the partial hydrogenation of FAME was evaluated in terms of turnover frequency (TOF) calculated with Equation (1), which was adapted from the previous literature [3]:
TOF ( h 1 ) =     C 18 : 2   conversion   ( % ) 100 × FAME   feed   rate   ( g   h 1 ) × 1 MW C 18 : 2   actual   Ni   content   ( wt % ) 100 × Ni   dispersion   ( % ) 100 × W catalyst   ( g ) × 1 MW Ni
where MWC18:2 and MWNi are 294 and 58.69 g/mol, respectively. The actual Ni content in each catalyst and its dispersion degree were obtained from ICP-OES and CO pulse chemisorption techniques, respectively (see Table 2). The effect of reaction parameters such as Ni loading, H2 pressure and reaction temperature on TOF and C18 compositions are shown in Figure 6, Figure 7 and Figure 8.
Regarding the effect of the Ni loading, the Ni/SB catalysts (Figure 6a) exhibited a maximum TOF of 141 h−1 at 30 wt% Ni content. In addition, the degree of C18:0 content increased from 6.2 to 9.4%, while the amount of the cis-C18:1 configuration was reduced from 40.6 to 37.8% when the Ni content increased from 10 to 30 wt%. This indicated that some portion of the cis-C18:1 was converted to a C18:0 configuration. Although a high saturation level is beneficial for oxidation stability, over-saturation can increase the cloud point and pour point of the obtained H-FAME, resulting in the limitation for use in cold weather areas [3,5]. Thus, a monounsaturated FAME is preferred since it can balance the properties between oxidation stability and cold flow properties. When the amount of Ni in the Ni/SB catalyst increased to 40–50 wt%, the TOF value decreased to 72–79 h−1. This indicated that the high Ni loading level induced an oversize of the Ni crystallite structure and blocked the catalyst pores, resulting in the lower catalytic efficiency for hydrogenation or cis–trans isomerization.
In the comparison of the Ni/SF catalysts at similar Ni loadings, the results indicated in Figure 6b were in contrast to those for the Ni/SB catalysts (Figure 6a). The TOF values of the system using Ni/SF catalysts containing 10–30 wt% Ni loading increased from 488 to 1396 h−1, which was 6–9 times greater than those of Ni/SB catalysts at the same Ni content. Numwong et al. [9] explained that silica with higher acidity could promote the adsorption of unsaturated bonds in the FAME molecules at the Brønsted acid sites of the silica support. Therefore, not only the open morphology of Ni/SF catalysts could provide a higher direct interaction between FAME molecules and Ni active sites to decrease the reduction temperature, but the higher acidity of the silica fiber could also promote the strong adsorption of C18:2 in FAME, resulting in the higher activity for hydrogenation to achieve the greater TOF values. Moreover, the amount of the C18:0 structure also increased from 5.5 to 8.0–9.0 wt% with a constant level of the cis-C18:1 configuration (41–43 wt%). This implied that the Ni/SF catalyst having a low bulk density resulting in the small amount of catalyst weight at a given volume of the catalyst bed provided a shorter contact time and consequently inhibited the over-saturation of the monounsaturated FAME. Although the increased Ni loading enhanced the hydrogenation activity, since the bulk Ni particles could decrease the activation energy of H2 dissociation [25], the use of the Ni/SF catalyst with an overdose of Ni loading could not increase the reduction in the C18:2 fraction, resulting in the decrease in the TOF to 1248 and 1092 h−1 for 40 wt% Ni/SF and 50 wt% Ni/SF catalysts, respectively.
To consider the formation of the trans-C18:1 structure, the amount of the trans-configuration should be minimized during hydrogenation due to its higher melting point than the cis-structure at the same carbon number. This structure can remain in a solid form at room temperature and plug the fuel line in vehicles [26]. The results in Figure 6b indicated that Ni/SF catalysts containing 10–30 wt% Ni loading produced the lowest amount of the trans-C18:1 structure (1.3–2.9 mol%) in the obtained H-FAME. This was due to the effect of the non-porous support, which could suppress the trans-selectivity, as suggested in the previous work [9]. However, the increase in the Ni loading to 40–50 wt% only slightly increased the amount of trans-C18:1 to 4.6 mol%. This was possible because the larger metal crystallite size could induce the higher adsorption of unsaturated FAME on the metal surface and facilitate cis–trans isomerization during partial hydrogenation [3]. Thus, it can be concluded that the Ni/SF catalyst had high activity for partial hydrogenation to obtain H-FAME with high levels of monounsaturated structures, while also exhibiting low selectivity for cis–trans isomerization.
The effect of the H2 pressure on the hydrogenation of FAME at 140 °C was evaluated from 1–4 bar. Figure 7a shows that the increasing H2 pressure from 1 to 2 or 4 bar significantly enhanced the TOF value for the system using the 30 wt% Ni/SB catalyst from 141 to 405 or 440 h−1, respectively. This implied that a higher H2 pressure was required for the porous catalyst to overcome the mass transfer resistance. In addition, the higher H2 pressure provided a larger amount of H2 molecules, which accelerated hydrogenation [27]. In the case of the 30 wt% Ni/SF catalyst, the degree of TOF for this system increased from 1396 to 1485 or 1659 h−1 (only ca. 6–19%) when the H2 pressure increased from 1 to 2 or 4 bar (Figure 7b), respectively. This result also confirmed that the fibrous catalysts provided a greater accessibility to the Ni active sites for the reaction between H2 and FAME molecules to occur and achieve the high TOF values at atmospheric pressure. Although the increased H2 pressure enhanced the TOF for both catalytic systems, the obtained H-FAME contained a large amount of C18:0 (up to 18–20 wt%) with a significant reduction in the cis-C18:1 content, which would induce poor cold flow properties.
In the case of reaction temperature, the partial hydrogenation of FAME was generally operated in the range of 80–200 °C depending on the type of catalyst [3,5,10]. In this work, the reaction was performed using 30 wt% Ni/SB or 30 wt% Ni/SF under 1 bar H2 pressure. In the case of the Ni/SB catalyst system, Figure 8a showed that the increase in the reaction temperature from 100 to 200 °C slightly increased the TOF from 98 to 152 h−1. Although the increase in the reaction temperature could improve the mass transfer coefficient for H2 molecules from FAME to the catalyst surface [28], the conventional Ni-based porous catalysts still had low activity for partial hydrogenation under mild conditions [3]. This disadvantage of the porous Ni catalysts would be solved by using fibrous supports. Figure 8b indicates that the use of Ni/SF catalyst provided the enhancement of the TOF value from 478 to 1454 h−1 at the same reaction temperature range. This was due to the effect of the open geometry of the Ni active phase deposited on the SF surface, which could provide a higher accessibility of FAME and H2 molecules to be adsorbed and reacted on the surface of the catalyst. However, the use of higher reaction temperatures promoted the cis–trans isomerization to achieve the higher amount of the trans-C18:1 structure from 1.9 to 4.0 mol% [29].

2.3. Catalyst Stability of Ni/SF and Ni/SB Catalysts

The stability of the 30 wt% Ni/SB and 30 wt% Ni/SF catalysts was comparatively evaluated using a FAME feed rate of 0.44 g min−1 under 1 bar H2 at 140 °C. The samples of the H-FAME obtained from each catalyst system were collected every 1–2 h during the time on stream for 16 h, and the C18:2 conversion level was then analyzed. The FAME hydrogenation using the 30 wt% Ni/SB catalyst maintained a C18:2 conversion level of 26–28% throughout the course of the reaction (Figure 9). The 30 wt% Ni/SF catalyst exhibited a high C18:2 conversion level (70–71%) at the beginning of the reaction, but then the C18:2 conversion level declined, with longer reaction times down to ca. 61% after 16 h. To consider the cumulative C18:2 conversion, Figure 9 shows that the partial hydrogenation using the 30 wt% Ni/SB catalyst still maintained the cumulative C18:2 conversion at ca. 27% for the long period of operation. On the other hand, the cumulative C18:2 conversion of the system using the 30 wt% Ni/SF catalyst would be decreased to 27% when the reaction was allowed for 5.79 days. Above this point, the cumulative C18:2 conversion of the 30 wt% Ni/SF catalyst trended to be lower than that of the system using the 30 wt% Ni/SB catalyst.
The results from the analysis of the energy-dispersive X-ray fluorescence spectrometer (EDX) as shown in Table 3 indicated that FAME, used as the raw material of this research, had only Zn species (36 ppm), possibly due to the contaminant or nutrient in the palm oil feedstock used for FAME production [30,31]. After the partial hydrogenation, H-FAME obtained from the 30 wt% Ni/SF catalyst contained Ni particles of 93.9 ppm, whereas H-FAME obtained from the 30 wt% Ni/SB catalysts had no Ni species. Presumably, the open geometry with weaker metal–support interaction, as seen in the H2-TPR analysis (Figure 4) of Ni/SF catalysts, led the quick deactivation via agglomeration [19]. This could facilitate the loss of Ni particles from the surface of the support compared to that in the porous catalysts. Although the amount of silica could not be detected in all H-FAMEs, Chen et al. [5] reported that the amorphous nature of silica or alumina was slightly leached out under the mild hydrogenation condition. Thus, it was possible that the silica fiber having the lower degree of crystallinity than the commercial porous silica ball might have lower stability. According to the results obtained from the EDX analysis and the previous literature [5], the degree of crystallinity and the interaction between active metals and the surface of the silica fiber should be improved in order to increase the lifetime of the catalyst for applying in the commercialized scale of H-FAME production.

2.4. Properties of FAME before and after Partial Hydrogenation

Table 4 shows the properties of FAME and H-FAME at various C18:2 conversion levels, in terms of the heating value, thermal properties and oxidation stability. The partial hydrogenation did not affect the heating value of FAME due to the mild conditions applied in the partial hydrogenation, which did not promote the cracking reaction. The flash point of H-FAME was in the range of 180–184 °C, which was within the standard specification for biodiesel in global, reginal and national levels as declared in the Annex XXVIII subtask report [32]. Moreover, the oxidation stability of FAME was improved from 16 h to higher than 48 h when the C18:2 hydrogenation level was 85%. Thus, the H-FAME had high safety and could be stored longer. Although the palm oil FAME showed the higher oxidation stability, this behavior might be generated from the excess amounts of artificial antioxidants added into the oil feedstock during biodiesel production [5]. These antioxidants are harmful on the environment and biochemical systems. The use of partial hydrogenation is thus the effective technique to improve the oxidation stability of FAME with decreasing the volume of antioxidants. For the cold flow property, the high C18:2 conversion level caused the H-FAME to have a higher pour point, increasing from 16 to 24 °C, and thus it would not be suitable for use in cold weather areas. To solve this problem, the palm oil-derived H-FAME having high oxidation stability with poor cold flow properties may be combined with FAME obtained from different plant oils having good cold flow properties, but poor oxidation stability such as rapeseed and soybean oils in order to improve both the oxidation stability and cold flow properties of the obtained biofuels following the standard in each country [33].

3. Materials and Methods

3.1. Preparation of the Silica Fiber

The silica fiber was synthesized via sol–gel electrospinning using a warm mixture consisting of tetraethylorthosilicate TEOS (Sigma-Aldrich, Saint Louis, MO, USA), deionized water, ethanol (AR grade, DUKSAN Co., Ansan-si Gyeonggi-do, Korea) and hydrochloric acid (37 wt%, QReC) at a 1:2:2:0.01 mole ratio, as previously described [11]. The obtained silica sol solution was transferred into a 5-mL syringe consisting of a stainless-steel capillary metal hub needle size 27G in the electrospinning equipment. The injection flow rate of 4 mL h−1 was controlled using a syringe pump (KDS 100, KD Scientific Inc., Holliston, MA, USA). The voltage power supplier operated at a constant 15 kV and 50 mA and was attached to the syringe. The distance between the needle tip to the collector covered by aluminum foil was 15 cm. After collection, the silica fiber was dried in an oven at 100 °C overnight and then calcined at 500 °C for 2 h with a heating rate of 10 °C min−1 (bulk density = 0.08 g cm−3; diameter of silica fiber = 320 ± 80 nm).

3.2. Preparation of the Ni-Based Catalysts

The Ni/SB and Ni/SF catalysts were prepared via incipient wetness impregnation and wet impregnation, respectively, using a nickel (II) nitrate hexahydrate (Ni(NO3)2·6H2O, AR grade, Ajax Finechem Pty Ltd., Taren Point, Australia) solution at various concentrations (0.36–4.54 M) depending on the desired Ni loading level of the catalyst. For the Ni/SB catalysts, 5 mL Ni(NO3)2·6H2O solution of the desired Ni content was dropped onto the 5 g dry commercial silica ball (CARiACT Q10 (Fuji Silysia Chemical Co., Ltd., Kasugai Aichi, Japan); ∅ = 1.18–2.36 mm, bulk density = 0.41 g cm−3) and then dried using a rotary evaporator at 60 °C for 2 h. For the Ni/SF catalyst, 1 g silica fiber was immersed in 3 mL of the Ni(NO3)2·6H2O solution at the desired Ni concentration for 24 h on a glass plate. The obtained Ni/SB and Ni/SF catalysts were then calcined in air at 500 °C for 2 h before use.

3.3. Catalyst Characterization

The Brunauer–Emmett–Teller specific surface area of each sample was determined from nitrogen (N2) adsorption–desorption measured by Micromerritics® (ASAP 2020 V4.00, Norcross, GA, USA) at −196 °C. The average pore diameter and the total pore volume of all samples were calculated from Barrett–Joyner–Halenda (BJH) desorption data. The samples in the bead or fiber form (0.1 g) were dried with N2 purging in a vacuum applying elevated temperatures at 350 °C and 10 μmHg for 2 h before analysis.
The acidity of the silica supports was measured by the ammonia temperature-programmed desorption (NH3-TPD) technique performed by the Belcat-Basic Chemisorption analyzer (Belcat II, BEL Microtrac Co., Ltd., Tokyo, Japan). The samples (0.05 g) were treated under He gas at a flow rate of 50 mL min−1 at 500 °C for 30 min. Then, the temperature was decreased to 100 °C before the injection of a 5/95 (v/v) NH3/He gas mixture (Bangkok Industrial Gas Co., Ltd., Bangkok, Thailand) at the same flow rate into the testing chamber, this temperature was maintained for 30 min. The temperature to desorb the adsorbed ammonia on the catalyst surface was raised to 700 °C at a heating rate of 10 °C min−1 and held for 20 min. The amount of ammonia eluted from the catalyst surface was determined by using a thermal conductivity detector (TCD).
The structure and crystallinity of the supports and Ni-based catalysts were detected using X-ray diffractometry (XRD). The XRD patterns were collected on a Bruker D8 advance system (Fällanden, Switzerland) using Cu-Kα radiation (λ = 0.154 nm), operated at 40 kV and 40 mA, respectively. The scanning speed was 10° min−1 in a 2θ range of 10–80°.
The morphology of the silica fiber and prepared catalysts was analyzed using SEM (JEOL Model JSM6480LV, Tokyo, Japan) operated at 15 kV. The samples were coated with a thin layer of gold before the measurement. The catalyst samples (0.03 g) were crushed to a fine powder before analysis, and then they were suspended in methanol (2 mL) under ultrasonic vibration.
The actual content of Ni particles of catalysts was determined using inductively coupled plasma-optical emission spectrometry (ICP-OES; SPECTRO Model CIROS VISION, Kleve, Germany). Before analysis, the catalyst sample (20 mg) was digested in 1 L of 2% nitric acid solution. Then, the amount of digested Ni in the acid solution was obtained from the calibration curve prepared from the plasma-grade single-element standards.
The reduction temperature of the Ni-based catalysts was evaluated using temperature-programmed reduction (TPR) performed by Belcat-Basic Chemisorption analyzer (Belcat II, BEL Microtrac Co., Ltd., Tokyo, Japan) equipped with a thermal conductivity detector. The catalyst (0.1 g) was placed into the quartz tube reactor and pretreated under an argon (Ar) atmosphere (30 mL min−1), heated at 10 °C min−1 to 200 °C and held for 1 h to remove the impurities on the catalyst surface. The pretreated sample was then reduced in the presence of a 5/95 (v/v) H2/Ar mixture at a flow rate of 30 mL min−1 and was heated from room temperature to 600 °C at 10 °C min−1.
The Ni dispersion on the prepared supports was also investigated using pulse CO chemisorption (Belcat II, BEL Microtrac Co., Ltd., Tokyo, Japan). Prior to measurement, the catalyst sample (50 mg) was placed in the quartz tube reactor and sequentially pretreated by helium (He; 20 min) and H2 (120 min) at a flow rate of 30 mL min−1 and a temperature of 450 °C. The sample was then cooled to 50 °C in a He atmosphere. Pulses of 10/90 (v/v) CO/He were injected at this temperature into the quartz reactor until no more CO was adsorbed. The Ni dispersion and Ni crystallite size were calculated from the CO uptake by assuming a chemisorption stoichiometry of CO/Ni as 1/1 (one CO molecule was chemisorbed on the surface of one Ni atom [34]).

3.4. Partial Hydrogenation of FAME

The reaction was performed in a stainless steel fixed-bed reactor (L = 300 mm and inner diameter = 12.7 mm) in the presence of 1–4 bar H2 pressure (99.99% purity purchased from Bangkok Industrial Gas Co., Ltd., Bangkok, Thailand) at 75–200 °C. Before hydrogenation, the Ni/SB or Ni/SF catalysts were packed in the reactor. The amounts of the Ni/SB and Ni/SF catalysts were kept constant at 1.97 and 0.40 g, respectively (the volume of the catalyst bed was controlled at ca. 5 cm3). They were then in situ reduced at 450 °C for 2 h under H2 at a flow rate of 100 mL min−1. When the reactor was cooled to the desired reaction temperature, FAME (Grade CP16 obtained from Bangchak Corporation Public Co., Ltd., Bangkok, Thailand) was fed into the reactor using a HPLC pump (Interchim, Series I, Los Angeles, USA) at 0.50 mL min−1 (0.44 g min−1). The obtained H-FAME was accumulated in the container during the course of the reaction. After 4 h of reaction time, the H-FAME in the container was sampled to determine its composition and properties.

3.5. Analysis of Compositions and Properties of FAME and H-FAME

The conversion of diunsaturated FAME (C18:2) and the amounts of the cis- and trans-configurations of monounsaturated (C18:1) in the H-FAME were identified using GC-FID (Agilent Technologies Inc., Santa Clara, CA, USA) equipped with a 100 m × 0.25 mm HP-88 fused-silica capillary column. The carrier gas was He (99.99% purity) at a flow rate of 2.4 mL min−1. The sample was quantified by injecting 1 µL. The oven temperature was increased from 130 to 230 °C at a heating rate 2 °C min−1 and held at this temperature for 10 min. The injector and detector were kept at 200 and 230 °C, respectively, with a split ratio of 100:1. The composition of FAME and H-FAME was identified and calculated from the peak area fraction by reference to the retention time.
The oxidative stability of FAME and H-FAME was tested using a Metrohm 743 Rancimat (Herisau, Switzerland) according to the EN 14,112 procedure. The sample was put in the tube and heated at 110 °C under a constant air flow rate of 10 L h−1. During the oxidation, the generated volatile acid compounds were adsorbed in the deionized water in the conductimetric measuring vessel of the Rancimat device and the increased conductivity of the solution was recorded. The pour point of FAME before and after partial hydrogenation was also investigated using a pour/cloud point tester (NORMLAB, Ankara, Turkey) according to ASTM D6749. The HV of FAME and H-FAME was evaluated using a bomb calorimeter (Parr Model 6200, Parr Instrument Company, Moline, IL, USA). The traces of metals in FAME before and after partial hydrogenation were also detected by using an energy-dispersive X-ray fluorescence spectrometer (EDX-720, Shimadzu, Kyoto, Japan).

4. Conclusions

Ni supported on an electrospun silica fiber was determined as one of the effective catalysts for the partial hydrogenation of FAME in a continuous fixed-bed reactor. It was observed that the TOF values of the system using Ni/SF catalysts containing 10–50 wt% Ni loading were in the range of 488–1396 h−1, which was higher than that using Ni/SB catalysts (78–114 h−1) when the reaction was performed under 1 bar H2 pressure at 140 °C with a FAME feed rate of 0.44 g min−1. This was due to the effect of the open morphology of the Ni/SF catalyst, which could provide a lower reduction temperature with weaker metal–support interaction and greater accessibility of FAME and H2 molecules to the Ni active metals. Moreover, the higher acidity of the silica fiber possibly enhanced the strong adsorption of the unsaturated portion in the FAME molecules, resulting in a higher catalytic efficiency for partial hydrogenation. Compared with the Ni/SB catalyst, the Ni/SF catalyst also generated higher levels of the cis-C18:1 isomer with a lower level of the undesired trans-C18:1 configuration (<5 mol%) in the obtained H-FAME. The long-term reaction operation of 16 h showed a slight decline in C18:2 conversion from 71 to 60% for the partial hydrogenation of FAME over the 30 wt% Ni/SF catalyst, which was due to the ease of Ni particle loss from the surface of the silica fiber. Nonetheless, the obtained C18:2 conversion was still higher than that of the system catalyzed by the 30 wt% Ni/SB catalyst. When analyzing the H-FAME properties, partial hydrogenation significantly improved the oxidative stability without affecting the heating value of FAME. However, the H-FAME with over-saturation had a higher pour point, which limits its use in colder regions. Thus, the development of an H-FAME structure with favorable cold flow properties needs be studied in the future for application in all areas.

Author Contributions

S.P. carried out the catalyst preparation, experimental tests and characterization of catalysts and products; P.R. provided the chemicals and technique for SF preparation; P.K. provided the fixed bed reactor for doing the partial hydrogenation; C.N. reviewed and edited the manuscript. N.H. designed the experiment, analyzed data and wrote the manuscript. All authors have read and agreed to the published version of the manuscript.

Funding

This research was funded by Energy Policy and Planning Office (EPPO), Ministry of Energy (ENCOFUND: 459042–AE2) and Center of Excellence on Petrochemical and Materials Technology, Chulalongkorn University. The funding from Graduated School, Chulalongkorn University supported for doing the experiment at the National University of Singapore (NUS). The financial support from the Thailand Science Research and Innovation (TSRI) under the International Research Network: Functional Porous Materials for Catalysis and Adsorption (Contract No. IRN61W0003) is also acknowledged.

Acknowledgments

The authors would like to gratefully acknowledge to Ning Yan and Max J. Huelsey at the National University of Singapore (NUS) for providing the access of analytical equipment and valuable suggestions throughout this research. The authors also thank Robert Douglas John Butcher (Office of Research Affairs, Chulalongkorn University) for English language editing.

Conflicts of Interest

The authors declare no conflict of interest.

References

  1. Mohd Noor, C.W.; Noor, M.M.; Mamat, R. Biodiesel as alternative fuel for marine diesel engine applications: A review. Renew. Sustain. Energy Rev. 2018, 94, 127–142. [Google Scholar] [CrossRef]
  2. Barnwal, B.K.; Sharma, M.P. Prospects of biodiesel production from vegetable oils in India. Renew. Sustain. Energy Rev. 2005, 9, 363–378. [Google Scholar] [CrossRef]
  3. Thunyaratchatanon, C.; Jitjamnong, J.; Luengnaruemitchai, A.; Numwong, N.; Chollacoop, N.; Yoshimura, Y. Influence of Mg modifier on cis-trans selectivity in partial hydrogenation of biodiesel using different metal types. Appl. Catal. A Gen. 2016, 520, 170–177. [Google Scholar] [CrossRef]
  4. Shin, H.-Y.; Ryu, J.-H.; Bae, S.-Y.; Kim, Y.C. Biodiesel production from highly unsaturated feedstock via simultaneous transesterification and partial hydrogenation in supercritical methanol. J. Supercrit. Fluids 2013, 82, 251–255. [Google Scholar] [CrossRef]
  5. Chen, S.-Y.; Attanatho, L.; Mochizuki, T.; Abe, Y.; Toba, M.; Yoshimura, Y.; Kumpidet, C.; Somwonhsa, P.; Lao-ubol, S. Upgrading of palm biodiesel fuel over supported palladium catalysts. C. R. Chim. 2016, 19, 1166–1173. [Google Scholar] [CrossRef]
  6. Krstić, J.; Gabrovska, M.; Lončarević, D.; Nikolova, D.; Radonjić, V.; Vukelić, N.; Jovanovic, D.M. Influence of Ni/SiO2 activity on the reaction pathway in sunflower oil hydrogenation. Chem. Eng. Res. Des. 2015, 100, 72–80. [Google Scholar] [CrossRef]
  7. Thunyaratchatanon, C.; Luengnaruemitchai, A.; Chollacoop, N.; Yoshimura, Y. Catalytic upgrading of soybean oil methyl esters by partial hydrogenation using Pd catalysts. Fuel 2016, 163, 8–16. [Google Scholar] [CrossRef]
  8. Prasongthum, N.; Xiao, R.; Zhang, H.; Tsubaki, N.; Natewong, P.; Reubroycharoen, P. Highly active and stable Ni supported on CNTs-SiO2 fiber catalysts for steam reforming of ethanol. Fuel Process. Technol. 2017, 160, 185–195. [Google Scholar] [CrossRef]
  9. Numwong, N.; Luengnaruemitchai, A.; Chollacoop, N.; Yoshimura, Y. Effect of SiO2 pore size on partial hydrogenation of rapeseed oil-derived FAMEs. Appl. Catal. A Gen. 2012, 441–442, 72–78. [Google Scholar] [CrossRef]
  10. Zhu, T.; Zhang, L.; Li, Z.; Wei, G.; Xin, Z.; Luo, B. Synthesis of bentonite-based nickel catalyst using [Ni(NH3)6](NO3)2 as precursor for enhanced hydrogenation of biodiesel. Mater. Lett. 2019, 256, 126585. [Google Scholar] [CrossRef]
  11. Klaigaew, K.; Samart, C.; Chaiya, C.; Yoneyama, Y.; Tsubaki, N.; Reubroycharoen, P. Effect of preparation methods on activation of cobalt catalyst supported on silica fiber for Fischer–Tropsch synthesis. Chem. Eng. J. 2015, 278, 166–173. [Google Scholar] [CrossRef]
  12. Salmi, T.; Mäki-Arvela, P.; Toukoniitty, E.; Kalantar Neyestanaki, A.; Tiainen, L.-P.; Lindfors, L.-E.; Sjöholm, R.; Laine, E. Liquid-phase hydrogenation of citral over an immobile silica fibre catalyst. Appl. Catal. A Gen. 2000, 196, 93–102. [Google Scholar] [CrossRef]
  13. Dvoyashkin, M.; Wilde, N.; Haase, J.; Gläser, R. Diffusion of methyl oleate in hierarchical micro-/mesoporous TS-1-based catalysts probed by PFG NMR spectroscopy. RSC Adv. 2018, 8, 38941–38944. [Google Scholar] [CrossRef] [Green Version]
  14. Mitra, J.; Ghosh, M.; Bordia, R.K.; Sharma, A. Photoluminescent electrospun submicron fibers of hydrid organosiloxane and derived silica. RSC Adv. 2013, 3, 7591–7600. [Google Scholar] [CrossRef]
  15. Le, T.A.; Kang, J.K.; Park, E.D. Active Ni/SiO2 catalysts with high Ni content for benzene hydrogenation and CO methanation. Appl. Catal. A Gen. 2019, 581, 67–73. [Google Scholar] [CrossRef]
  16. Ma, H.; Zeng, L.; Tian, H.; Li, D.; Wang, X.; Li, X.; Gong, J. Efficient hydrogen production from ethanol steam reforming over La-modified ordered mesoporous Ni-based catalysts. Appl. Catal. B Environ. 2016, 181, 321–331. [Google Scholar] [CrossRef]
  17. Mhadmhan, S.; Natewong, P.; Prasongthum, N.; Samart, C.; Reubroycharoen, P. Investigation of Ni/SiO2 fiber catalysts prepared by different methods on hydrogen production from ethanol steam reforming. Catalysts 2018, 8, 319. [Google Scholar] [CrossRef] [Green Version]
  18. Daroughegi, R.; Meshkani, F.; Rezaei, M. Characterization and evaluation of mesoporous high surface area promoted Ni-Al2O3 catalysts in CO2 methanation. J. Energy Inst. 2020, 93, 482–495. [Google Scholar] [CrossRef]
  19. Zhang, R.; Xia, G.; Li, M.; Wu, Y.; Nie, H.; Li, D. Effect of support on the performance of Ni-based catalyst in methane dry reforming. J. Fuel Chem. Technol. 2015, 43, 1359–1365. [Google Scholar] [CrossRef]
  20. Chen, Y.; Yang, Y.; Nie, S.; Yang, X.; Wang, Y.; Yang, M.; Li, C. The analysis of trans fatty acid profiles in deep frying palm oil and chicken fillets with an improved gas chromatography method. Food Control. 2014, 44, 191–197. [Google Scholar] [CrossRef]
  21. Markom, M.; Singh, H.; Hasan, M. Supercritical CO2 fractionation of crude palm oil. J. Supercrit. Fluids 2001, 20, 45–53. [Google Scholar] [CrossRef]
  22. Kim, J.K.; Jeon, C.H.; Lee, H.W.; Park, Y.K.; Min, K.; Hwang, I.; Kim, Y.M. Effect of accelerated high temperature on oxidation and polymerization of biodiesel from vegetable oils. Energies 2018, 11, 3514. [Google Scholar] [CrossRef] [Green Version]
  23. Shahidi, F.; Zhong, Y. Lipid oxidation and improving the oxidative stability. Chem. Soc. Rev. 2010, 39, 4067–4079. [Google Scholar] [CrossRef]
  24. Deman, J.M. Principles of Food Chemistry, 3rd ed.; Aspen Publishers, Inc.: Gaithersburg, MD, USA, 1999; pp. 33–110. [Google Scholar]
  25. Yan, P.; Li, M.M.-J.; Kennedy, E.; Adesina, A.; Zhao, G.; Setiawan, A.; Stockenhuber, M. The role of acid and metal sites in hydrodeoxygenation of guaiacol over Ni/Beta catalysts. Catal. Sci. Technol. 2020, 10, 810–825. [Google Scholar] [CrossRef]
  26. Demirbas, A. Thermal degradation of fatty acids in biodiesel production by supercritical methanol. Energy Explor. Exploit. 2007, 25, 63–70. [Google Scholar] [CrossRef] [Green Version]
  27. Numwong, N.; Luengnaruemitchai, A.; Chollacoop, N.; Yoshimura, Y. Partial hydrogenation of polyunsaturated fatty acid methyl esters over Pd/activated carbon: Effect of type of reactor. Chem. Eng. J. 2012, 210, 173–181. [Google Scholar] [CrossRef]
  28. Alsobaai, A.M.; Shaibani, A.M.A.; Moustafa, T.; Derhem, A. Effect of hydrogenation temperature on the palm mid-fraction fatty acids composition and conversion. J. King Saud Univ. Eng. Sci. 2012, 24, 45–51. [Google Scholar] [CrossRef] [Green Version]
  29. Li, C.; Zhang, Y.; Li, S.; Wang, G.; Xu, C.; Deng, Y.; Wang, S. Mechanism of formation of trans fatty acids under heating conditions in triolein. J. Agric. Food Chem. 2013, 61, 10392–10397. [Google Scholar] [CrossRef]
  30. Olafisoye, O.B.; Fatoki, O.S.; Oguntibeju, O.O.; Osibote, O.A. Accumulation and risk assessment of metals in palm oil cultivated on contaminated oil palm plantation soils. Toxicol. Rep. 2020, 7, 324–334. [Google Scholar] [CrossRef]
  31. Donough, C.R.; Cahyo, A.; Wandri, R.; Fisher, M.; Oberthür, T. Plant nutrients in palm oil. Better Crops 2016, 100, 19–22. [Google Scholar]
  32. Outlook on Standardization of Alternative Vehicle Fuels. Available online: https://amf-tcp.org/app/webroot/files/file/Annex%20Reports/AMF_Annex_28_standardisation.pdf (accessed on 22 October 2019).
  33. Zuleta, E.C.; Baena, L.; Rios, L.A.; Calderón, J.A. The oxidative stability of biodiesel and its impact on the deterioration of metallic and polymeric materials: A review. J. Braz. Chem. Soc. 2012, 23, 2159–2175. [Google Scholar] [CrossRef] [Green Version]
  34. Geyer, R.; Hunold, J.; Keck, M.; Kraak, P.; Pachulski, A.; Schödel, R. Method for determining the metal crystallite size of Ni supported catalysts. Chem. Ing. Tech. 2012, 84, 160–164. [Google Scholar] [CrossRef]
Figure 1. Characterization of the silica supports: (a) N2 adsorption–desorption isotherms of silica ball and silica fiber; (b) pore size distribution of silica ball evaluated by the BJH method; (c) SEM image of silica fiber (10,000× magnification) and (d) XRD patterns of silica ball and silica fiber.
Catalysts 10 00993 g001
Figure 2. XRD patterns of (a) Ni/SB and (b) Ni/SF catalysts containing various contents of Ni loading.
Catalysts 10 00993 g002
Figure 3. SEM images (20,000× magnification) for (a) Ni/SB and (b) Ni/SF catalysts containing: (1) 10 wt%, (2) 30 wt% and (3) 50 wt% Ni loading.
Catalysts 10 00993 g003
Figure 4. H2-TPR profiles of the Ni/SB and Ni/SF catalysts at various Ni contents: (a) 10 wt% Ni/SB, (b) 20 wt% Ni/SB, (c) 30 wt% Ni/SB, (d) 40 wt% Ni/SB, (e) 50 wt% Ni/SB, (f) 10 wt% Ni/SF, (g) 20 wt% Ni/SF, (h) 30 wt% Ni/SF, (i) 40 wt% Ni/SF and (j) 50 wt% Ni/SF.
Catalysts 10 00993 g004
Figure 5. GC-chromatograms of (a) FAME and H-FAME obtained from (b) 30 wt% Ni/SB (C18:2 conversion = 26.9%) and (c) 30 wt% Ni/SF (C18:2 conversion = 71.3%) (Region 1: peaks of C18:2 and Region 2: peaks of C18:3 and C20:0).
Catalysts 10 00993 g005
Figure 6. Effect of Ni loading on the degree of turnover frequency (TOF) and C18 compositions in the H-FAME obtained from the partial hydrogenation of palm oil-derived FAME using the (a) Ni/SB and (b) Ni/SF catalysts under 1 bar H2 pressure at 140 °C.
Catalysts 10 00993 g006
Figure 7. Effect of H2 pressure on the degree of TOF and C18 compositions in the H-FAME obtained from the partial hydrogenation of palm oil-derived FAME over (a) 30 wt% Ni/SB and (b) 30 wt% Ni/SF catalysts at 140 °C.
Catalysts 10 00993 g007
Figure 8. Effect of the reaction temperature on the degree of TOF and C18 compositions in the H-FAME obtained from the partial hydrogenation of palm oil-derived FAME over (a) 30 wt% Ni/SB and (b) 30 wt% Ni/SF catalysts under 1 bar H2 pressure.
Catalysts 10 00993 g008
Figure 9. Comparison of catalyst stability in terms of C18:2 conversion at each time on stream and cumulative C18:2 conversion for the 30 wt% Ni/SF and 30 wt% Ni/SB catalysts in the partial hydrogenation of FAME under 1 bar H2 pressure at 140 °C.
Catalysts 10 00993 g009
Table 1. Textural properties and acidity of the silica ball and silica fiber.
SamplesSA a
(m2 g−1)
PV b
(cm3 g−1)
PD c
(nm)
Acidity e
(mmol NH3/g)
Silica ball (CARiACT Q10) 380.1414.60.162
Silica fiber 7n.d. dn.d. d0.587
a BET surface area, b pore volume obtained from the BJH desorption cumulative volume of pores between 1.7 and 300 nm diameter, c pore diameter obtained from the BJH desorption average pore diameter, d cannot be detected and calculated by the BJH method, e measured by the NH3-TPD technique.
Table 2. Textural properties, NiO crystallite size, Ni dispersion, H2 consumption and reducibility of Ni/SB and Ni/SF catalysts.
CatalystsActual Ni Loading a (wt%)SA b
(m2 g−1)
PV c
(cm3 g−1)
PD d
(nm)
DNiO e
(nm)
Ni Dispersion f (%)H2 Consumption g
( mmol   g cat 1 )
Reducibility h (%)
10 wt% Ni/SB10.2360.1012.721.83.41.1063.3
20 wt% Ni/SB21.0360.1112.923.52.81.3938.8
30 wt% Ni/SB30.3330.1519.225.91.71.9337.3
40 wt% Ni/SB39.3310.1317.230.61.52.0730.9
50 wt% Ni/SB41.1310.1317.336.61.31.6622.6
10 wt% Ni/SF9.9130.014.8920.83.41.2976.5
20 wt% Ni/SF18.8110.0237.921.13.22.3473.1
30 wt% Ni/SF29.6100.0214.120.92.33.7574.3
40 wt% Ni/SF41.4110.0238.423.61.95.0070.9
50 wt% Ni/SF47.4120.0314.824.11.95.3966.7
a Determined by ICP-OES technique after calcination. b BET surface area. c Pore volume obtained from the BJH desorption cumulative volume of pores between 1.7 and 300 nm diameter. d Pore diameter obtained from BJH desorption average pore diameter. e NiO crystallite size was detected by XRD and calculated following Scherer equation by using the (200) plane [15]. f Ni dispersion was evaluated by CO pulse chemisorption. g The H2 consumption was obtained from TPR analysis. h The reducibility of Ni-based catalyst was calculated by comparing the total H2 consumption obtained from the H2-TPR technique and the theoretical value calculated from NiO + H2 → Ni + H2O.
Table 3. Elemental analysis of FAME and H-FMAME obtained the 30 wt% Ni/SB and 30 wt% Ni/SF catalysts.
MetalsFAME30Ni/SB30%Ni/SF
Zn36.0 ppm33.1 ppm27.4 ppm
Nin.d.n.d.93.9 ppm
Sin.d.n.d.n.d.
Table 4. Properties of FAME before and after partial hydrogenation.
SampleCatalystC18:2
Conversion [%]
Heating Value
[MJ kg−1]
Flash Point
[°C]
Pour Point
[°C]
Oxidation
Stability [h]
FAME--39.91841616
H-FAME30 wt % Ni/SB a26.239.81821819
30 wt% Ni/SF a71.339.71842023
30 wt% Ni/SF b85.039.618024>48
a Condition: H2 pressure = 1 bar; FAME feed rate = 0.44 g min−1; T = 140 °C and reaction time = 4 h. b Condition: H2 pressure = 4 bar; FAME feed rate = 0.44 g min−1; T = 140 °C and reaction time = 4 h.

