Article

Effective Depolymerization of Sodium Lignosulfonate over SO42−/TiO2 Catalyst

Co-Innovation Center for Efficient Processing and Utilization of Forest Products, College of Chemical Engineering, Nanjing Forestry University, Nanjing 210037, China
*
Author to whom correspondence should be addressed.
Chengguo Mei and Chengjuan Hu contributed equally.
Catalysts 2020, 10(9), 995; https://doi.org/10.3390/catal10090995
Submission received: 3 August 2020 / Revised: 25 August 2020 / Accepted: 28 August 2020 / Published: 1 September 2020
(This article belongs to the Special Issue Catalysis in Lignocellulosic Biomass Conversion)

Abstract

:
In this paper, liquefaction of sodium lignosulfonate (SL) over SO42−/TiO2 catalyst in methanol/glycerol was investigated. Effects of temperature, time, the ratio of methanol to glycerol and catalyst dosage were also studied. It was indicated that optimal reaction condition (the temperature of 160 °C, the time of 1 h, solvent ratio (methanol/glycerol) of 2:1, catalyst dosage of 5 wt % (based on lignin input)) was obtained after sets of experiments. The maximum yields of liquefaction (89.8%) and bio-oil (86.8%) were gained under the optimal reaction conditions. Bio-oil was analyzed by elemental analysis, FT-IR and gas chromatogram and mass spectrometry (GC/MS). It was shown that the functional groups of bio-oil were enriched and calorific value of bio-oil was increased. Finally, it can be seen from GC/MS analysis that the type of products included alcohols, ethers, phenols, ketones, esters and acids. Phenolic compounds mainly consisted of G (guaiacyl)-type phenols.

1. Introduction

The increasing demand for energy and fossil fuels has aroused great interest in exploring alternative energy sources. To date, the study of efficient conversion and utilization of biomass has become a research hotspot due to lower price and wider distribution. Lignocellulose is considered to be a sustainable biomass resource for preparing liquid transportation fuels [1]. Lignin, which accounts for 15–30% of lignocellulosic biomass, is a natural aromatic polymer composed of three primary phenylpropane units, including guaiacyl (G), syringyl (S) and p-hydroxyphenyl (H), connected by various linkages (β-O-4, α-O-4, α-O-5 and so on) [2,3]. On one hand, lignin can be converted through the linkage breaking caused by catalytic depolymerization into high-value chemicals or other valuable precursors for plastics, cosmetics, pharmaceuticals and perfumes (i.e., from large-molecule to small-molecule products) [4,5,6]. On the other hand, some research reports found that lignin could be directly transformed into bio-oil, which can be utilized as liquid biofuels [7,8,9].
Catalytic liquefaction is a promising technology for producing liquid biofuels such as bio-oil from solid substrates under mild reaction conditions over suitable catalysts [10]. In addition, the suitable solvent can increase the production and quality of bio-oil [11]. According to literature, various solvents such ass methanol and methanol-water mixture were proved to be effective choices for the catalytic liquefaction of lignin pretreated with hydrogen peroxide at 200 °C [12]. Besides, ethanol, ethylene glycol, glycerol and polyethylene glycol [13,14,15,16,17] were also be applied as suitable solvents for lignin liquefaction. Moreover, the mixed solvent of polyethyleneglycol and glycerol was also employed for lignin liquefaction at the temperature range of 130–150 °C [17]. Above results show that both alcohols and mixed alcohols are all suitable choice as efficient solvents for lignin liquefaction.
Moreover, efficient catalysts, such as acid catalyst [18,19,20], base catalyst [21,22], metal supported catalyst [23,24] also play an important role in lignin liquefaction, as the active sites in catalysts can promote reaction greatly. For example, Huang et al. [19] reported that the utilization of Lewis acid metal triflates realized the effective transformation of lignin to lignin-derived alkylmethoxyphenols through metal-catalyzed hydrogenolysis under mild conditions. Dabral et al. [21] found that lignin, which was the sustainable alternative to petroleum-derived aromatics, was converted into methylated phenol derivatives by base-catalyzed depolymerization (BCD). In addition, Jin et al. [23] applied metal supported catalyst HTMoO6 to complete the depolymerization of Kraft lignin in dioxane-water system, resulting in a higher petroleum ether soluble fraction yield of 58.7% at 320 °C for 24 h. However, these studies of lignin depolymerization all contained high temperatures and pressures, few reports had investigated the depolymerization of lignin under mild conditions. Therefore, the goal of this study was to explore a mild condition for operating the lignin depolymerization.
In this work, the lignin liquefaction was conducted in the mixed solvent of methanol/glycerol over SO42−/TiO2 catalyst. For finding the optimal reaction condition, effects of temperature, time, solvent ratio and catalyst dosage were investigated. The bio-oil obtained by catalytic liquefaction was collected and characterized by elemental analysis, Fourier-transform infrared spectroscopy (FT-IR) and gas chromatography/mass spectrometry (GC-MS). The characterization of sodium lignosulfonate (SL) and solid residue was carried out by elemental analysis and FT-IR.

2. Results and Discussion

2.1. Effect of Different Reaction Conditions on Lignin Liquefaction

2.1.1. Effect of Temperature

Reaction temperature is an important factor for the yield of bio-oil. Increasing temperature can promote the depolymerization of SL and the re-polymerization of lignin intermediates simultaneously [25]. As can be seen from Figure 1, yields of conversion and bio-oil increase with the increase of temperature from 150 to 160 °C then decrease when the temperature exceeds 170 °C, which indicates that increasing temperature (before 160 °C) can promote the lignin conversionwhen the temperature is higher than 160 °C, the yield of bio-oil decreases due to the re-polymerization reaction of lignin intermediates.

2.1.2. Effect of Reaction Time

From Figure 2, yields of conversion and bio-oil reach their maximum values of 89.8% and 86.8%, respectively, as the reaction time is 1h. When the reaction time increases, yields of conversion and bio-oil all decrease, which might be due to condensation between reactive lignin intermediates. As the reaction time prolongs, lignin conversion gradually tends to balance (i.e., the rate of depolymerization is equal to that of condensation). However, when the reaction time exceeds 1h, the condensation between lignin intermediates will gradually dominate the remaining liquefaction reaction (i.e., the rate of condensation will be higher than that of depolymerization), which will greatly promote the re-polymerization reaction of liquefied products (i.e., reactive lignin intermediates with small-molecular weight) [26]. On the other hand, the solid products with large-molecular weight obtained after liquefaction reaction will be adsorbed on the surface of catalyst to block the active acid sites, which decreases the catalytic activity of solid super catalyst to some extent [27].

2.1.3. Effect of Solvent Ratio

It is clear from Figure 3, yields of conversion and bio-oil reach their maximum values of 89.8% and 86.8% respectively when the solvent ratio of methanol to glycerol is 2:1. However, when the solvent system is single alcohol (e.g., only glycerol or methanol added), both yields of oil and liquefaction all decrease markedly. Both the dissolution of lignin and the dispersion of liquefied products all become worse in single-alcohol solvent system than that in mixed-alcohol solvent system, which leads to the formation of char or other large-molecular products (e.g., coke) to reduce the yields of lignin conversion. As the ratio of methanol to glycerol is higher than 2, yields of conversion and bio-oil all decrease, which might be due to the effect of dissolution and dispersion derived from glycerol with more active hydroxyl groups (-OH), which can promote the dissolution of lignin and the dispersion of lignin intermediates during the conversion reaction [11].

2.1.4. Effect of Catalyst Dosage

Basically, acid sites provided by solid super catalyst can promote the depolymerization of SL and re-polymerization of lignin intermediates simultaneously [15,17]. As shown in Figure 4, when no catalyst is added in the experiment, both yields of oil and conversion are all relative low, which might be due to the insufficient conversion of lignin without the addition of catalyst. With the increase of catalyst dosage (from 2.5 to 10.0 wt %, based on lignin input), yields of conversion and bio-oil increase until the maximum value at the dosage of 5.0 wt % then decrease with the growth of dosage from 5.0 to 10.0 wt %. For example, when the addition of catalyst is 5 wt %, yields of conversion and bio-oil all reach their maximum value of 89.8% and 86.8%, respectively. With the higher catalyst addition, acid sites increase rapidly, resulting in the stronger acidic environment during lignin conversion reaction, which is advantageous for the re-polymerization of lignin intermediates.

2.2. Analysis of Liquefaction Products

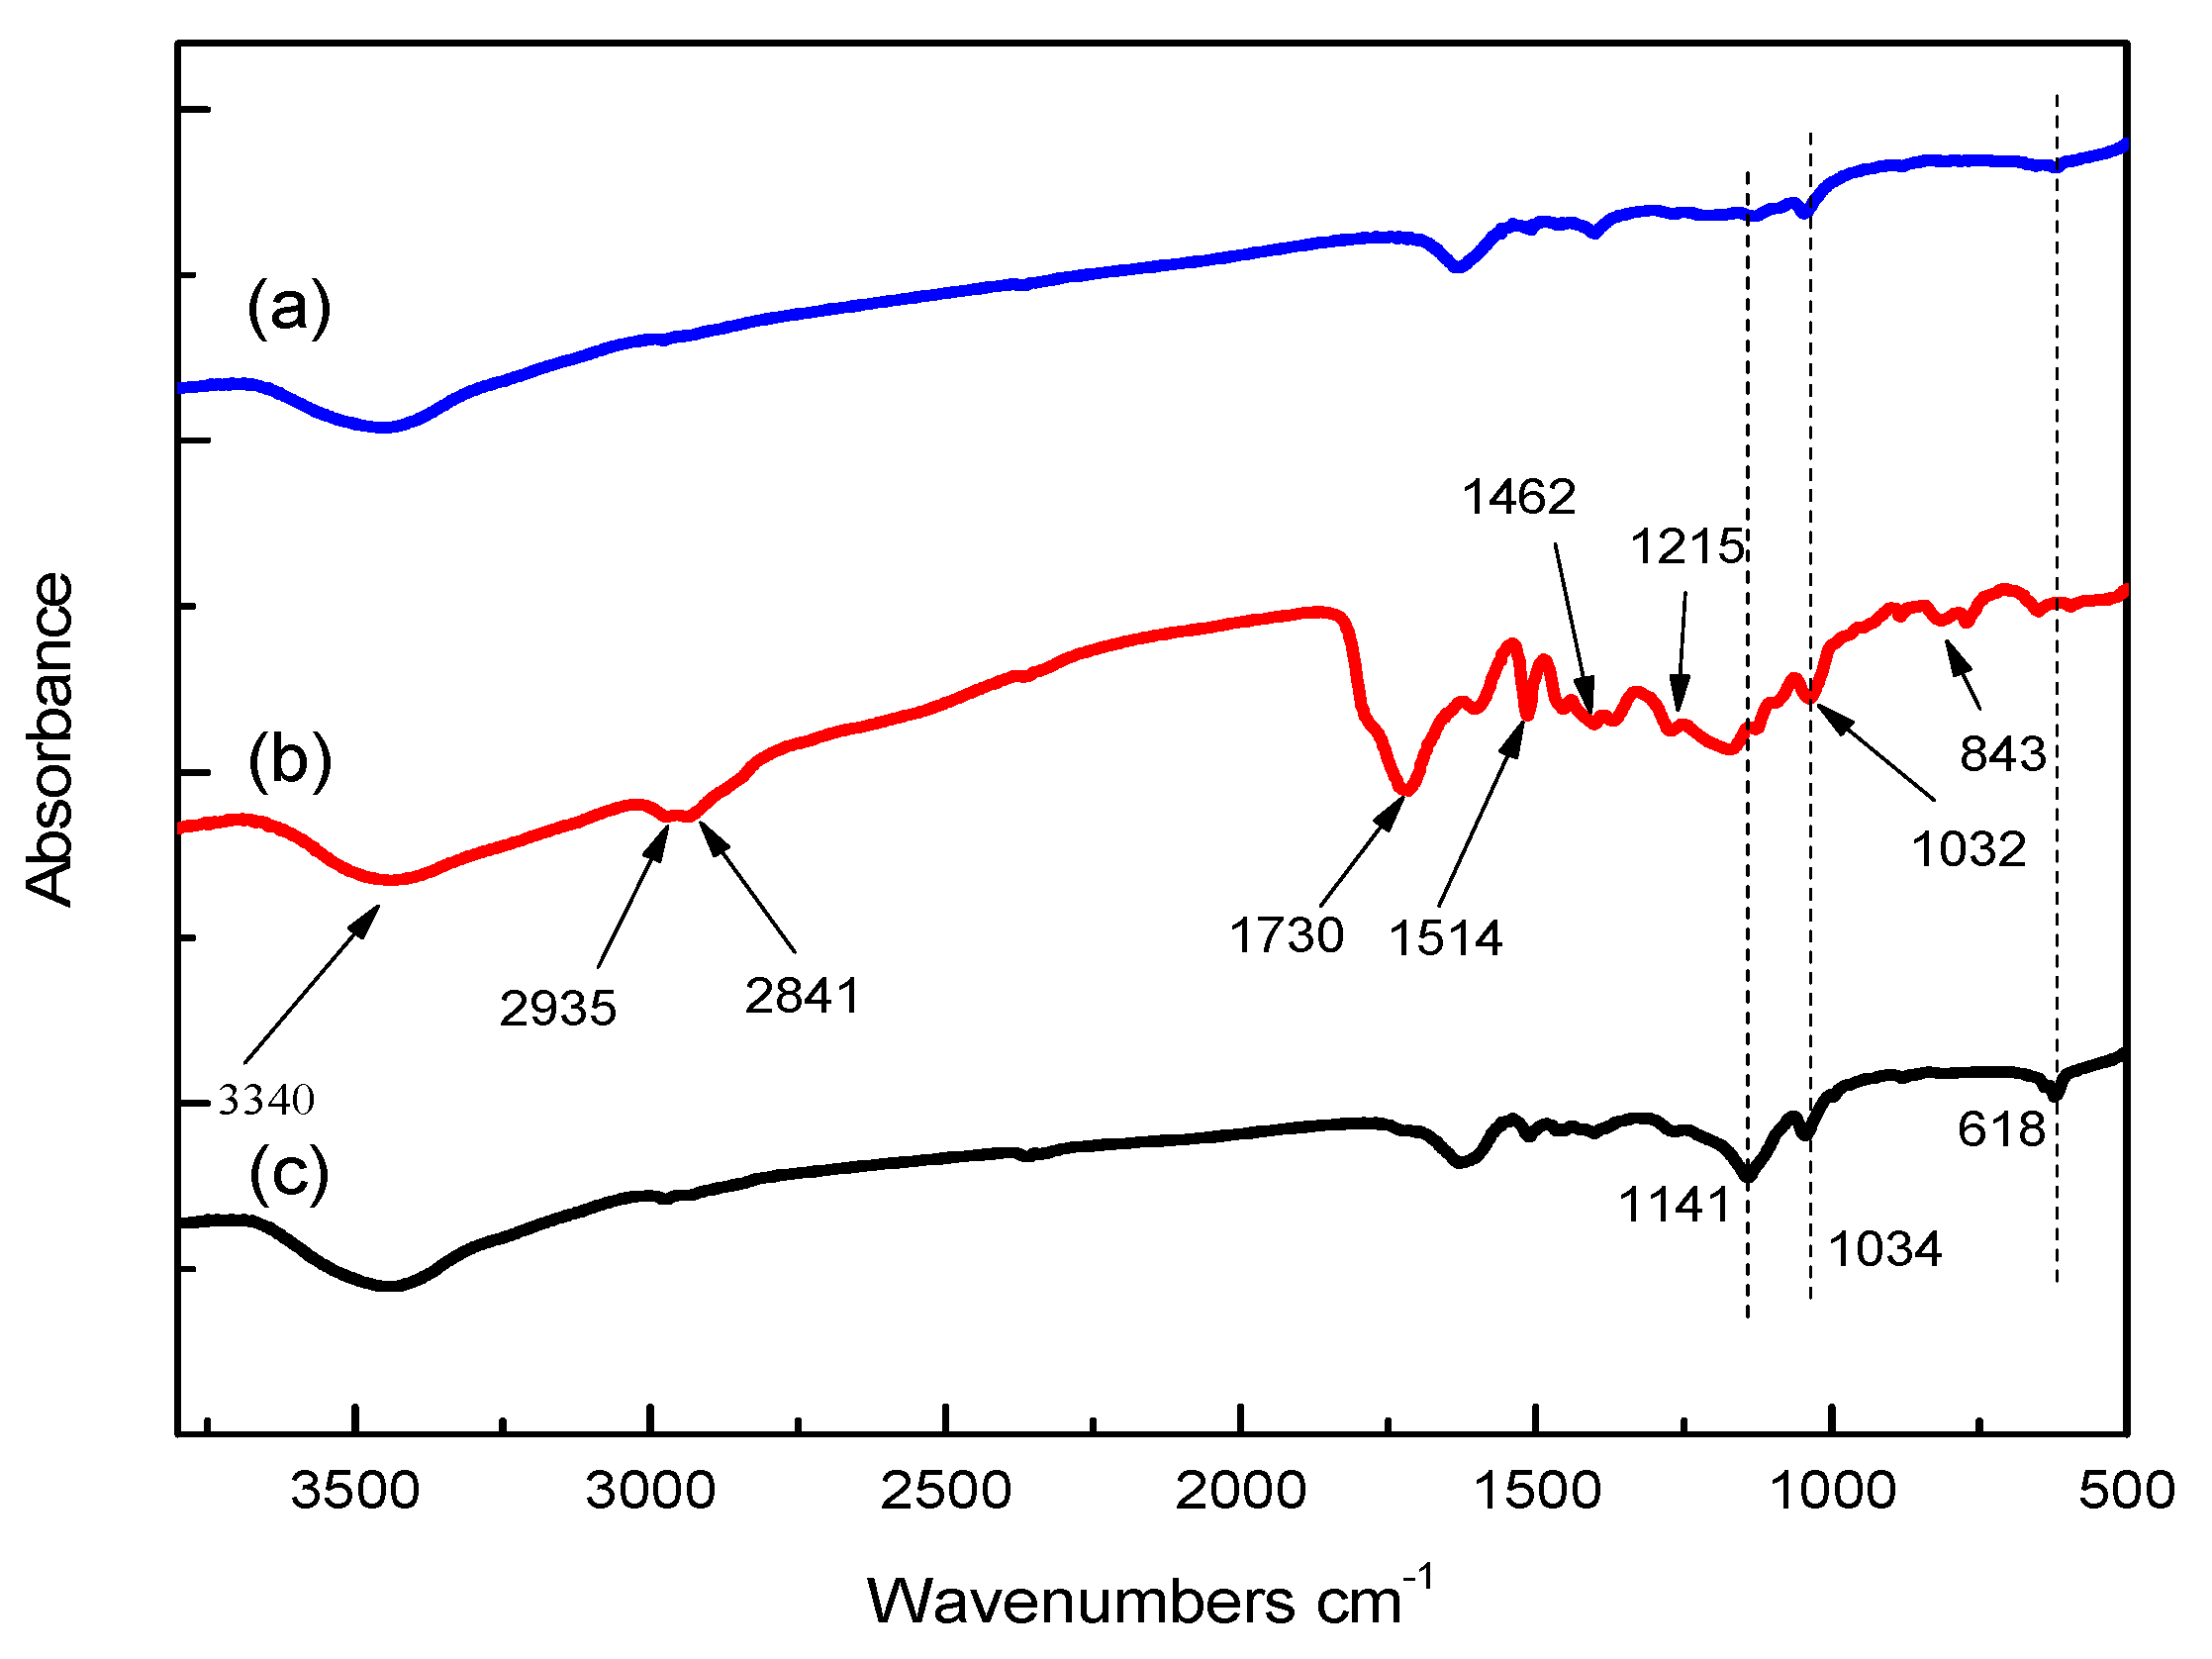
2.2.1. FTIR Analysis

FTIR analysis of SL, bio-oil and solid residue can be obtained from Figure 5. The curve of SL is similar with that of solid residue, which illustrates that solid residue gained after the liquefaction reaction basically retains the main structure of SL. However, some subtle changes can also be observed, which shows that the structure of solid residue is more abundant than that of SL. For example, the absorbance of peaks residue at 1141 (stretching vibration of C-H bonds on benzene rings) and 1034 cm−1 (C-O vibration on primary alcohols) for solid residue are higher than those for SL, indicating that solid residue contains more aromaticity and primary alcohols located in side chains. The peak at 618 cm−1 is related to the absorbance of aliphatic ketone, indicating that solid residue contains more aliphatic ketones than SL, which might be due to the oxidation of hydroxyl groups.
From Table 1, the bands at 3450–3300 cm−1, 2935 cm−1 and 2841 cm−1 are corresponding to the stretching vibrations of hydroxyl (-OH), methoxy (-OCH3) and methylene (-CH2-) groups, respectively [27]. Among them, the absorption vibration of methoxy and methylene groups in bio-oil are remarkably enhanced, indicating that the linking bonds in SL are effectively broken. Peak at 1713 cm−1 is considered to be the stretching vibration of carbonyl (-C=O-) groups [28], while the stretching vibration of carbonyls in carboxylic acid is around 1700–1707 cm−1 [29]. The peak at 843 cm−1 is the characteristic vibration of G-type phenols, the peak at 1215 cm−1 is related to the C-O stretching in S- and G-type phenols [30]. Obviously, peaks for bio-oil at 843 cm−1 and 1215 cm−1 are enhanced, indicating that SL is depolymerized effectively under mild reaction conditions.

2.2.2. Elemental Analysis

The content of carbon (C), hydrogen (H) and nitrogen (N) of SL, bio-oil and residue were all measured, the content of oxygen (O) was calculated by difference. As can be seen from Table 2, the calorific value of bio-oil is 18.45 MJ/kg, which is higher than that of SL and solid residue.
The H/C and O/C ratios are all important parameters affecting the calorific value [16]. From Table 2, compared to SL and solid residue, the H/C ratio of bio-oil increases, while the O/C ratio decreases, the calorific value of bio-oil increases significantly. The elemental content (including C, H, N and O) of solid residue is similar to that of SL. Compared to SL, the content of C and H in solid residue decreases, while that of O in solid residue increases, which might be due to the generation of CO2, CH4, CO during the reaction caused by the consumption of C. Compared to SL and solid residue, bio-oil has lower O/C ratio and higher H/C ratio, which results in the higher calorific value.

2.2.3. GC-MS Analysis

As can be seen from Figure 6, the product distribution of bio-oil is plentiful, which mainly includes acids, esters, alcohols, ethers, ketones, phenols and its derivatives. In addition, G-type phenols are the dominant product which are formed by the cleavage of C-O-C bonds (e.g., β-O-4), such as 4-vinyl-2-methoxyphenol, 1,4-benzenediol, vanillin, 4-hydroxy-3-methoxyacetophenone, methyl vanillate, 4-hydroxy-3-methoxypropiophenone, 4-hydroxy-3-methoxybenzaldehyde, homovanillic acid, etc. The most abundant compound among them is 1,4-benzenediol, which accounts for 7.38% (See Table 3). It is worth noting that S-type phenols have not been detected, which is owing to the demethoxylation reaction.
From Table 3, the dominate products of bio-oil are acid, reaching 50.49 %. Some esters, ketones, alcohols and ethers with small-molecular weight are mainly obtained from the interaction of solvents (e.g., oxidation, dehydration, aldol condensation and esterification), which account for a small certain proportion. The phenols are derived from the depolymerization of SL, which is composed of 8 different phenolic compounds. Although SL is a macromolecular polymer with many complex structures, which is difficult to be converted into the pure product. However, except for 1,4-Benzenediol, which is utilized as a polymerization inhibitor, remaining products are all G-type phenols, which means this catalyst can exhibit good selectivity under mild conditions. Moreover, the possible reaction mechanism has been presented in Figure 7.

3. Materials and Methods

3.1. Materials

The raw material used in this study was sodium lignosulfonate (SL), which was purchased at TCI Chemical Industry Development Co., Ltd., Shanghai, China. (CAS: 8068-05-1, TCI number: L0082). Methanol (AR, mass fraction ≥99.5%), glycerol (AR, mass fraction ≥99%), ethyl acetate (AR, mass fraction ≥99.5%), anhydrous sodium sulphate (AR, mass fraction ≥99%) and hydroquinone (AR, mass fraction ≥ 99%) were all purchased at Nanjing Chemical Reagent Co., Ltd., Nanjing, China.

3.2. Preparation of Catalyst

The TiO2 used in this experiment was anatase, which was impregnated in sulfuric acid (1 mol/L) for 30 min, washed with deionized water and filtered for several times, then dried at 90 °C overnight. Finally, it was placed in a muffle furnace and calcined at 450 °C for 2 h to obtain SO42−/TiO2 catalyst. Characterization, e.g., XRD, SEM, FT-IR and Py-FTIR of the SO42−/TiO2 catalyst was presented in our previous paper [32].

3.3. Experimental Set-Up

As shown in Figure 8, 3 g of SL, 30 g of solvent (methanol/glycerol with the ratio of 2:1) and catalysts (SO42−/TiO2) with different dosages (2.5, 5.0, 7.5 and 10.0 wt %, based on lignin input) were sequentially added into the stainless steel reactor (non-stirred, 100 mL). In order to explore the effect of various reaction conditions on lignin liquefaction, different experiments were designed with different temperatures (150–180 °C), time (1–4 h), solvent ratios (methanol/glycerol = 1:1, 2:1, 3:1 and 4:1) and catalyst dosages. The mixed alcohol system of methanol and glycerol can dissolve liquefied products well and prevent re-polymerization of SL intermediates effectively. On the other hand, the mixed system of alcohol was more conducive to the dissolution of SL than the single alcohol due to the presence of more active hydroxyls [11]. The addition of hydroquinone (0.05 g) played an important role in preventing re-polymerization, although it was detected by GC/MS analysis. After the end of reaction, the reactor was quenched immediately with ice water. After that, solid and liquid phases were separated by filtration with a pre-weighted membrane, the remaining solid residue was washed with methanol (10 g) for three times and the filtrate was merged into liquid phase. The solid residue was dried at 105 °C overnight, the yield of liquefaction was calculated by weighting. Methanol was then removed by rotary evaporation at 70 °C for 5 min, while glycerol could not be removed due to its high boiling point (at 290 °C). Actually, glycerol was easily soluble in water, while the liquefied products were extracted by adding ethyl acetate. In order to complete the separation step, 30 mL of deionized water was added to dissolve with glycerol to form the aqueous phase and 10 mL of ethyl acetate were added into the aqueous phase to extract the organic components for three times. After that, the organic phase (containing ethyl acetate and organic components) and aqueous phase (containing water and glycerol) were separated by a separating funnel. For removing the remained water thoroughly, anhydrous sodium sulfate was added in the ethyl acetate phase to operate the drying process overnight. Finally, the ethyl acetate phase with no water was obtained for the collection of bio-oil through rotary evaporation at 70 °C for 5 min. Each experiment was conducted in duplicate and the error was within ±2%. The solid residue was characterized by elemental analysis and FT-IR, bio-oil was characterized by FT-IR, elemental analysis and GC-MS analysis.
Yields of liquefaction and bio-oil were calculated according to Equations (1) and (2).
L i g n i n     c o n v e r s i o n = 100 % s o l i d     r e s i d u e     y i e l d   ,
where in the solid residue yield was equal to the mass of solid residue/the mass of lignin input.
B i o o i l     y i e l d = m a f t e r m g l y c e r o l m l i g n i n ,
where in m a f t e r was the mass of liquid phase after methanol removal, m g l y c e r o l was the mass of glycerol input before experiment and m l i g n i n was the mass of lignin input.
Actually, the yield of bio-oil was calculated before the separation step to remove glycerol, because liquefied products include not only organic products but also aqueous products. Most of the aqueous products would be taken away by the process of glycerol removal, which would decrease the yield of bio-oil significantly. Unlike other studies, the yield of bio-oil contained the sum of the yields of organic and aqueous products. Therefore, the difference in bio-oil and liquefaction yields was not obvious.

3.4. Characterizations of Experiment

3.4.1. FT-IR

Fourier transform infrared spectrometer (FTIR) analysis was carried out by VERTEX 70 spectrometer. The range of detected wavenumber was 500–4000 cm−1 and 32 scans per spectrum were collected with a resolution of 4 wavenumbers.

3.4.2. Elemental Analysis

The bio-oil, solid residue and SL were analyzed by elemental analysis in CHN mode with a VarioEL III from Elementar. The content of oxygen was calculated by difference.

3.4.3. GC/MS

The composition of bio-oil was determined by gas chromatography/mass spectrometer (GC/MS) on a Trace Ultra GC coupled with a DSQ II quadrupole MS Thermo Scientific. For this analysis, the sample was dissolved in methanol (1:1 v/v, p.a. grade) to form the concentration of 0.05 mg mL−1, the injection volume was 1 μL. Gas (helium) flow was 1 mL/min and temperature program were programed: First, start temperature (50 °C) was held for 1 min. Then, two heating rate were installed, one was 8 °C/min maintained for 1 min, final temperature was 220 °C, the other was 10 °C/min held for 1 min and final temperature was 300 °C. Finally, products were measured by Xcalibur software and NIST 2.0 library.

4. Conclusions

The optimal reaction conditions were as follows: the temperature was 160 °C, the time was 1 h, catalyst dosage was 5 wt % and the ratio of methanol to glycerol was 2:1. Yields liquefaction and bio-oil reached maximum values of 89.8% and 86.8%, respectively. FT-IR analysis of bio-oil showed that linkages of lignin, such as C-O-C and C-C bonds, effectively broke to some extent during liquefaction over SO42−/TiO2 catalyst. The elemental analysis showed that the calorific value of bio-oil increased significantly. GC-MS analysis the primary products were acids and the phenolic product was dominated by G-type phenols.

Author Contributions

C.M. and C.H. contributed equally. C.M. and C.H. carried out literature search, data collection, data analysis. C.M., C.H., Q.H. carried out data collection, data analysis. C.S. and X.L. carried out data collection and figures drawing. L.L. and Y.D. did data interpretation and wrote the manuscript. X.G. designed the framework and wrote the manuscript. All authors discussed the results and contributed to the final manuscript. All authors have read and agreed to the published version of the manuscript.

Funding

This research was funded by the National Natural Science Foundation of China (no. 21774059), the Priority Academic Program Development (PAPD) of Jiangsu Higher Education Institutions, the opening funding of Jiangsu Key Lab of Biomass based Green Fuels, Chemicals and College Students’ Practice and Innovation Training Project (201910298011Z, 201910298052Z).

Conflicts of Interest

The authors declare no competing financial interest.

References

  1. Kang, S.; Li, X.; Fan, J.; Chang, J. Hydrothermal conversion of lignin: A review. Renew. Sust. Energ. Rev. 2013, 27, 546–558. [Google Scholar] [CrossRef]
  2. Shuai, L.; Amiri, M.T.; Questell-Santiago, Y.M.; Heroguel, F.; Li, Y.; Kim, H.; Meilan, R.; Chapple, C.; Ralph, J.; Luterbacher, J.S. Formaldehyde stabilization facilitates lignin monomer production during biomass depolymerization. Science 2016, 354, 329–333. [Google Scholar] [CrossRef] [PubMed] [Green Version]
  3. Xiao, L.P.; Wang, S.; Li, H.; Li, Z.; Shi, Z.J.; Xiao, L.; Sun, R.G.; Fang, Y.; Song, G. Catalytic Hydrogenolysis of Lignins into Phenolic Compounds over Carbon Nanotube Supported Molybdenum Oxide. ACS Catal. 2017, 7, 7535–7542. [Google Scholar] [CrossRef]
  4. Liu, F.; Liu, Q.; Wang, A.; Zhang, T. Direct Catalytic Hydrogenolysis of Kraft Lignin to Phenols in Choline-Derived Ionic Liquids. ACS Sustain. Chem. Eng. 2016, 4, 3850–3856. [Google Scholar] [CrossRef]
  5. Yang, J.; Zhao, L.; Liu, C.; Wang, Y.; Dai, L. Catalytic ethanolysis and gasification of kraft lignin into aromatic alcohols and H-2-rich gas over Rh supported on La2O3/CeO2-ZrO2. Bioresour. Technol. 2016, 218, 926–933. [Google Scholar] [CrossRef] [PubMed]
  6. Chen, J.; Liu, C.; Wu, S.; Liang, J.; Lei, M. Enhancing the quality of bio-oil from catalytic pyrolysis of kraft black liquor lignin. RSC Adv. 2016, 6, 107970–107976. [Google Scholar] [CrossRef]
  7. Paysepar, H.; Ren, S.; Kang, S.; Shui, H.; Xu, C. Catalytic co-liquefaction of lignin and lignite coal for aromatic liquid fuels and chemicals in mixed solvent of ethanol-water in the presence of a hematite ore. J. Anal. Appl. Pyrolysis 2018, 134, 301–308. [Google Scholar] [CrossRef]
  8. Wang, J.; Li, W.; Wang, H.; Ma, Q.; Li, S.; Chang, H.M.; Jameel, H. Liquefaction of kraft lignin by hydrocracking with simultaneous use of a novel dual acid-base catalyst and a hydrogenation catalyst. Bioresour. Technol. 2017, 243, 100–106. [Google Scholar] [CrossRef]
  9. Yuan, Z.; Tymchyshyn, M.; Xu, C. Reductive Depolymerization of Kraft and Organosolv Lignin in Supercritical Acetone for Chemicals and Materials. Chemcatchem 2016, 8, 1968–1976. [Google Scholar] [CrossRef]
  10. Kang, S.; Li, X.; Fan, J.; Chang, J. Classified Separation of Lignin Hydrothermal Liquefied Products. Ind. Eng. Chem. Res. 2011, 50, 11288–11296. [Google Scholar] [CrossRef]
  11. Cheng, Y.; Zhao, P.X.; Alma, M.H.; Sun, D.F.; Li, R.; Jiang, J.X. Improvement of direct liquefaction of technical alkaline lignin pretreated by alkaline hydrogen peroxide. J. Anal. Appl. Pyrolysis 2016, 122, 277–281. [Google Scholar] [CrossRef]
  12. Song, Q.; Wang, F.; Cai, J.; Wang, Y.; Zhang, J.; Yu, W.; Xu, J. Lignin depolymerization (LDP) in alcohol over nickel-based catalysts via a fragmentation-hydrogenolysis process. Energ. Environ. Sci. 2013, 6, 994–1007. [Google Scholar] [CrossRef]
  13. Kristianto, I.; Limarta, S.O.; Lee, H.; Ha, J.M.; Suh, D.J.; Jae, J. Effective depolymerization of concentrated acid hydrolysis lignin using a carbon-supported ruthenium catalyst in ethanol/formic acid media. Bioresour. Technol. 2017, 234, 424–431. [Google Scholar] [CrossRef]
  14. Oregui-Bengoechea, M.; Gandarias, I.; Arias, P.L.; Barth, T. Solvent and catalyst effect in the formic acid aided lignin-to-liquids. Bioresour. Technol. 2018, 270, 529–536. [Google Scholar] [CrossRef] [PubMed]
  15. Hidajat, M.J.; Riaz, A.; Kim, J. A two-step approach for producing oxygen-free aromatics from lignin using formic acid as a hydrogen source. Chem. Eng. J. 2018, 348, 799–810. [Google Scholar] [CrossRef]
  16. Limarta, S.O.; Ha, J.M.; Park, Y.K.; Lee, H.; Suh, D.J.; Jae, J. Efficient depolymerization of lignin in supercritical ethanol by a combination of metal and base catalysts. J. Ind. Eng. Chem. 2018, 57, 45–54. [Google Scholar] [CrossRef]
  17. Jin, Y.; Ruan, X.; Cheng, X.; Lue, Q. Liquefaction of lignin by polyethyleneglycol and glycerol. Bioresour. Technol. 2011, 102, 3581–3583. [Google Scholar] [CrossRef]
  18. Xi, D.; Jiang, C.; Zhou, R.; Fang, Z.; Zhang, X.; Liu, Y.; Luan, B.; Feng, Z.; Chen, G.; Chen, Z.; et al. The universality of lignocellulosic biomass liquefaction by plasma electrolysis under acidic conditions. Bioresour. Technol. 2018, 268, 531–538. [Google Scholar] [CrossRef]
  19. Huang, X.; Zhu, J.; Koranyi, T.I.; Boot, M.D.; Hensen, E.J.M. Effective Release of Lignin Fragments from Lignocellulose by Lewis Acid Metal Triflates in the Lignin-First Approach. Chemsuschem 2016, 9, 3262–3267. [Google Scholar] [CrossRef]
  20. Wang, H.; Wang, H.; Kuhn, E.; Tucker, M.P.; Yang, B. Production of Jet Fuel-Range Hydrocarbons from Hydrodeoxygenation of Lignin over Super Lewis Acid Combined with Metal Catalysts. Chemsuschem 2018, 11, 285–291. [Google Scholar] [CrossRef]
  21. Dabral, S.; Engel, J.; Mottweiler, J.; Spoehrle, S.S.M.; Lahive, C.W.; Bolm, C. Mechanistic studies of base-catalysed lignin depolymerisation in dimethyl carbonate. Green Chem. 2018, 20, 170–182. [Google Scholar] [CrossRef]
  22. Katahira, R.; Mittal, A.; McKinney, K.; Chen, X.; Tucker, M.P.; Johnson, D.K.; Beckham, G.T. Base-Catalyzed Depolymerization of Biorefinery Lignins. ACS Sustain. Chem. Eng. 2016, 4, 1474–1486. [Google Scholar] [CrossRef]
  23. Jin, L.; Li, W.; Liu, Q.; Wang, J.; Zhu, Y.; Xu, Z.; Wei, X.; Zhang, Q. Liquefaction of kraft lignin over the composite catalyst HTaMoO6 and Rh/C in dioxane-water system. Fuel Process. Technol. 2018, 178, 62–70. [Google Scholar] [CrossRef]
  24. Bengoechea, M.O.; Hertzberg, A.; Miletic, N.; Arias, P.L.; Barth, T. Simultaneous catalytic de-polymerization and hydrodeoxygenation of lignin in water/formic acid media with Rh/Al2O3, Ru/Al2O3 and Pd/Al2O3 as bifunctional catalysts. J. Anal. Appl. Pyrolysis 2015, 113, 713–722. [Google Scholar] [CrossRef] [Green Version]
  25. Chen, F.G.; Lu, Z.M. Liquefaction of Wheat Straw and Preparation of Rigid Polyurethane Foam from the Liquefaction Products. J. Appl. Polym. Sci. 2009, 111, 508–516. [Google Scholar] [CrossRef]
  26. Bengoechea, M.O.; Miletic, N.; Vogt, M.H.; Arias, P.L.; Barth, T. Analysis of the effect of temperature and reaction time on yields, compositions and oil quality in catalytic and non-catalytic lignin solvolysis in a formic acid/water media using experimental design. Bioresour. Technol. 2017, 234, 86–98. [Google Scholar] [CrossRef] [PubMed]
  27. Xinyu, L.; Xiaojun, Z.; Haoquan, G.; Han, Q.; Dandan, W.; Dingliang, X.; Tao, H.; Chengjuan, H.; Chaozhong, X.; Xiaoli, G. Efficient depolymerization of alkaline lignin to phenolic compounds at low temperatures with formic acid over inexpensive Fe-Zn/Al2O3 catalyst. Energy Fuel. 2020, 34, 7121–7130. [Google Scholar]
  28. Long, J.; Guo, B.; Teng, J.; Yu, Y.; Wang, L.; Li, X. SO3H-functionalized ionic liquid: Efficient catalyst for bagasse liquefaction. Bioresour. Technol. 2011, 102, 10114–10123. [Google Scholar] [CrossRef]
  29. Lohre, C.; Barth, T.; Kleinert, M. The effect of solvent and input material pretreatment on product yield and composition of bio-oils from lignin solvolysis. J. Anal. Appl. Pyrolysis 2016, 119, 208–216. [Google Scholar] [CrossRef]
  30. Long, J.; Zhang, Q.; Wang, T.; Zhang, X.; Xu, Y.; Ma, L. An efficient and economical process for lignin depolymerization in biomass-derived solvent tetrahydrofuran. Bioresour. Technol. 2014, 154, 10–17. [Google Scholar] [CrossRef]
  31. Chekem, C.T.; Goetz, V.; Richardson, Y.; Plantard, G.; Blin, J. Modelling of adsorption/photodegradation phenomena on AC-TiO2 composite catalysts for water treatment detoxification. Catal. Today 2019, 328, 183–188. [Google Scholar] [CrossRef]
  32. Li, L.; Yue, H.; Ji, T.; Li, W.; Zhao, X.; Wang, L.; She, J.; Gu, X.; Li, X. Novel mesoporous TiO2(B) whisker-supported sulfated solid superacid with unique acid characteristics and catalytic performances. Appl. Catal. A-Gen. 2019, 574, 25–32. [Google Scholar] [CrossRef] [Green Version]
Figure 1. Effect of reaction temperature on lignin conversion. Reaction conditions: reaction time was 1 h, solvent ratio of methanol to glycerol was 2:1, catalyst dosage was 5.0 wt %.
Catalysts 10 00995 g001
Figure 2. Effect of reaction time on lignin conversion. Reaction conditions: reaction temperature was 160 °C, solvent ratio of methanol to glycerol was 2:1, catalyst dosage was 5.0 wt %.
Catalysts 10 00995 g002
Figure 3. Effect of solvent ratio on lignin conversion. Reaction conditions: reaction temperature was 160 °C, reaction time was 1 h, catalyst dosage was 5.0 wt %.
Catalysts 10 00995 g003
Figure 4. Effect of catalyst amount on lignin conversion. Reaction conditions: reaction temperature was 160 °C, reaction time was 1 h, solvent ratio of methanol to glycerol was 2:1.
Catalysts 10 00995 g004
Figure 5. FT-IR of (a) SL, (b) bio-oil and (c) solid residue.
Catalysts 10 00995 g005
Figure 6. GC-MS diagram of bio-oil.
Catalysts 10 00995 g006
Figure 7. Reaction mechanism.
Catalysts 10 00995 g007
Figure 8. Flow chart of (a) lignin liquefaction and (b) product separation.
Catalysts 10 00995 g008
Table 1. Functional group structure of bio-oil sample.
Wavenumbers (cm−1)Functional Groups
3450–3300O-H stretching vibration
2935C-H stretching vibration of -CH3
2841C-H stretching vibration of -CH2
1713C=O stretching vibration
1514,1462Aromatic C=C ring breathing
1215,1032Ar-O stretching breathing
1141Aromatic C-H in-plane deformation
1034Aromatic C-H in-plane deformation plus C-O deformation in primary alcohols plus C-H stretching.
843Aromatic C-H ring out-of-plane vibration breathing
618Aliphatic ketone vibration breathing
Table 2. Elemental analysis of bio-oil, SL and solid residue.
SampleC/%N/%H/%O% 1O/CH/CHHV 2/(MJ/kg)
Bio-oil40.610.926.9651.401.270.1718.45
SL39.740.264.355.71.400.119.66
Solid residue35.480.273.2760.981.720.095.81
Note: 1 The content of oxygen was calculated by the difference; 2 High calorific value (HHV) was evaluated by Dulong Formula [31]: HHV (MJ/kg) = 0.3383 × C + 1.422 × (H-O/8).
Table 3. GC-MS analysis of bio-oil a.
NoCompoundsFormulaMol. Weight
(g/mol)
TypeR.T. b
(min)
Relative Content c/%
1Acetic acidC2H4O260Acid2.7939.52
2Methyl glycolateC3H6O390Ester3.155.70
3Furfuryl alcoholC5H6O298Alcohol4.963.66
4Di(Ethylene Glycol) Vinyl EtherC6H12O3132Ether5.342.65
5MethylcyclopentenoloneC6H8O2112Ketone7.451.39
64-Vinyl-2-methoxyphenolC9H10O2153Phenol-G11.814.78
71,4-BenzenediolC6H6O2110Phenol-H12.2016.55
8VanillinC8H8O3152Phenol-G13.014.55
94-Hydroxy-3-methoxyacetophenoneC9H10O3166Phenol-G14.202.42
10Methyl vanillateC9H10O4182Phenol-G14.431.35
114-Hydroxy-3-methoxypropiophenoneC10H12O3180Phenol-G14.593.36
124-Hydroxy-3-methoxybenzaldehydeC8H8O3152Phenol-G15.310.49
13Homovanillic acidC9H10O4182Phenol-G16.062.40
14N-hexadecanoic acidC16H32O2256Acid19.287.90
15Octadecanoic acidC18H32O2284Acid21.093.07
a The bio-oil was obtained at the optimal condition (the temperature is 160 °C, the time is 1h, ratio of methanol to glycerol is 2 and the catalyst dosage is 5.0 wt %). b Retention time. c Calculated by normalization of peak area.

