Article

Synthesis and Characterization of p-n Junction Ternary Mixed Oxides for Photocatalytic Coprocessing of CO2 and H2O

by
Davide M. S. Marcolongo
1,
Francesco Nocito
1,
Nicoletta Ditaranto
1,
Michele Aresta
2 and
Angela Dibenedetto
1,3,*
1
Dipartimento di Chimica, Università degli Studi di Bari, Via Orabona, 4, 70125 Bari, Italy
2
IC2R srl, Tecnopolis, Via Casamassima km 3, Valenzano, 70010 Bari, Italy
3
CIRCC-Interuniversity Consortium on Chemical reactivity and Catalysis, Via Celso Ulpiani, 27, 70126 Bari, Italy
*
Author to whom correspondence should be addressed.
Catalysts 2020, 10(9), 980; https://doi.org/10.3390/catal10090980
Submission received: 5 August 2020 / Revised: 17 August 2020 / Accepted: 18 August 2020 / Published: 31 August 2020
(This article belongs to the Special Issue New Trends in Catalysis for Sustainable CO2 Conversion)

Abstract

:
In the present paper, we report the synthesis and characterization of both binary (Cu2O, Fe2O3, and In2O3) and ternary (Cu2O-Fe2O3 and Cu2O-In2O3) transition metal mixed-oxides that may find application as photocatalysts for solar driven CO2 conversion into energy rich species. Two different preparation techniques (High Energy Milling (HEM) and Co-Precipitation (CP)) are compared and materials properties are studied by means of a variety of characterization and analytical techniques UV-Visible Diffuse Reflectance Spectroscopy (UV-VIS DRS), X-ray Photoelectron Spectroscopy (XPS), X-Ray Diffraction (XRD), Transmission Electron Microscopy (TEM), and Energy Dispersive X-Ray spectrometry (EDX). Appropriate data elaboration methods are used to extract materials bandgap for Cu2O@Fe2O3 and Cu2O@In2O3 prepared by HEM and CP, and foresee whether the newly prepared semiconductor mixed oxides pairs are useful for application in CO2-H2O coprocessing. The experimental results show that the synthetic technique influences the photoactivity of the materials that can correctly be foreseen on the basis of bandgap experimentally derived. Of the mixed oxides prepared and described in this work, only Cu2O@In2O3 shows positive results in CO2-H2O photo-co-processing. Preliminary results show that the composition and synthetic methodologies of mixed-oxides, the reactor geometry, the way of dispersing the photocatalyst sample, play a key role in the light driven reaction of CO2–H2O. This work is a rare case of full characterization of photo-materials, using UV-Visible DRS, XPS, XRD, TEM, EDX for the surface and bulk analytical characterization. Surface composition may not be the same of the bulk composition and plays a key role in photocatalysts behavior. We show that a full material knowledge is necessary for the correct forecast of their photocatalytic behavior, inferred from experimentally determined bandgaps.

1. Introduction

Combustion of fossil fuels (fossil-C) is actually the main source (80.2% as for 2018) to fulfil human hunger for energy, but natural resources are not infinite and are expected to get exhausted in 160 y or so. Moreover, the use of fossil-C is responsible for the emission of 37 Gt/y of CO2 and other green-house gases considered to be the origin of climate change. According to Earth System Research Laboratory’s—ESRL’s Global Monitoring Laboratory, in January 2020, atmospheric concentration of CO2 reached 412 ppm [1]. However, avoiding massive and continuous CO2 emission and utilization of alternative sustainable primary energy sources is necessary [2]. On the other hand, CO2 represents a readily available building block for chemicals and source of carbon for fuels, which can be produced through a conversion driven by C-free energy sources [3]. Solar radiations carry a quantity of energy to Earth surface, sufficient to be considered to perform CO2 conversion [4]. This can be realized by means of photocatalysis [5], in a semiconductor-assisted light-driven process during which light is absorbed and converted into chemical energy, such as CO, CH3OH, CH4, Cn-species, or even H2, produced in water-splitting [6,7].
Unfortunately, for the moment, the photocatalytic processes still suffer low efficiency and are not ready for an industrial commercially viable application [5], despite the research started with work by T. Inoue [8] and J.M. Lehn [9] that dates back to 40 years ago. Searching for the best photocatalysts [10], a variety of semiconductors have been studied, ranging from those based onto Group 4 elements to more classical Group 3–5 semiconductors [11,12], Group 6 chalcogenides [13] and more “exotic” semiconductors [14]. Among the latter materials, Earth-abundant transition and post-transition metal oxides such as TiO2, Fe2O3, Cu2O, CuO, ZnO, NiO, Ta2O5, Ga2O3, In2O3, and WO3 revealed very promising to act both as photo-catalysts [10,11,12] or co-catalysts [15]. They are usually cheap and yet widely used as chemo-catalysts in industrial applications, easily fabricated at micro- and nano-size and can absorb light in the UV-Visible region [16,17]. Further, they can be efficiently coupled to enhance properties such as visible light absorption [18], band edge levels’ position, and photogenerated charge transfer, and separation processes [15]. Copper oxides, both CuO and Cu2O, were recently demonstrated able to convert CO2 or water into solar fuels under VIS-light irradiation [19]. These p-type semiconductors, that can efficiently be used either bare [20] or as co-catalysts [21,22,23,24], are affected by high recombination rate and photodegradation. The formation of a heterojunction by coupling with a suitable n-type semiconductor, is a widely adopted strategy to inhibit charge recombination, enhance stability and provide alternative energy levels to carry out photocatalytic reactions [11,12]. The formation of such junctions even at very small particle size is one of the keys for leading to fabrication of active photocatalysts. The semiconductor coupling strategy can also be adopted for copper oxides, in which properties as photostability and charge separation are found to be significantly affected by coupling with n-type metal oxides [19]. At the same time, the addition of copper oxides is useful to shift the absorption spectrum of semiconductor partner towards visible range [12,18].
In the present work, two different n-type metal oxides were selected as potential partners for Cu2O: indium oxide, In2O3, and iron oxide in the form of hematite, α-Fe2O3. Thanks to band energy levels position, affinity towards CO2 and electronic properties, both these oxides are recognized in literature as potential photocatalysts or cocatalysts for solar fuels production [12,25,26]. In particular, indium oxide has been recently experimented for CH4 and H2 photocatalytic production, coupled with other semiconductors or cocatalysts [27,28], or even with a thermal input during the reaction [29,30]. Instead, iron oxide is widely experimented for photocatalytic dye degradation [31] and water cleaning [26], but recently water splitting application is under study [32].
To the best of our knowledge, semiconductor pairs composed of Cu2O with In2O3 or α-Fe2O3 are very scarcely characterized and tested for solar fuels production. Thin films are generally preferred over powders and particles. For the latter, 2D semiconductors as graphene or carbon nitride have been used as platforms for achieving enhanced charge separation and better lattice matching [10,11,12]. This is especially true for the Cu2O-In2O3 pair, where lattice parameters mismatch can hinder the formation of heterojunctions, but samples prepared by hydrothermal/co-precipitation methods are possibly active in photocatalytic degradation and hydrogen evolution [33,34]. In the literature, the Cu2O-Fe2O3 pair is reported to a bigger extent than that with Cu2O-In2O3 and samples prepared by solvothermal, co-precipitation or electrodeposition methods were tested for photocatalytic degradation [35], hydrogen production [36,37] and CO2 reduction to carbon monoxide, methanol and methane [38,39]. A point to mention is that the Cu/In,Fe-mixed-oxides were not always fully characterized and often they were added with other compounds (especially noble metals) and hole scavengers, adding complexity to the already not clearly defined system and making difficult to understand the role of each partner.
In this work, mixed-oxide nano-particles were prepared through two different techniques: High Energy Milling—HEM and Co-Precipitation—CP. Starting oxides were either commercial samples or synthesized in our laboratory. Neat nano-sized powder samples were analyzed by Energy Dispersive X-Ray spectrometry (EDX), characterized by UV-Visible Diffuse Reflectance Spectroscopy (UV-VIS DRS), and X-ray Photoelectron Spectroscopy (XPS) and then tested in gas phase CO2–H2O co-processing under VIS-light irradiation, at room temperature, without addition of noble metal co-catalysts or hole scavenger species to evaluate the properties of the single mixed oxides. Evaluation and tailoring of properties of cited materials, with particular attention to electronic band structure and optical absorption, was the final goal of this work, targeting a correlation among properties of the materials and their photocatalytic activity in co-processing H2O and CO2 under VIS-light in different reactor geometries.

2. Results and Discussion

2.1. Synthesis, Composition, and Size of Ternary Oxides

Binary oxides powders used in this work were either commercial samples (C-Oxide) or synthesized in the laboratory (S-Oxide). Ternary oxides powders were fabricated through HEM and CP techniques, as reported in the Materials and Methods section. Such mixed oxides are labelled in Table 1 according to the preparation technique employed and numbered according to increasing Cu/In or Cu/Fe molar ratio, as measured by EDX spectrometry and calculated considering all copper, indium, and iron present in the form of Cu2O, In2O3, and Fe2O3, respectively.
Preliminary Transmission Electron Microscopy (TEM) measurements were carried out on ternary mixed oxides containing Cu2O and In2O3. TEM micrographs show that both techniques (HEM and CP) were able to produce single particles whit linear size below 100 nm, which aggregate into sub-micrometric clusters, which show some differences. While in HEM prepared samples, clusters are produced by association of particles upon collision, with relevant presence of amorphous phase and no precise morphology, in CP prepared samples clusters are produced by stacking of well-formed particles of cubic morphology [24], which is common to crystal lattice of both component binary oxides [25,40], and particles clearly show a core-shell coverage.
Powder X-Ray Diffraction (XRD) measurements, used to study crystallinity and crystal phase of selected ternary oxides samples, allowed determine that, while samples prepared by HEM miss any crystallinity, samples prepared by CP show small size crystalline domains, with Cu2O is in its usual cubic phase and Fe2O3 in its rhombohedral α phase (hematite).

2.2. XPS Analysis

XPS measurements were carried out onto all single metal oxides and even a set of selected mixed oxides, in order to investigate their surface elemental composition, measured as atomic percentage, with oxidation state speciation. Such a study is fundamental in the present work, for evaluating how the different preparation techniques influence the properties of the materials. In binary metal oxide samples, regions relative to specific core levels and Auger transitions are here the object for detailed analysis of high resolution XPS spectra.
Copper oxidation state and speciation are commonly studied looking at high resolution spectra for Cu 2p3/2 core level in the Binding Energy (BE) range 925–950 eV and for Cu L3M4,5M4,5 (Cu LMM) Auger transition (BE 555–600 eV). Considerations about peak shape, curve fitting, shake-up peaks and the value of the proper modified Auger parameter are needed [41,42]. The latter equals 1849.0 eV in both commercial (C) and synthesized (S) samples. This value and the inspection of the Auger peak shape exclude any occurrence of Cu metal. Moreover, the lack of shake-up peaks in S-Cu2O confirms the almost exclusive presence of the Cu(I) oxidation state for copper atoms, while shake-up peaks observed in C-Cu2O, support the presence of CuO [41,42]. These considerations and curve fitting of O 1s XPS peak are used to determine the ratio Cu(I)/Cu(II), that equals 95/5 in S-Cu2O and 70/30 in C-Cu2O, showing that the surface of commercial Cu2O sample is significantly oxidized.
Similar arguments are used for speciation of Indium atoms: analysis involves the In 3d core level doublet (BE 440–460 eV) and the In M5N4,5N4,5 (In MNN) Auger transition (BE 1060–1090 eV) [43]. Energy positions of these are used to calculate a proper modified Auger parameter, which equals 850.8 eV in S-In2O3 and 851.1 eV in C-In2O3. The core level peaks resulted broad and symmetric, and no plasmon loss feature at higher binding energies were observed, as it would be expected if metallic Indium was present [43,44]. It can be thus concluded that In2O3 (both C and S) samples are formed exclusively of In(III)-oxide.
In samples containing iron atoms, the study about the Fe-oxidation state focused onto Fe 2p core level multiplet, occurring in the 705–730 eV region [45,46]. It is recorded as the envelope of different signals coming from electrostatic and spin interactions, from crystal field interactions and from spin-orbit coupling between the 2p and 3d states. This signal requires careful curve fitting operation able to identify the 2p3/2 main peak center of gravity and satellite peaks structures, due to shake-up and charge transfer processes, whose binding energy separation is used as parameter [45]. The recorded signal indicates that only the Fe3+ oxidation state is present in the prevalent α-Fe2O3 form in both C- and S-samples, which, nevertheless, show a different multiplet splitting and a different energy separation. The latter equals 7.4 eV in the S-Fe2O3 and 8.4 eV in the C-Fe2O3, with the higher value being indicative for the presence of Fe(OH)3 [45]. From the data above, one can conclude that S-samples are more reliable than commercial ones.
In mixed metal oxides samples, the surface composition (atomic percentage) was obtained through quantification from the single high resolution XPS spectra for specific peaks: C1s, O1s, and Cu2p3/2 elements were detected in all samples. Table 2 accounts for atomic percentage concentration data, which are specific for surface composition and can thus differ from those measured by EDX, which are instead relative to bulk concentration. By comparison with data in Table 1, a higher Cu atoms occurrence at the surface is observed for all samples, except for the CP-Cu/Fe-2 sample.
High resolution spectra for Cu speciation in mixed metal oxides samples are shown in Figure 1. By comparing samples prepared by HEM (Figure 1a,b) or CP (Figure 1c,d), a nearly perfect trace overlapping is observed in both Cu/In and Cu/Fe pairs, showing no difference for the preparation techniques.
Moreover, Cu atoms on the surface are exclusively encountered as Cu(I), with a CuO component that is observed only in traces and not quantifiable [42]. This is true also for samples prepared using commercial-Cu2O, which contains 30% CuO (vide infra), showing that, where present, Cu(II) is in the bulk more than on the surface.
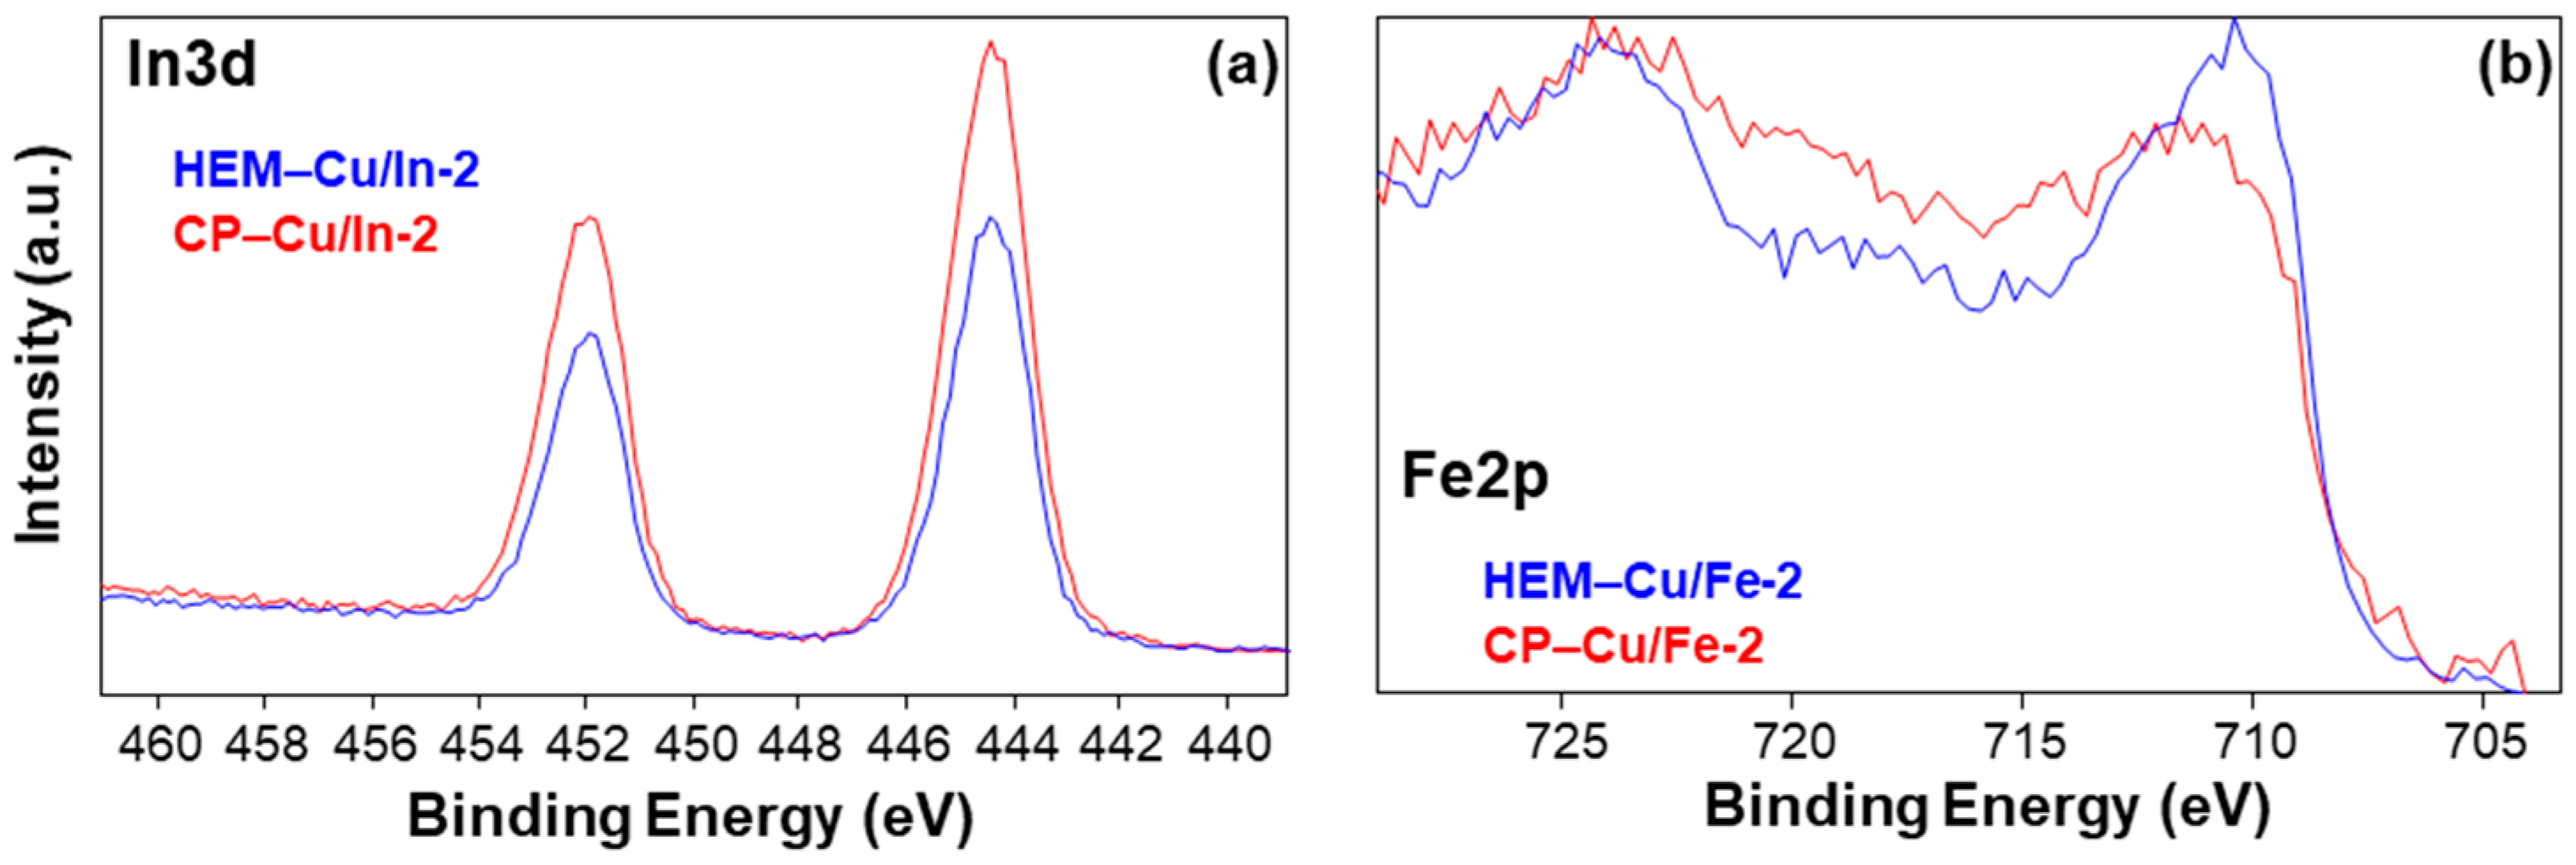
The spectra for In-3d core level doublet were recorded in HEM and CP mixed oxides samples and they are shown in Figure 2a: the only chemical state observed was In2O3 [43,44]. Figure 2b shows the Fe 2p core level spectra as recorded in mixed oxides samples. Curve fitting results and peak analysis show the presence of the solely α-Fe2O3 form of iron species [45,46] in both measured samples.
In conclusion, samples prepared by HEM and CP do not show differences for what concerns the surface composition, and more interestingly C- and S-samples of ternary oxides show very similar surface composition and properties, even if C-Cu2O contains 30% of Cu(II) which remains confined in the bulk.

Valence Band Maximum Evaluation by XPS

XPS analysis can be used to measure Valence Band Maximum (VBM) energy level, which is fundamental for subsequent band structure evaluation. This task can be accomplished adopting the procedure developed by Kraut and co-workers [47,48], then correctly extended to not covalent and oxide-based semiconductors by Chambers and co-workers [49]. The procedure requires acquisition of the XP spectrum in the low binding energy region, near the zero-value which corresponds to the Fermi level. Here, the XP spectrum reflects the electron density in the low energy states [47,48,49]. The VBM energy is determined as the intersection of two straight lines, obtained from least square fitting: the first line fits the spectrum baseline and background over the Fermi level, the second line fits the leading edge of the spectrum towards increasing binding energy [49]. In this work, while the band edge fitting operation was optimized through the maximization of R2 correlation coefficient, the background fitting operation was performed by inclusion of all data points measured at negative binding energies coordinates. Figure 3 shows XP spectra in the Valence Band region, between 11 and -3 eV, with comparison of Commercial and Synthesized binary metal oxide samples. In Cu2O samples, a 0.74±0.20 eV difference in extracted band edges is observed, though spectra are similar in shape and sharp steep band edges do appear. Spectra are shown in Figure 3a with values equal 1.65±0.20 and 0.86±0.14 eV in C-Cu2O and S-Cu2O samples, respectively, the difference being ascribed to the presence of CuO in the C-sample, for which a more positive VB edge is commonly attested [19,40,50]. Results agree with both theoretical [40,51] and experimental common literature references [19,20,50,52].
XP spectra for valence band region in In2O3 samples are shown in Figure 3b, where a certain difference is observed: the synthesized sample shows a higher intensity peak than the commercial one. This feature is indicative of a higher number of localized electrons within the VB energy levels, and its origin has been identified in the occurrence of random O-vacancies, whose levels build up the VB ones by orbital mixing [53], and in the crystalline domains size. This last could result reduced enough to hinder efficient electron transfer to the CB and so decrease the naturally occurring n-type character of this semiconductor material [25,54]: in fact, VBM results are closer to the Fermi level. Extracted values equal 2.20±0.11 and 1.80±0.15 eV for Commercial and Synthesized samples respectively, and both result less positive than literature values [25,30,34,52], making the material closer to hydrogen evolution potential.
Figure 3c reports XP spectra for valence band region in Fe2O3 samples, and differences between samples are visible, similar to those observed in In2O3 samples. In this case, the Commercial sample is characterized by a higher number of electrons in the VB, supposed to derive from localized states within the energy gap, due to defective particles, especially oxygen vacancies [55], and agree with the presence of iron hydroxide traces shown by XPS speciation measurements.
A less intense signal is recorded in the synthesized sample, and it is thought to be caused by defective particles and small crystalline domains. XPS data for Fe-containing systems are typically difficult to fit/convolve. Extracted VBM position are 1.53 ± 0.22 and 1.67 ± 0.23 eV for C-Fe2O3 and S-Fe2O3 samples, respectively, with a small difference between them and at lower energy than some literature theoretical [55,56] and experimental data [36,39,57]. Table 3 lists VBM extracted values for all binary metal oxide samples described above.

2.3. UV-Visible Spectroscopy Characterization

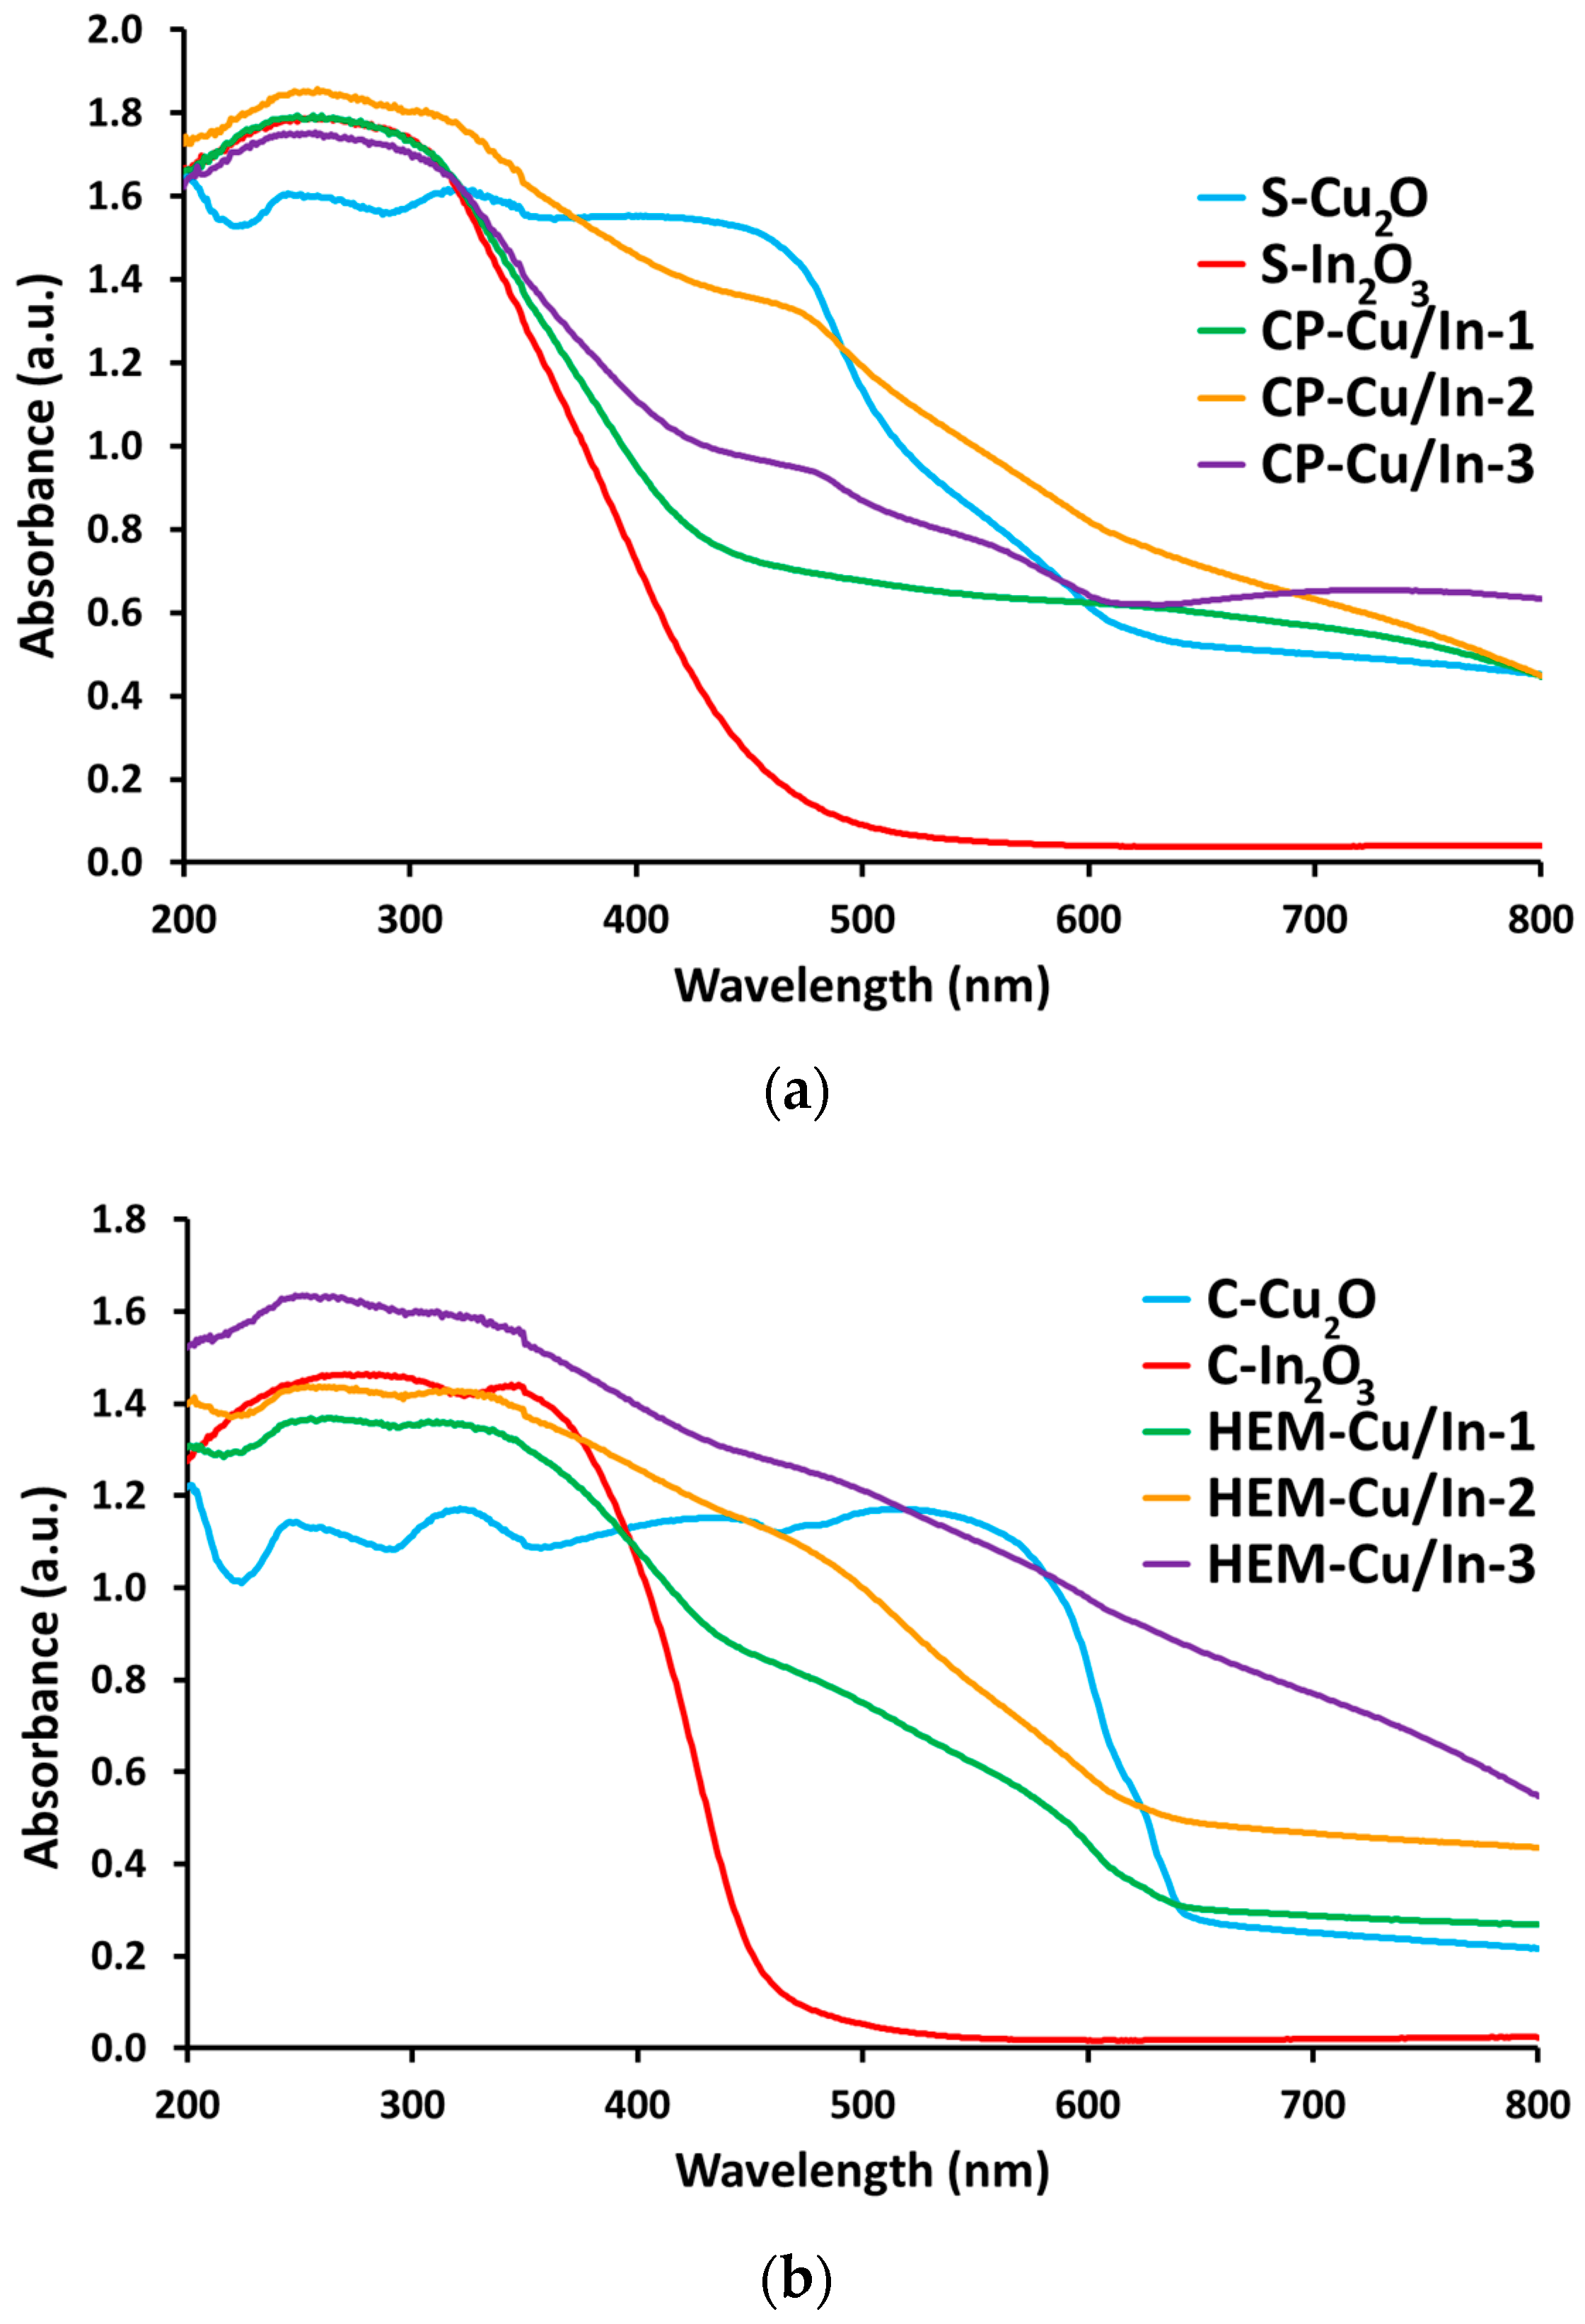
The first step for photocatalytic processes is light absorption, thus UV-Visible Diffuse Reflectance Spectroscopy (UV-VIS DRS) was used to measure the optical properties for all samples in 200–800 nm range. The UV-VIS DRS properties directly depend on band gap and electronic energy structure and they affect the photocatalytic activity too [10,11,18]. Changes of light absorption properties with composition were observed in mixed oxide samples in present work. In samples containing the Cu2O/In2O3 pair, absorption spectra (Figure 4) clearly change with composition. Lines corresponding to binary metal oxides are plotted for comparison. Whether HEM or CP preparation technique is adopted, the increase in Cu/In ratio induces a general redshift in absorption spectra and a corresponding significant absorption at wavelengths above 500 nm, where fundamental transition of Cu2O is [19]. While the absorption tail observed in CP prepared samples (Figure 4a) can be attributed mainly to scattering phenomena, due to aggregation of small particle size, the reduction in size for Cu2O component is at the origin of the blueshift observed in spectra of HEM prepared samples (Figure 4b). Such a shift and the marked absorption tails observed at long wavelengths for samples prepared using C-Cu2O are instead attributed to the not negligible CuO presence in commercial Cu2O, because CuO fundamental absorption occurs at lower energy [19].
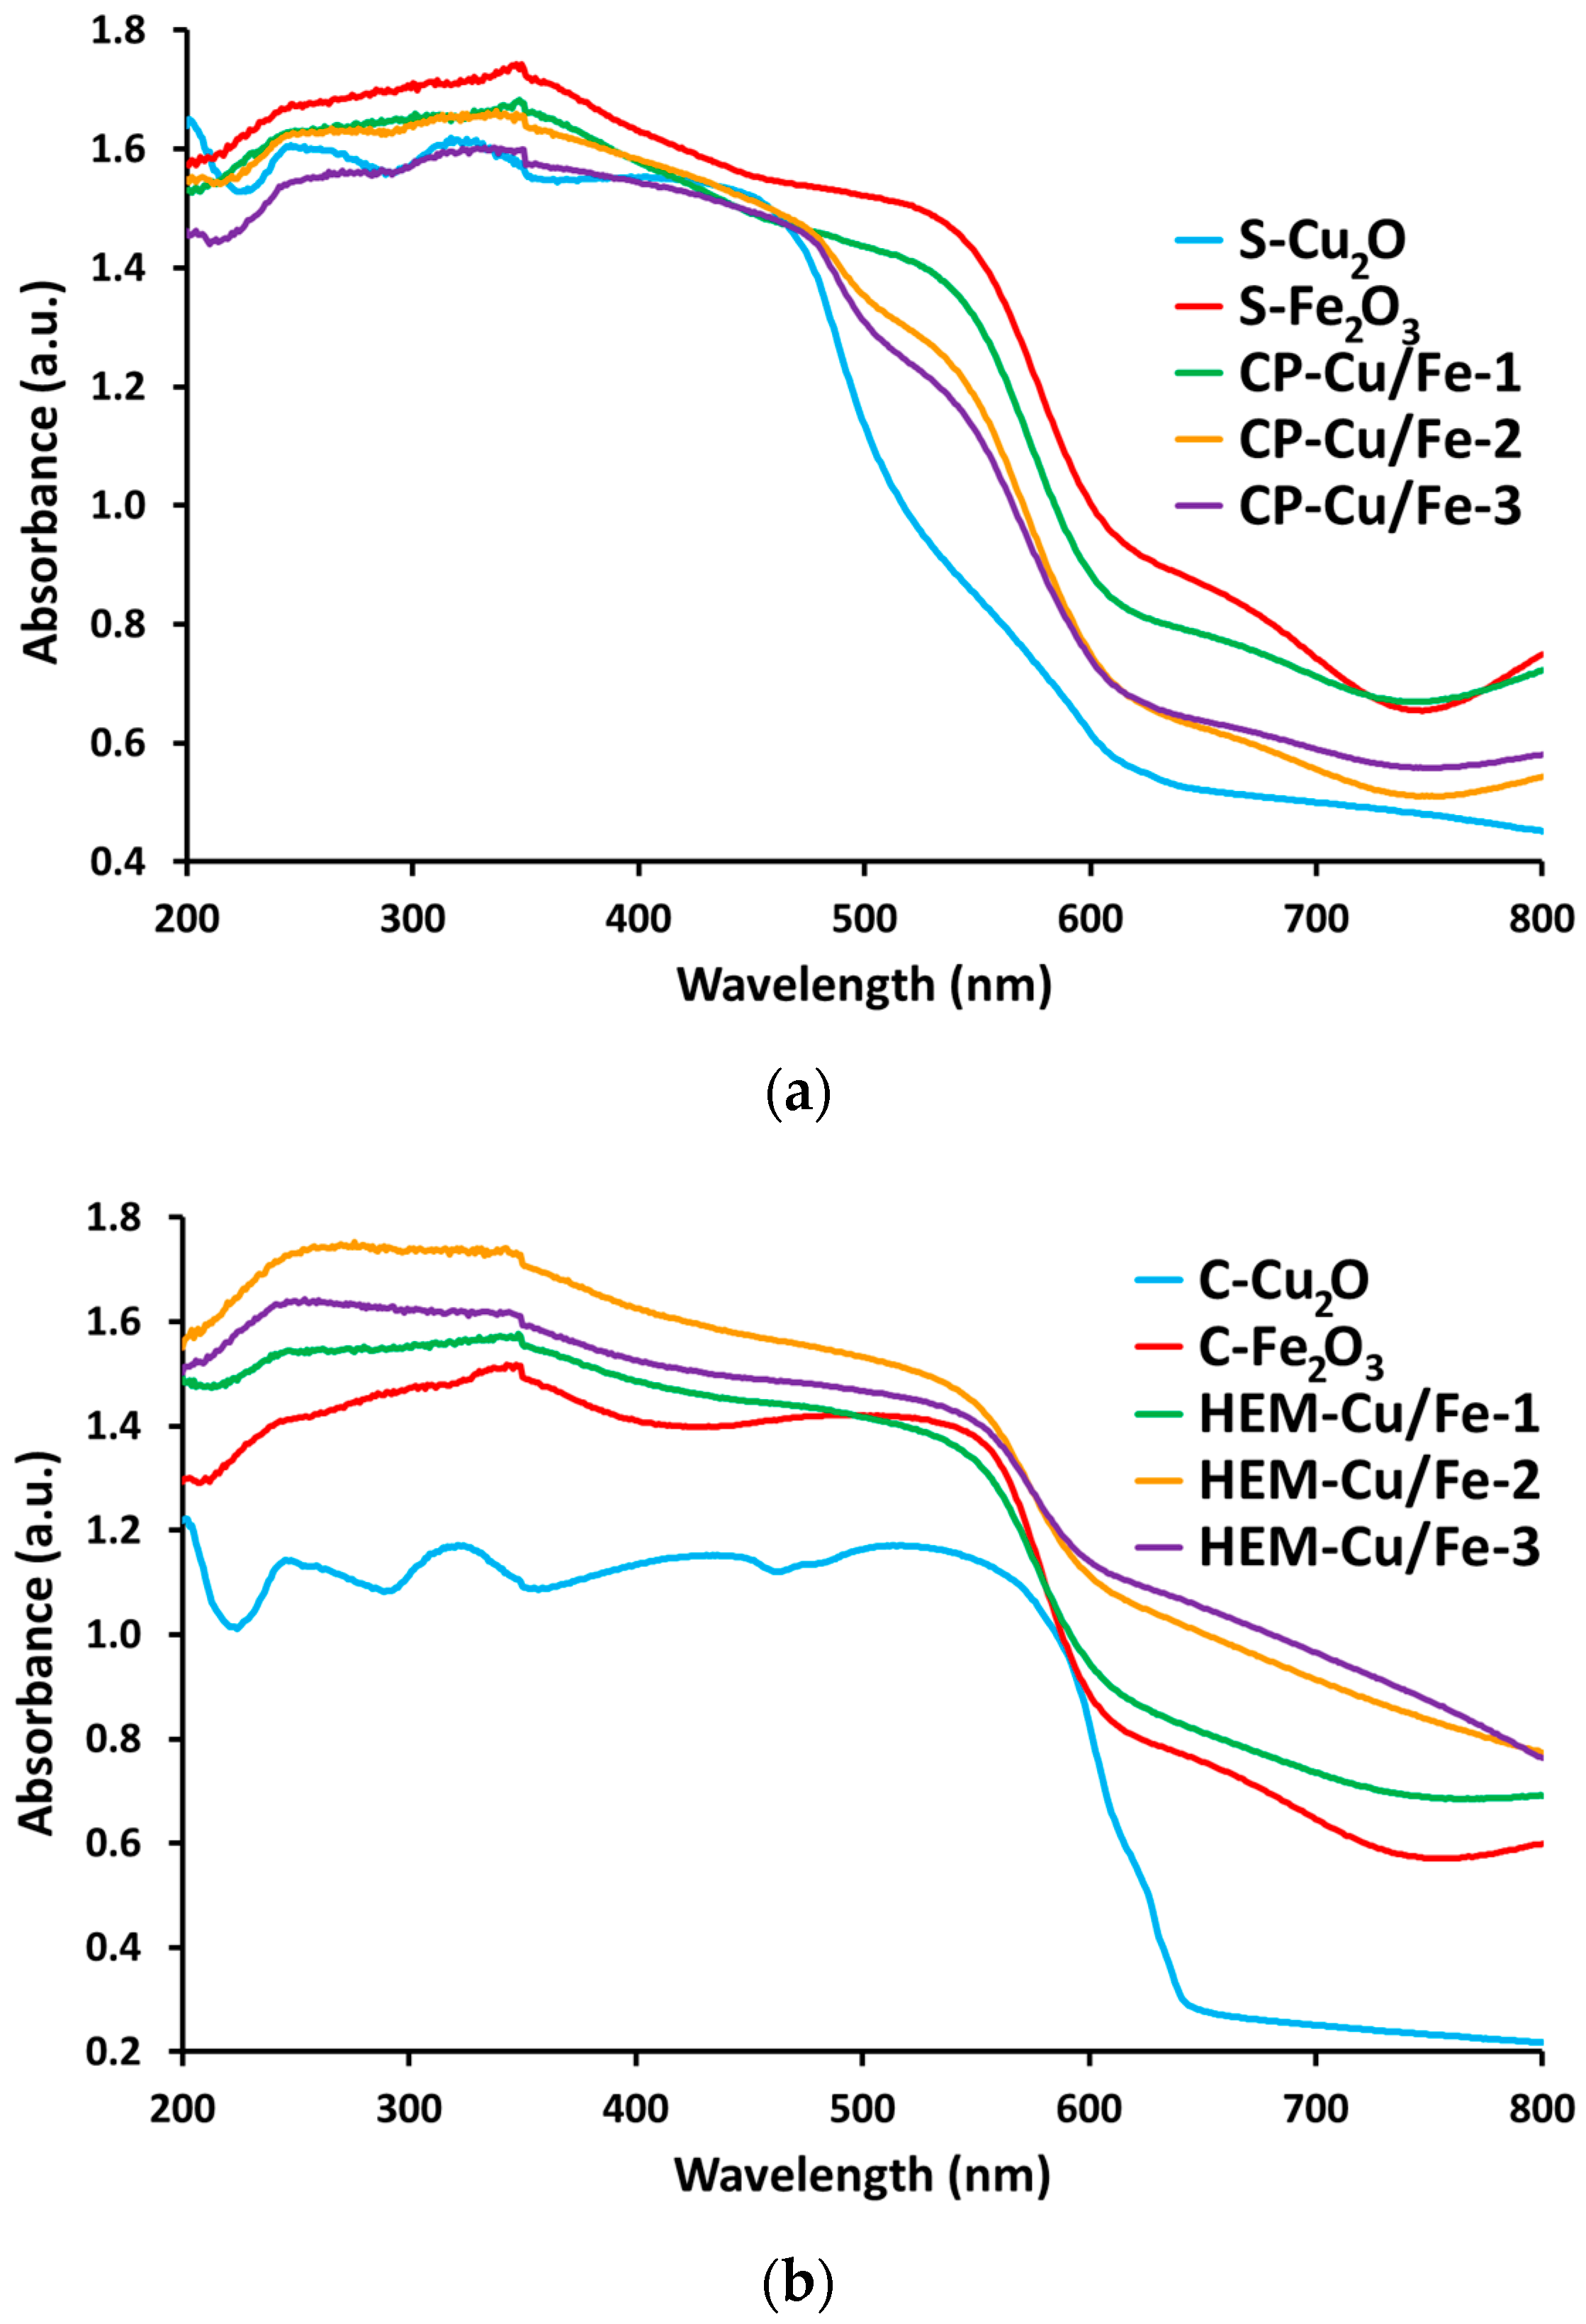
Absorption spectra recorded for samples containing the Cu2O/Fe2O3 pair are shown in Figure 5, together with lines of binary metal oxides for comparison. Here, the increase in Cu/Fe is found to change absorption spectra for both preparation techniques, but in a different way accounting for absorption features of the two components at wavelengths longer than 500 nm [19,26]. In CP prepared samples (Figure 5a) the component oxides present fundamental absorption region different enough to observe a linear trend with increasing Cu/Fe ratio and thus a slight blueshift and increasing similarity towards the Cu2O spectrum. This feature has been attributed to typical α-Fe2O3 spectra characteristics which appear over 550 nm [26,55], well over than S-Cu2O fundamental absorption [19], thus, the addition of this specific component did not result in a redshift. On the contrary, in samples prepared by HEM using C-Cu2O (Figure 5b), spectra of precursor components (C-Cu2O and C-Fe2O3) show a similar fundamental absorption region and differences only in absorption intensity. Hence, an increase in Cu/Fe ratio corresponds to a higher absorption at longer wavelengths, which has been mainly attributed to CuO impurities in C-Cu2O precursor.
However, DRS absorption measurements demonstrated that prepared nanocomposites are photoactive in almost the whole UV-Visible range in function of their composition. In particular, the introduction of Cu2O has given In2O3 a better response in the VIS-region, while the interaction between Cu2O and α-Fe2O3 has induced less predictable effects because of similar fundamental absorption. Studying these features is crucial because they are involved in enhancement of solar light harvesting properties for application in photocatalysis. Anyway, in both pairs, properties are very sensitive to nanocomposites preparation procedures, and thermal treatments.

Band-Gap Evaluation by UV-Visible Spectroscopy

The optical energy gap (Eg,opt) is a fundamental property in semiconductors and it equals the minimum energy required to excite an electron from VB to CB by means of light absorption. This energy gap can be directly measured through UV-Visible spectroscopy, if a single fundamental absorption is clearly distinguished. In case this is not possible or solid-state samples are studied, as in the present work, a simple and widely adopted data elaboration method can be used, which is described in detail elsewhere [58,59]. Briefly, the Kubelka–Munk function (K–M), F(R), is calculated starting from the experimental reflectance spectrum and is related to linear absorption coefficient α and to Eg,opt through a power law (1) describing the optical absorption strength in function of photon energy.
F(R)·(hν) = A·(hν − Eg)n
The exponent n assumes different values depending on the type of electronic transition. Provided there is some knowledge about the occurring electronic transition, the plot of product (2) versus radiation energy, (hν), shows up a linear trend in the region corresponding to fundamental absorption and energy gap [58,59].
(F(R)·(hν))1/n
The linear least square fitting in this region allows for the extraction of the Eg,opt value as the intersection of straight line with the energy axis, according to the Tauc Plot extrapolation procedure. It can be applied to pure or lightly doped semiconductors, but it does not produce reliable results if fundamental absorption edges are not separable or if a simple combination of individual optical gaps cannot be assumed, as in highly doped semiconductors or in nanocomposites. In the present work, mixed oxide samples fall in the second case, therefore Eg,opt value was measured only for all single metal oxide samples. The linear regression operations have been optimized by merging two criteria: (a) maximization of correlation coefficient R2, ensuring a better description by linear model and (b) consideration of a calculation range containing a minimum of 20 data points, to give procedure a statistical validation. Matching those two criteria allows for a good extrapolation result. Tauc Plots for different single metal oxide samples are shown in Figure 6.
In the case of Cu2O, absorption spectra are reported as light blue traces in both Figure 4 and Figure 5 and large difference do appear between C-Cu2O and S-Cu2O samples. Absorption in the commercial sample extends up to 600 nm, while the S-Cu2O sample shows a significant absorption in the UV region, decreasing significantly over 500 nm, where some absorption is guaranteed by a pronounced tail extending at longer wavelengths. The extended presence of CuO (30%) in the commercial precursor and particle size cause the differences. Figure 6a shows Tauc Plots for Cu-oxide samples. These show a steeper rise for S-Cu2O sample and two very different values for estimated Eg,opt energies are observed, and both have been calculated assuming a direct allowed electronic transition occurs between VBM and CBM [19,40], and n coefficient is, thus, set equal to 0.5. Values within 2.0 and 2.2 eV are generally attested in literature for Cu2O [40], though quantum size effect is widely recognized able to markedly influence its energy gap. In this work, Eg,opt values equal to 2.047 and 2.495 eV for C-Cu2O and S-Cu2O sample, respectively, are found in accordance with literature [20,36,39]. This is also true for the synthesized sample, where a UV-shifted value is justified by quantum size confinement and where a pronounced tail, recorded before gap and reflected in absorption spectrum, is attributed to crystalline disorder and broad size dispersion.
Absorption spectra for In2O3 samples are shown in Figure 4 as red traces which do not show large differences at a first examination: both commercial and synthesized samples absorb radiation mainly in the near UV range (below 450 nm). Tauc Plots (Figure 6b) enhance features previously not evident, such as a large tail in the S-In2O3 trace or its steeper rise with respect to the C-In2O3. Extracted Eg,opt values are equal to 3.091 eV in C-In2O3 and to 3.610 eV in the S-In2O3 sample. The determination was performed considering that a direct allowed electronic transition occurs, as for recent studies [25,54]. Though band gap nature and electronic structure for In2O3 are somewhat controversial, a fundamental band gap ranging from 2.6 to 2.9 eV is now commonly accepted [25], and it slightly differs from the optical gap, attested within 2.3 and 3.8 eV [30,34], therefore values measured in the present work result in accordance with literature. The 0.6 eV difference observed has been deemed coming from the preparation technique. In this case, its contribution affects band structure mainly through the introduction of lattice defects, especially oxygen vacancies, and creation of mid-gap states, a phenomenon which is commonly found in n-type wide gap semiconductor oxides [54], the effect appears more pronounced in the S-In2O3 sample, where the trace shows a large tail extending towards low energies.
Both the Fe2O3 samples exhibit good light harvesting properties in the whole UV-Visible region, with significant absorption up to 600 nm, higher in S-Fe2O3 sample, as shown by analysis of red traces in Figure 5. Four different regions are commonly identified in absorption spectra [31] and the fundamental band gap is recognized at 2.2 eV [26,55], with discussion whether its direct or indirect nature and thus its coincidence with the optical band gap. Furthermore, complication can arise in Eg,opt determination because it usually merges with an exciton absorption, which is produced by an indirect transition between 3d–3d orbitals and dominates spectra over 550 nm, giving hematite its typical red color [55]. The exciton is clearly observed in Tauc Plots as the low intensity shoulder with onset at 2.1 eV (Figure 6c). Because of this indirect nature, absorption below 2.1–2.2 eV is considered not able to produce useful separated electron-hole pairs, suffering from very fast recombination, a widely recognized drawback in α-Fe2O3 [26,55]. Therefore, to study photocatalysis-useful optical absorption, a direct allowed transition has been assumed for Tauc Plots. Extracted Eg,opt equal 2.772 and 2.875 eV for S-Fe2O3 and C-Fe2O3 sample, respectively. Although these values result unusually larger than the commonly accepted and measured ones [31,32,36,39], such a discrepancy can be explained by peculiar interacting electronic levels in iron atoms and presence of lattice defective particles. All these elements can lead to mixing between the standard direct gap and higher energy features (Ligand to Metal Charge Transfer (LMCT) processes occurring at 2.9–3.1 eV) [55]. Aggregation of very small particles towards polycrystalline clusters formation was cited able to enhance this mixing and can be also identified as the source for the large tailing trend in S-Fe2O3 trace.
Table 4 lists single metal oxide samples, with indication of optical energy gap extracted values and corresponding absorption wavelength. Except for iron oxide, S-samples show higher optical energy gaps than C-ones. Moreover, S-samples reveal a tailing trend more pronounced than in C-samples, indicative of broader size dispersion and lower average size (10–50 nm).

2.4. Band Structure Evaluation and Discussion

Possible photocatalytic activity performances in solar fuels production by utilization of ternary metal oxides prepared in this work has been outlined on the basis of electronic band structure of binary and ternary mixed metal oxides samples. In fact, the energy position of band edges corresponds to redox potential of electrons and holes in semiconductor materials, thus it determines the redox behavior of photogenerated charge carriers and their possible transfer to adsorbed chemical species, as needed for photocatalytic reaction to occur [6,7,10,11].
An estimation for VBM and CBM is thus fundamental in characterization of semiconductors, and this task is usually accomplished by combination of theoretical considerations and of experimental data obtained by use of different techniques [10,11,12]. For energy band structure evaluation in the present work, experimental data for VB edges, as determined by XPS, and for Eg,opt, as determined by UV-Visible DRS, have been used in combination with theoretical arguments, found in literature, about energy band structure of specific semiconductor metal oxide considered. Band structures plots are shown in Figure 7 for ternary metal oxides, and they are reported as composed by those of binary metal oxides and compared to redox potentials involved in solar fuels production [2,11].
In all band structure schemes (Figure 7), the left side refers to Cu2O energy bands, both for C- and S-samples. These were determined by considering only VBM and Eg,opt, where this last equals the fundamental Eg [19]. A big discrepancy observed in energy gap values and band position has been ascribed to CuO impurities, which were detected in C-samples used as precursor for HEM, and to quantum size confinement effect. Both of these arguments concur to the whole S-Cu2O sample structure being moved upward in energy with respect to the C-Cu2O sample, for which a different plot for Cu2O and CuO is not possible. Moreover, it is worth noting that both CuO and Cu2O are p-type semiconductors materials [19,50], but the unpredictable formation of junctions between Cu2O and CuO can affect the Fermi level position in C-Cu2O [50], thus hiding the p-type character expected in the schemes of Figure 7a,c, which is on the contrary easily detectable in schemes of Figure 7b,d, referred to S-Cu2O.
Band structures schemes for C-In2O3 and S-In2O3 samples are reported in Figure 7a,b, respectively, where theoretical arguments found in literature about somewhat controversial and long debated electronic structure were considered [25]. In this frame, the direct optical gap measured involves a level which lays 0.81 eV below the VBM determined by XPS. Thus, the fundamental Eg for In2O3 equals 2.28 and 2.80 eV for C-In2O3 and S-In2O3 samples, respectively, in accordance with a maximum possible 2.9 eV value [25]. Also, schemes report correct n-type semiconductor behavior in both the samples [25,54].
In the case of Fe2O3 samples, band structure schemes are plotted in Figure 7c,d for C-Fe2O3 and S-Fe2O3 samples, respectively. While optical energy gap is considered to occur between the VBM determined by XPS and a level above the CBM, the fundamental energy gap involving the real CBM equals the energy required for exciton formation [55]. This energy has been measured by studying the corresponding optical absorption with Tauc Plot procedure, with assumption of an indirect transition (n equals 2) which incorporates exciton absorption and thus reflects the interested energy difference [31]. Fundamental Eg equals 2.01 and 1.97 eV for C-Fe2O3 and S-Fe2O3 samples, respectively, values slightly lower than common 2.1 eV expected for exciton in hematite [55]. As for the In2O3 samples, expected n-type semiconductor character results evident in all α-Fe2O3 samples [26,55].
Results obtained by this method are shown in Table 5, where band edges and energy gaps, both optical and fundamental are pointed out.
From data in Table 5, some photocatalytic activity result in solar fuels production can be expected only for the CP prepared Cu2O/In2O3 samples, whose band scheme structure is shown in Figure 7b. This pair could reveal useful in H2 generation coming from photocatalytic water splitting, a reaction in which it is able to participate thank to proper band levels alignment of two metal oxide components. In particular, electrons excited in Cu2O can move into In2O3 CB and leave behind holes in VB, a level adequate to oxidize water molecules. At the same time, the electrons photogenerated in In2O3 are in a level adequate to reduce H+ and produce H2, and this level also collects electrons coming from Cu2O CB, while the photogenerated holes move into Cu2O VB, where they can oxidize water molecules. On the other hand, large charge carrier recombination occurring in Cu2O could be responsible for widely recognized poor activity in general.
At the same time, CO2 reduction can show different trend whether a 1e- or multielectron-transfer is considered. In fact, the CB potential of the two components, results not negative enough for one electron transfer to CO2 molecule (−1.90 V vs. NHE is needed) [2]. As a matter of fact, this is not the reaction we are considering: the Proton Coupled Electron Transfer (PCET) is the process that should operate in the present case.
On the basis of similar considerations, poor activity for solar fuels production can be foreseen for other oxides pairs studied in the present work which do not provide the potential for one-electron transfer to CO2 molecule and do not show a proper level alignment for water splitting. Additionally, the presence of CuO impurities can be at the origin of enhanced charge carrier recombination, a phenomenon recognized in this material, up to withdrawn all photogenerated charge carriers from reaction or charge carrier separation processes. More, in both Cu2O/Fe2O3 pairs (Figure 7c,d), the not proper level alignment adds to their relative positions, which results not adequate for photogenerated charge carrier separation, as in HEM prepared pair (Figure 7c), or even in enhanced interband recombination, as in CP prepared pair (Figure 7d).

2.5. Photocatalytic Activity

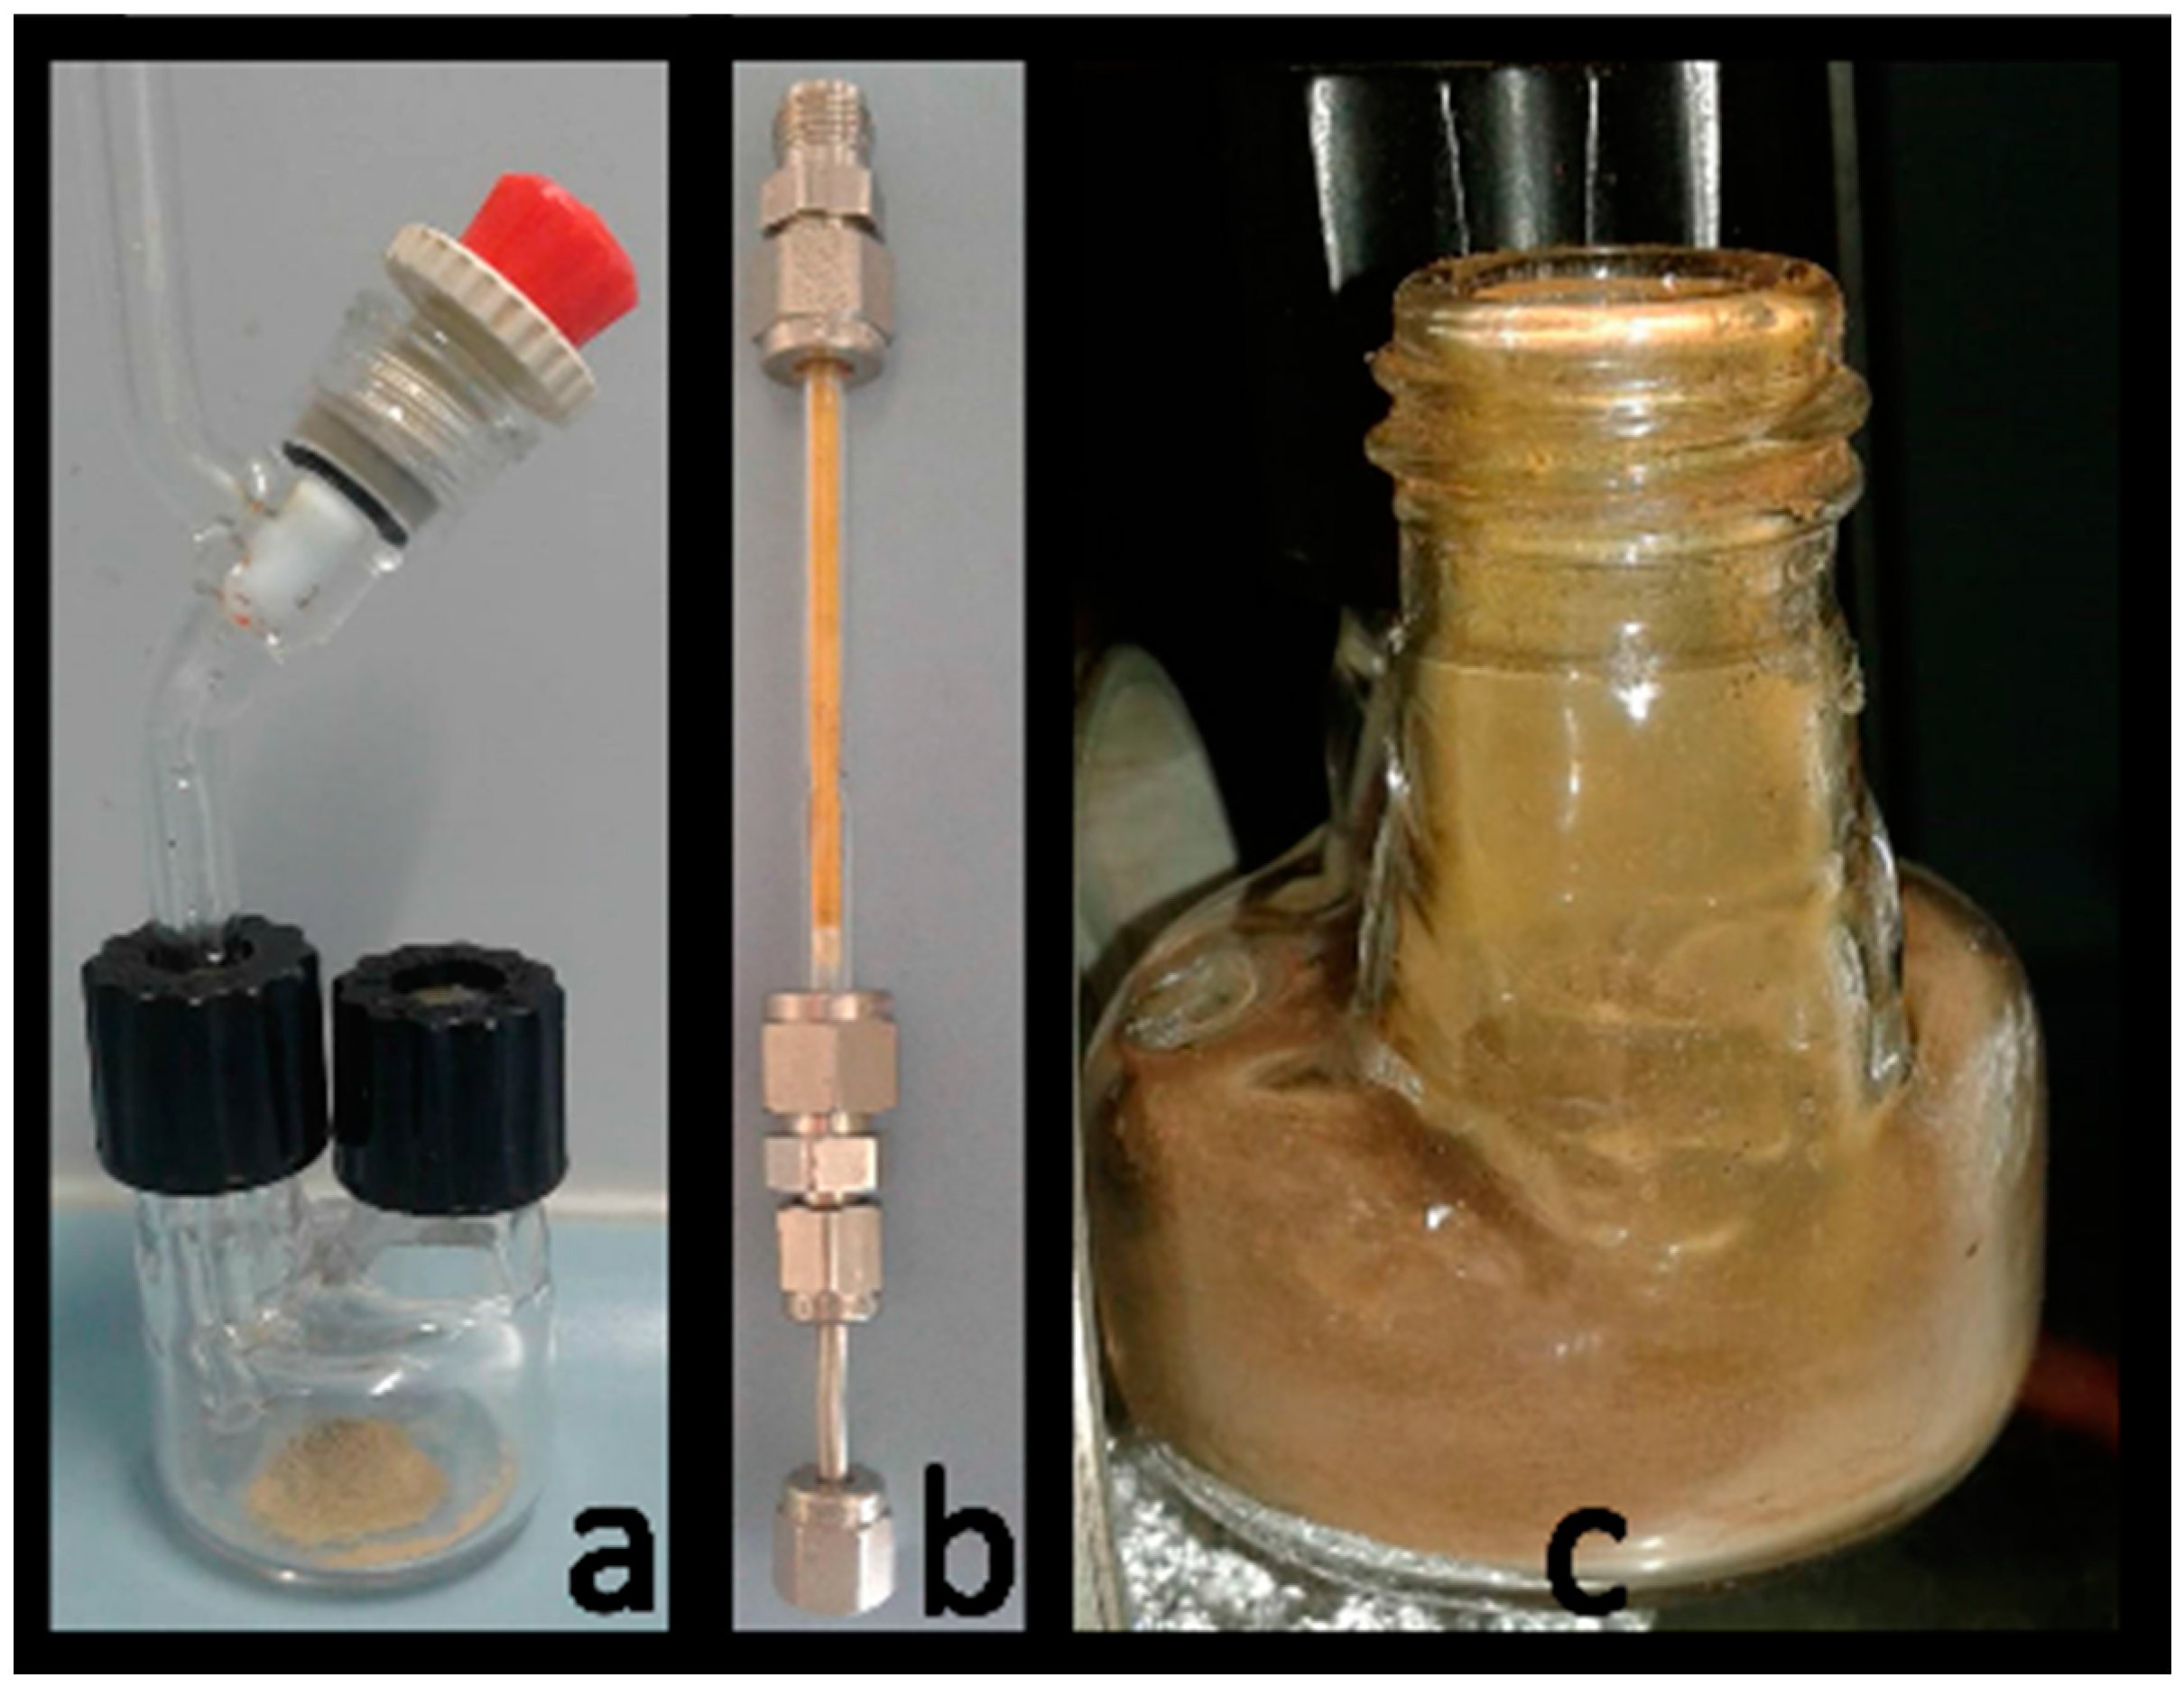
Therefore, among all materials prepared in this work, only CP-Cu2O/In2O3 was tested in CO2–H2O coprocessing, according to procedure described in Methods section, as reputed the only one able to carry out the redox process. Three different reactors were used for running the reaction, all under Xe-lamp irradiation (Figure 8).
When reactor (a) or (c) was used, the reaction gas was sampled with a gas-syringe, and with reactor (b) the gas was directly injected into the GC-column. Hydrogen and reduced species of CO2 were monitored at regular intervals of time up to 6 h. (see Figure S2 in Supplementary Materials) Table 6 gives the results for the reactors (a)–(c). Using bulk nano-catalysts, after 3 h of irradiation of a H2O-saturated CO2 stream at 298 K no reduction products were observed. Conversely, when the nano-catalyst was finely dispersed on the surface of the reactor the same mixture gave positive formation of H2 and traces of reduced CO2 species.
Results in Table 6 shift attention towards the fundamental role played by reactor design and reaction setup in carrying out a process difficult as the solar fuel production. It is clearly visible how the catalyst film distribution (reactor c), allowing for a better and more homogeneous light penetration to the photo-active centers with respect to the massive-powdered-material (reactors a,b), allows the reaction to go. In practice, a film-like distribution of the photomaterial is preferred to its bulk packing as the larger surface of the photo-catalyst allows more photons to be active. Most likely, if the illumination system is changed with respect to the one we have used (Xe-lamp), the reactor (b) will be working too. The lesson learned with such synthesis of photo-materials and photocatalytic experiments, prompts us to a more focused approach to photocatalyst development coupled to reactor design and engineering for a more active conversion of CO2 and water into energy products.

3. Materials and Methods

The following reagents were used as received and without any further treatment: Cu2O powder (Fluka AG, in Sigma-Aldrich, Steinheim, Germany), In2O3 powder (Sigma-Aldrich, Steinheim, Germany), Fe2O3 powder (Sigma-Aldrich, Steinheim, Germany), anhydrous CuSO4 (BDH Chemicals ltd, Poole, England), In(NO3)3xH2O (Sigma-Aldrich, Steinheim, Germany), FeCl3 (Carlo Erba Reagents srl, Milano, Italy), NaOH pellets (Fluka AG in Sigma Aldrich, Steinheim, Germany), and L-Ascorbic Acid (Alfa Aesar GmbH, Karlsruhe, Germany). Deionized water was used for all syntheses in which a solvent was required.

3.1. Preparation of Oxides

Single metal oxide samples were prepared by precipitation method, procedures adopted differ upon specific metal oxide. If not differently indicated, all operations were performed at ambient temperature and under air condition.

3.1.1. Cu2O

Copper (I) oxide samples were prepared by adding 20 mL of a 0.5 M NaOH aqueous solution, dropwise and under stirring, to 10 mL of a 0.5 M CuSO4 aqueous solution, thus producing copper (II) hydroxide. An adequate volume of a 0.1 M L-ascorbic acid aqueous solution was added dropwise, in order to reduce the Cu(II)-hydroxide into copper(I) oxide, Cu2O. Particles were separated by centrifugation (6000 rpm, 15 min), washed with deionized water, and dried at 80 °C overnight.

3.1.2. In2O3

To 15 mL of a 1.1 M In(NO3)3.H2O aqueous solution, 50 mL of a 1.2 M NaOH aqueous solution were added dropwise, under stirring. The resulting indium(III) hydroxide suspension was kept under constant stirring for one further hour, then the solid was separated by centrifugation (6000 rpm, 15 min), washed with deionized water, and dried at 80 °C overnight. The dried solid was grinded in a ceramic mortar and the powder was heated in air at 300 °C for 2 h and then at 400 °C for 1 h, to convert hydroxide into indium(III) oxide, In2O3.

3.1.3. Fe2O3

Iron (III) oxide was prepared adding drop by drop 50 mL of a 1.2 M NaOH aqueous solution to the same volume of a 0.4 M FeCl3 aqueous solution, under stirring. The so prepared suspension contains mixed oxide-hydroxide iron particles, which were separated by centrifugation (6000 rpm, 15 min), washed with deionized water and dried at 80 °C overnight. It was then grinded in a ceramic mortar and heated in air at 450 °C for 1 h, for complete conversion into iron(III) oxide, Fe2O3.

3.1.4. Preparation of Mixed Oxides by Coprecipitation Using Synthesized Binary Oxides

General Procedure: Cu2O was deposited on the nanoparticles of the second oxide with formation of core-shell In2O3 or Fe2O3 particles covered with Cu2O. We have attempted to produce Cu2O core shell covered with In2O3 or Fe2O3 but so far substantial oxidation of Cu(I) to Cu(II) was observed during the dehydration of In- or-Fe-hydroxides. In 20 mL of a 0.5 M CuSO4 aqueous solution, weighted (see below) amounts of the nano-sized powder for the n-type partner oxide were dispersed. 40 mL of a 0.5 M NaOH aqueous solution were dropwise added to such solution under stirring. When the addition was completed, an adequate amount of a 0.1 M L-ascorbic acid aqueous solution was added dropwise as a reductant (glucose has also been used, but with lower yield) to produce Cu2O that deposited on the n-type semiconductor. Particles were separated by centrifugation (6000 rpm, 15 min), washed with deionized water, and dried at 80 °C overnight.
(a)
3.5929, 1.5698, and 0.8121 g of S-In2O3 nano-powder were dispersed in CuSO4 aqueous solution for the ratios Cu/In-1, 2, and 3, respectively, and treated as reported above.
(b)
2.1781, 0.8799, and 0.7287 g of S-Fe2O3 powder were dispersed in CuSO4 aqueous solution for ratios Cu/Fe-1, 2, and 3, respectively and reacted as reported in the general procedure.

3.1.5. Preparation of Mixed Oxides by High Energy Milling-HEM Using Commercial Samples

General Procedure: Mixed oxides were prepared by weighting defined quantities of commercial metal oxides powders and pouring them in cylindrical agate jars (46 mL), together with 3 agate spheres, 1 cm in diameter. Jars were sealed and placed in a planetary mill (Pulverisette 7-Fritsch, GmbH, Idar-Oberstein, Germany) and subjected to two cycles at 800 rpm, each with a duration of 90 min.
(a)
for Cu/In-1, 0.5469 g of C-Cu2O and 1.9863 g of C-In2O3 were mixed.
(b)
for Cu/In-2, 0.8579 g of C-Cu2O and 1.6354 g of C-In2O3 were mixed.
(c)
for Cu/In-3, 1.2705 g of C-Cu2O and 1.2304 g of C-In2O3 were mixed.
(d)
For Cu/Fe-1, 0.7740 g of C-Cu2O and 1.7332 g of C-Fe2O3 were mixed.
(e)
For Cu/Fe-2, 1.4252 g of C-Cu2O and 1.5915 g of C-Fe2O3 were mixed.
(f)
For Cu/Fe-3, 1.6086 g of C-Cu2O and 0.8969 g of C-Fe2O3 were mixed.

3.2. Characterization

Powder materials composition was determined by EDX measurements using an EDX-720 Shimadzu Spectrometer (Shimadzu Europe GmbH, Duisburg, Germany).
UV-Visible DRS spectra were recorded in the 200–800 nm region with a Cary-5000 spectrophotometer (Agilent Technologies, Santa Clara, CA, United States), equipped with an integration sphere covered by polymer internal coating, with a standard sample of the same material and with sample-holder for powder material.
X-ray Photoelectron Spectroscopy (XPS) analyses were run on a PHI 5000 Versa Probe II Scanning XPS Microprobe spectrometer (ULVAC-PHI Inc., Kanagawa, Japan). The measurements were done with a monochromatised Al Kα source (X-ray spot 200 μm), at a power of 50.3 W. Wide scans and detailed spectra were acquired in Fixed Analyzer Transmission (FAT) mode with a pass energy of 117.40 eV and 29.35 eV, respectively. An electron gun was used for charge compensation (1.0 V 20.0 μA). Data processing was performed by using the MultiPak software v. 9.9.0.8.
Gas mixtures were analyzed using a GC (Thermo Scientific Focus GC), equipped with a SUPELCO Carboxen™ 1010 PLOT (30 m × 0.32 mm) and with a TCD detector.
A 150 W Xe XBO lamp (Osram) was used as source of light for irradiation.

3.3. Photocatalytic Activity

Materials activity in solar fuels production was evaluated by using three different reactor systems (Figure 8) fed with a reagent gas mixture composed of CO2 bubbled in deionized water to saturation. Such gas stream was flown for some minutes through the reactors during their loading operation in order to blow air away. Samples of gas were analyzed at regular intervals of time (30 min) over a period of 3–6 h.
In case (a), 0.1 g of nano-sized photocatalyst was placed in a 40 mL glass reactor, provided with two openings closed by hollow plastic caps. One cap holds a glass tube with a three-way valve for reagent gas mixture loading, the other is provided with a rubber septum for gas sampling using a 250 µL gas-tight syringe. The reactor was loaded with 0.15 MPa of CO2 saturated with H2O and stirred under illumination for 3 h. A gas-sample was withdrawn and analyzed using a GC.
In case (b), CO2 saturated with water at 298 K was flown through a 2 mm i.d. tube (equipped with valves for feeding, sampling and reactor closing and filled with the same nanosized-catalyst) at a rate of 0.1 mL/min under illumination and recycled using a micropump. After three hours cycling the gas was injected into a GC. Alternatively, the tube was filled with CO2–H2O and the closed system illuminated for 3–6 h. The gas was then injected into the GC column.
In case (c), 0.1 g of the nanosized photocatalyst were dispersed on the internal surface of the same vessel used in (a) using a suspension of the catalyst in a volatile liquid (acetone or pentane) that was then slowly evaporated by flowing N2. A thin, homogeneous solid film remained adherent to the surface of the reactor that was charged with CO2–H2O and illuminated. Illumination was applied for 3–6 h and a sample of gas was withdrawn with the gas-syringe at fixed intervals of time and analyzed by GC.

4. Conclusions

The experiments carried out in this work have confirmed that the properties of photocatalysts based on mixed oxides strongly depend on the starting materials and the way the binary- and mixed- oxides are prepared. Even their real composition depends on the technique used for their preparation. Careful analyses are necessary to confirm their composition that can or cannot match the stoichiometric ratio used in their preparation. The surface composition can be different from bulk and this can influence the reactions, should they occur on the surface or into channels in the bulk.
The electronic properties of the photo-materials change with their composition and mode of synthesis. Using two different techniques (HEM and CP), the fundamental properties of the photocatalysts have been measured, including the band-gap and electrochemical potential. Some of the catalysts prepared, based on their band gap and value of E, have been tested in the gas-phase photoreduction of CO2 + H2O. The experimental results show that the synthetic technique influences the photoactivity of the materials that can correctly be foreseen on the basis of bandgap experimentally derived. Of the mixed oxides prepared and described in this work, only Cu2O@In2O3 prepared by co-precipitation from synthesized binary oxides have shown positive results in CO2–H2O photo-co-processing. Preliminary results show that the composition and synthetic methodologies of mixed-oxides, the reactor geometry, the way of dispersing the photocatalyst sample, play a key role in the light driven reaction of CO2–H2O. Hydrogen plus reduced species of CO2 (in lower amount) have been observed, depending on the geometry of the reactor used and the photocatalyst used. In order to observe the formation of reduction products it is necessary that the catalyst is finely dispersed (thin film) and well illuminated. Massive amounts of photocatalyst are not active, at least under the illumination technique used in this work, most likely because the number of photons that reach the photoactive centers is quite low.
This work is a rare case of full characterization of photo-materials, using UV-Visible DRS, XPS, XRD, TEM, and EDX for the surface and bulk analytical characterization. We show that surface composition may not be the same of the bulk composition and plays a key role in photocatalysts behavior and a full material knowledge is necessary for the correct forecast of their photocatalytic behavior, inferred from experimentally determined bandgaps. Coupling UV-Vis DRS and XPS with EDX is necessary for getting the correct information about the composition of the materials and their surface-bulk characterization. Further studies are planned in order to discover the most active species and the best performing reactor geometry under best illumination conditions, using the systems which gave positive results so far. All of the systems described above are even under evaluation for discovering how their properties are changed with addition of partners such as noble metals or hole scavengers and attribute the correct role to each component of the photomaterial.

Supplementary Materials

The followings are available online at https://www.mdpi.com/2073-4344/10/9/980/s1, Figure S1: Comparison of CP-Fe2O3 XRD patterns with HEM-Cu/Fe-1 (a) and CP-Cu/Fe-1 (b) along with peak positions for reference diffraction patterns. Figure S2: High resolution XP spectra of all the samples. (a) C-Cu2O sample: (a1) Cu 2p3/2 spectral region, (a2) Cu LMM Auger transition and (a3) O1s spectral region. (b) S-Cu2O sample: (b1) Cu2p3/2 spectral region, (b2) Cu-LMM Auger transition and (b3) O1s spectral region. (c) C-In2O3 sample: (c1) In3d spectral region, (c2) In MNN Auger transition and (c3) O1s spectral region. (d) S-In2O3 sample: (d1) In3d spectral region, (d2) In MNN Auger transition and (d3) O1s spectral region. Fe2p spectral region for (e1) C-Fe2O3 and (e2) S-Fe2O3. Figure S3: H2 evolution with time by using CP-Cu/In mixed oxides under VIS light irradiation.

Author Contributions

Conceptualization, M.A. and A.D.; synthesis methodology and GC analytical techniques, F.N.; synthesis and spectroscopic characterization of photomaterials, D.M.S.M.; XPS analysis, N.D.; writing—original draft preparation, D.M.S.M.; writing—review and editing, M.A. and A.D.; supervision, A.D.; project administration, A.D.; funding acquisition, A.D. All authors have read and agreed to the published version of the manuscript.

Funding

This research received MIUR-IT funding. It was executed within the frame of a preliminary work of an international collaboration that has brought to a common EU-Project application.

Acknowledgments

The authors thank Roberto Comparelli (Istituto per i Processi Chimico-Fisici, Consiglio Nazionale delle Ricerche, c/o Dipartimento di Chimica, Università di Bari) and Teresa Sibillano (Istituto di Cristallografia, Consiglio Nazionale delle Ricerche, Bari) for performing and interpreting preliminary TEM and powder XRD measurements, respectively.

Conflicts of Interest

The authors declare no conflict of interest.

References

  1. Global Monitoring Laboratory-Global Greenhouse Gas Reference Network. Available online: https://www.esrl.noaa.gov/gmd/ccgg/trends/global.html (accessed on 8 April 2020).
  2. Aresta, M.; DiBenedetto, A.; Quaranta, E. State of the art and perspectives in catalytic processes for CO2 conversion into chemicals and fuels: The distinctive contribution of chemical catalysis and biotechnology. J. Catal. 2016, 343, 2–45. [Google Scholar] [CrossRef]
  3. Aresta, M.; DiBenedetto, A.; Angelini, A. The changing paradigm in CO2 utilization. J. CO2 Util. 2013, 3, 65–73. [Google Scholar] [CrossRef]
  4. Pesnell, D.; Addison, K. SDO | Solar Dynamics Observatory. Available online: https://sdo.gsfc.nasa.gov/ (accessed on 13 April 2020).
  5. Ali, S.; Flores, M.C.; Razzaq, A.; Sorcar, S.; Hiragond, C.B.; Kim, H.R.; Park, Y.H.; Hwang, Y.; Kim, H.S.; Kim, H.; et al. Gas phase photocatalytic CO2 reduction, “A brief overview for benchmarking”. Catalysts 2019, 9, 727. [Google Scholar] [CrossRef] [Green Version]
  6. Clarizia, L.; Russo, D.; Di Somma, I.; Andreozzi, R.; Marotta, R. Hydrogen generation through solar photocatalytic processes: A review of the configuration and the properties of effective metal-based semiconductor nanomaterials. Energies 2017, 10, 1624. [Google Scholar] [CrossRef] [Green Version]
  7. Babu, V.J.; Vempati, S.; Uyar, T.; Ramakrishna, S. Review of one-dimensional and two-dimensional nanostructured materials for hydrogen generation. Phys. Chem. Chem. Phys. 2015, 17, 2960–2986. [Google Scholar] [CrossRef]
  8. Inoue, T.; Fujishima, A.; Konishi, S.; Honda, K. Photoelectrocatalytic reduction of carbon dioxide in aqueous suspensions of semiconductor powders. Nature 1979, 277, 637–638. [Google Scholar] [CrossRef]
  9. Lehn, J.-M.; Ziessel, R. Photochemical generation of carbon monoxide and hydrogen by reduction of carbon dioxide and water under visible light irradiation. Proc. Natl. Acad. Sci. USA 1982, 79, 701–704. [Google Scholar] [CrossRef] [Green Version]
  10. Stolarczyk, J.K.; Bhattacharyya, S.; Polavarapu, L.; Feldmann, J. Challenges and prospects in solar water splitting and CO2 reduction with inorganic and hybrid nanostructures. ACS Catal. 2018, 8, 3602–3635. [Google Scholar] [CrossRef]
  11. Li, K.; Peng, B.; Peng, T. Recent advances in heterogeneous photocatalytic CO2 conversion to solar fuels. ACS Catal. 2016, 6, 7485–7527. [Google Scholar] [CrossRef]
  12. Nikokavoura, A.; Trapalis, C. Alternative photocatalysts to TiO2 for the photocatalytic reduction of CO2. Appl. Surf. Sci. 2017, 391, 149–174. [Google Scholar] [CrossRef]
  13. Baran, T.; Wojtyła, S.; DiBenedetto, A.; Aresta, M.; Macyk, W. Zinc sulfide functionalized with ruthenium nanoparticles for photocatalytic reduction of CO2. Appl. Catal. B Environ. 2015, 178, 170–176. [Google Scholar] [CrossRef]
  14. Baran, T.; Wojtyła, S.; DiBenedetto, A.; Aresta, M.; Macyk, W. Photocatalytic carbon dioxide reduction at p-Type Copper(I) Iodide. ChemSusChem 2016, 9, 2933–2938. [Google Scholar] [CrossRef] [PubMed]
  15. Li, X.; Yu, J.; Jaroniec, M.; Chen, X.-B. Cocatalysts for selective photoreduction of CO2into solar fuels. Chem. Rev. 2019, 119, 3962–4179. [Google Scholar] [CrossRef]
  16. Védrine, J.C. Heterogeneous catalysis on metal oxides. Catalysts 2017, 7, 341. [Google Scholar] [CrossRef] [Green Version]
  17. Roy, D.; Samu, G.F.; Hossain, M.K.; Janáky, C.; Rajeshwar, K. On the measured optical bandgap values of inorganic oxide semiconductors for solar fuels generation. Catal. Today 2018, 300, 136–144. [Google Scholar] [CrossRef]
  18. Wang, Z.; Liu, Y.; Huang, B.; Dai, Y.; Lou, Z.; Wang, G.; Zhang, X.; Qin, X. Progress on extending the light absorption spectra of photocatalysts. Phys. Chem. Chem. Phys. 2014, 16, 2758. [Google Scholar] [CrossRef] [PubMed]
  19. Christoforidis, K.C.; Fornasiero, P. Photocatalysis for hydrogen production and Co2 reduction: The case of copper-catalysts. ChemCatChem 2018, 11, 368–382. [Google Scholar] [CrossRef]
  20. Luévano-Hipólito, E.; Torres-Martínez, L.; Martínez, D.S.; Cruz, M.A. Cu2O precipitation-assisted with ultrasound and microwave radiation for photocatalytic hydrogen production. Int. J. Hydrog. Energy 2017, 42, 12997–13010. [Google Scholar] [CrossRef]
  21. Aguirre, M.E.; Zhou, R.; Eugene, A.J.; Guzman, M.I.; Grela, M.A. Cu2O/TiO2 heterostructures for CO2 reduction through a direct Z-scheme: Protecting Cu2O from photocorrosion. Appl. Catal. B Environ. 2017, 217, 485–493. [Google Scholar] [CrossRef]
  22. An, X.; Li, K.; Tang, J. Cu2O/reduced graphene oxide composites for the photocatalytic conversion of CO2. ChemSusChem 2014, 7, 1086–1093. [Google Scholar] [CrossRef] [Green Version]
  23. Xiong, Z.; Lei, Z.; Kuang, C.-C.; Chen, X.; Gong, B.; Zhao, Y.; Zhang, J.; Zheng, C.; Wu, J.C. Selective photocatalytic reduction of CO2 into CH4 over Pt-Cu2O TiO2 nanocrystals: The interaction between Pt and Cu2O cocatalysts. Appl. Catal. B Environ. 2017, 202, 695–703. [Google Scholar] [CrossRef]
  24. Handoko, A.D.; Tang, J. Controllable proton and CO2 photoreduction over Cu2O with various morphologies. Int. J. Hydrog. Energy 2013, 38, 13017–13022. [Google Scholar] [CrossRef] [Green Version]
  25. Bierwagen, O. Indium oxide—A transparent, wide-band gap semiconductor for (opto)electronic applications. Semicond. Sci. Technol. 2015, 30, 024001. [Google Scholar] [CrossRef]
  26. Mishra, M.; Chun, D.-M. α-Fe2O3 as a photocatalytic material: A review. Appl. Catal. A Gen. 2015, 498, 126–141. [Google Scholar] [CrossRef]
  27. Cao, S.-W.; Liu, X.-F.; Yuan, Y.-P.; Zhang, Z.; Liao, Y.; Fang, J.; Loo, S.C.J.; Sum, T.C.; Xue, C. Solar-to-fuels conversion over In2O3/g-C3N4 hybrid photocatalysts. Appl. Catal. B Environ. 2014, 147, 940–946. [Google Scholar] [CrossRef]
  28. Tahir, M.; Tahir, B.; Amin, N.A.S.; Muhammad, A. Photocatalytic CO2 methanation over NiO/In2O3 promoted TiO2 nanocatalysts using H2O and/or H2 reductants. Energy Convers Manag. 2016, 119, 368–378. [Google Scholar] [CrossRef]
  29. Hoch, L.B.; He, L.; Qiao, Q.; Liao, K.; Reyes, L.M.; Zhu, Y.; Ozin, G.A. Effect of precursor selection on the photocatalytic performance of indium oxide nanomaterials for gas-phase CO2 reduction. Chem. Mater. 2016, 28, 4160–4168. [Google Scholar] [CrossRef]
  30. Hu, B.; Guo, Q.; Wang, K.; Wang, X.T. Enhanced photocatalytic activity of porous In2O3 for reduction of CO2 with H2O. J. Mater. Sci. Mater. Electron. 2019, 30, 7950–7962. [Google Scholar] [CrossRef]
  31. Ba-Abbad, M.M.; Takriff, M.S.; Benamor, A.; Mohammad, A.W. Size and shape controlled of α-Fe2O3 nanoparticles prepared via sol–gel technique and their photocatalytic activity. J. Sol-Gel Sci. Technol. 2016, 81, 880–893. [Google Scholar] [CrossRef]
  32. Boumaza, S.; Kabir, H.; Gharbi, I.; Belhadi, A.; Trari, M. Preparation and photocatalytic H2 -production on α-Fe2 O3 prepared by sol-gel. Int. J. Hydrog. Energy 2018, 43, 3424–3430. [Google Scholar] [CrossRef]
  33. Liu, J.; Ke, J.; Li, D.; Sun, H.; Liang, P.; Duan, X.; Tian, W.; Tade, M.; Liu, S.; Wang, S. Oxygen vacancies in shape controlled Cu2O/reduced graphene oxide/In2O3 hybrid for promoted photocatalytic water oxidation and degradation of environmental pollutants. ACS Appl. Mater. Interfaces 2017, 9, 11678–11688. [Google Scholar] [CrossRef]
  34. Liu, J.; Zhao, Y.; Zhang, J.-N.; Ye, J.-H.; Ma, X.-N.; Ke, J. Construction of Cu₂O/In₂O₃ hybrids with p-n heterojunctions for enhanced photocatalytic performance. J. Nanosci. Nanotechnol. 2019, 19, 7689–7695. [Google Scholar] [CrossRef] [PubMed]
  35. Li, F.; Dong, B. Construction of novel Z-scheme Cu2O/graphene/α-Fe2O3 nanotube arrays composite for enhanced photocatalytic activity. Ceram. Int. 2017, 43, 16007–16012. [Google Scholar] [CrossRef]
  36. Lakhera, S.K.; Watts, A.; Hafeez, H.Y.; Neppolian, B. Interparticle double charge transfer mechanism of heterojunction α-Fe2O3/Cu2O mixed oxide catalysts and its visible light photocatalytic activity. Catal. Today 2018, 300, 58–70. [Google Scholar] [CrossRef]
  37. Shen, H.; Liu, G.; Yan, X.; Jiang, J.; Hong, Y.; Yan, M.; Mao, B.; Li, D.; Fan, W.; Shi, W. All-solid-state Z-scheme system of RGO-Cu2O/Fe2O3 for simultaneous hydrogen production and tetracycline degradation. Mater. Today Energy 2017, 5, 312–319. [Google Scholar] [CrossRef]
  38. Li, P.; Jing, H.; Xu, J.; Wu, C.; Peng, H.; Lu, J.; Lu, F. High-efficiency synergistic conversion of CO2 to methanol using Fe2O3 nanotubes modified with double-layer Cu2O spheres. Nanoscale 2014, 6, 11380–11386. [Google Scholar] [CrossRef]
  39. Wang, J.-C.; Zhang, L.; Fang, W.-X.; Ren, J.; Li, Y.-Y.; Yao, H.-C.; Wang, J.-S.; Li, Z.-J. Enhanced photoreduction CO2 activity over direct Z-scheme α-Fe2O3/Cu2O heterostructures under visible light irradiation. ACS Appl. Mater. Interfaces 2015, 7, 8631–8639. [Google Scholar] [CrossRef]
  40. Heinemann, M.; Eifert, B.; Heiliger, C. Band structure and phase stability of the copper oxides Cu2O, CuO, and Cu4O3. Phys. Rev. B 2013, 87, 87. [Google Scholar] [CrossRef]
  41. Biesinger, M.C.; Lau, L.W.; Gerson, A.R.; Smart, R.S. Resolving surface chemical states in XPS analysis of first row transition metals, oxides and hydroxides: Sc, Ti, V, Cu and Zn. Appl. Surf. Sci. 2010, 257, 887–898. [Google Scholar] [CrossRef]
  42. Biesinger, M.C. Advanced analysis of copper X-ray photoelectron spectra. Surf. Interface Anal. 2017, 49, 1325–1334. [Google Scholar] [CrossRef]
  43. X-ray Photoelectron Spectroscopy (XPS) Reference Pages: Indium. Available online: http://www.xpsfitting.com/search/label/Indium (accessed on 9 May 2020).
  44. Barr, T.L.; Ying, L.L. An x-ray photoelectron spectroscopy study of the valence band structure of indium oxides. J. Phys. Chem. Solids 1989, 50, 657–664. [Google Scholar] [CrossRef]
  45. Grosvenor, A.; Kobe, B.A.; Biesinger, M.C.; McIntyre, N.S. Investigation of multiplet splitting of Fe 2p XPS spectra and bonding in iron compounds. Surf. Interface Anal. 2004, 36, 1564–1574. [Google Scholar] [CrossRef]
  46. Radu, T.; Iacovita, C.; Benea, D.; Turcu, R. X-ray photoelectron spectroscopic characterization of iron oxide nanoparticles. Appl. Surf. Sci. 2017, 405, 337–343. [Google Scholar] [CrossRef]
  47. Kraut, E.A.; Grant, R.W.; Waldrop, J.R.; Kowalczyk, S.P. Precise determination of the valence-band edge in x ray photoemission spectra. Phys. Rev. Lett. 1980, 44, 1620–1623. [Google Scholar] [CrossRef]
  48. Kraut, E.A.; Grant, R.W.; Waldrop, J.R.; Kowalczyk, S.P. Semiconductor core-level to valence-band maximum binding-energy differences: Precise determination by x-ray photoelectron spectroscopy. Phys. Rev. B 1983, 28, 1965–1977. [Google Scholar] [CrossRef]
  49. Chambers, S.A.; Droubay, T.C.; Kaspar, T.; Gutowski, M. Experimental determination of valence band maxima for SrTiO3, TiO2 and SrO and the associated valence band offsets with Si(001). J. Vac. Sci. Technol. B Microelectron. Nanometer Struct. 2004, 22, 2205. [Google Scholar] [CrossRef]
  50. Yang, Y.; Xu, D.; Wu, Q.; Diao, P. Cu2O/CuO bilayered composite as a high-efficiency photocathode for photoelectrochemical hydrogen evolution reaction. Sci. Rep. 2016, 6, 35158. [Google Scholar] [CrossRef] [Green Version]
  51. Wang, Y.; Lany, S.; Ghanbaja, J.; Fagot-Revurat, Y.; Chen, Y.P.; Soldera, F.; Horwat, D.; Mücklich, F.; Pierson, J.-F. Electronic structures of Cu2O,Cu4O3, and CuO: A joint experimental and theoretical study. Phys. Rev. B 2016, 94, 245418. [Google Scholar] [CrossRef] [Green Version]
  52. Xu, Y.; Schoonen, M.A. The absolute energy positions of conduction and valence bands of selected semiconducting minerals. Am. Miner. 2000, 85, 543–556. [Google Scholar] [CrossRef]
  53. Erhart, P.; Klein, A.; Egdell, R.G.; Albe, K. Band structure of indium oxide: Indirect versus direct band gap. Phys. Rev. B 2007, 75, 75. [Google Scholar] [CrossRef]
  54. Dixon, S.C.; Scanlon, D.O.; Carmalt, C.J.; Parkin, I.P. n-Type doped transparent conducting binary oxides: An overview. J. Mater. Chem. C 2016, 4, 6946–6961. [Google Scholar] [CrossRef] [Green Version]
  55. Piccinin, S. The band structure and optical absorption of hematite (α-Fe2O3): A first-principles GW-BSE study. Phys. Chem. Chem. Phys. 2019, 21, 2957–2967. [Google Scholar] [CrossRef] [PubMed]
  56. Temesghen, W.; Sherwood, P. Analytical utility of valence band X-ray photoelectron spectroscopy of iron and its oxides, with spectral interpretation by cluster and band structure calculations. Anal. Bioanal. Chem. 2002, 373, 601–608. [Google Scholar] [CrossRef]
  57. Luan, P.; Xie, M.; Liu, D.; Fu, X.; Jing, L. Effective charge separation in the rutile TiO2 nanorod-coupled α-Fe2O3 with exceptionally high visible activities. Sci. Rep. 2014, 4, 6180. [Google Scholar] [CrossRef]
  58. Dolgonos, A.; Mason, T.O.; Poeppelmeier, K.R. Direct optical band gap measurement in polycrystalline semiconductors: A critical look at the Tauc method. J. Solid State Chem. 2016, 240, 43–48. [Google Scholar] [CrossRef] [Green Version]
  59. Zanatta, A.R. Revisiting the optical bandgap of semiconductors and the proposal of a unified methodology to its determination. Sci. Rep. 2019, 9, 1–12. [Google Scholar] [CrossRef] [Green Version]
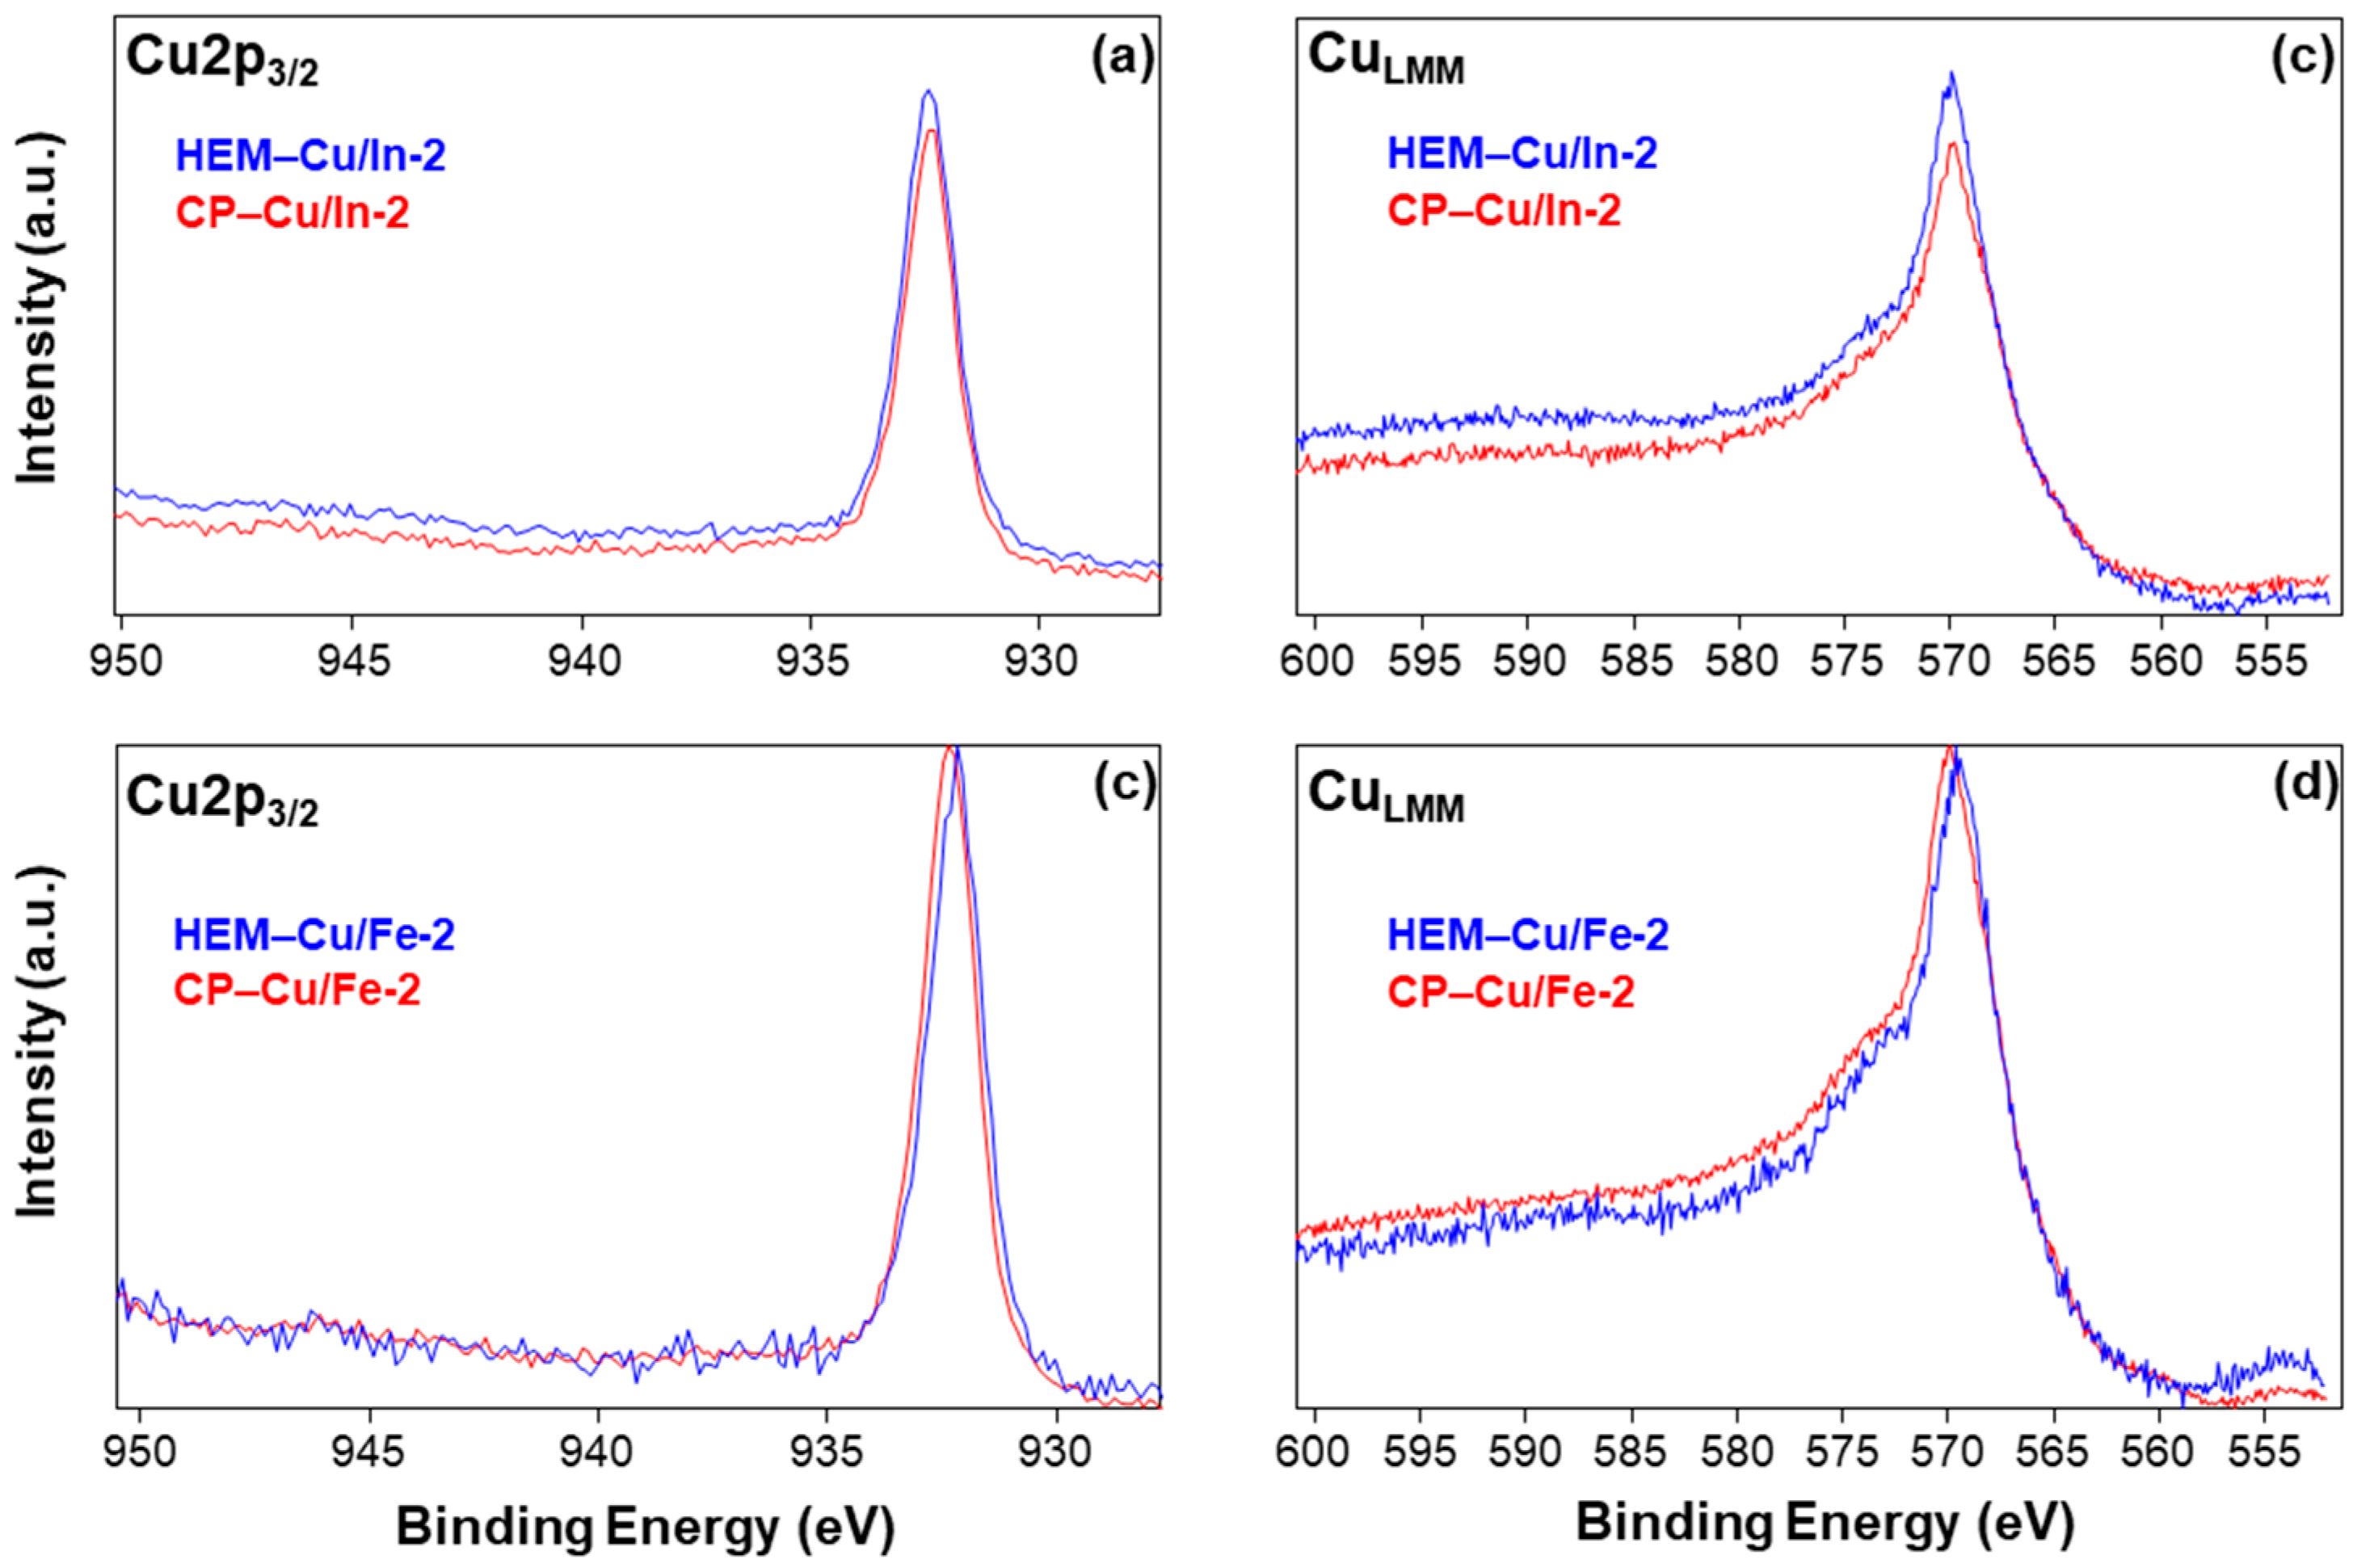
Figure 1. X-ray Photoelectron spectra for Cu 2p3/2 and Cu L3M4,5M4,5 (Cu LMM)Auger transition in (a,b) Cu/In and in (c,d) Cu/Fe pairs.
Catalysts 10 00980 g001
Figure 2. XP spectra for (a) In 3d and (b) Fe 2p core levels in mixed metal oxides samples.
Catalysts 10 00980 g002
Figure 3. XP Valence Band Spectra in (a) Cu2O, (b) In2O3, and (c) Fe2O3 binary oxide samples.
Catalysts 10 00980 g003
Figure 4. UV-Visible Diffuse Reflectance Spectroscopy (UV-VIS DRS) for Cu/In mixed oxides pairs prepared by (a) CP and by (b) HEM.
Catalysts 10 00980 g004
Figure 5. UV-Visible DRS for Cu/Fe mixed oxides pairs prepared by (a) CP and by (b) HEM.
Catalysts 10 00980 g005
Figure 6. Tauc Plots for (a) Cu2O, (b) In2O3, and (c) Fe2O3 binary oxide samples.
Catalysts 10 00980 g006
Figure 7. Band structures schemes for Cu2O/In2O3 pair, prepared by (a) HEM and (b) CP, and for Cu2O/Fe2O3 pair, prepared by (c) HEM and (d) CP.
Catalysts 10 00980 g007
Figure 8. Reactors used for running the photochemical reaction. (a) Bulk nano-sized catalyst in a batch-reactor. (b) Flow-reactor loaded with bulk nano-catalyst. (c) Nano-sized catalyst finely dispersed on the wall of the reactor, simulating a nano-film.
Catalysts 10 00980 g008
Table 1. Composition of Mixed-Oxide samples prepared by High Energy Milling (HEM) or Co-Precipitation (CP), listed by molar ratio.
Sample NameCu/In RatioSample NameCu/Fe Ratio
HEM-Cu/In-10.60HEM-Cu/Fe-10.59
HEM-Cu/In-21.08HEM-Cu/Fe-20.99
HEM-Cu/In-32.20HEM-Cu/Fe-31.92
CP-Cu/In-10.25CP-Cu/Fe-10.23
CP-Cu/In-21.58CP-Cu/Fe-20.66
CP-Cu/In-32.96CP-Cu/Fe-31.21
Table 2. Surface composition in mixed oxide samples determined by XPS. Atomic percentages are reported as mean values ± 1S (values averaged out of at least three replicates).
SampleSurface Content (at. %)Metal Content Ratio
COCuInFeCu/InCu/Fe
HEM-Cu/In-242 ± 739.1 ± 0.713 ± 57 ± 2-1.95 ± 0.20-
CP-Cu/In-226 ± 342.8 ± 1.017.4 ± 0.913.5 ± 1.2-1.29 ± 0.06-
HEM-Cu/Fe-240.0 ± 0.536.4 ± 0.513.9 ± 0.2-9.7 ± 0.2-1.47 ± 0.12
CP-Cu/Fe-231.3 ± 1.045.8 ± 1.59.2 ± 0.2-14 ± 2-0.68 ± 0.13
Table 3. Valence Band Maxima extracted from XPS measurements. The error values were determined from the regression method extrapolation.
SampleVBM (eV)SampleVBM (eV)
C-Cu2O1.65 ± 0.20S-Cu2O0.86 ± 0.14
C-In2O32.20 ± 0.11S-In2O31.80 ± 0.15
C-Fe2O31.53 ± 0.22S-Fe2O31.67 ± 0.23
Table 4. Optical energy gap and corresponding absorption wavelength in binary oxide samples.
SampleOptical Eg (eV)Absorption Wavelength 1 (nm)
C-Cu2O2.047605.7
S-Cu2O2.495497.0
C-In2O33.091401.1
S-In2O33.610337.9
C-Fe2O32.875431.3
S-Fe2O32.772447.3
1 Calculated by the relation λ = 1240/Eg,opt [18].
Table 5. Resume of energy gaps and band edges levels in semiconductor metal oxides.
SampleEg (eV)VBM (eV)CBM (eV)
FundamentalOptical
C-Cu2O2.052.051.80−0.24
S-Cu2O2.492.490.83−1.67
C-In2O32.283.092.22−0.05
S-In2O32.803.611.71−1.09
C-Fe2O32.012.871.87−0.14
S-Fe2O31.972.771.92−0.05
Table 6. Photocatalytic reaction for three different reactors.
Reaction SystemGaseous Reaction Products
H2COCH4
(a)
(b)
(c)+++++