1. Introduction
Electrical communication between enzymes and their surroundings is tightly controlled by natural diffusional redox mediators [
1,
2,
3,
4,
5]. Alternatively, protein–protein interactions at specific docking sites can facilitate short electron transfer distances that, in turn, allow efficient electron transfer [
6]. By design, the outer shells of redox enzymes are insulators; therefore, they prevent short circuits with undesired electron carriers present in the surrounding. In the last several decades, the theoretical and experimental foundations of these processes were developed, improving our understanding thereof. Establishing electrical communication between redox proteins and electrodes or inorganic nanomaterials is a major challenge that has been at the forefront of research for the last two decades [
7,
8]. Using redox mediators or directed electron transfer configurations has led to a variety of sensing or energy generating devices.
Nitrogenase, a bacteria-based enzyme α
2β
2 heterotetramer composition, is the sole enzyme that is able to generate ammonia by atmospheric nitrogen fixation [
9,
10]. The nitrogenase αβ subunits consist of two metal centers: (i) The P-cluster, an iron–sulfur center (8Fe:7S), which acts as an electron mediator accepting the shuttled electrons from the Fe protein (Fe-P); and (ii) the M-cluster, a unique complex with a 7Fe:9S:M:1C center, which acts as the catalytic center and allows N
2 fixation to occur. M represents molybdenum, vanadium, or iron metal ions, and C represents carbide [
10].
Activation of the nitrogenase enzyme requires Mg–ATP and reduced Fe-P. The ATP allows a structural conformation change in the Fe-P, leading to efficient electron transfer toward the P-cluster [
11,
12]. ATP does not act as an electron donor, and it only supports the binding of the Fe-P to the nitrogenase P-cluster and the required conformational changes to allow the electron transfer. Major advances elucidating the unique electron transfer and catalytic activity have been realized in the last two decades using biochemical, electroanalytical, and spectroscopic methodologies [
11,
13,
14]. It is known that 8e
- are involved in the process, which produces two moles of NH
3 and one mole of H
2 (see Equation (1)) [
13,
15].
Equation 1. Nitrogen fixation process.
It has been shown that besides N
2, the nitrogenase enzyme can reduce NO
2−, azide, CO, and acetylene [
16,
17,
18]. Moreover, nitrogenase can facilitate carbon–carbon coupling reactions [
19]. While the investigation of the natural activation of nitrogenase is still in its course, attempts to artificially activate the nitrogenase also have been at the forefront of research. For example, nitrogenase and Fe-P were coupled to an electrochemically mediated system in order to reduce azide or CO
2 into NH
3 or formate under highly biased electrodes [
15,
20]. By integrating a nitrogenase-based cathode with a hydrogenase-based anode, a biofuel cell mimicking the Haber–Bosch process was developed [
21,
22]. In most cases, cobaltocene was used as a redox mediator; hence, a bias of −1.1 V versus Ag/AgCl was used for activation.
Moreover, it has been shown that nitrogenase can be activated solely by uncoupling the Fe–P and ATP utilization, using CdS NRs, anchored Ru(bpy)
3, or pyrene moieties without the addition of ATPs and Fe-P [
23,
24,
25,
26]. In nature, electron transfers occur in eight consecutive steps of a single electron transfer toward the P-cluster, which thereafter transfers these electrons to the M-cluster in order to reduce one molecule of N
2. In this process, the reduced Fe-P acts as an electron donor, while an ATP molecule functions as a kind of key that forces a structural change in the Fe-P, thus allowing the electron transfer process. This rate-limiting process, which occurs in nature, might be improved and methods to bypass this regulated mechanism should be developed to allow the artificial activation of the nitrogenase enzyme by external stimuli or an electron source other than the Fe-P. The successive electron transfer process between the Fe-P and the nitrogenase occurs when the Fe-P cluster (4Fe:4S) cluster and the P cluster (8Fe:7S) are aligned. The distance between the clusters reaches optimum at 1.8 nm, which allows the efficient electron transfer process [
27]. In terms of electron transfer processes, this distance is not ideal, and shorter distances may dramatically increase the enzymatic activity. As mentioned, several nitrogenase artificial activation configurations have been introduced, but how the interface between the biotic and the abiotic system influences the activity should be realized. Furthermore, the role of the Fe-P or its absence in artificial systems, the electron transfer process, and the conditions affecting the ammonia and hydrogen generation remained unresolved and warrant further investigation.
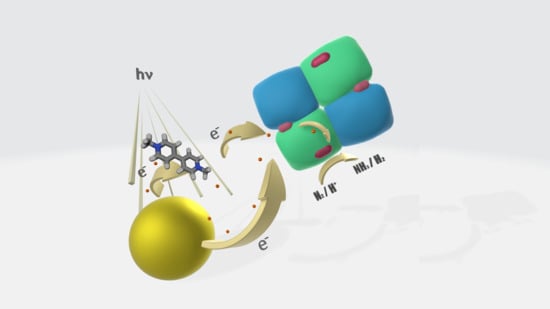
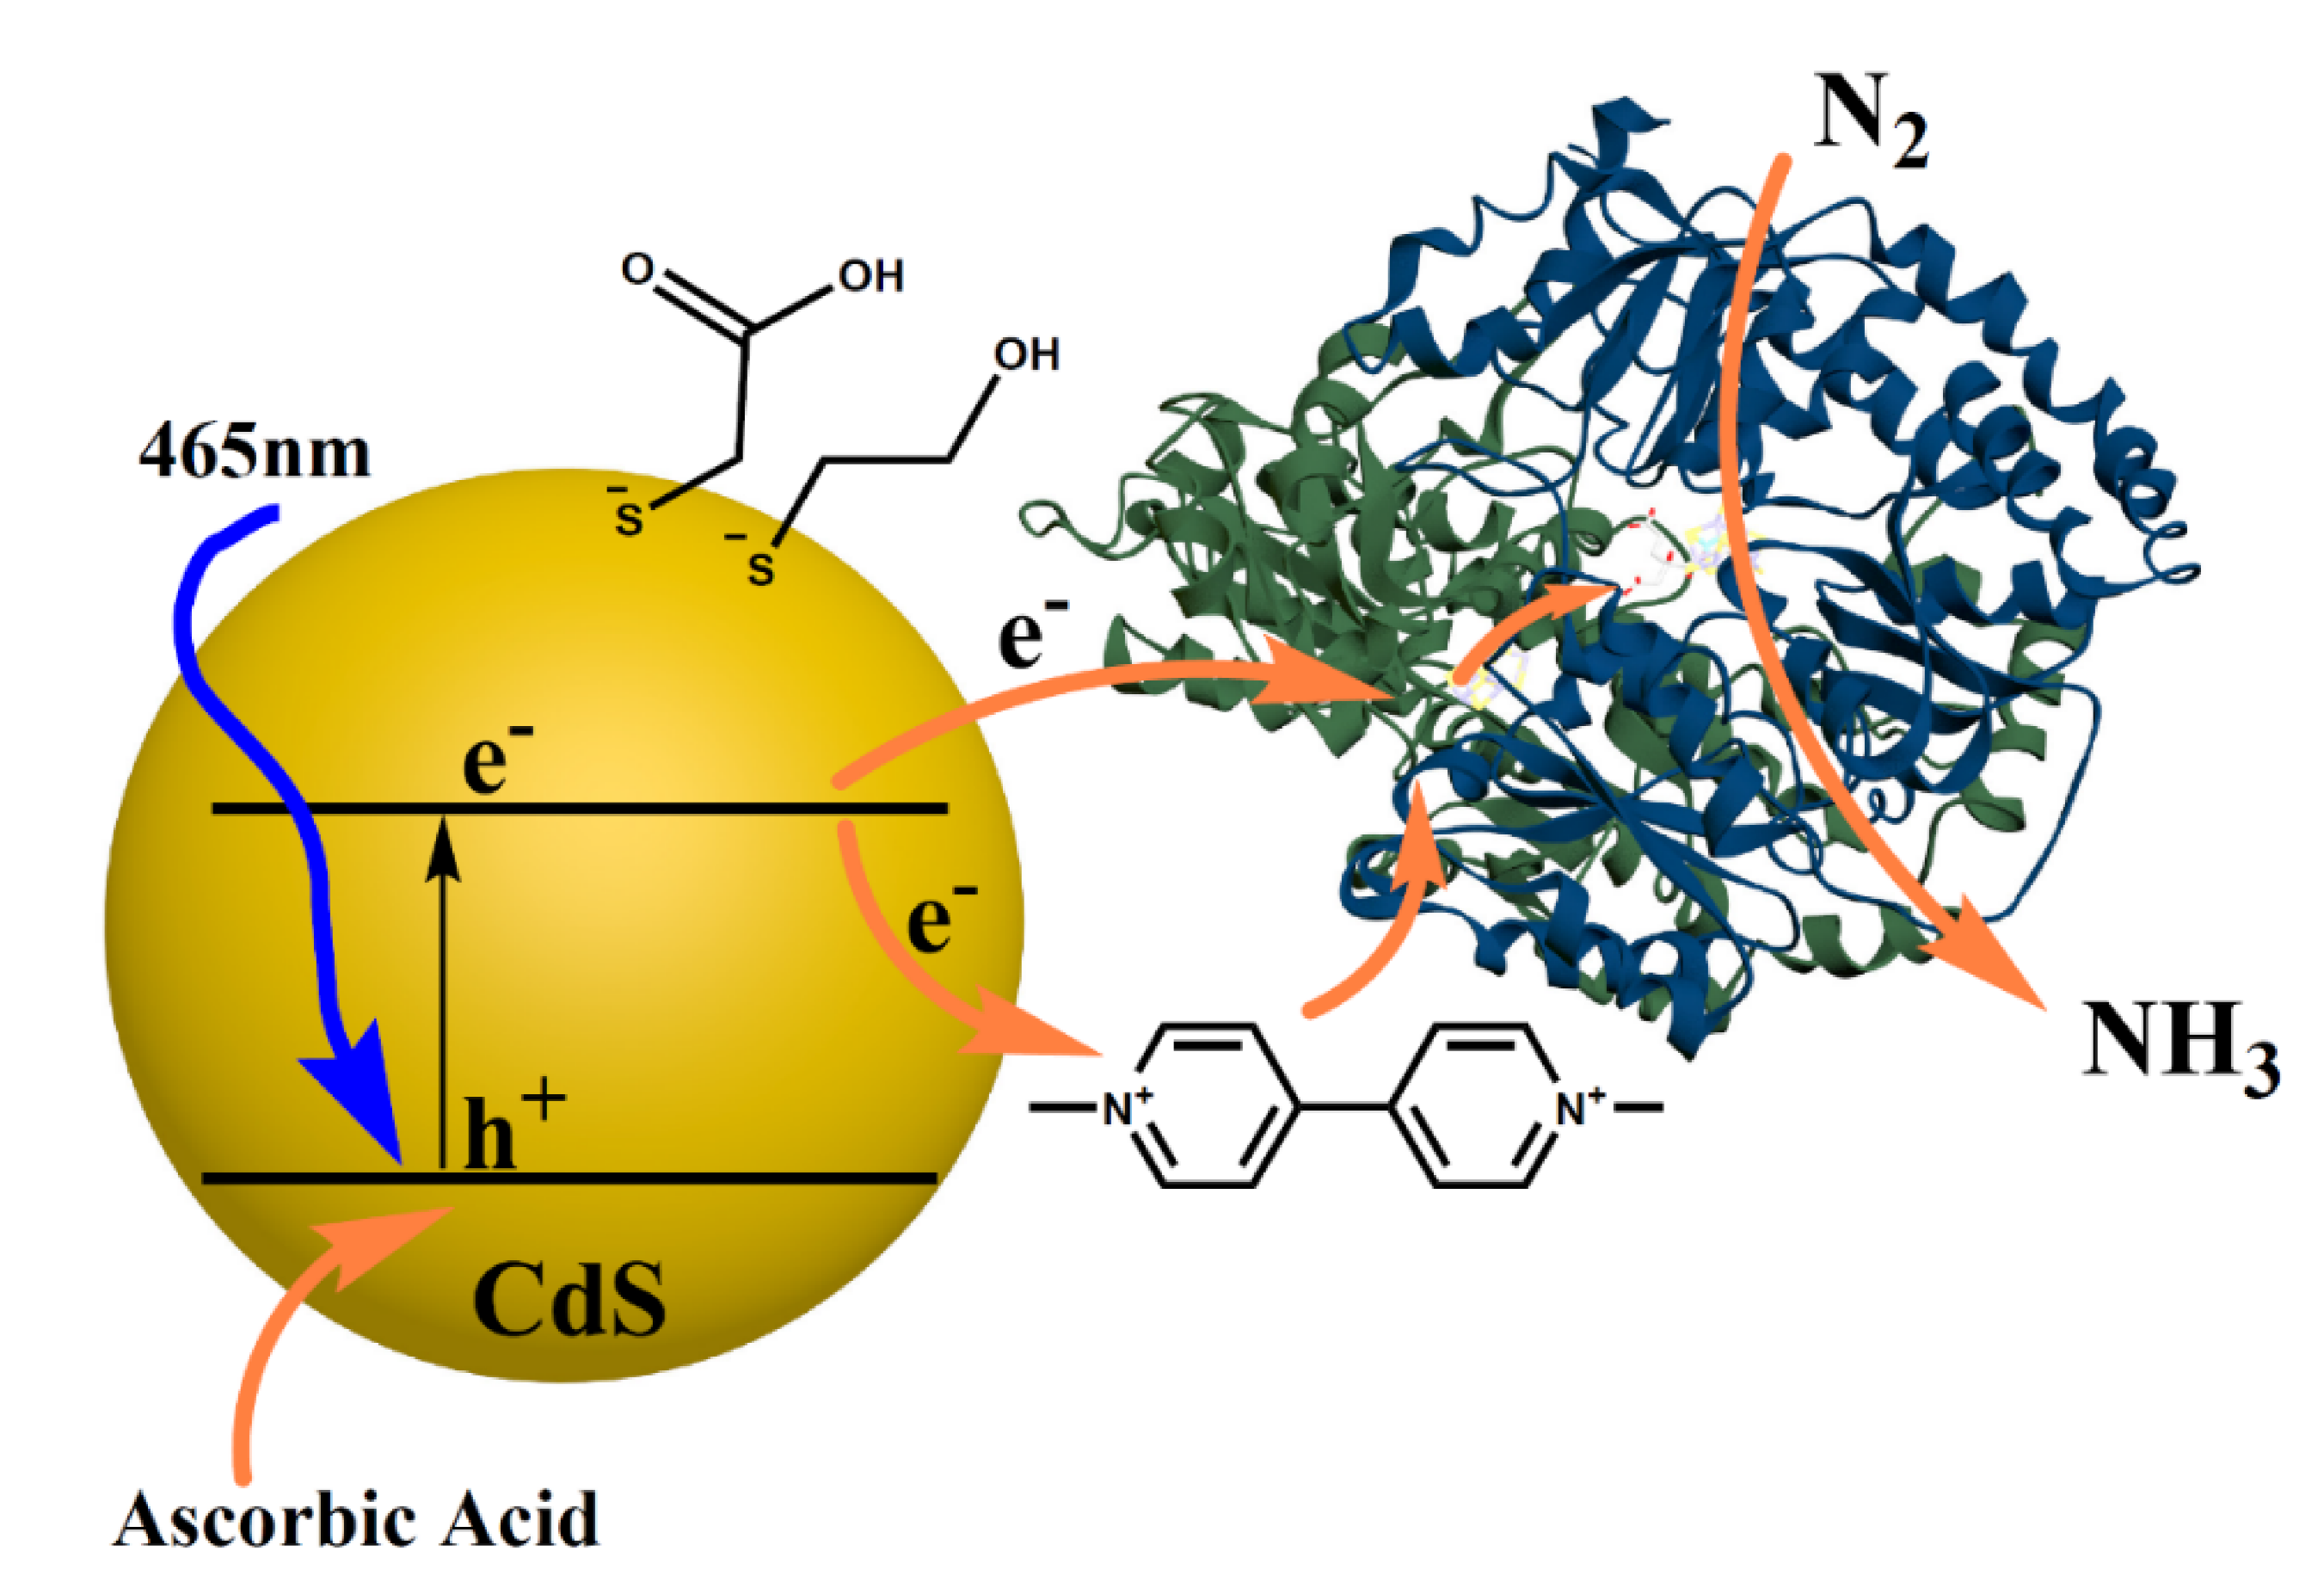
Here, we show a direct and diffusional approach to the artificial activation of MoFe-P by CdS NPs 10 nm in diameter (see
Figure 1). We examined the role of different ligands and their effect on the direct electron transfer process and the catalytic hydrogen and ammonia generation. We further examined the effect of methyl viologen (MV) as an electron mediator on the hydrogen and ammonia generation process.
2. Results and Discussion
Two variants of MoFe-P, which express a His-tag at the α subunits, were isolated from
Azotobacter vinelandii mutated strains DJ1194 and DJ995, as previously described [
28,
29]. The mutated αL158C MoFe-P, isolated from DJ1194, consists of cysteine (Cys) at the α158 instead of lysine as expressed in the wild type (WT MoFe-P). The close proximity of Cys α158 to the iron–sulfur P-cluster at the nitrogenase’s electron acceptor site could potentially allow a short electron transfer distance between a bonded external electron donor and the enzyme’s P-cluster. Indeed, Tzecan and co-workers showed methods of integrating Ru(bpy)
3-based photosensitizers with nitrogenase for Fe-P independent activation to allow acetylene to ethylene hydrogenation. The artificial system was limited by photosensitizer degradation, preventing continuous long-term activation [
23].
For the artificial activation of nitrogenase, 10 nm CdS nanoparticles (NPs) were synthesized using a hydrothermal method [
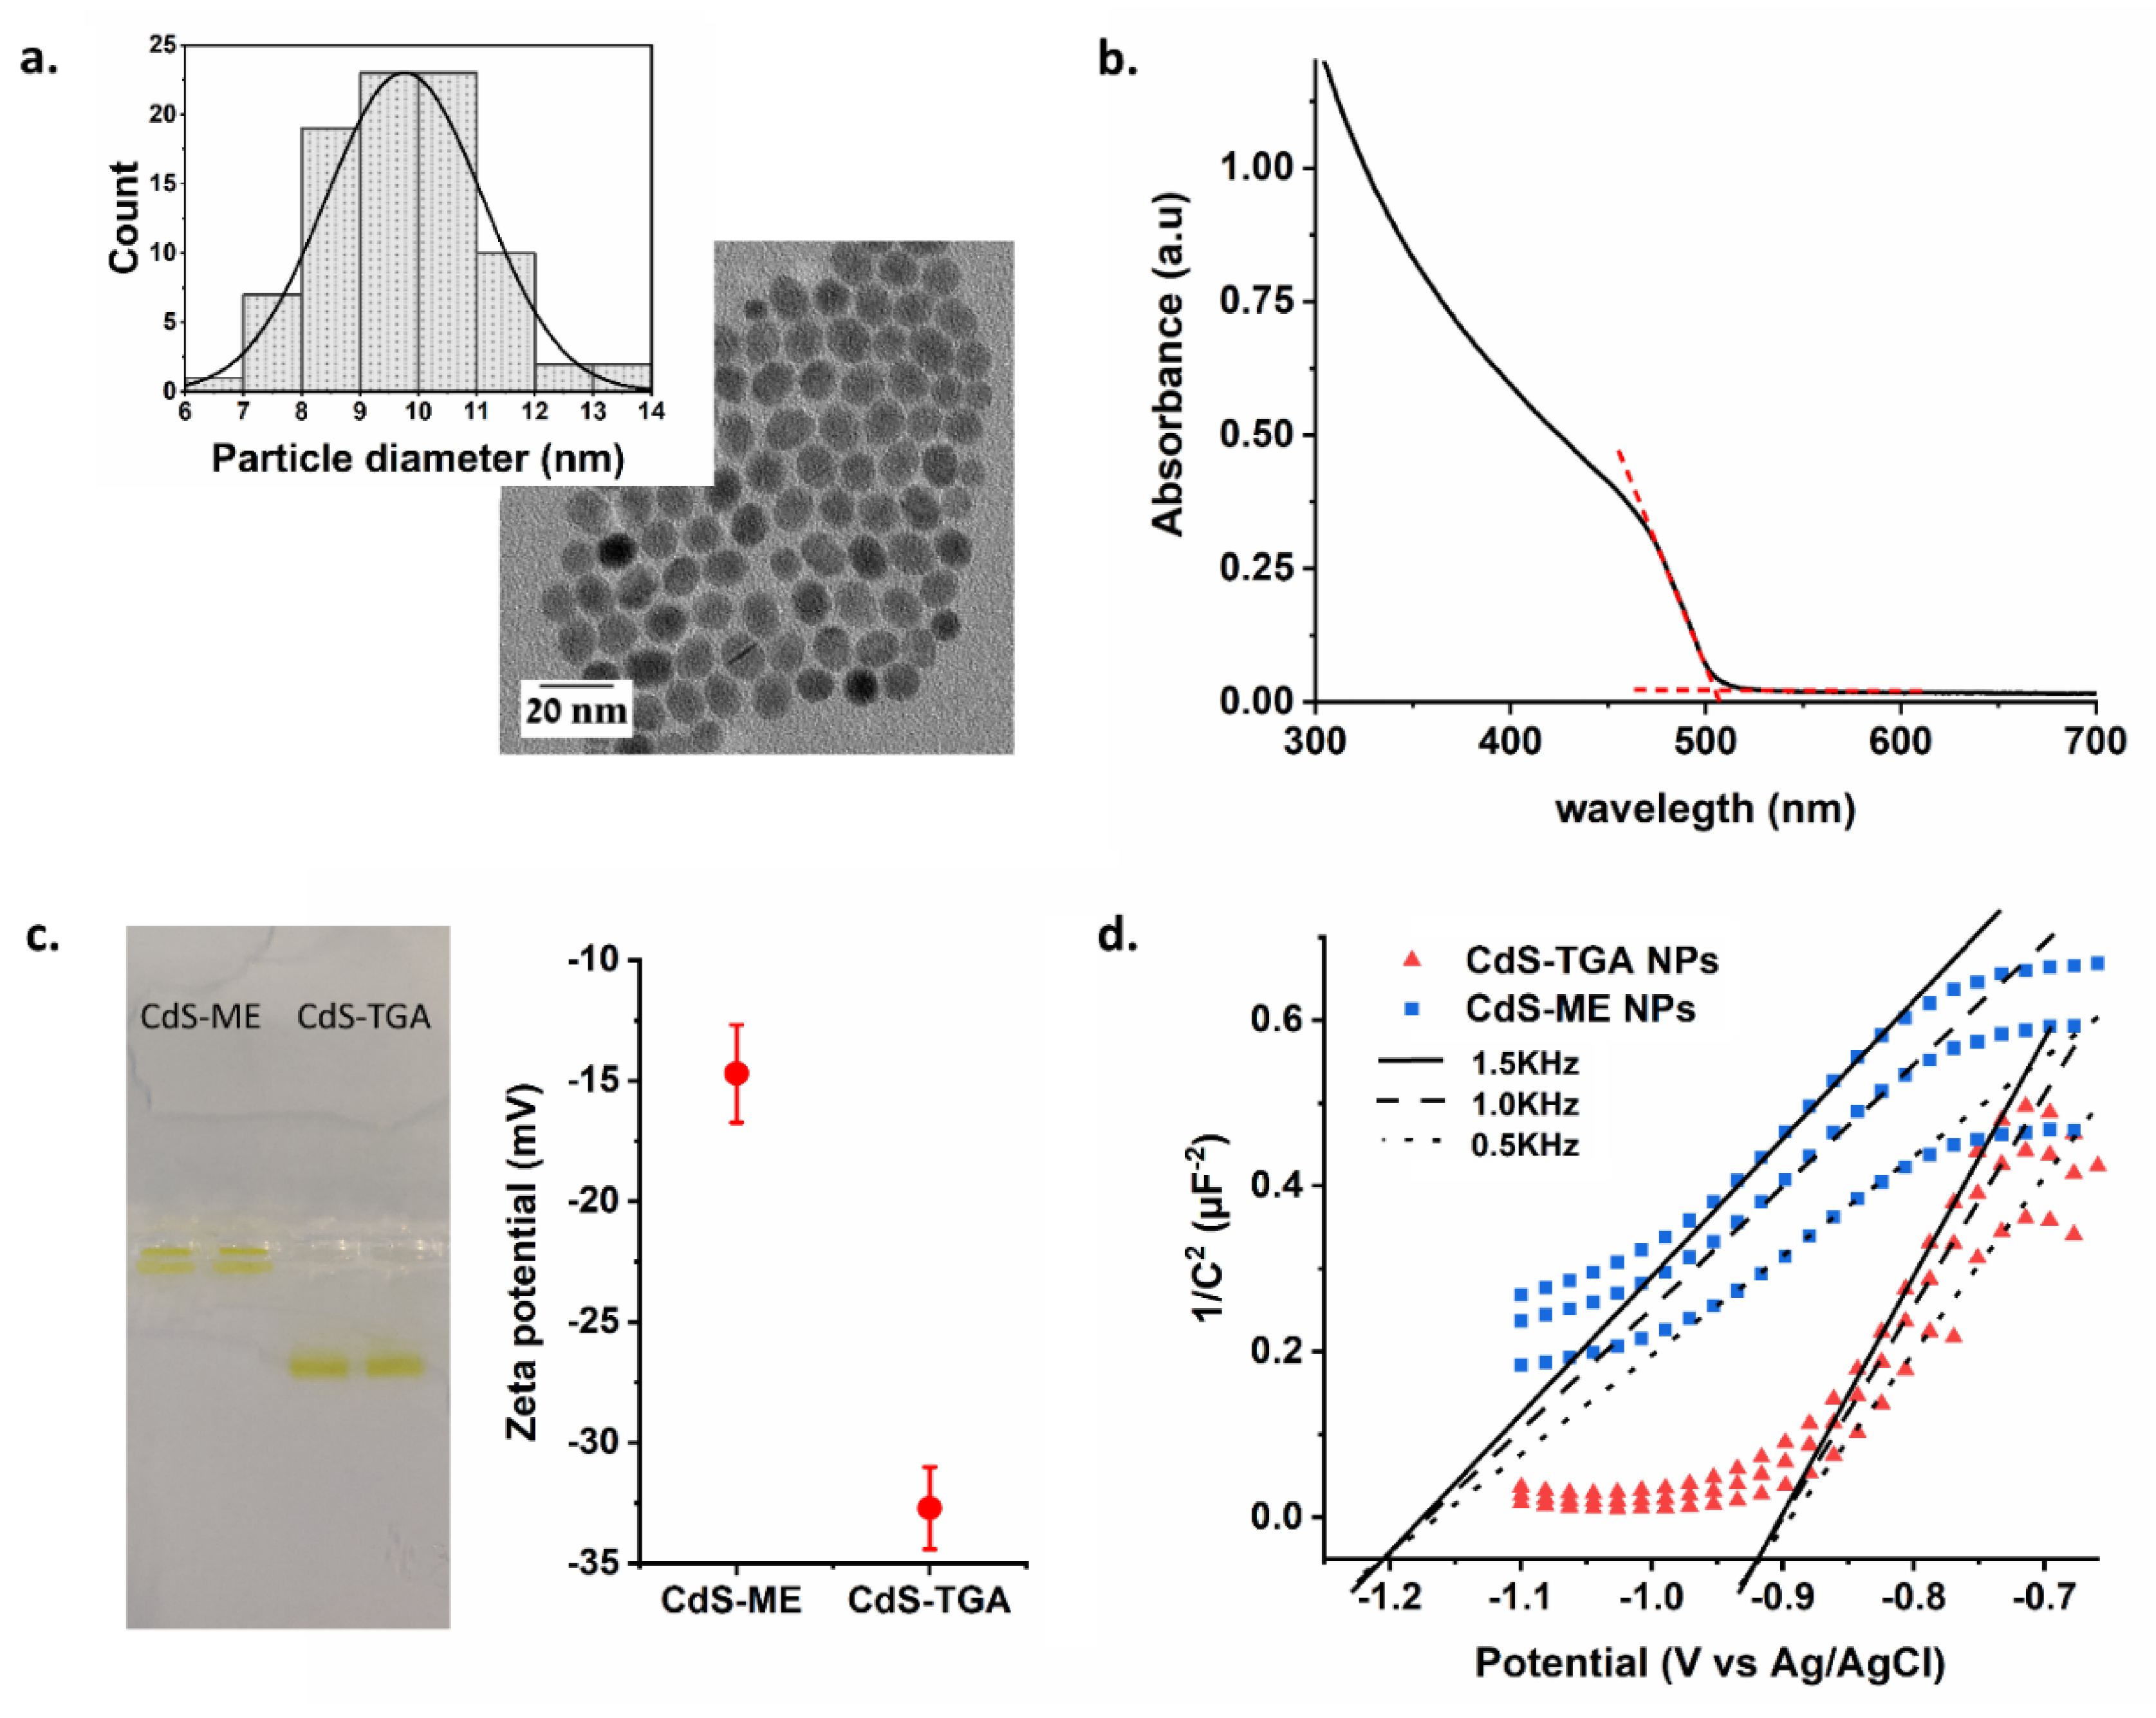
30]. The CdS particle size and the band-gap energy were determined using transmission electron microscopy (TEM) imaging and UV/Vis spectroscopy respectively, (
Figure 2a,b and in
SI). Using ligand exchange steps, we altered the CdS NPs surface by replacing the oliel amine/oleic acid with shorter thioglycolic acid (TGA) or 2-mercaptoethanol (ME) ligands, (see
Figure S3). The CdS NPs were dissolved in aqueous solution and their charges were verified using gel electrophoresis and zeta potential measurements (
Figure 2c). As expected, the TGA-modified CdS NPs exhibited dominant-negative charges and traveled through the 0.6% agarose gel to the positive pole. On the other hand, the ME-modified CdS NPs showed only a minute effect and did not migrate from the well, although small negative charges were measured by the zeta potential setup. Ligands have a critical effect on energy levels position, which in turn alters the semiconductor electron transfer processes [
31,
32,
33]. To realize the effect, we determined the band edges of the CdS–TGA and the CdS–ME NPs using capacitance measurements (Mott–Schottky technique) [
34,
35]. The TGA form exhibited a conductive band (CB) value of −0.9 V versus Ag/AgCl, pH-7.2, while the ME form exhibited a higher negative potential of −1.2 V (
Figure 2d). The TGA and ME-modified CdS NPs were further utilized for photoinduced nitrogenase activation.
In each experiment performed, oxygen-free CdS NPs (stored in an Ar-filled glove box, O
2 < 0.2 ppm) were mixed with phosphate buffer (PB) pH 7.2 and ascorbic acid, which was used as an electron donor. Then, the sealed vial was purged in the dark with N
2 for 1 h followed by injection of the MoFe-P solution, in the glove box, using an insulin syringe (Pic solution, 0.5 mL, 31G). Then, the sealed vials were irradiated using a 465 nm LED light. The H
2 generated was monitored using gas chromatography with a thermal conductivity detector (GC-TCD).
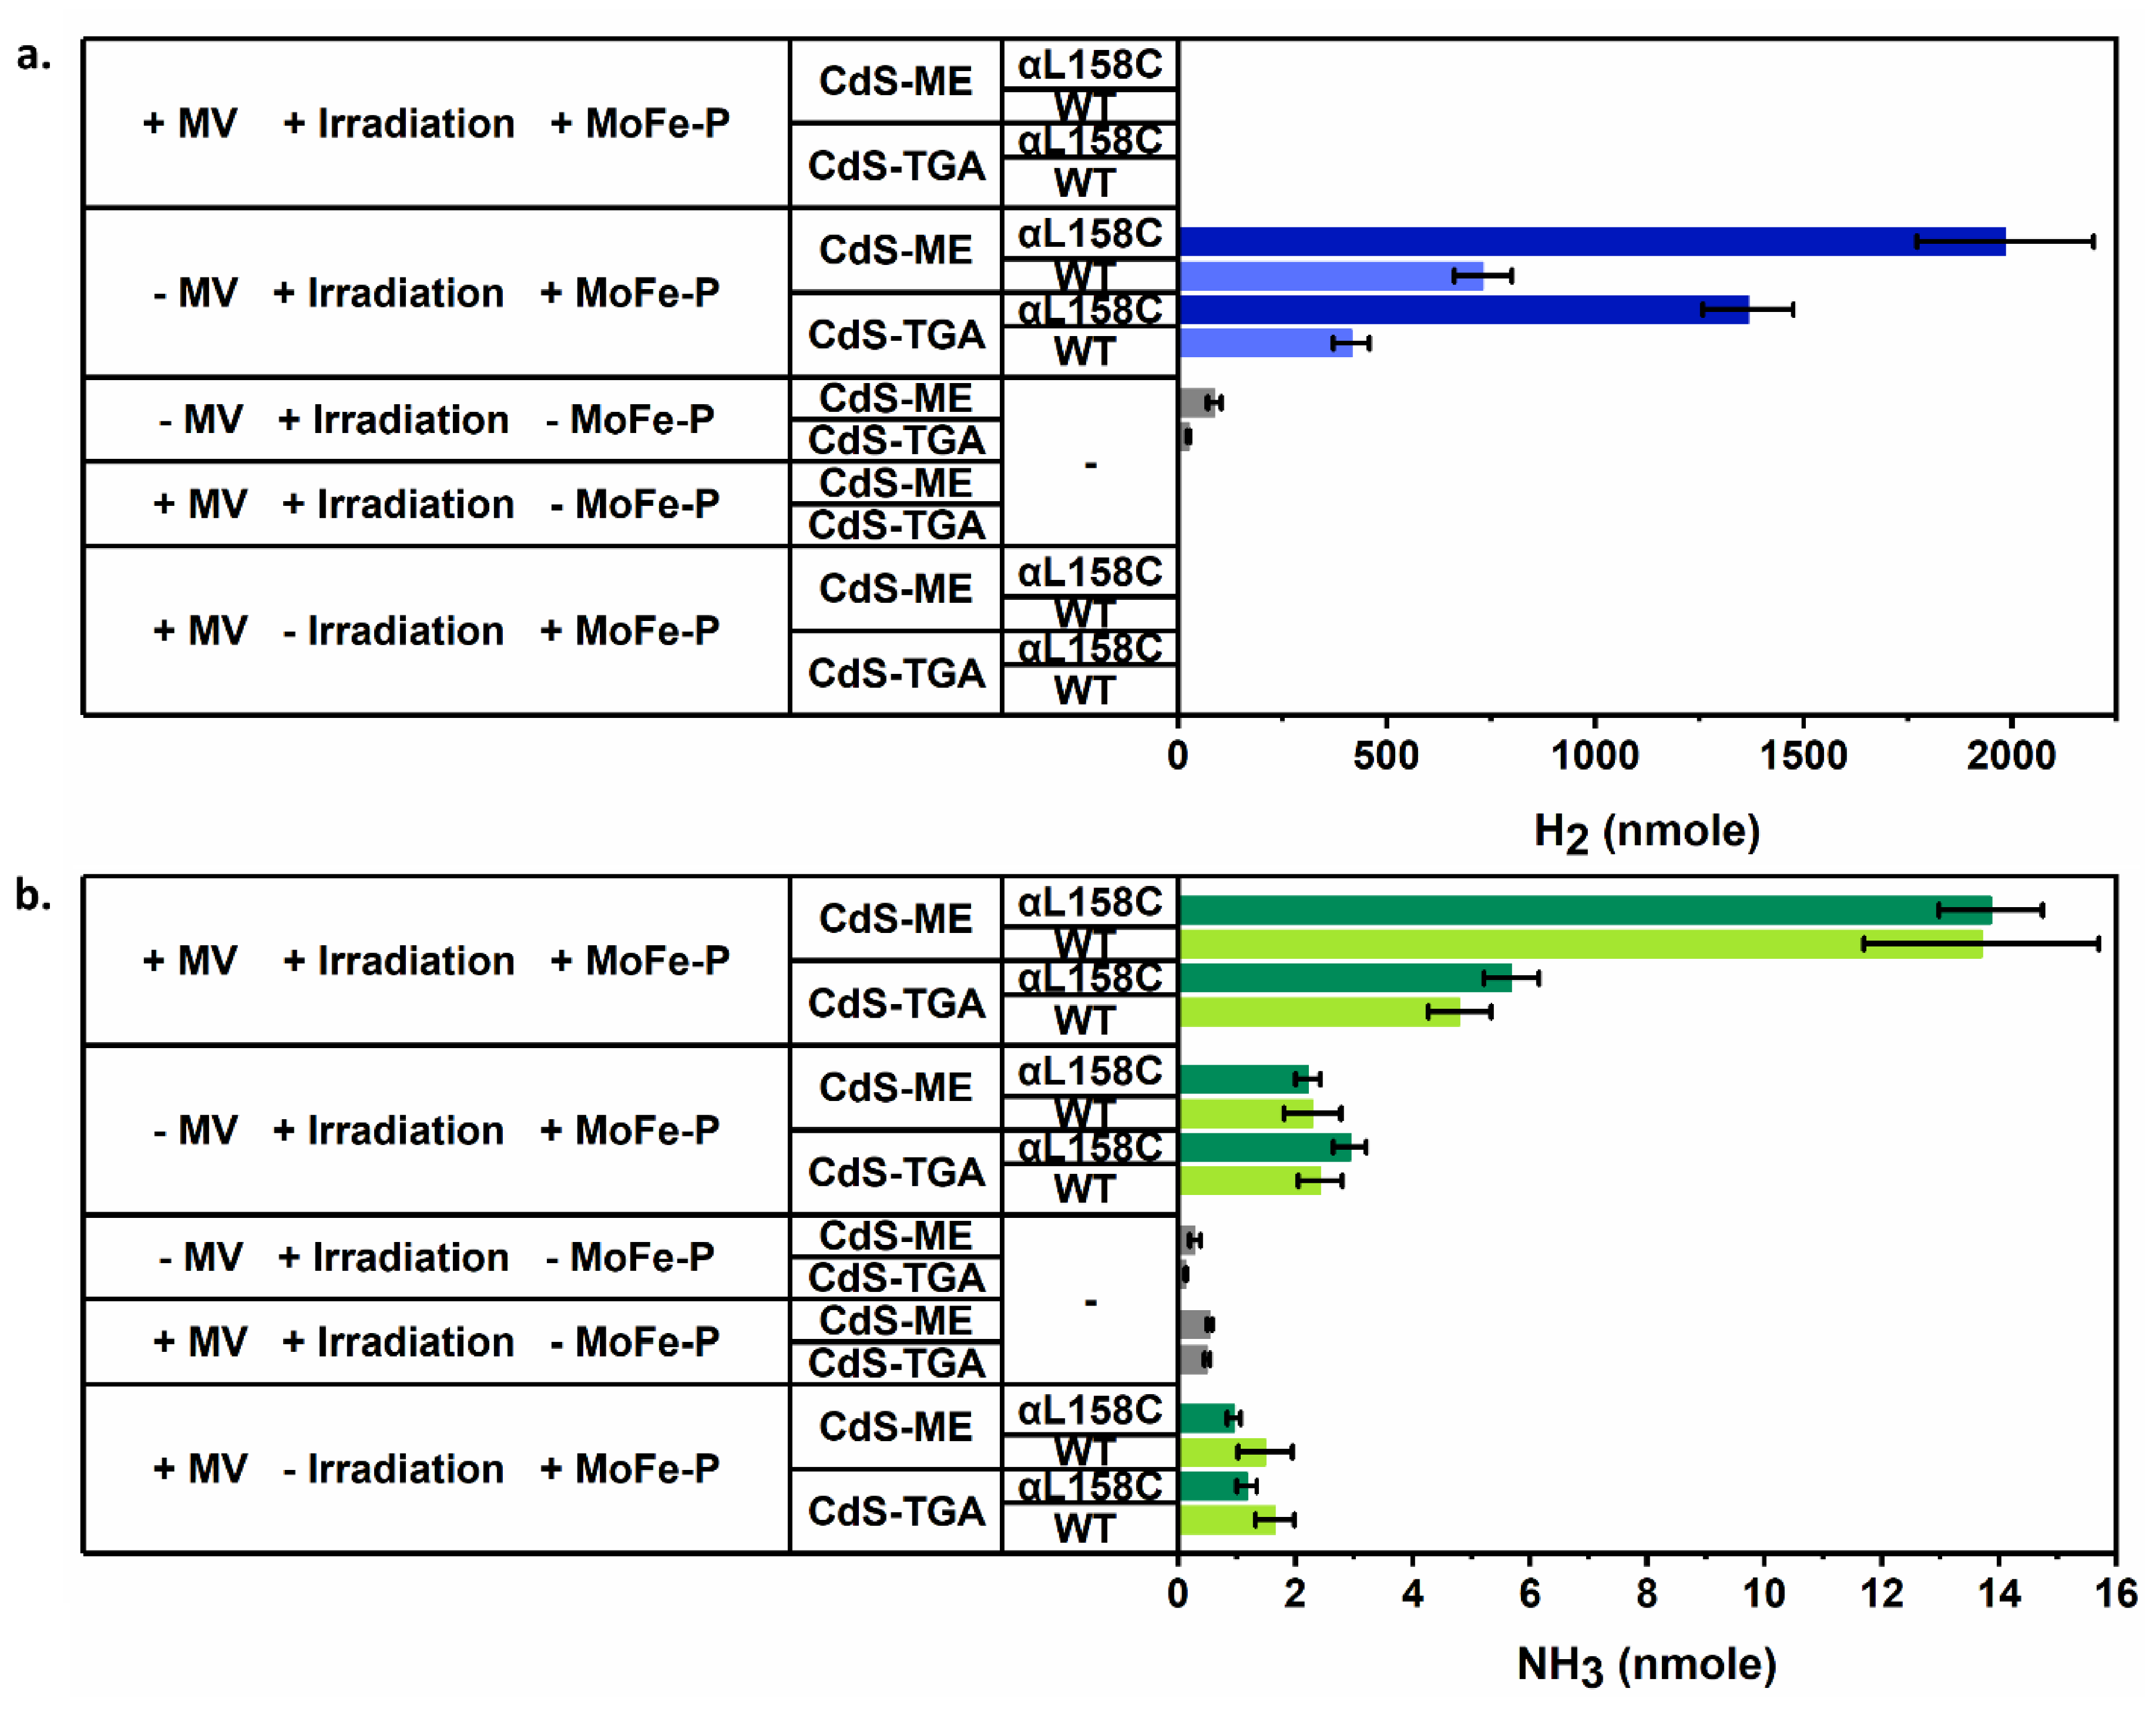
Figure 3 depicts the amounts of H
2 and NH
3 obtained using CdS NPs–MoFe-P mixtures. We examined two variants of the nitrogenase protein: WT MoFe-P (His-Tag, DJ995) and αL158C-mutated nitrogenase (His-Tag, DJ1194). The cysteine-mutated nitrogenase potentially has two Cys positions that may directly bond the NPs through the strong thiol–Cd interaction. The mixtures of CdS–ME NPs with both of the nitrogenase variants generated 30% more H
2 compared with the TGA NPs mixtures. We also observed that by activating the αL158C MoFe-P, approximately 2000 nmol of H
2 could be generated after two hours of blue light irradiation, which translated to 41 ± 4 moleH
2/moleMoFe-P*min. These hydrogenation rates were doubled as compared to the natural system tested, where FeP MgATP and sodium dithionite as an electron donor was used for activation (see
Table S1).
MV is commonly used as a redox relay unit for both biotic and abiotic electron transfer processes [
36,
37,
38]. The pH-independent one-electron reaction has a strong reducing potential of −0.67 V versus Ag/AgCl in aqueous solutions, which could fit the MoFe-P P-cluster reduction potential approximately (−0.45 to −0.65 V versus Ag/AgCl) [
13,
28,
39,
40]. Therefore, MV was introduced into the CdS–ME/TGA NPs–MoFe-P mixtures, and NH
3 and H
2 generation were monitored. Interestingly, in the presence of MV, H
2 generation was completely inhibited. During the course of the irradiation, a blue color could be observed in both the TGA and ME samples, indicating that indeed, the NPs facilitate an efficient electron transfer process toward the MV.
Neglecting the low amount of H
2 generated solely by the CdS NPs, three parameters affect the observed catalytic activity: (i) the CB edges, (ii) the ligands charges, and (iii) the nitrogenase strains. As has been shown in
Figure 2d, CdS–ME NPs hold a potential reaching −1.2 V versus Ag/AgCl, while the TGA-CdS NPs have lower reducing potential, reaching −0.93 V. Taking into account that the 8Fe:7S cluster at the nitrogenase acceptor side (P cluster) consists of a potential of approximately (−0.45 to −0.65 V versus Ag/AgCl) [
13,
28,
39,
40], it is less likely that the band edges dictate the differences between the TGA–CdS and the ME–CdS NPs configurations, even in a case in which overpotentials are required. As been recently realized, the Fe-P and the nitrogenase hybridization and the electron transfer process occur in several successive steps involve precursory electrostatic interaction initiated at a positive charge docking site followed by alignment of the Fe-P and P cluster and ATP-dependent electron transfer process [
13,
41,
42]. The TGA ligands can facilitate stronger electrostatic interaction with the positive docking site at the nitrogenase enzyme, as compared to the 2-mercaptoethanol. Nevertheless, in both MoFe-P tested strains, the CdS ME ligand achieved approximately 30% more hydrogen.
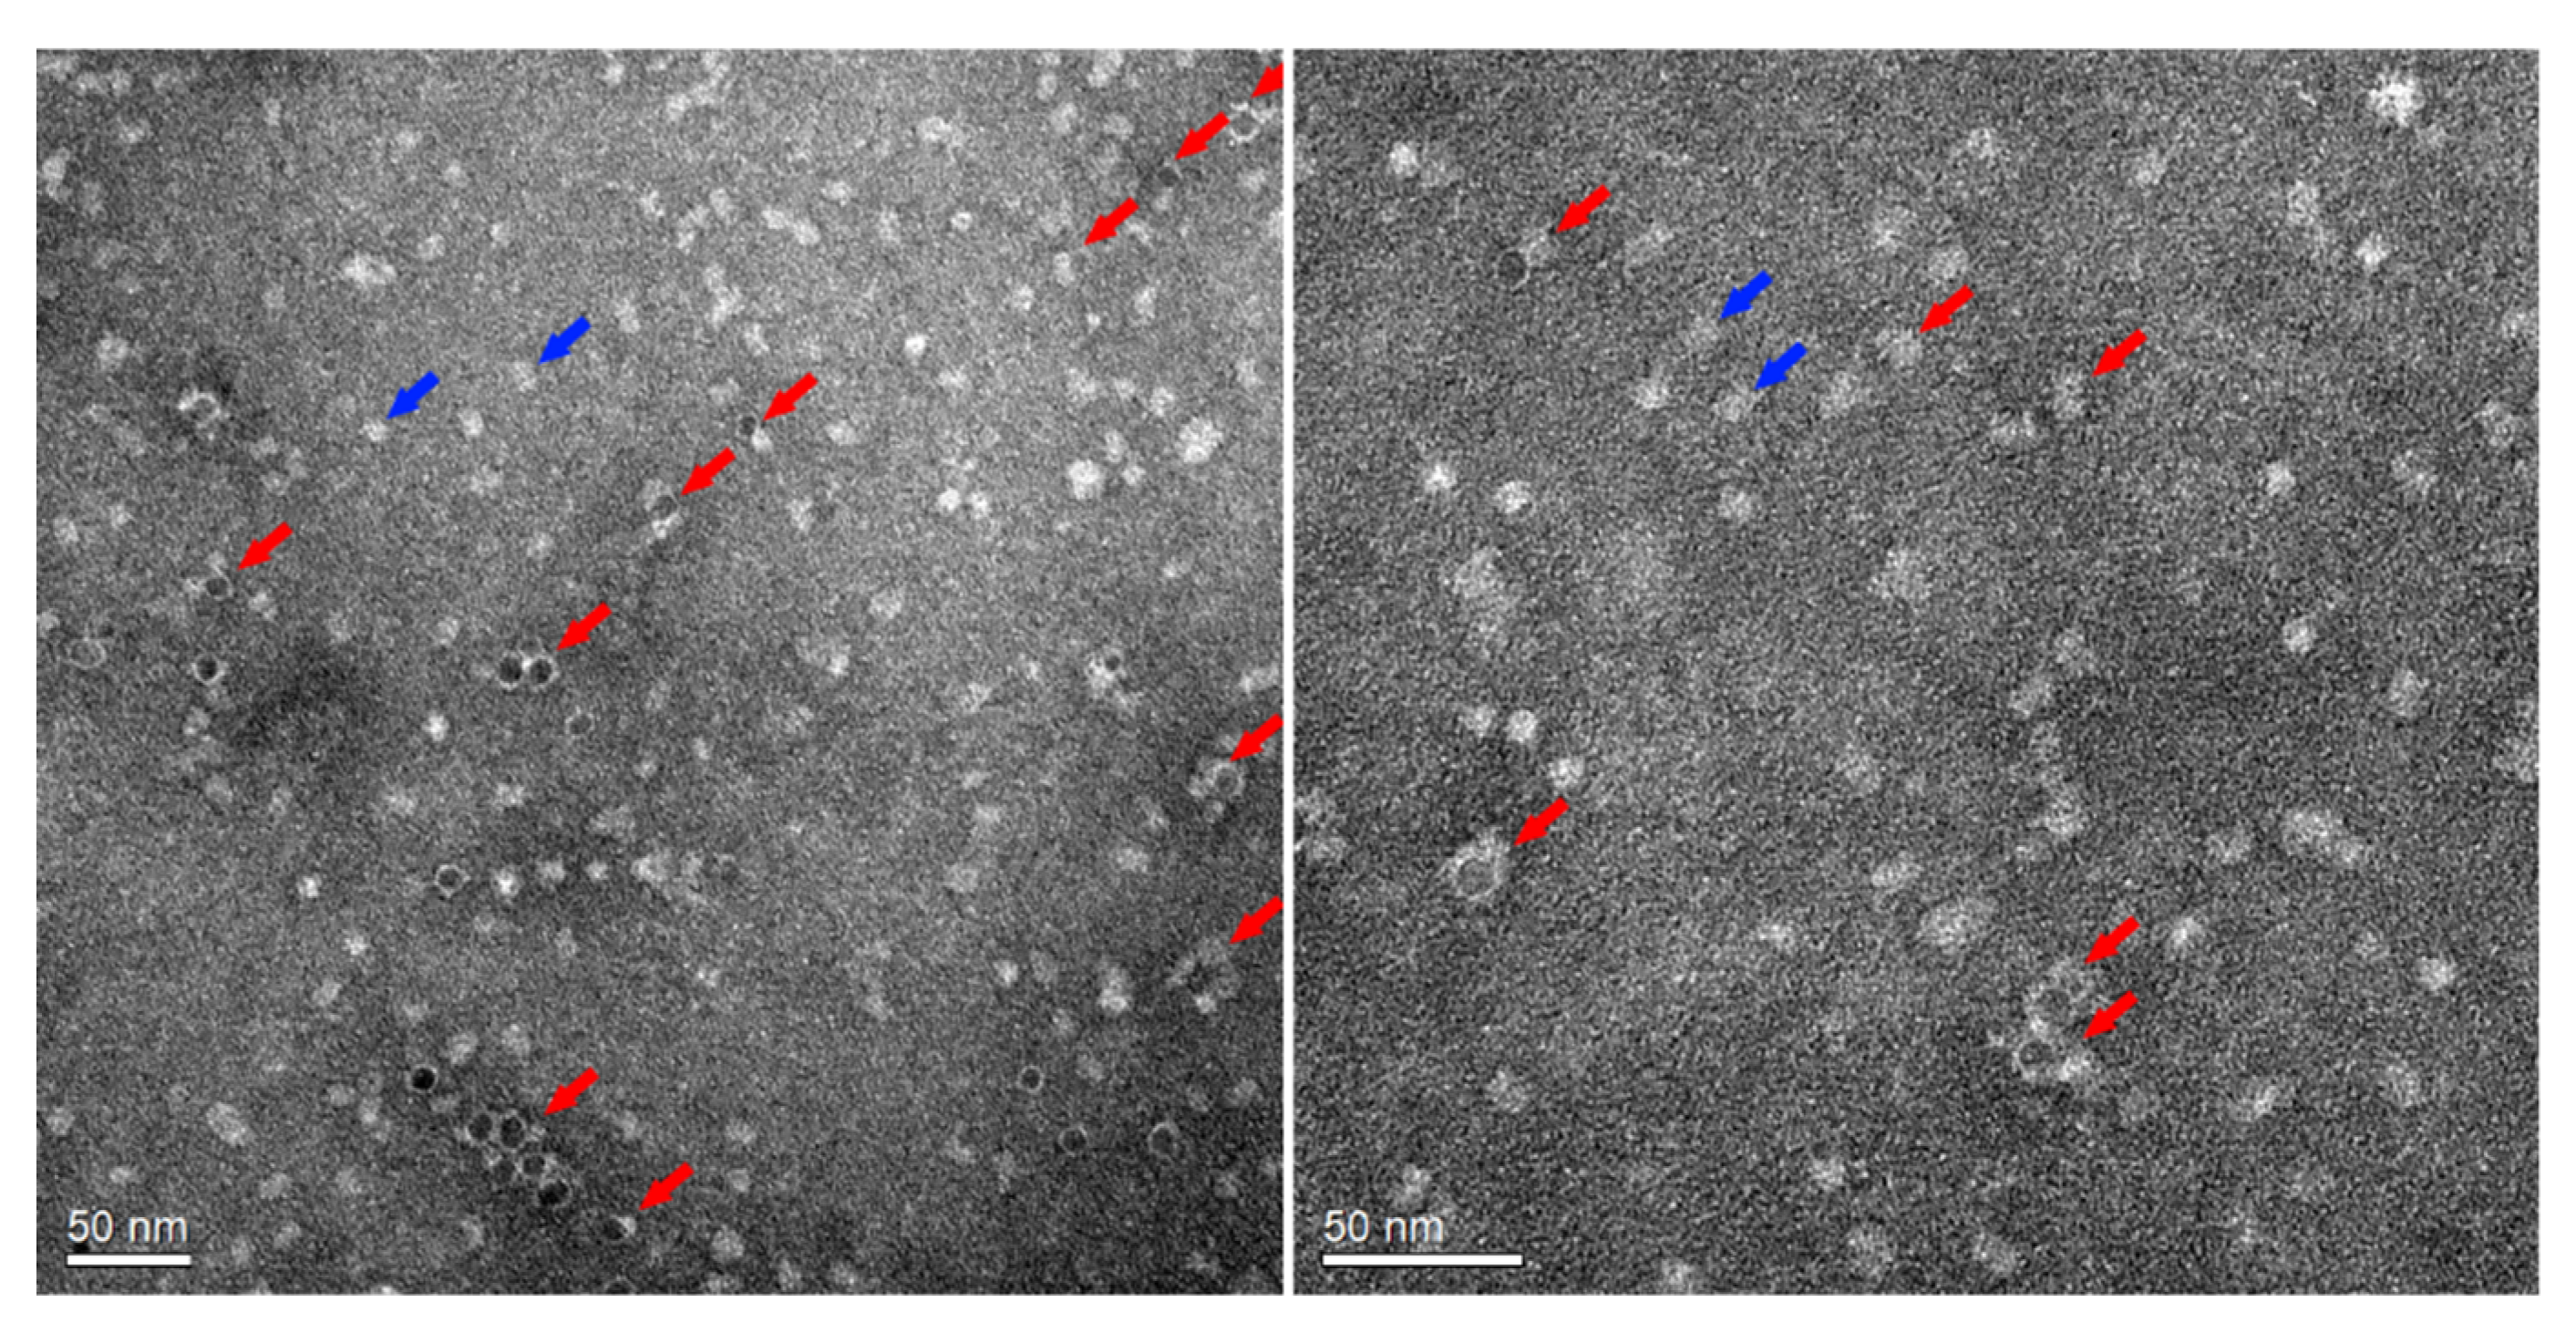
As mentioned, in the natural system, the electron transfer occurs, while the Fe-P and the P site clusters are aligned; therefore, labile interactions might be preferred, and stronger interaction with the docking site slows down the hydrogen generation. As been shown, the α158 Cys amino acid can be interfaced with a photosensitizer to allow artificial ATP-independent hydrogenation reactions. Using the αL158C MoFe-P variant has led to two and a half more times hydrogen generation. Those results may suggest that indeed, the α158Cys interact with the CdS NPs to lead to an improved electron transfer process. To elucidate the interactions, the uranyl-stained nitrogenase ME–CdS NPs hybrids were imaged using TEM, as shown in
Figure 4 and
Figure S11. While we can clearly see an interaction between the NPs and the enzymes in high percentages, we cannot conclude regarding the NPs and the nitrogenase orientation. Moreover, the αL158C MoFe-P consists of a second free exposed Cys on the surface that may interact with the NPs, but in a case of hybridization, the latter hydrogen generation is less likely to be achieved.
By measuring the extracted NH
3–OPA conjugates without the presence of MV, both MoFe-P variants produced similar amounts of NH
3 regardless of the capping ligands. On the other hand, the addition of MV to the MoFe-P/CdS–TGA NPs mixture led to a two-fold increase in the amounts of NH
3 generated compared with the MV-free reactions, and when both of the MoFe-P variants were activated with CdS–ME NPs, a five-fold increase in NH
3 production was observed. The moderate improvement in ammonia production in the presence of CdS–TGA NPs compared with CdS–ME NPs can be explained by the formation of electrostatic interactions between the positively charge MV and the negatively charge TGA ligands, which limits the mobility of the system. We further tracked the rate of NH
3 generation. The NH
3–OPA conjugates were quantified at different time points of irradiation (
Figure S9). Photoirradiated CdS NPs or NRs can undergo a destructive self-oxidation reaction. Nevertheless, using high concentrations of electron donor, e.g., ascorbic acid, this effect can be minimized to allow continuous activation [
43,
44]. The recorded rate of ammonia generation for an αL158C MoFe-P variant activated by CdS–ME NPs in the presence of MV was 0.29 moleNH
3/moleMoFe-P*min. It should be noted that the obtained rates are much lower than those of the ammonia production by the natural Fe-P/MoFe-P system, which reached 27 ± 7 moleNH
3/moleMoFe-P*min (see
Table S1).
The results obtained indicate that the addition of MV can enhance the amount of NH
3 generated compared with nitrogenase that is activated solely by CdS NPs. Moreover, the results show that ME-capped NPs lead to better catalytic performance compared with the charged TGA ligand. To better understand this phenomenon, we first examined the CB edges of the capped NPs (
Figure 2d). As mentioned, the CB edge of CdS–ME NPs is approximately 300 mV more negative than that of CdS–TGA NPs. As the data reveals, we can exclude the option of direct N
2 reduction by the CdS NPs surface with or without MV as a redox mediator or catalyst. We also examined whether chemically reduced MV can contribute directly to nitrogenase activation and found that the NH
3 generation was low (
Figure S10). The data obtained suggest that the CdS surface is essential for the reduction process and that MV dramatically increases the process efficiency. This might be a result of a conformational change in the nitrogenase proteins that allows better electron injection into the nitrogenase P-cluster. The ME ligand has two different roles in the catalytic process: (i) it shifts the CB potential to −1.2 V (versus Ag/AgCl), and (ii) it weakens the electrostatic interaction with MV and/or the MoFe-P. Analysis of the result obtained without MV leads us to conclude that the CB potential has only a minute effect; therefore, we can suggest that the less prominent charges of the ME ligands enable an improved release of the mediator, leading to higher turnover rates. The αL158C MoFe-P consists of two Cys sites that can potentially bond directly to NPs. If indeed the conjugation occurs at the Cys 158 site, an improved electron transfer rate should be expected. By comparing the ammonia results obtained with αL158C MoFe-P and with WT MoFe-P, we can conclude that no direct integration occurs or that it may shift the catalytic process to prefer a hydrogenation mechanism that minimizes N
2 fixation. The enhanced amount of H
2 obtained with αL158C MoFe-P could support this hypothesis. It should be noted that while MV was introduced into the system, H
2 cannot be detected, although MV is a well-known electron transfer carrier. MV in contrary to quinone-based electron transfer carriers is not coupled with protons transfer. Further investigation of how the MV effect the reductive elimination (RE) mechanism should be explored. This could be achieved by using electron paramagnetic resonance (EPR) or transient absorbance spectroscopy and compared to the native FeP/MoFe-P configuration. Moreover, theoretical calculations should be performed to correlate the hypothesis with the thermodynamics. The outcome may lead to an alternative mechanism that does not follow the RE or the known electron transfer path.
It has been shown that the Fe-P binds to nitrogenase via a positively charged docking site [
13,
41,
42]. We hypothesized that TGA–CdS NPs and ME–CdS NPs with strong and weak negative charges on their surface will bind to the docking site and force an improved electron transfer process. By examining the obtained data (
Figure 3), we conclude that such an effect did not occur. While surface charges can enable electrostatic interactions between NPs and MoFe-P, they cannot force the gated conformational changes required to allow the electron transfer process; this key process must be controlled for improved activity. Examining the TEM imaging (
Figure 4 and
Figure S10), it is clear that at least one αL158C nitrogenase is bonded to each ME–CdS NP. These results confirm that conjugation is indeed achieved; nevertheless, the artificial electron transfer process for ammonia production failed to compete with the natural process. By comparing the obtained results with the natural ATP Fe-P/MoFe-P system, we can see that the artificial system NH
3 production rates are significantly slower. On the contrary, H
2 production rates are comparable (see
Table S1). Further investigation of artificial photoactivation using smaller sized NPs might link directly to the αC158 site and subsequentially provide sufficient electron flux to ungate the nitrogenase. In that case, the MV will become otiose as a result of the direct electron injection to the nitrogenase P cluster. While phataldehyde is widely used for ammonia detection, alternative methods that are based on NMR spectroscopy should be explored [
45], although those methods are not applicable while low ammonia concentrations are measured.
3. Materials and Methods
Materials and equipment: All chemicals and solvents used were at least analytical grade and were used as received. UV-Vis spectra were acquired using an Evolution 201- spectrophotometer (Thermo Scientific, Waltham, MA, USA). Gas samples were analyzed via gas chromatography (GC, HP/Agilent, 6890 G1530A, Santa Clara, CA, USA) system equipped with a 5-Å column and a thermal conductivity detector. Fluorescence intensity was measured by a plate reader (Synergy H1, BioTek, Winooski, VT, USA) using a Hellma black quartz microplate. All electrochemical measurements were performed using a Potentiostat (Biologic SP200, Claix, France). TEM measurements were performed using a BioTWIN T12 (FEI Company, Hillsboro, OR, USA) and zeta potential was measured using a Malvern Zetasizer Ultra setup (Malvern, UK).
3.1. CdS Aanoparticle Synthesis (10 nm)
CdS NPs were synthesized using a previously reported method with some modifications (see TEM images in
Figure 1a and
Figure S1) [
30]. First, 91 mg of cadmium chloride (CdCl
2, 99.99%, Sigma-Aldrich, St. Louis, MO, USA), 20 mL of 1-octadecene (ODE, 90%, Sigma-Aldrich, St. Louis, MO, USA), and 1.578 mL oleic acid (OA, Fisher Scientific, Waltham, MA, USA) were mixed in a 100 mL round-bottom flask. While purging the flask with Ar atmosphere, the solution was heated to 120 °C and held for 1 h to remove oxygen and residual water. After 1 h, Ar supply was removed and the temperature was raised to 220 °C. In a separate vail, 16 mg sulfur (S, 99.5% Sigma-Aldrich, St. Louis, MO, USA) was mixed with 646.1 mL oleylamine (OLA, 70% Sigma-Aldrich, St. Louis, MO, USA). The solution was purged with Ar for 15 min and heated to 70 °C until sulfur was completely dissolved. Then, the solution was stored under heating (70 °C) until use. Once the temperature of the ODE mixture reached 220 °C, the sulfur mixture was injected into the ODE solution, allowing 10 min of growth. The resulting CdS solution was quenched in a warm water bath and subsequently cooled to room temperature. Then, the cooled CdS solution was washed to remove unreacted CdCl
2, S, OA, and OLA. Then, the CdS solution (≈10 mL) was transferred into two 50 mL conical centrifuge tubes and mixed with 5 mL of toluene followed by ≈ 30 mL of acetone. Then, the CdS NPs solution was centrifuged (8000 rpm, 5 min), and the supernatant was discarded. The dry CdS NPs were stored in the dark in a glove box (O
2 < 0.2 ppm).
3.2. CdS Ligand Exchange to 2-Mercaptoethanol (CdS-ME NPs)
A fraction of the dry CdS NPs stock was dissolved in 5 mL of toluene. While stirring vigorously, a separately prepared solution of 5 mL dd-H
2O, 200 μL of ME (>99.0%, Sigma-Aldrich, St. Louis, MO, USA) and 120 μL of 1 M NaOH was added to the CdS/toluene solution. Then, this solution was vigorously stirred overnight in the dark until the ligand-modified NPs were transferred to the aqueous phase. Upon completion, the colorless toluene phase was discarded, and the water-soluble CdS-ME NPs were centrifuged at 200×
g for 2 min to yield a clear, yellow solution (see
Figure S3). Then, this clean solution was filtered using a 30 kDa centrifuge filter (Amicon Ultra-15, Mercury) at 4200 rpm to remove any excess ligand. Then, CdS-ME NPs were re-dissolved in H
2O, and their concentration was determined by UV-Vis spectroscopy (excitation coefficient of 2.56 × 10
6 M
−1·cm
−1 at 472 nm).
3.3. CdS Ligand Exchange to Thioglycolic acid (CdS-TGA NPs)
TGA (98%, Sigma-Aldrich, St. Louis, MO, USA) was added to a stock solution of CdS-ME NPs until the solution turned hazy (≈5 µL TGA per mL of CdS-ME). Then, the solution was stirred in the dark for 5 h, following which 1 M NaOH was slowly added until the solution became clear. Upon completion, the CdS–TGA NPs were cleaned using a 30 K centrifuge filter (Pall Corporation) at 4200 rpm. Then, the CdS–TGA NPs were re-dissolved in H2O, and the concentration was determined by UV-Vis spectroscopy. The CdS–ME to CdS–TGA ligand exchange was also confirmed via agarose gel electrophoresis and zeta potential measurement.
3.4. Light-Driven NH3 and H2 Production from Nitrogenase
Reaction mixtures were prepared in 1.8 mL glass vials sealed with autosampler screw caps. CdS–ME/TGA NPs–MoFe-P biohybrid mixtures were prepared by mixing 51 mM ascorbic acid (AA, Aldrich headquarter), 120 nM CdS–ME/TGA NPs, and 1.7 µM methyl viologen dichloride hydrate (MV, 98%, Sigma-Aldrich, St. Louis, MO, USA) in 0.1 M PB pH-7.2. Then, the solutions were purged with N2 for 1 h before 100 μL of 4 µM of MoFe-P was injected into the reaction mixture (VT = 560 μL) in an Ar-atmosphere glovebox (O2 < 0.2 ppm). Then, the biohybrid mixtures were photoirradiated by a 465 nm LED light at 30 °C with gentle stirring. After 2 h, irradiation was stopped, and H2 and NH3 were quantified.
3.5. H2 Quantification
H
2 production was measured by injecting an 80 μL sample from the reaction headspace into a GC-TCD inlet septum equipped with a 5-Å column. H
2 was quantified using the calibration curve presented in
Figure S5.
3.6. NH3 Quantification
NH
3 production was determined using an OPA (≥97%, Sigma-Aldrich, St. Louis, MO, USA) as a fluorescence probe [
24,
46]. First, 400 µL of the irradiated nano-bio hybrid solution was mixed with 400 µL of OPA reagent containing 20 mM OPA, 3.4 mM ME in 0.2 M phosphate buffer (pH 7.0), and 5% ethanol. The samples were incubated for 1 h in the dark at 37 °C. Extraction and concentration of the NH
3/OPA conjugates were performed by adding 200 µl of chloroform while vigorously stirring for 20 s (
Figure S7). Then, the lower phase (chloroform) was collected and transferred to a new tube. The extracted NH
3/OPA conjugates were diluted five-fold with chloroform and loaded into a 96-well black quartz plate (Hellma). The fluorescence intensity of the different samples was measured using a plate reader (Synergy H1, BioTek; λ excitation = 410 nm, λ emission = 472 nm). NH
3 was quantified using the calibration curve shown in
Figure S6.


