1. Introduction
Operating in a littoral and marine environment provides the U.S. Navy with unique access to a vast environmental resource of carbon. The world’s oceans are the largest carbon reservoirs containing approximately 38,000 gigatons [
1]. Carbon and hydrogen are the principal building blocks needed to synthesize hydrocarbons. It is envisioned that these hydrocarbons may one day be used to produce operational fuel. Synthesizing “drop-in” replacement fuel at or near the point of use, translates into “Freedom of Action for the Warfighter” and potential long-term cost savings and strategic advantages for the Department of Defense (DOD) [
2,
3,
4]. If the energy required for the process is nuclear or renewable, the entire low carbon fuel process could be considered CO
2 neutral [
5,
6,
7].
The future capability of producing fuel from inorganic carbon (CO
2) and H
2 in seawater is dependent on the development of processes and technologies specifically designed for such applications. The U.S. Navy has recently patented a process and an apparatus for the simultaneous extraction of CO
2 and production of H
2 from seawater [
8,
9,
10]. However, the primary limitations in using the CO
2 and H
2 as building blocks for the synthesis of hydrocarbons are the high energy barrier for the redox and polymerization reactions necessary to synthesize longer chain molecules to be used as fuel [
5,
6,
7,
11]. While electrochemical and photochemical CO
2 conversion processes in water continue to improve in efficiency, challenges remain for these fuel synthesis approaches. These challenges include low hydrocarbon yields, catalyst stability, and difficulty in scaling-up the processes [
5,
7,
11]. Two-step thermochemical approaches are one of the few proven scalable methods for the production of liquid hydrocarbons ranging from C
6–C
17 from CO
2 and H
2 [
6,
12,
13,
14]. Step 1 involves the conversion of CO
2 and H
2 to intermediates (methanol, olefins, CO) [
6,
12,
13,
14,
15,
16,
17]. Step 2 processes these intermediates to C
6–C
17 hydrocarbons. Commercially, methanol and CO intermediates have both been successfully utilized in this two-step thermochemical approach [
13,
14], whereas the synthesis of olefin intermediates has only been extensively studied and demonstrated at the laboratory scale [
6,
17]. In order to evaluate the feasibility of directly synthesizing olefin intermediates as the first step towards operational fuel production for military and commercial applications, the process has to be scaled-up and demonstrated in thermochemical reactor platforms that will be relevant to off-shore and remote synthetic fuel production applications [
18,
19]. An additional advantage to scaling the chemical conversion of CO
2 to light olefin intermediates is that these intermediates serve as key building blocks in the chemical industry [
6,
12,
17].
Commercial-scale, low-cost, modular fixed-bed reactors are being designed and evaluated for remote Fischer-Tropsch synthesis (FTS) processes that use natural gas as the starting material [
18]. These advantages could also make commercial-scale fixed-bed reactors ideal for the scale-up of CO
2 hydrogenation technologies. Since catalyst physical properties and the reactor type are known to influence the product selectivity, mass transfer, and conversion of hydrogenation reactions [
17,
18,
19,
20,
21], they are important parameters to consider upon transitioning from the laboratory to commercial scale.
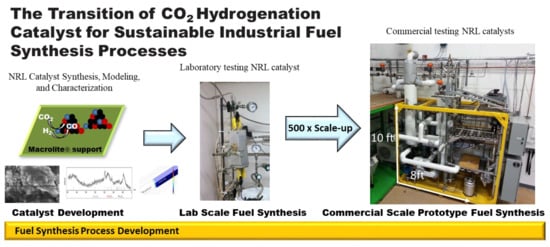
In previous work, highly active Fe-Mn-K/supported CO
2 hydrogenation catalysts were characterized and evaluated at the laboratory scale in both a continuously stirred tank/thermal reactor (CSTR) [
22] and a fixed-bed reactor [
17]. The catalyst materials were demonstrated to be capable of functioning as an effective catalyst to convert CO
2 to short-chain olefins. In the present work, the synthesis of Fe-Mn-K-based catalyst is scaled-up 300 times and operated in a commercial-scale prototype modular fixed-bed reactor that is 176 times larger by volume than previous laboratory scale studies. The findings of this paper show how catalyst and reactor scale-up along with recycling a portion of the product stream significantly enhance CO
2 conversion efficiency and dramatically change product selectivity. These results are used to expand modeling efforts to bridge the gap between bench-scale research and the development and implementation of a commercial process.
2. Results and Discussion
Commercial tubular fixed-bed reactors for FTS offer scalable solutions for off-shore and remote synthetic fuel production applications [
18,
19]. The potential challenges associated with using the reactors for FTS are the likely high-pressure drops, low catalyst utilization, and insufficient removal of the heat generated during the exothermic reaction [
18]. OxEon Energy developed the reactor used in this study (
Figure 1) along with the cooling fin (
Figure 2) after having several years of experience working with the hydrogenation of syngas (CO and H
2) to hydrocarbons using cobalt- and iron-based catalysts [
18]. Industry standard FT tube size is typically under 1″. OxEon Energy is able to use a larger tube size because of the thermal management structure shown in
Figure 1 and
Figure 2 that distributes the heat throughout the catalyst bed produced by the exothermic FT reaction. Optimizing the hydrogenation reactions in the larger reactor tube size will drastically reduce the number of tubes required for a process. This was intended to reduce long-term fabrication and catalyst servicing costs [
18]. The reactor and the skid that supports the hydrogenation reactions in this test series are pictured in
Figure 3.
The synthesis of light olefins from CO
2 in the fixed-bed environment presents even more challenges than traditional FTS. Equation (1) describes the reverse water–gas shift reaction (RWGS), which is endothermic and produces carbon monoxide (CO). Modeling and kinetic analysis of this reaction on the laboratory scale indicates the RWGS reaction rate is highest at the top of the reactor bed and decreases over the length of the catalyst bed [
17]. The CO produced is carried forward in an exothermic FT step (Equation (2)) to produce predominantly monounsaturated hydrocarbons (Equation (3)).
A thermodynamically favorable side reaction associated with CO
2 hydrogenation is the highly competitive methanation reaction (Equation (4)) [
23].
Another competing side reaction is the Boudouard reaction (Equation (5)) [
23].
The water formed in the primary reactions shown in Equations (1)–(3) is twice the amount of water produced in traditional FTS. As this water accumulates along the fixed catalyst bed during the hydrogenation reaction, the catalyst will likely be more susceptible to re-oxidizing [
17]. Even though the overall reaction is exothermic in nature, the role the RWGS reaction has on the overall process and temperatures along the catalyst bed can be better elucidated at the commercial-scale. The larger scale allows for more precise monitoring of the reaction conditions across the reactor bed.
Five K profile probe thermocouples purchased from Omega (31 Stainless steel, 72) were positioned approximately 12 inches from one another along the catalyst bed starting from the top of the bed. The thermocouples were measured by Labview to monitor the exothermic behavior of the reaction as it proceeds down the reactor bed. During a typical commercial-scale reaction, the top of the catalyst bed measured an average temperature of 555 K, while the remainder of the catalyst bed was measured at 574 K and never rose above 575 K in a single pass of the feedstock. Since the feedstock gases are preheated before they enter the top of the reactor bed, the 19 K difference in temperature is attributed to the endothermic nature of the RWGS reaction (Equation (1)) and slow heat transfer during preheating the feedstock entering the bed. This temperature difference is not common in the FTS process that is highly exothermic (Equation (2)) and requires the thermal management structure shown in
Figure 2 to distribute the heat throughout the catalyst bed, preventing any risk of thermal runaway. The thermocouple data supports findings from a three-dimensional fixed-bed computational model that shows how the RWGS reaction rate is high near the entrance of the catalyst bed and is always more than the FT reaction rate throughout the length of the catalyst bed [
17]. This explains why the temperature should be cooler at the beginning of the reaction and suggests there is a lower risk of thermal runaway or the need for additional thermal management structures for these types of CO
2 hydrogenation reactions.
Prior to choosing a catalyst to measure performance in the commercial-scale fixed-bed reactor environment, the composition of Fe:Mn:K-based catalysts on gamma alumina and Macrolite supports were well characterized in a laboratory scale fixed-bed environment [
17]. Since gamma alumina supports are susceptible to hydroxylation in fixed-bed environments [
17], there was motivation to replace the gamma alumina support of the iron-based catalysts with the engineered chemically inert ceramic aluminosilicate material, Macrolite
®, (M2). After the successful demonstration of commercially prepared 100:3.93:2.36:3.23 M2: Fe:Mn:K catalyst (Fe:M2-1,
Table 1) at the laboratory scale, Water Star Inc. (Newbury, OH, USA) prepared a small batch (~500 to 1000 g) of higher concentrated iron-based catalyst on the Macrolite
® support (support 100:17:12:16.5 ratio of M2:Fe:Mn:K) (Fe:M2-2,
Table 1). The Fe:M2-2 catalyst composition closely resembled previously published iron-based catalyst compositions loaded on gamma alumina support [
22]. Fe:M2-2 was characterized and tested at the laboratory scale to ensure that the CO
2 hydrogenation performance properties were similar or better than those measured for the gamma alumina supported catalyst [
17] under similar reaction conditions.
Table 1 (Row 2) shows a CO
2 conversion of 41% and an O/P ratio of almost 5. Based on the laboratory-scale results, Water Star Inc. scaled up the catalyst synthesis of the 100:17:12:16.5 support M2: iron: manganese: potassium catalyst (Fe:M2-3) to kilogram quantities for testing in the commercial-scale fixed-bed reactor environment that are presented in this study.
The single pass of the feedstock over the commercial-scale catalyst bed is the closest reaction conditions to those run at the laboratory scale, as there is currently no mechanism in place to recycle the product stream at the laboratory scale. Data were collected on the conversion of CO
2 and H
2 over the Fe:M2-3 catalyst for a 96 h period. CO
2 conversion, product selectivity, and olefin/paraffin ratio as a function of GHSV, product recycling, and catalyst regeneration are reported in
Table 1, along with data for other catalyst blends and reactor scales. When the Fe:M2-3 catalyst was reacted in the commercial-scale fixed-bed reactor at the lowest total GHSV of 4.6 × 10
−4 L/s-g for 96 h under single pass feedstock conditions (
Table 1, Rows 4–7), the average CO
2 conversion was 26% with a CO selectivity of 46% and methane selectivity of 6%. The olefin/paraffin (O/P) ratio increased from 3.1 to 4.4 in the first 48 h of operation. The hydrocarbon selectivity (percent conversion of CO
2 to C2–C5+ hydrocarbons) was 48% on average. The percent yield values in
Table 1 were calculated by multiplying the C2–C5+ selectivity values by the CO
2 conversion given in the Table. The average C2–C5+ yield measured is approximately 12% by weight on a carbon basis at a GHSV of 4.6 × 10
−4 L/s-g.
Loosely comparing the average commercial-scale hydrogenation results of Fe:M2-3 (
Table 1, Rows 4–7) to the laboratory-scale operating conditions performed with the small-scale commercially prepared catalyst, Fe:M2-2, at a higher GHSV of 9.6 × 10
−4 L/s-g (
Table 1, Row 2), a 37% decrease in CO
2 conversion and an 86% increase in CO selectivity is observed on the commercial scale for the Fe:M2-3 catalyst. This was an unexpected result, as the lower GHSV tested at the commercial scale was anticipated to yield higher CO
2 conversions. This significant difference in conversion and selectivity at the two reactor scales prompted the implementation of a regeneration process before changing the commercial-scale reactor operating conditions and studying the catalyst performance. Mechanisms for catalyst regeneration and the long-term catalyst stability are important for the commercial feasibility of any catalyst process [
24]. Fe:M2-3 was regenerated by flowing hydrogen over the catalyst bed at until methane was not detected by the inline GC equipped with a TCD detector. Then nitrogen with air to make 1% O
2 was flowed over the catalyst bed. The O
2 content was gradually increased until no further CO
2 was measured by the GC. This method was used to remove all hydrocarbon and carbon remaining on the catalyst and also dried the catalyst bed.
After catalyst regeneration, the reaction was resumed at a total GHSV of 1.3 × 10
−3 L/s-g with the recycling feature applied to the experimental runs. The water in the recycle feed was condensed and removed from the feed. The dry recycle feed at 9.2 × 10
−4 L/s-g was blended with fresh feed at 3.5 × 10
−4 L/s-g back into the reactor at a 2.6:1 recycle feed to fresh feed
Table 1, Rows 8–11). It is worth noting that the top of the catalyst bed measured an average temperature of 540 K. This is, on average, 15 K cooler than the single pass temperatures measured at the top of the reactor. This additional drop in temperature is believed to be the result of the recycle feed being treated for removal of liquid and water by passing it through a cold trap (
Figure 4). The temperatures in the remainder of the catalyst bed reached an average of 575 K, which is similar to those measured during the single pass conditions.
After 96 h on stream, under these recycling conditions, the average CO
2 conversion was measured to be 62% (
Table 1, Rows 8–11), far greater than the 26% CO
2 conversion originally measured under the single pass conditions (
Table 1, Rows 4–7). Under the recycling conditions, methane selectivity increased from 6% to 9% and C2–C5+ selectivity increased from 48% to 76%. CO selectivity was reduced from 45% to 15%, while the O/P remained at 4. This reduction in CO selectivity also corresponds well with the 75% increase in average C2–C5+ yield, indicating the CO produced during the first pass over the catalyst is hydrogenated to higher hydrocarbons during the second pass over the catalyst bed.
Increasing the total GHSV from 1.3 × 10
−3 to 1.4 × 10
−3 L/s-g by the addition of 1.1 × 10
−4 L/s-g of fresh feed and 2.0 × 10
−5 L/s-g of recycled feed over a 72 h period significantly affects the selectivity of the catalyst (
Table 1, Rows 12–14). Since the GHSV was only increased by 7.7%, the change in CO
2 conversion and product selectivity can be attributed more to the lower ratio of recycle feed 2:1 to fresh feed. Reducing the amount of unreacted CO by reducing the amount of recycle feed on each pass over the catalyst bed lowered the average CO
2 conversion from 62% (
Table 1, Rows 8,9) to 53% (
Table 1, Rows 12–14) and hydrocarbon selectivity from 78% to 69%. This is further substantiated at lower GHSV. While GHSV has been shown to have little effect on the chain growth probability of C1–C5+ at the laboratory scale, it has had a significant impact on CO
2 and CO conversion. In particular, their conversion can be significantly improved by lowering the GHSV and thus increasing the residence time of the reagents CO
2, CO, and H
2 in contact with the active catalyst bed. When the GHSV is lowered to 8.0 × 10
−4 L/s-g and the ratio of recycle feed to fresh feed is returned to 2.6:1, the highest average CO
2 conversion and hydrocarbon selectivity are reported at 68.5% and 79 (
Table 1, Rows 15,16). In addition, the lower GHSV reduces CO selectivity to 9% in favor of greater C2–C5+ yield at 54%.
A detailed kinetic analysis at the commercial prototype modular fixed-bed reactor scale is challenging from a cost, time, and materials perspective. In this study, the single pass feedstock conditions and the ability to recycle a portion of the product stream in the commercial-scale prototype reactor are modeled using reaction kinetics ascertained at the laboratory scale [
17]. The single pass feedstock reactor conditions were modeled at a GHSV of 4.6 × 10
−4 L/s-g, a gas mass fraction composition of 82.2% CO
2, 10.9% H
2, and 6.9%N
2, inlet temperature of 553 K, and 2 Mpa (20 Bar) pressure. The single pass feedstock reactor model yielded results with a conversion of 22% CO
2 and product selectivities of 52% CO, 43% C
3H
6, and 5% CH
4 with an outlet temperature of 575 K (
Table 2). The model suggests that if the reactor outlet temperatures are raised to 608 K, the CO
2 conversion will increase to 26% and the CO and CH
4 selectivities will decrease (45% and 6%) in favor of higher hydrocarbon formation, 49% C
3H
6 (
Table 2). Both of these sets of model results (575 and 608 K outlet temperature) are very similar to those reported by Riedel et al. [
24]. The model results also fall in a similar range as the averaged prototype reactor data measured and are shown in
Table 1 and
Table 2.
Recycling conditions were incorporated into the model using a feed gas consisting of a combined fresh (4.6 × 10
−4 L/s-g GHSV and recycled 9.4 × 10
−4 L/s-g GHSV) gas mass fraction composition of 81.0% CO
2, 10.6% H
2, 1.0% CO, 1.2% C
3H
6, 0.2% CH
4, 6.0% N
2, and 0.0% H
2O. The model provided results indicating 53% conversion of CO
2 and product selectivities of 21% CO, 65% C
3H
6, and 14% CH
4 with an outlet temperature of 574 K (
Table 2). The model results align well with the measured data for the recycled conditions as provided in
Table 1 and
Table 2.
Any differences in the modeling results may be attributed to the complexities of the commercial-scale reactor configuration and the axial location of the thermocouples. Temperature excursions within the prototype reactor could have risen above the 573 K without being measured by the thermocouples due to the finned nature of the reactor (
Figure 2). The internally finned reactor creates separate channels of flow all separated by an aluminum wall, which causes multiple “micro” reactors within the large reactor resulting in potential differences in temperatures. The model supports this possible temperature variation by providing a better fit at reactor outlet temperatures that are 35 K higher than those measured during the reactions. Neither of the reactor models indicated a radial heat transfer limitation. However, a primary limitation in CO
2 conversion is the heat required by the endothermic RWGS reaction that initially drops the temperature in the first section of the bed followed by the subsequent exothermic FT reaction that begins to release heat that needs to be removed. This further substantiates previous modeling and kinetic analysis that indicate that the FT reaction is the rate-limiting step in the use of these supported iron-based catalysts [
17].
After the commercial-scale testing was completed, significant differences in catalyst activity and selectivity were observed for the commercially prepared small-batch catalyst Fe:M2-2 tested at the laboratory scale (
Table 1, Row 2) and the large batch Fe:M2-3 prepared and measured at the commercial scale. Fe:M2-3 activity and selectivity with respect to CO
2 conversion, O/P, and hydrocarbon yields align more closely with the Fe:M2-1 that was prepared commercially with a lower iron concentration (100:3.93:2.36:3.23 M2: Fe:Mn:K) [
17]. These observations motivated further characterization of both catalysts. The activity of the Fe:M2-3 catalyst was measured at a GHSV of 4.6 × 10
−4 L/s-g in the NRL laboratory scale fixed-bed reactor, while both the Fe:M2-2 and Fe:M2-3 were characterized and compared by XPS and XRD shown in
Table 3. When the hydrogenation results of Fe:M2-3 are compared at the different reactor scales and GHSV of 4.6 × 10
−4 L/s-g, the results in
Table 1 (LS/kg) show a 57% loss in CO
2 conversion at the laboratory scale to 11%. CO selectivity was reduced by 56% in favor of C2–C5+ formation at 36%, and the methane selectivity was similar at 6%.
Elemental analysis using XPS (
Table 3) reveals that Fe:M2-3 catalyst batch contains twice the concentration of manganese and less than half the iron concentration of Fe:M2-2 catalyst. The effects of iron loading on CO
2 conversion and product selectivity have been well established [
22].
Table 1 provides data taken in the laboratory-scale reactor for the well-characterized iron/manganese/potassium/Macrolite
® catalysts with a relative iron loading that is 3.93% by weight of the M2 support, Fe:M2-1. The CO
2 conversion observed is 26% compared to 41% for the higher iron-loaded catalyst, Fe:M2-2 under laboratory-scale reactor conditions. These results are in line with similar reports documenting the change in CO
2 conversion and product selectivity as a function of increase in the iron [
22] and further supports the findings that the Fe:M2-3 catalyst was not made to the specified metal loadings. Contributions of aluminum, oxygen, and carbon were factored out of the XPS analysis to reduce any potential impact of surface oxygen and advantageous carbon species. There were also various trace elements that only existed in one catalyst or the other, including silicon, calcium, nitrogen, and chlorine.
X-ray diffraction analysis in
Figure 5 revealed that both Fe:M2-2 and Fe:M2-3 contain the same iron oxide crystal phase (Fe
2O
3 hematite), but the support phases between the two catalyst are clearly different. Yellow tick marks have been added to the pattern to indicate discrepancies between the Fe:M2-2 and Fe:M2-3 catalysts. When compared to the hematite simulated pattern, it is evident that both catalysts contain the iron oxide phase, leading to the conclusion that the support is the primary difference between the two catalysts. Unfortunately, no one alumina or aluminosilicate phase we examined accurately matches the supports in question. In summary, it is clear that these catalysts are different compositionally and crystallographically from one another. After providing further evidence to the supplier on the differences in catalyst support, the supplier revealed that different supports were in fact used between the small-scale catalyst batch Fe:M2-2 and the large-scale catalyst batch Fe:M2-3. While it was believed that little difference in chemical activity existed between the two supports, this difference ultimately led to the decrease in activity of Fe:M2-3 relative to the Fe-M2-2 small-scale catalyst test batch measured at the laboratory scale.


