Article

Polyhedral Effects on the Mass Activity of Platinum Nanoclusters

by
Forrest H. Kaatz
1,* and
Adhemar Bultheel
2
1
Mesalands Community College, 911 South 10th Street, Tucumcari, NM 88401, USA
2
Department Computer Sci., KU Leuven, Celestijnenlaan 200A, 3001 Heverlee, Belgium
*
Author to whom correspondence should be addressed.
Catalysts 2020, 10(9), 1010; https://doi.org/10.3390/catal10091010
Submission received: 11 August 2020 / Revised: 25 August 2020 / Accepted: 1 September 2020 / Published: 3 September 2020
(This article belongs to the Special Issue Regeneration of Adsorbent by Catalytic Process)

Abstract

:
We use a coordination-based kinetics model to look at the kinetics of the turnover frequency (TOF) for the oxygen reduction reaction (ORR) for platinum nanoclusters. Clusters of octahedral, cuboctahedral, cubic, and icosahedral shape and size demonstrate the validity of the coordination-based approach. The Gibbs adsorption energy is computed using an empirical energy model based on density functional theory (DFT), statistical mechanics, and thermodynamics. We calculate the coordination and size dependence of the Gibbs adsorption energy and apply it to the analysis of the TOF. The platinum ORR follows a Langmuir–Hinshelwood mechanism, and we model the kinetics using a thermodynamic approach. Our modeling indicates that the coordination, shape, and the Gibbs energy of adsorption all are important factors in replicating an experimental TOF. We investigate the effects of size and shape of some platinum polyhedra on the oxygen reduction reaction (ORR) and the effect on the mass activity. The data are modeled quantitatively using lognormal distributions. We provide guidance on how to account for the effects of different distributions due to shape when determining the TOF.

1. Introduction

There is a long history of speculation that catalytic reactions depend on structure and shape, and thus the coordination of the catalyst [1]. Indeed, in 1985, Falicov and Somorjai proposed that coordination-sensitive edge and kink sites would be most likely to be active for structure-sensitive reactions [2]. Nanocluster synthesis has reached the stage where narrow particle size distributions of desired shapes of many elements and alloys may be achieved [3]. This allows experimentalists to fine-tune catalytic reactions so that specific shapes, sizes, and thus the coordination of the catalyst is known. We model the kinetics (turnover frequency (TOF)) of surface sites showing that they strongly depend on the shape and structure of nanoclusters.
The oxygen reduction reaction (ORR) has much application to fuel cell technology. There is previous work on the size dependence of the ORR. Shao et al. showed experimentally in 2011 that platinum nanoparticles have a maximum in the mass activity around 2.2 nm [4]. Likewise, there have been modeling efforts by Nesselberger et al. [5], Tritsaris et al. [6], and Tripkovic, et al. [7]. Somewhat more recently, Rück, et al. have determined the platinum ORR size dependence via density functional theory (DFT) [8]. Furthermore, DFT has been combined with kinetic Monte Carlo methods to look at the TOF on platinum nanoclusters [9]. We calculate the Gibbs energy using an established procedure [10] for the ORR reactions and incorporate it into the mass activity of the ORR via the TOF. This may lend insight into experimental needs of cluster morphology and its impact on the TOF.
Recently, we have determined coordination specific magic formulas for the surface sites of 19 different nanoclusters [11]. These magic formulas can assist our understanding of the coordination and size-dependent surface behavior of clusters. In the size dimension of the mesoscale, neither the atomic nor bulk apply, and much activity relies on the surface coordination of the specific cluster being studied. While the exact dimensions of the mesoscale are ambiguous, a good approximation is clusters with diameter D ~5–100 nm. DFT studies on the surface states of nanoclusters show that for D ~3 nm for gold [12], and D ~2 nm, for platinum [13], the transition from the atomic to bulk has occurred. In addition, Hoover, et al. calculate that the difference in entropy between the thermodynamic prediction and the exact entropy is less than k B (Boltzmann’s constant) when the number of atoms, N > 400 for classical close packed harmonic cubes [14]. This shows that quite small clusters may be modeled with thermodynamics. Similarly, an estimate of D as a lower limit of the mesoscale can be made from thermal fluctuations [15]. For a cube of dimension D and volume D 3 , with ρ n atoms per unit volume, the thermal fluctuations are about δ T / T ( ρ n D 3 ) 1 / 2 . For solids and liquids, ρ n 50 / nm 3 . If we accept fluctuations of 10 2 , this gives D 5 nm .
The Gibbs adsorption energy has been calculated by a few authors using a DFT approach [16,17]. Unfortunately, the size range of interest for the TOF is rather large for DFT, and a range of sizes is required. We provide a coordination approach using an empirical energy model combined with DFT, and add statistical mechanics along with thermodynamics to complete the Gibbs adsorption energy calculation. This enables us to determine the Gibbs adsorption energy, Δ G , as a function of size and coordination. By modeling clusters using a coordination approach, we are able to avoid the need for supercomputer calculations, as the computational demands are modest (only desktop models required). This is a different approach to calculating the Gibbs energy.

2. Methods

We define G as the Gibbs energy of the cluster (which depends on the size), then, because of adatoms being bonded to the outer shell atoms, there is an increase in G that is called the adsorption energy and is denoted as Δ G . This can be split up over different coordination types of the atoms on the outer shell bonding to adatoms. We suppose a kink atom adds to the adsorption energy with an amount Δ G k . Similarly an edge atom adds Δ G e , while a facet atom contributes Δ G f then [18]
Δ G = o { f , e , k } Δ G o N o
where N o is the number of atoms in the outer shell of the indicated type. If N S = N f + N e + N k is the total number of atoms in the outer shell bonded to adatoms, then this can be rewritten as
Δ G = Δ G f · ( 1 f e f k ) + Δ G e · f e + Δ G k · f k where f o = N o / N S , o { e , k } ,
where the edge and kink sites which have explicit coordinations for specific structures (see Table 1). Note that Equation (2) applies to adsorption to on-top sites; otherwise, not all adatoms will be bonded to atoms in the outer shell.
We have a fundamental relationship for the Gibbs energy and adsorption constant, K a :
K a = exp Δ G R T ,
where R is the gas constant and T is the temperature in Kelvin. Brønsted–Evans–Polanyi relationships are widely used in homogeneous and heterogeneous catalysis [18,19], using a relationship for reaction constants k and equilibrium constants K as follows,
k = g K α , 0 < α < 1 ,
where g and α (Polanyi parameter) are constants. The Polanyi parameter is unitless and a proper fraction, as given originally by Brønsted [20]. We then have
k a = k a exp α f n e · χ e ( D n ) + f n k · χ k ( D n ) ,
where
χ e ( D ) = Δ G e ( D ) Δ G f ( D ) R T , χ k ( D ) = Δ G k ( D ) Δ G f ( D ) R T ,
and
k a = g exp α Δ G f R T .
We now proceed with the explanation of the method to calculate Δ G .
In the early 1990s, DFT studies on metal clusters gave E ( c n i ) , the bonding energy of atom i, as a function of its coordination c n i , and that led to the following empirical relationship [21],
E ( c n i ) = E 0 A · c n i + B · ( c n i ) ,
where E 0 , A, and B are constants of the fit [10], see Table 2. By definition, we then have the bond energies, E i j , as a function of coordination:
E i j = 1 2 · c n B E ( c n i ) + E ( c n j ) ,
where c n B is the bulk coordination, or 12 for fcc metals. For details on this model, we refer the reader to reference [10].
To allow for small deviations from the average bond length, we define i and j as nearest neighbors, and separate them from the rest by requiring that r i j < r c , where r c is a threshold value, appropriate for the nanocluster. The value for r c must be less than the distance for second nearest neighbors and varies with the crystal structure. For fcc crystals, r c < 1.41 · r m i n , where r m i n is the smallest bond length [11]. Thus,
A ( i , j ) = 1 , if r i j < r c   and   i j 0 , otherwise
describes the adjacency matrix for the cluster, and
E ( i , j ) = r i j , i f r i j < r c   and   i j 0 , otherwise
describes the Euclidean matrix for the cluster. We use an adjacency matrix and Euclidean matrix to determine the diameter, D, of the nanoclusters [11], where the bond length in the clusters depends on the average coordination [22]:
r ( c n ) = 2 r B 1 + exp 12 c n c ) 8 · c n c .
Here, r B is the bulk bond length and c n c is the average coordination of the cluster. We find a linear relationship between D and n, the number of cluster shells, as shown in Table 3:
D ( n ) = a · r B · n + b .
This relationship is derived from MATLAB code for calculating the cluster diameter.
The energies of adsorbates have been shown to scale linearly with generalized coordination [23,24]. We use a DFT model for energies of adsorbates [23]:
C N ¯ i = c n j · n j c n max
where the sum is over all nearest neighbors of i, c n max = 12 for top sites, 18 for bridge sites, and has other values for other types of sites [23]. In this equation, n j is the number of nearest neighbors, thus each neighbor j of atom i has a weight of n j / c n max associated with the site. Adsorbate energy, E a d , is linear with generalized coordination [23]
E a d = C N ¯ 0 + m · C N ¯ i .
Table 4 shows the values of the linear fits as determined by Equation (15).
We construct our cluster-adatom Hamiltonian as follows,
H ( i , j ) E i j i , j in the nanocluster E a d for an adatom bond 0 otherwise
with only nearest neighbor non-zero entries, i.e., a sparse matrix. In the Hamiltonian approach, the partition function is [10,26,27]
Z = Tr e β H
and β = 1 / k B T is the inverse temperature, where k B is Boltzmann’s constant, T is the temperature in Kelvin (we use T = 300 K), Tr is the trace of the following matrix, and H is the Hamiltonian matrix, as given by Equation (16) [10]. The probability of each state is then p j = e β λ j / Z , where Z is the partition function, Equation (17), and λ j is an eigenvalue of the Hamiltonian matrix [27].
The Gibbs energy of adsorption in the nanoscale systems we examine is in joules (J), if we neglect the small P V (pressure–volume) term, [10,26]
Δ G = R T N n ln Z ,
where Z is the partition function, Equation (17), and where N n = N c + N θ , with N c the number of atoms in the cluster and N θ the number of adatoms at coverage theta. The Gibbs adsorption energy here is converted from more standard units by dividing by N θ and using a conversion factor ( R / k B ) to get units of (J/mol). We average several times over the nanocluster system, as especially for the kink sites, the statistics are low.
3. Results and Discussion

3.1. Langmuir-Hinshelwood Mechanism

In general, the TOF for reactions may display structure sensitivity which rises or decreases with size, or is not sensitive, or passes through a maximum [28]. The literature discusses several types of reactions, including a two-step sequence and its corollary, the Eley–Rideal reaction, and the Langmuir–Hinshelwood (L–H) mechanism [29]. The L–H mechanism is relevant for surface reactions [30]:
1 . A + Z ZA ( quasi-equilibrium ) 2 . B + Z ZB ( quasi-equilibrium ) 3 . ZA + ZB C + 2 Z A + B C
where A and B are reactants, C is the product, and Z is a surface site. The reaction rate is [29]
v ( D ) = k 3 K 1 P A K 2 P B ( 1 + K 1 P A + K 2 P B ) 2 ,
where we have
K 1 ( D ) = K A exp f e · χ e A ( D ) + f k · χ k A ( D ) ,
K 2 ( D ) = K B exp f e · χ e B ( D ) + f k · χ k B ( D ) ,
where k 3 is the reaction rate constant for sequence 3 (see (19)), P A and P B are partial pressures or concentrations (for liquids) of A and B, and for reaction 3 we have
k 3 ( D ) = K C exp ( 1 α ) f e · χ e A ( D ) + χ e B ( D ) + f k · χ k A ( D ) + χ k B ( D ) .
After some simplification we get
v ( D ) = p 1 exp ( α ) f n e · χ e A ( D n ) + χ e B ( D n ) + f n k · χ k A ( D n ) + χ k B ( D n ) [ 1 + p 2 exp { [ f n e χ e A ( D n ) + f n k χ k A ( D n ) ] } + p 3 exp { [ f n e χ e B ( D n ) + f n k χ k B ( D n ) ] } ] 2
where p 1 is a frequency and p 2 , p 3 are related to the rate constants and partial pressures of A and B [18,29]. Here, n refers to the dependence on complete shells of nanoclusters. As we are not aware of other analysis of the data, we use α and the p i as adjustable parameters. In principle, there are more experimental parameters (Polanyi parameter, kinetic constants, and partial pressures or concentrations) depending in a complicated way on the analysis than we use to model the data. We find that α affects the full width half maximum, FWHM, p 1 affects the peak intensity, and p 2 , p 3 affect the center of the peak position.

3.2. Pt ORR

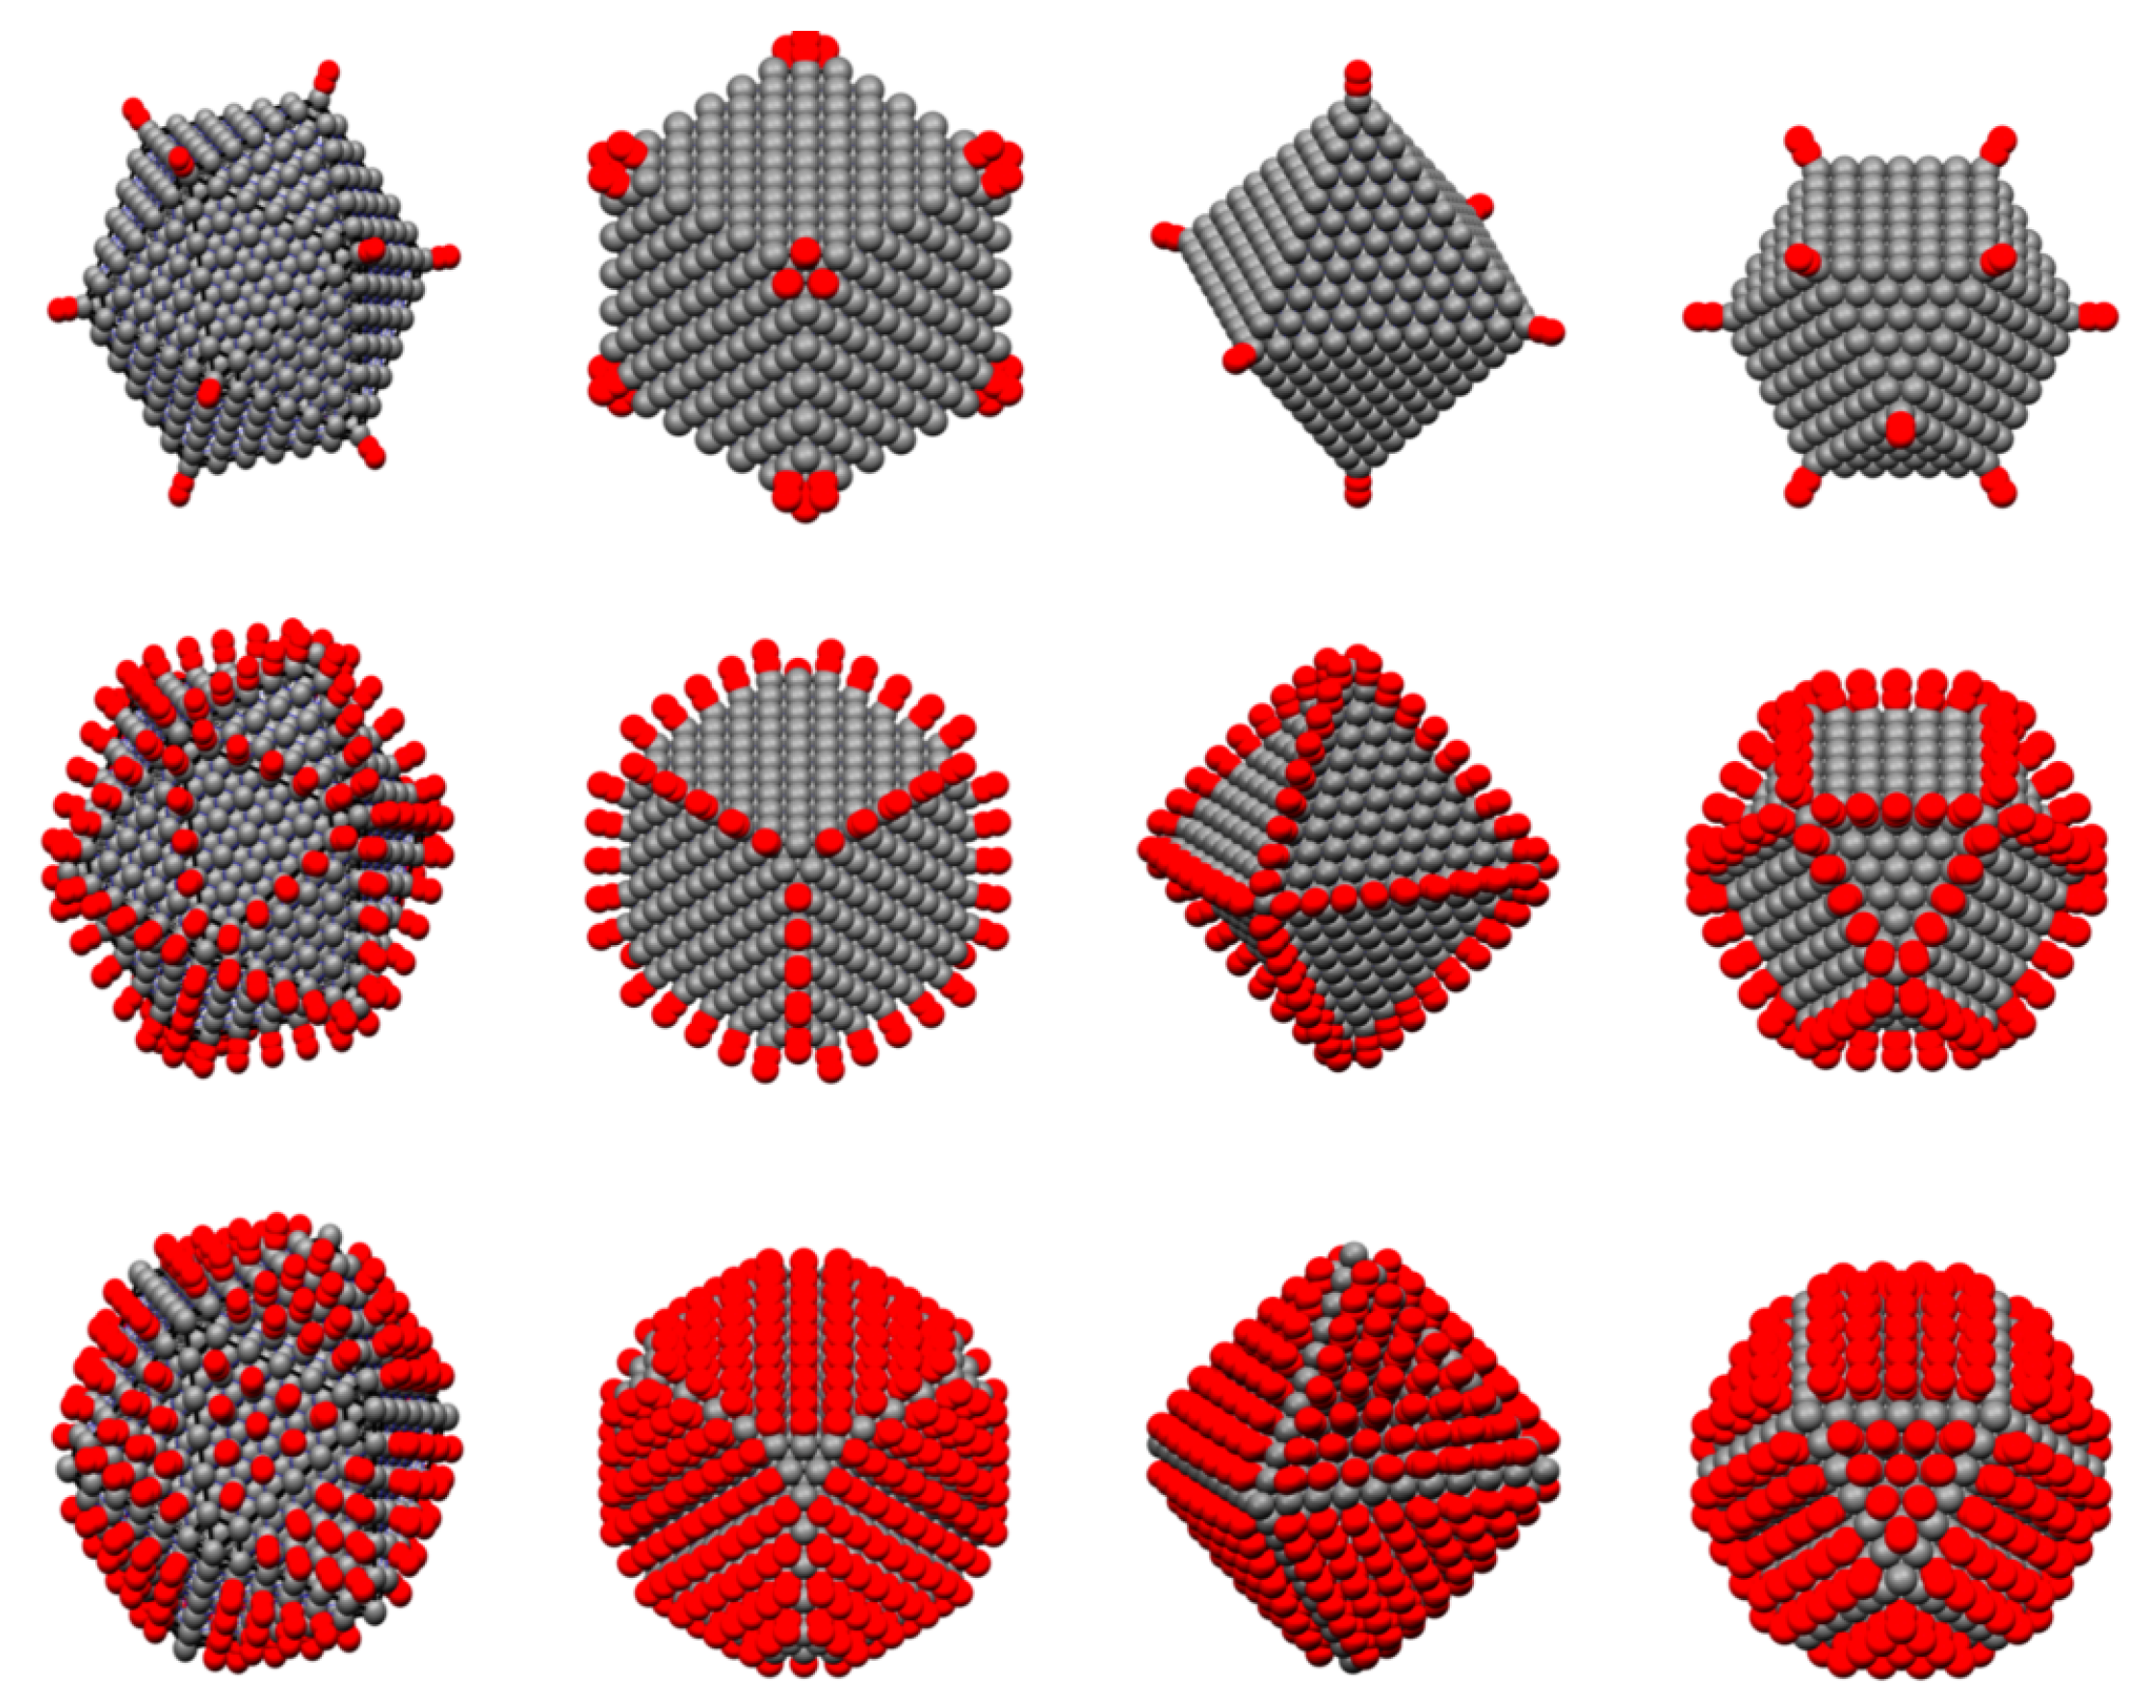
For modeling the platinum mass activity, we assume the O 2 and H* react in a Langmuir–Hinshelwood mechanism (see (19)), and separate the kink, edge, and facet bonding as shown in Figure 1, below. We use platinum polyhedra of icosahedra, truncated cubes, octahedra, and cuboctahedra in our modeling, see Figure 1.
The ORR follows a L–H mechanism as shown in (25):
1 . O 2 2 O ads 2 . H 2 2 H ads 3 . 2 H ads + O ads H 2 O 2 H 2 + O 2 2 H 2 O
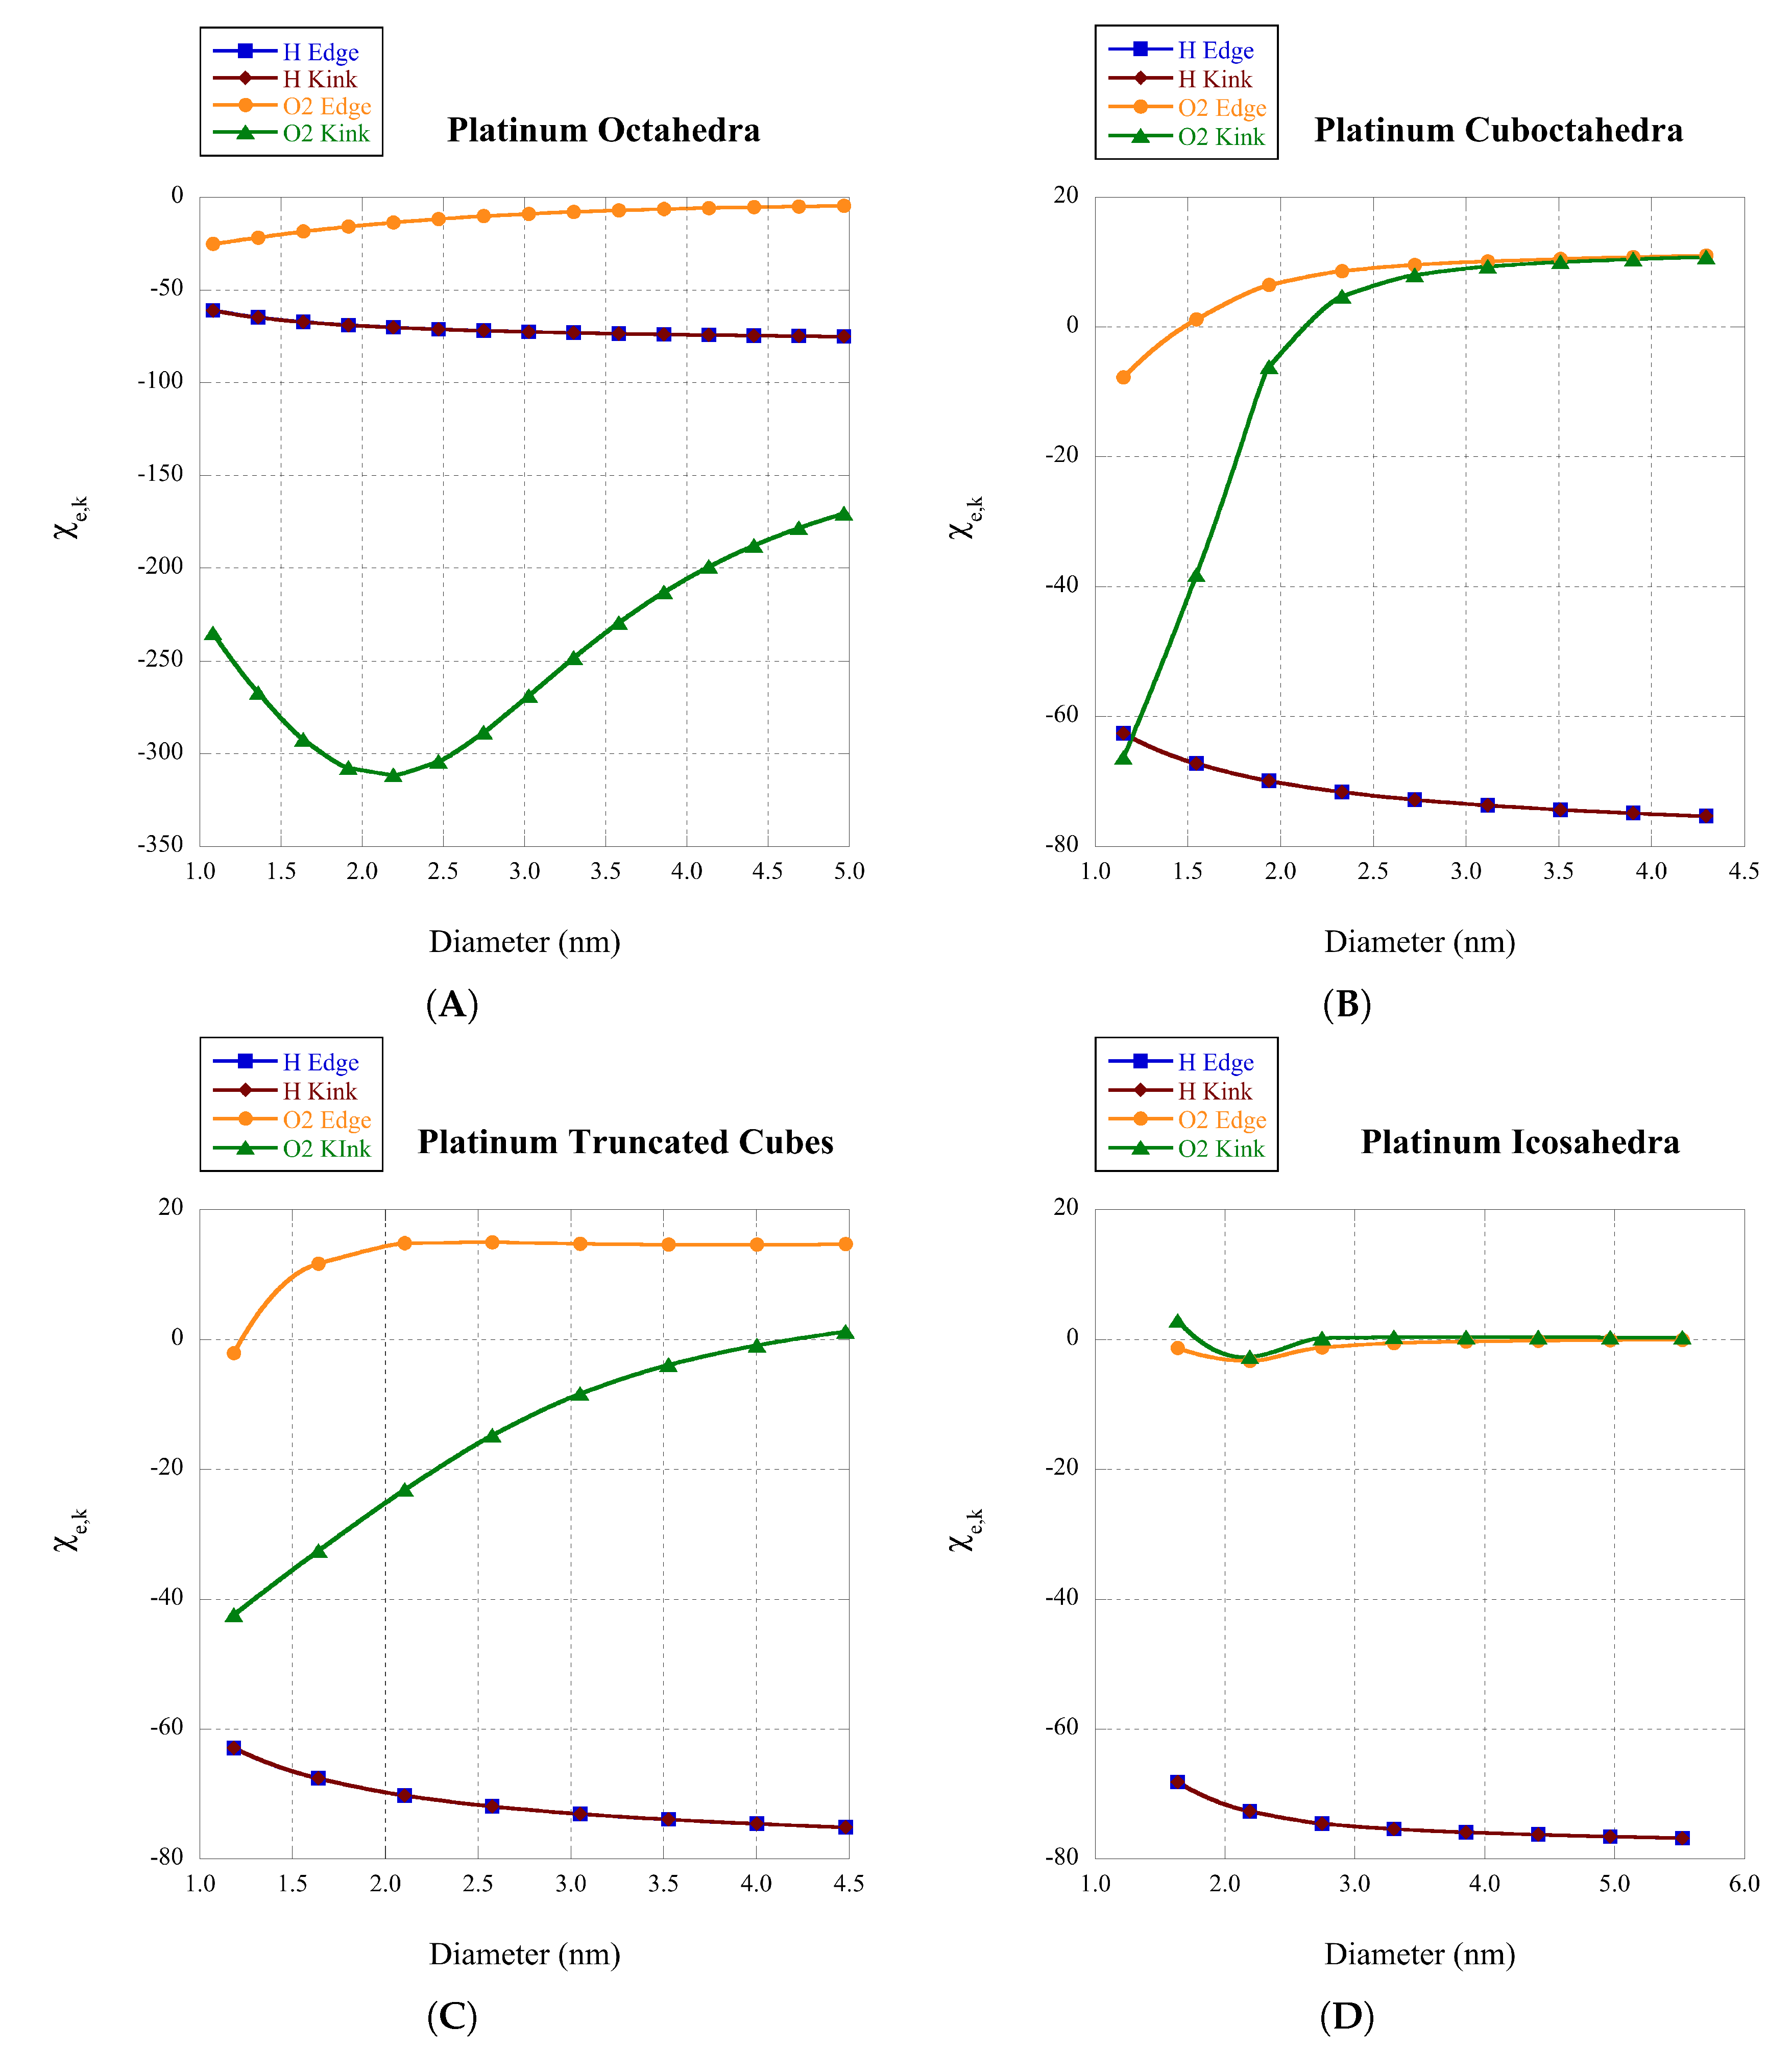
so that in the general scheme of Equation (19) above A is O 2 and B is H 2 . We also assume the Polanyi constants are equal. We calculate the corresponding χ e and χ k as used in the TOF from Equation (24), for the various polyhedra as shown in Figure 2 below.
The mass activity is basically the product of the dispersion and the TOF [31]
M A P t = F A W P t N S N T v ( D ) 10 3 ( A / mg Pt )
where F is the Faraday constant, 96,485 C/mol, and A W P t is the atomic weight of platinum, 195.08 g/mol. In principle, this gives an exact form of the mass activity, but the kinetic constants and corresponding concentrations are not completely known. We use α and the p i as modeling parameters and optimize the mass activity for the various clusters. We are not aware of previous modeling of the mass activity using the TOF, or Equation (26).
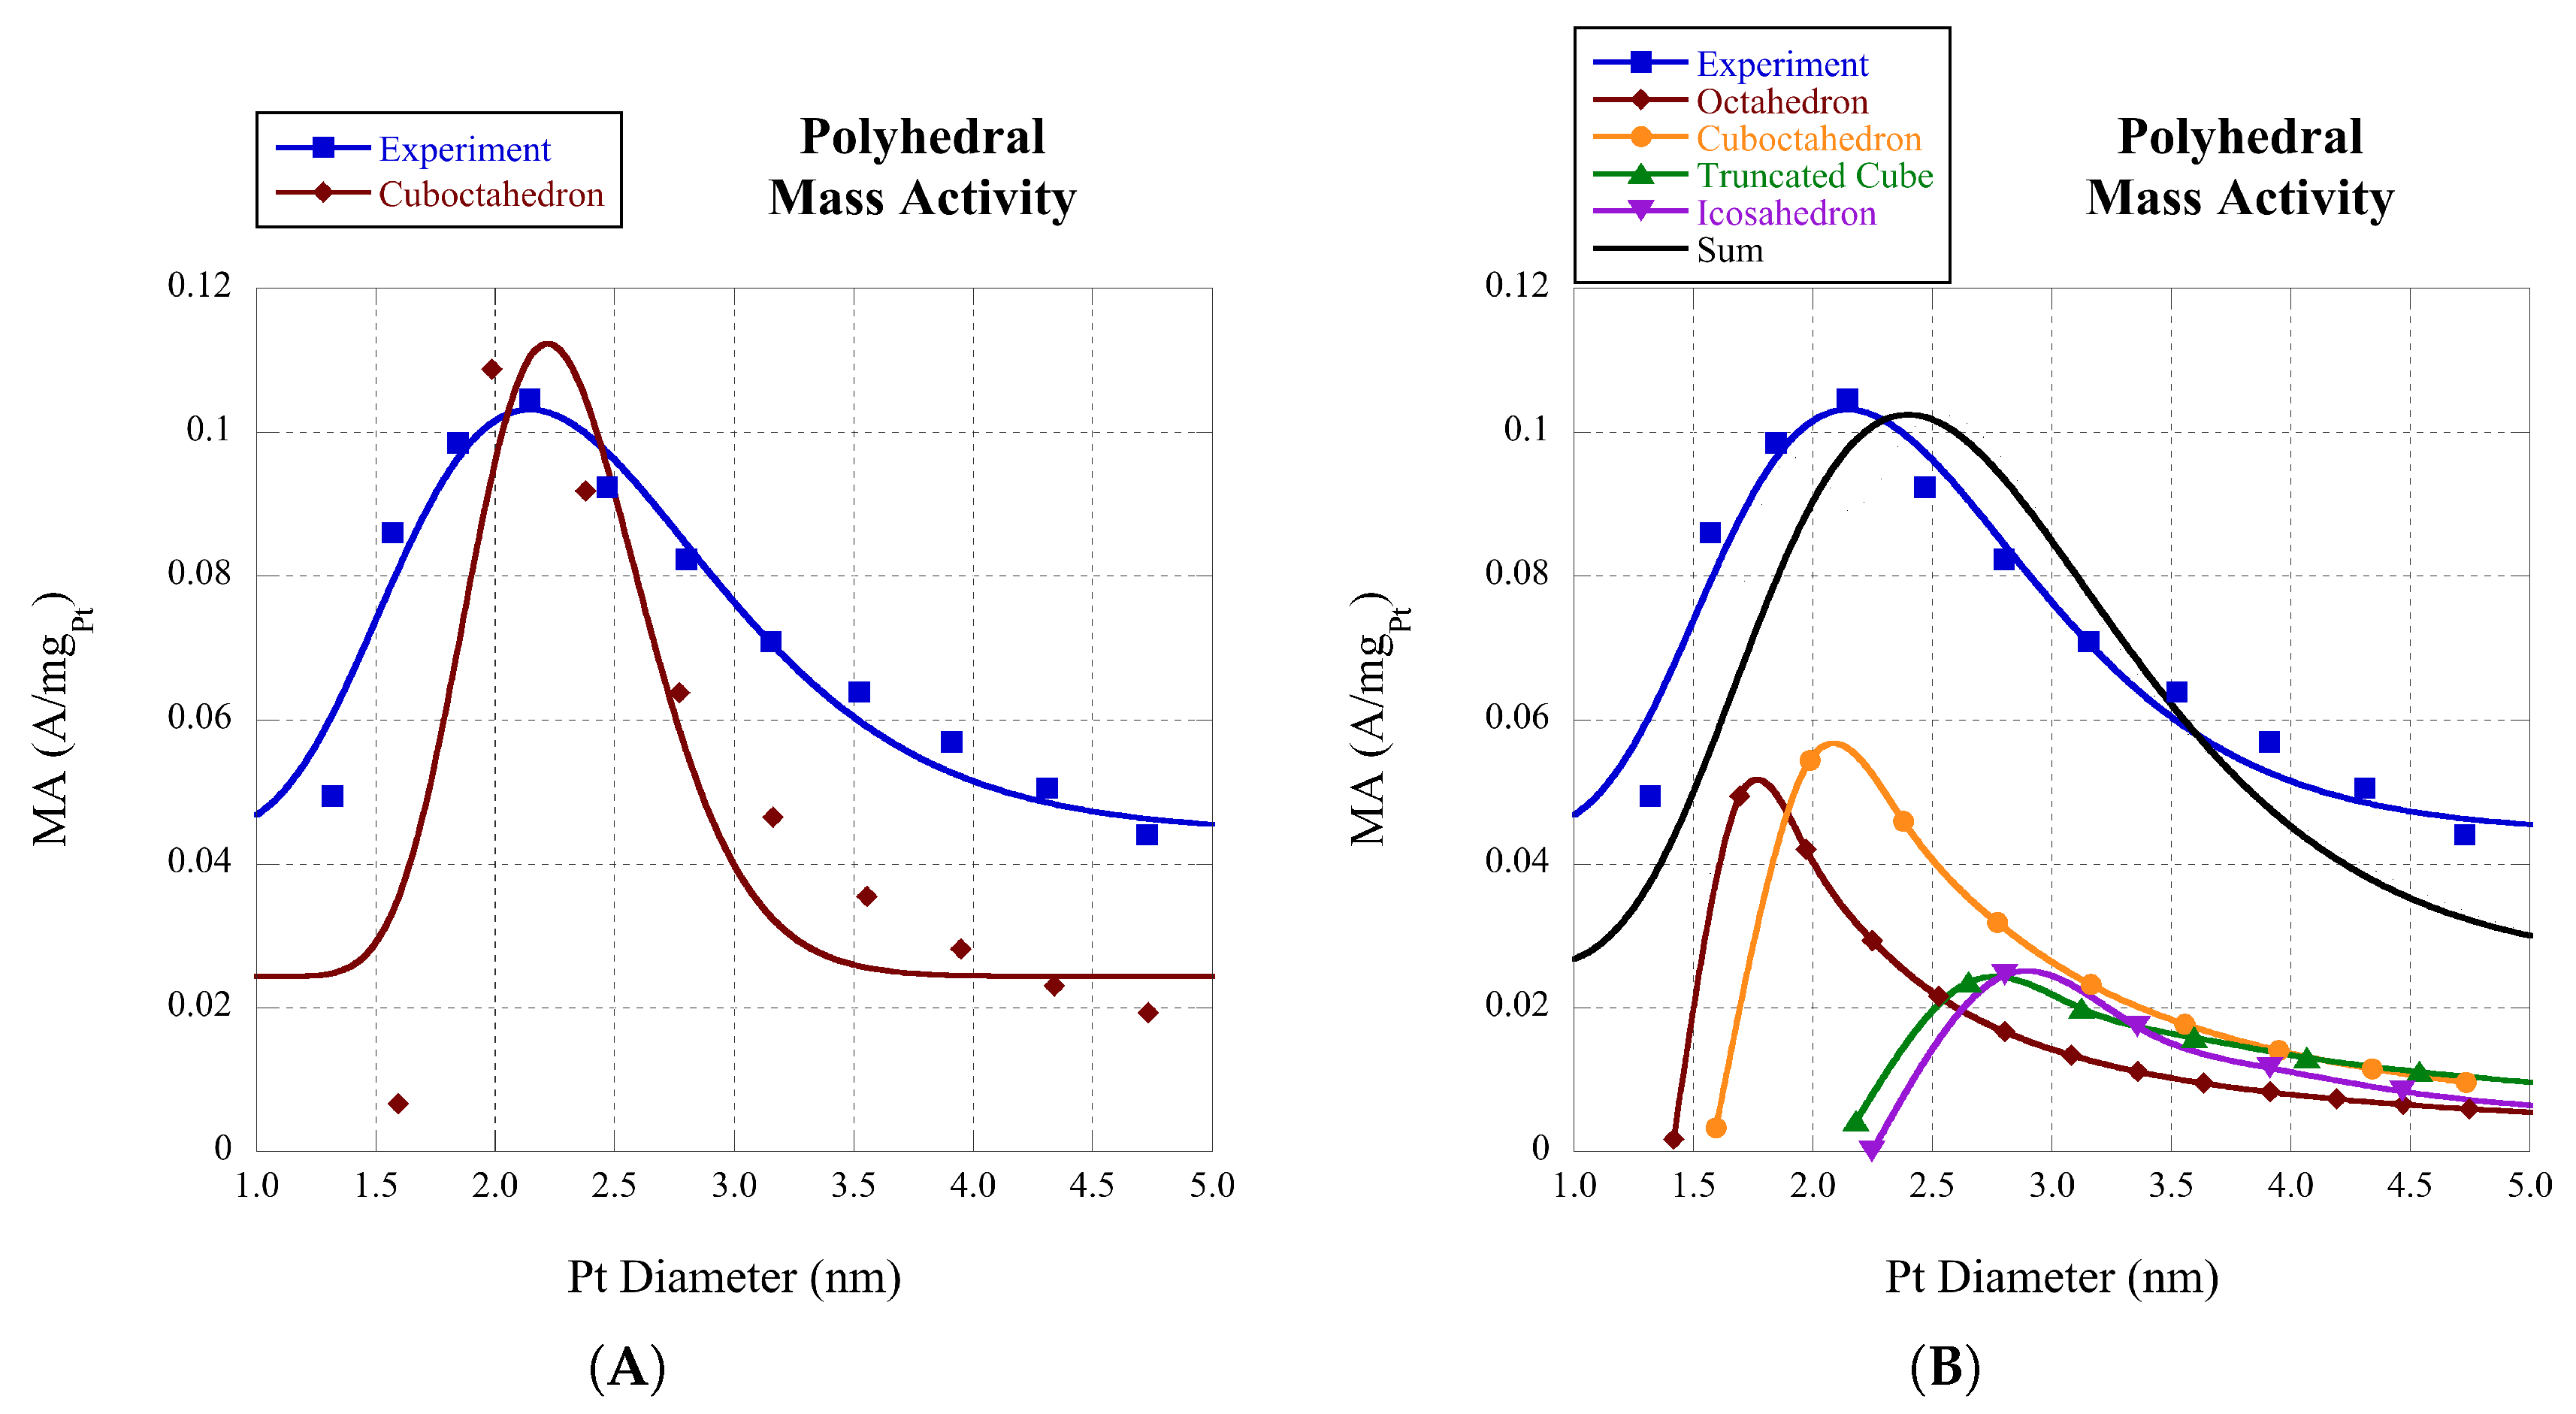
In the original paper on the experimental data of the mass activity for platinum clusters, it was assumed that the nanoclusters had cuboctahedral shape [4]. In Figure 3A, we plot the mass activity versus D for cuboctahedra. The modeled tail of the distribution decays more rapidly than the experimental data. This tells us that the cuboctahedral modeling has a narrower distribution than that observed experimentally. However, if we presume that the experimental mass activity is composed of multiple components from several polyhedra and that the sum from the convolution of the component polyhedra results in an approximation of the experimental curve, we get Figure 3B. Here, we model the data with a lognormal distribution with parameters as tabulated in Table 5, while the polyhedra are approximated by cubic splines.
To account for several shapes with independent distributions, we sum over the morphology
v ( D ) = i ρ i · v i ( D ) ,
where i is one of the four shapes; octahedra, cuboctahedra, truncated cube, or icosahedra. The shape parameters for the platinum TOF are shown in Table 6.
If the assumption that the experimental platinum mass activity comes from cuboctahedra is valid, then the calculated curve in Figure 3A is what we find using these procedures. However, if we assume all the polyhedra contribute to the convolution of the experimental curve, good agreement is found for the platinum mass activity for the four polyhedra considered, Figure 3B. The L–H mechanism represents the TOF for platinum nanoclusters fairly well.
Alternatively, the mass activity may be calculated using a kinetic model [7] as
M A P t = j s · A s p , j s = f j f · exp ( Δ G f a / ( k B T ) ) , A s p = A s / m p = A s · N A A W P t · N T ,
where j f is 96 and 83 mA/cm 2 for (111) and (100) surfaces, respectively, N A is the Avogadro number, A s is shown in Table 7, and Δ G f a = 0.10 eV or 0.12 eV , for (111) or (100) surfaces, respectively, is the DFT calculated free energy barrier for ORR at 0.9 V.
The specific activity (SA) of single crystal surfaces is known [5], however modeling the SA based on specific surface orientations and the surface dispersion is problematic as assumptions need to be made with respect to the non-contribution of edge and kink sites. In general, the SA follows a trend of facet dispersion [4]. The specific activity is defined as follows,
S A = o { f , e , k } f o · SA Pt ( hkl ) ( mA / cm Pt 2 )
where SA Pt ( hkl ) comes from single crystal surfaces and f o from Table 1. If one assumes that the edge and kink sites make a negligible contribution, then the SA follows the facet trend.
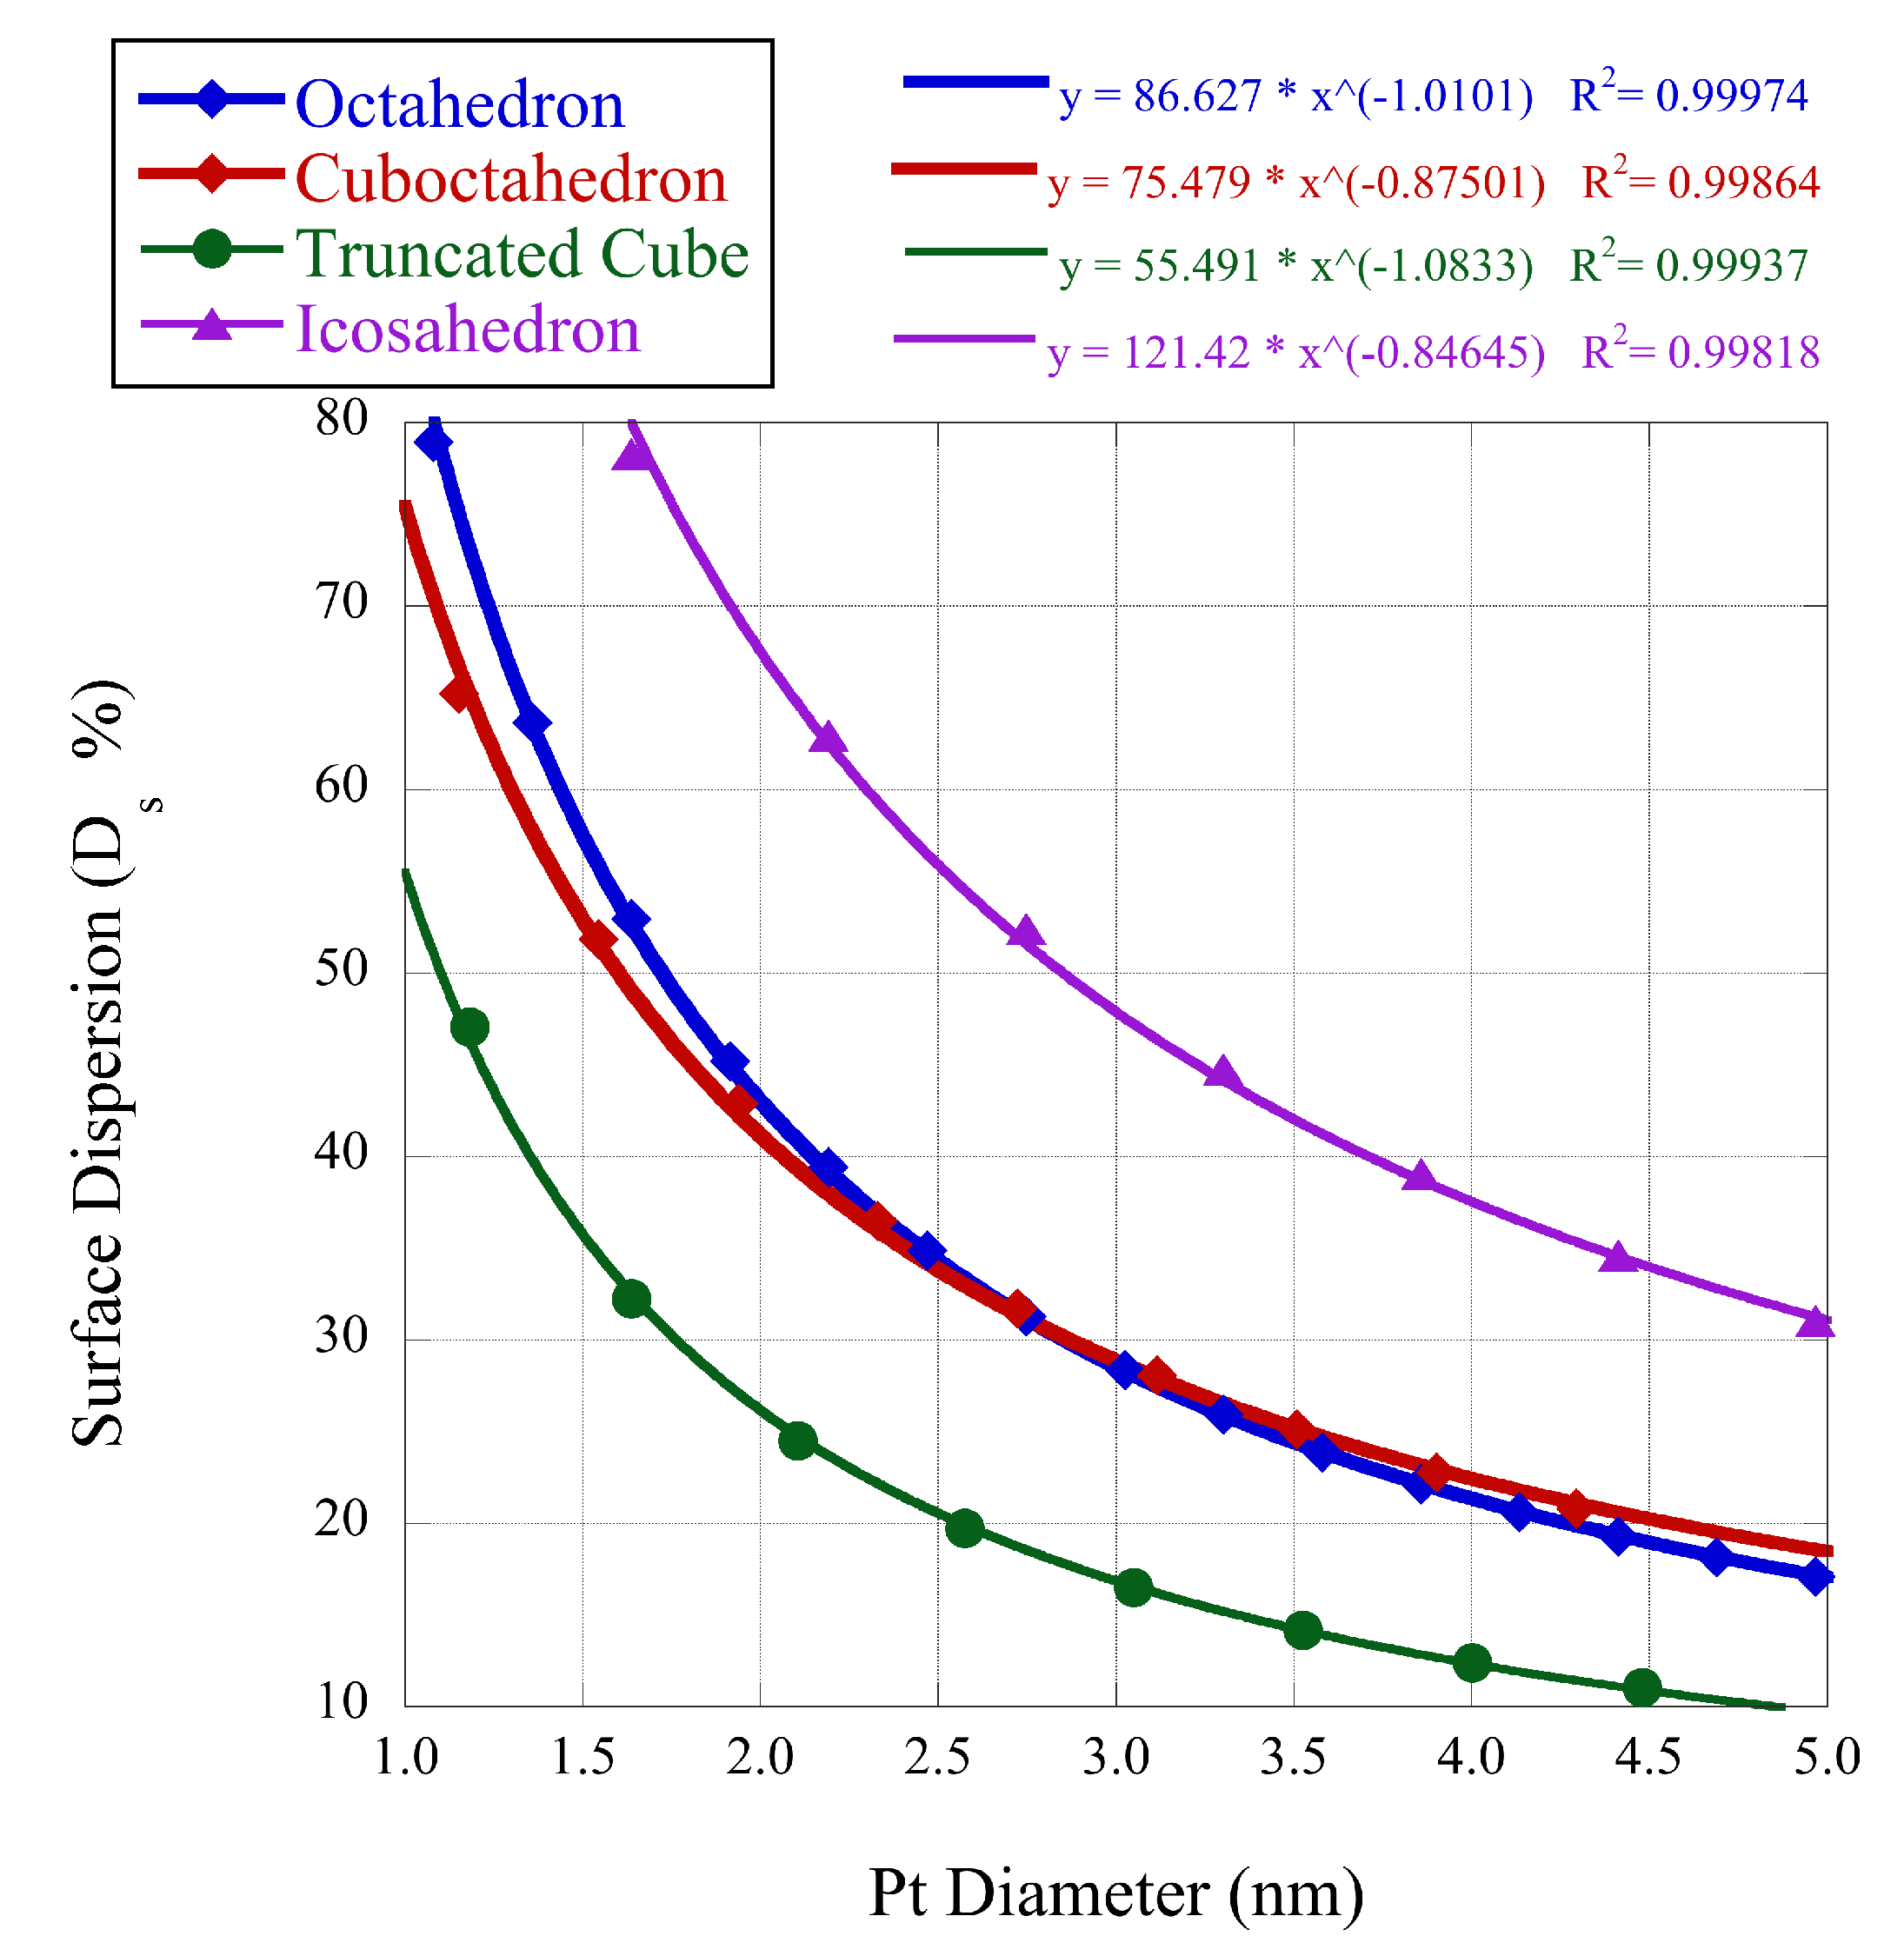
In Figure 4 below, we plot the surface dispersion D s = ( N e + N k ) / N S · 100 % for the four shapes from the equations in Table 1. As can be seen from the data, the surface dispersion is similar for the octahedron and cuboctahedron, and somewhat less for the truncated cube. The icosahedron has a somewhat larger surface dispersion due to the 30 n factor in the edge sites from Table 1. On the other hand, octahedra have kink sites with coordination c n = 4 , which is smaller than the other polyhedra.

4. Conclusions

This work represents the computational modeling of the mass activity for the platinum ORR based on a summed contribution of polyhedral distributions. The summed lognormal modeling represents the data reasonably well. These results confirm that coordination, shape, and Δ G have dramatic influence on the catalysis of reactions. The data is made quantitative through modeling with a lognormal distribution. We provided guidance on accounting for different distributions of the TOF based on morphology. We hope these results encourage further experimental work and theoretical modeling. In particular, the Polanyi parameter, the kinetic constants, and the partial pressures or concentrations are not known, and these results could in principle lead to a catalytic derivation from fundamental data.

Author Contributions

Conceptualization, F.H.K.; methodology, F.H.K.; software, A.B.; data curation, F.H.K.; writing—original draft preparation, F.H.K.; writing—review and editing, F.H.K. and A.B. All computational modeling uses original code developed by the authors compatible with MATLAB 2020a. Interested readers may contact the corresponding author for details. All authors have read and agreed to the published version of the manuscript.

Funding

This research did not receive any specific grant from funding agencies in the public, commercial, or not-for-profit sectors.

Conflicts of Interest

Both authors, F.H. Kaatz and A. Bultheel, declare no conflicts of interest, financial or otherwise.

References

  1. Boudart, M. Catalysis by supported metals. Adv. Catal. 1969, 20, 153–166. [Google Scholar]
  2. Falicov, L.; Somorjai, G. Correlation between catalytic activity and bonding and coordination number of atoms and molecules on transition metal surfaces: Theory and experimental evidence. Proc. Natl. Acad. Sci. USA 1985, 82, 2207–2211. [Google Scholar] [CrossRef] [Green Version]
  3. Kang, Y.; Pyo, J.B.; Ye, X.; Diaz, R.E.; Gordon, T.R.; Stach, E.A.; Murray, C.B. Shape- controlled synthesis of Pt nanocrystals: The role of metal carbonyls. ACS Nano 2013, 7, 645–653. [Google Scholar] [CrossRef]
  4. Shao, M.; Peles, A.; Shoemaker, K. Electrocatalysis on Platinum Nanoparticles: Particle Size Effect on Oxygen Reduction Reaction Activity. Nano Lett. 2011, 11, 3714–3719. [Google Scholar] [CrossRef]
  5. Nesselberger, M.; Ashton, S.; Meier, J.; Katsounaros, I.; Mayrhofer, K.; Arenz, M. The Particle Size Effect on the Oxygen Reduction Reaction Activity of Pt Catalysts: Influence of Electrolyte and Relation to Single Crystal Models. Am. Chem. Soc. 2011, 133, 17428–17433. [Google Scholar] [CrossRef]
  6. Tritsaris, G.; Greeley, J.; Rossmeisl, J.; Nørskov, J.K. Atomic-Scale Modeling of Particle Size Effects for the Oxygen Reduction Reaction on Pt. Catal. Lett. 2011, 141, 909–913. [Google Scholar] [CrossRef]
  7. Tripkovic, V.; Cerri, I.; Bligaard, T.; Rossmeisl, J. The Influence of Particle Shape and Size on the Activity of Platinum Nanoparticles for Oxygen Reduction Reaction: A Density Functional Theory Study. Catal. Lett. 2014, 144, 380–388. [Google Scholar] [CrossRef]
  8. Rück, M.; Bandarenka, A.; Calle-Vallejo, F.; Gagliardi, A. Oxygen Reduction Reaction: Rapid Prediction of Mass Activity of Nanostructured Platinum Electrocatalysts. Phys. Chem. Lett. 2018, 9, 4463–4468. [Google Scholar] [CrossRef] [Green Version]
  9. Jorgensen, M.; Gronbeck, H. Scaling Relations and Kinetic Monte Carlo Simulations To Bridge the Materials Gap in Heterogeneous Catalysis. ACS Catal. 2017, 7, 5054–5061. [Google Scholar] [CrossRef]
  10. Kaatz, F.; Bultheel, A. Catalytic Thermodynamic Model for Nanocluster Adsorbates. Catal. Today, 2019; in press. [Google Scholar] [CrossRef]
  11. Kaatz, F.; Bultheel, A. Magic Mathematical Relationships for Nanoclusters. Nanoscale Res. Lett. 2019, 14, 150, Erratum in 2019, 14, 295. [Google Scholar] [CrossRef]
  12. Kleis, J.; Greeley, J.; Romero, N.; Morozov, V.; Falsig, H.; Larsen, A.; Lu, J.; Mortensen, J.; Dułak, M.; Thygesen, K.; et al. Finite Size Effects in Chemical Bonding: From Small Clusters to Solids. Catal. Lett. 2011, 141, 1067–1071. [Google Scholar] [CrossRef]
  13. Li, L.; Larsen, A.; Romero, N.; Morozov, V.; Glinsvad, C.; Abild-Pedersen, F.; Greeley, J.; Jacobsen, K.; Nørskov, J. Investigation of Catalytic Finite-Size-Effects of Platinum Clusters. Phys. Chem. Lett. 2012, 4, 222–226. [Google Scholar] [CrossRef]
  14. Hoover, W.; Hindmarsh, A.; Holian, B. Number Dependence of Small-Crystal Thermodynamic Properties 1. J. Chem. Phys. 1972, 57, 1980–1985. [Google Scholar] [CrossRef]
  15. Wautelet, M.; Shirinyan, A. Thermodynamics: Nano vs. macro. Pure Appl. Chem. 2009, 81, 1921–1930. [Google Scholar] [CrossRef]
  16. Joshi, A.; Tucker, M.; Delgass, W.; Thomson, K. CO adsorption on pure and binary-alloy gold clusters: A quantum chemical study. J. Chem. Phys. 2006, 195, 194707. [Google Scholar] [CrossRef]
  17. Fernandez, E.; Balbas, L. Multiple adsorption of molecular oxygen on small Au/Pd cationic clusters at finite temperature. A van der Waals density functional study. J. Chem. Phys. 2016, 144, 244308. [Google Scholar] [CrossRef]
  18. Murzin, D. Kinetic analysis of cluster size dependent activity and selectivity. J. Catal. 2010, 276, 85–91. [Google Scholar] [CrossRef]
  19. Bligaard, T.; Nørskov, J.; Dahl, S.; Matthiesen, J.; Christensen, C.; Sehested, J. The Brønsted–Evans–Polanyi relation and the volcano curve in heterogeneous catalysis. J. Catal. 2004, 224, 206–217. [Google Scholar] [CrossRef]
  20. Brønsted, J. Acid and Basic Catalysis. Chem. Rev. 1928, 5, 231–338. [Google Scholar] [CrossRef]
  21. Methfessel, M.; Hennig, D.; Scheffler, M. Calculated surface energies of the 4D transition-metals—A study of bond-cutting models. Appl. Phys. A. 1992, 55, 442–448. [Google Scholar] [CrossRef]
  22. Sun, C. Size dependence of nanostructures: Impact of bond order deficiency. Prog. Solid State Chem. 2007, 35, 1–159. [Google Scholar] [CrossRef]
  23. Calle-Vallejo, F.; Martinez, J.; Garcia-Lastra, J.; Sautet, P.; Loffreda, D. Fast prediction of adsorption properties for platinum nanocatalysts with generalized coordination numbers. Chem. Int. Ed. 2014, 53, 8316–8319. [Google Scholar] [CrossRef]
  24. Calle-Vallejo, F.; Tymoczko, J.; Colic, V.; Vu, Q.H.; Pohl, M.D.; Morgenstern, K.; Loffreda, D.; Sautet, P.; Schuhmann, W.; Bandarenka, A.S. Finding optimal surface sites on heterogeneous catalysts by counting nearest neighbors. Science 2015, 350, 185–189. [Google Scholar] [CrossRef]
  25. Pohl, M.; Watzele, S.; Calle-Vallejo, F.; Bandarenka, A. Nature of Highly Active Electrocatalytic Sites for the Hydrogen Evolution Reaction at Pt Electrodes in Acidic Media. ACS Omega 2017, 2, 8141–8147. [Google Scholar] [CrossRef]
  26. Jaynes, E. Information Theory and Statistical Mechanics. Phys. Rev. 1957, 106, 620–630. [Google Scholar] [CrossRef]
  27. Estrada, E.; Hatano, N. Statistical-mechanical approach to subgraph centrality in complex networks. Chem. Phys. Lett. 2007, 439, 247–251. [Google Scholar] [CrossRef]
  28. Strizhak, P. Nanosize effects in heterogeneous catalysis. Exp. Chem. 2013, 49, 2–21. [Google Scholar] [CrossRef]
  29. Murzin, D. Cluster size dependent kinetics: Analysis of different reaction mechanisms. Catal. Lett. 2015, 145, 1948–1954. [Google Scholar] [CrossRef]
  30. Murzin, D. Size-dependent heterogeneous catalytic kinetics. Mol. Catal. A Chem. 2010, 315, 226–230. [Google Scholar] [CrossRef]
  31. Gasteiger, H.; Markovic, N. Just a dream-or future reality? Science 2009, 324, 48–49. [Google Scholar] [CrossRef]
Figure 1. Kink (row 1), edge (row 2), and facet (row 3) bonding of O 2 to platinum clusters.
Catalysts 10 01010 g001
Figure 2. Plots of χ e and χ k versus D for the four polyhedra. In all four plots, the data for H-Edge and H-Kink overlap on the scale presented. (A) octahedra; (B) cuboctahedra; (C) truncated cubes; (D) icosahedra.
Catalysts 10 01010 g002
Figure 3. (A) Mass activity for cuboctahedra. (B) Mass activity versus D for adsorption on platinum polyhedra.
Catalysts 10 01010 g003
Figure 4. Surface dispersion for the four platinum shapes under consideration.
Catalysts 10 01010 g004
Table 1. Formulas for nanocluster shapes [11]. The variable n refers to the number of shells in the cluster, c n to standard coordination number, fcc to face centered cubic, N S the number of surface atoms, and N T the total number of atoms.
cnfcc Truncated Cubecnfcc Octahedron
5 12 n 12 46
7247 12 n 12
8 12 n 2 12 n 18 8 4 n 2 12 n + 8
N S 12 n 2 6 N S 4 n 2 + 2
N T 4 n 3 + 3 n 2 + 3 n 7 N T 2 3 n 3 + 2 n 2 + 7 3 n + 1
cnIcosahedroncnfcc Cuboctahedron
612512
8 30 n 30 7 24 n 24
9 10 n 2 30 n + 20 8,9 6 n 2 12 n + 6 , 4 n 2 12 n + 8
N S 10 n 2 + 2 N S 10 n 2 + 2
N T 10 3 n 3 5 n 2 + 11 3 n 1 N T 10 3 n 3 5 n 2 + 11 3 n 1
Table 2. Bond strength parameters for platinum, where R 2 is the least squares regression.
Element E 0 AB R 2
Pt0.01.78980.05010.987
Table 3. Linear constants for D ( n ) .
abNanocluster
1.7220.2944Pt Truncated Cube
1.4140.0239Pt Cuboctahedron
1.00.0282Pt Octahedron
2.00.0273Pt Icosahedron
Table 4. Linear fit of E a d for adsorption.
SpeciesCN0 (eV) Slope m of Ead vs. CNi
Pt-O2 [23]−2.4180.227
Pt-H* [25]−0.34050.0562
Table 5. Mean, μ ¯ , and standard deviation, σ ¯ , for the platinum oxygen reduction reaction (ORR) mass activity for Figure 3, using a lognormal distribution.
Structure μ ¯ σ ¯
Exp Fit2.460.77
Cuboctahedron Figure 3A2.310.38
Sum Figure 3B2.770.88
Table 6. Shape parameters for the platinum turnover frequency (TOF) via the Langmuir–Hinshelwood (L–H) mechanism.
Structure α p 1 p 2 p 3
Octahedron0.05 1.0 × 10 10 1.0 × 10 13 1.0 × 10 13
Truncated Cube0.05 5.0 × 10 2 5.0 × 10 7 5.0 × 10 7
Icosahedron0.05 1.0 × 10 2 1.0 × 10 18 1.0 × 10 18
Cuboctahedron Figure 3A0.05 5.0 × 10 2 1.0 × 10 10 1.0 × 10 10
Cuboctahedron Figure 3B0.05 2.5 × 10 2 1.0 × 10 10 1.0 × 10 10
Table 7. Surface area A s for the polyhedra, where r B is the bond length for platinum.
Structure A s
Octahedron 2 3 · ( n · r B ) 2
Truncated Cube 12 ( n · r B ) 2
Icosahedron 5 3 ( n · r B ) 2
Cuboctahedron ( 6 + 2 3 ) · ( n · r B ) 2