Article

Bimetallic Pt-Co Catalysts for the Liquid-Phase WGS

by
Alberto José Reynoso
1,
Jose Luis Ayastuy
1,*,
Unai Iriarte-Velasco
2 and
Miguel Ángel Gutiérrez-Ortiz
1
1
Department of Chemical Engineering, Faculty of Science and Technology, University of the Basque Country UPV/EHU, Sarriena S/N, 48940 Leioa, Spain
2
Department of Chemical Engineering, Faculty of Pharmacy, University of the Basque Country UPV/EHU, Paseo de la Universidad, 7, 01006 Vitoria, Spain
*
Author to whom correspondence should be addressed.
Catalysts 2020, 10(8), 830; https://doi.org/10.3390/catal10080830
Submission received: 30 June 2020 / Revised: 17 July 2020 / Accepted: 22 July 2020 / Published: 24 July 2020
(This article belongs to the Special Issue Catalysts for Water-Gas Shift Reaction)

Abstract

:
Bimetallic Pt-Co catalysts derived from cobalt aluminate spinel were investigated in the liquid-phase water–gas shift (WGS) reaction and CO hydrogenation. Liquid-phase WGS is a key reaction in the aqueous-phase reforming (APR) of polyols; thus, WGS activity is essential to formulate good APR catalysts. In this work, catalysts with different Pt/Co molar ratios were synthesized together with a reference Pt/alumina. All the synthesized catalysts were characterized by various techniques in order to gain knowledge on their structural and surface characteristics. WGS activity was tested with a feedstream of CO/H2O = 1/15 (space-time of 76.8 kgcat·s/molCO), isothermal operation at 260 °C and 50 bar, for 10 TOS. Bimetallic Pt-Co catalysts showed improved activity in liquid-phase WGS in comparison to bare Co or Pt catalysts, which was ascribed to the synergistic effect. Despite being subjected to an increased hydrogen concentration in the feedstream (H2/CO between 0 and 12/3), these catalysts maintained a preferential selectivity towards WGS activity. In addition, the effect of temperature (220–260 °C) and pressure (25–50 bar) was investigated over a catalyst with 0.3Pt/CoAl. CO conversion and CO2 yield were more sensitive to temperature, while a higher pressure favored methane production. The measured activation energy in the 220–260 °C temperature range was 51.5 kJ/mol.

1. Introduction

The water–gas shift (WGS) reaction, first observed by Felice Fontana in 1780 [1], is related to the production of hydrogen and carbon dioxide from a mixture of carbon monoxide and steam. WGS is a key element in mature technologies devoted to hydrogen production by the steam reforming of natural gas in industrial applications such as ammonia synthesis or synthesis gas plants. In recent decades, due to the growing concerns about environmental issues and the challenge of implementing the hydrogen economy, research on new catalysts for the WGS reaction has been notably boosted [2]. This renewed interest in WGS has been motivated by the search for renewable feedstocks as alternatives to fossil fuels, which are to blame for environmental problems such as global warming. Gas-phase WGS is a well-studied, reversible and exothermic reaction that can be catalyzed by a wide range of metals and metal oxides, such as Fe, Cu, Cr, Au, Pt and Co [3]. To overcome the equilibrium limitations, industrially, WGS is carried out in two consecutive stages, with intermediate cooling. Otherwise, a sorption-enhanced WGS reaction can be used to intensify the process by the in-situ removal of CO2 to shift the equilibrium towards hydrogen production [4]. Homogeneous WGS is carried out using different transition metal complexes (Rh, Ru), even under mild conditions, which are usually doped with organic bases to increase the turnover rate [5,6]. Supported ionic liquids (SILP), prepared via the immobilization of ionic liquids on the solid material, have also been used for WGS [7]. In addition, hydrogen can be produced through the use of organisms that use the biological WGS reaction as a means of obtaining energy to maintain their metabolic processes and grow [8].
The WGS reaction plays an essential role in the aqueous-phase reforming (APR) reaction mechanism of oxygenated hydrocarbons (polyols). The APR process is carried out in the liquid phase at mild operation conditions (200–260 °C and sufficient pressure to assure liquid phase) [9]. For hydrogen production, APR is more advantageous than vapor-phase reforming because it eliminates the need to vaporize water with the consequent energy saving, extends the feedstock choices to non-volatile oxygenates and minimizes the undesirable parallel reactions, as is the case when carried out at lower temperatures.
The C–C cleavage of the polyol gives CO as a primary product of the aforementioned APR reaction (Equation (1)), which should be removed from the catalyst surface in order to keep it available for further polyol conversion. The CO is then removed from the reaction mixture by the WGS reaction (Equation (2)), which generates additional H2 [10]. In this way, the WGS reaction becomes a key step in the APR to obtain hydrogen from polyols, with minor production of alkanes (mainly methane) and high selectivity to hydrogen. For the APR of polyols with chemical formulae CnH2n+2On, the sugar alcohol reforming (Equation (1)) and the WGS (Equation (2)) reactions are coupled, to give the global APR reaction (Equation (3)):
C n H 2 n + 2 O n nCO + ( n + 1 ) H 2
nCO + nH 2 O nCO 2 + nH 2
C n H 2 n + 2 O n + nH 2 O nCO 2 + ( 2 n + 1 ) H 2
Virtually all the studies carried out to correlate WGS activity with the APR process are performed considering that the WGS reaction occurs under the same thermodynamic and kinetic conditions as those studied in the gas phase [11,12,13]. Nonetheless, Ripken et al. modeled the WGS reaction in the liquid phase and concluded that the phase state of water as a reactant influenced the mechanism of the WGS reaction. In addition, they concluded that the reaction was slightly endothermic in the liquid phase (∆H = +2.88 kJ/mol), in contrast to the exothermic nature (∆H = −41.1 kJ/mol) in the gas-phase reaction [14]. Even so, there are few investigations focused on the liquid-phase WGS reaction [15].
On the basis of APR conditions, alkane formation, mainly methane, by carbon hydrogenation is highly favorable [10]. Both CO and CO2 methanation (Equations (4) and (5)) are hydrogen-consuming reactions; therefore, these are undesirable in the APR reforming of biomass-derived compounds targeting efficient hydrogen production. In like manner, the number of works focused on the production of methane through the hydrogenation of CO at hydrothermal conditions is small.
The overall methanation process can be represented by the following reactions:
CO + 3 H 2 CH 4 + H 2 O
CO 2 + 4 H 2 CH 4 + 2 H 2 O
Recently, significant progress has been achieved with CoAl-based catalysts for glycerol APR [16]. Noble metals were shown to be very active in the APR of oxygenated organic compounds [17,18] and the WGS reaction [19], and, linked to the promotional effect of bimetallic catalysts, this makes the Pt-Co alloy an ideal catalyst to be studied in this type of process [20,21,22]. Even though cobalt has been reported to be active in methanation reactions [23], according to our current knowledge, the scope of these side reactions over cobalt-based catalysts under APR conditions has not been established yet. In the APR of polyols, methane can be formed by either hydrogenation of CO or by via C–C cleavage and subsequent hydrogenation. Therefore, it would be of great interest to elucidate whether the hydrogenation of CO could proceed to a large extent as it would affect the APR selectivity to hydrogen. In view of all this, we studied the WGS reaction under similar operation conditions to those previously used to investigate APR on bimetallic Pt-Co catalysts derived from cobalt aluminate precursor [24]. With this purpose in mind, different amounts of platinum were impregnated on cobalt aluminate (Co/Al = 0.625 mole ratio). The catalytic results in both processes were correlated with the intrinsic characteristics of the catalysts.

2. Results and Discussion

2.1. Catalyst Characterization

A summary of the measured physico-chemical properties of the catalysts is shown in Table 1. For all the samples, the actual platinum content and Co/Al atomic ratio were very close to the nominal value. Pt-containing samples presented a larger specific surface area (SBET) and pore volume (Vpore) than CoAl. The addition of Pt seemed to shift the pore size (dpore) of the xPt/CoAl samples towards higher values. After reduction, SBET of the resultant catalysts decreased while dpore increased, except for 0.3Pt/Al, which preserved its textural properties. Pore size distribution, calculated from the nitrogen adsorption–desorption isotherms (Figure S1, Supplementary Materials), revealed that both the calcined and reduced samples were mainly mesoporous materials.
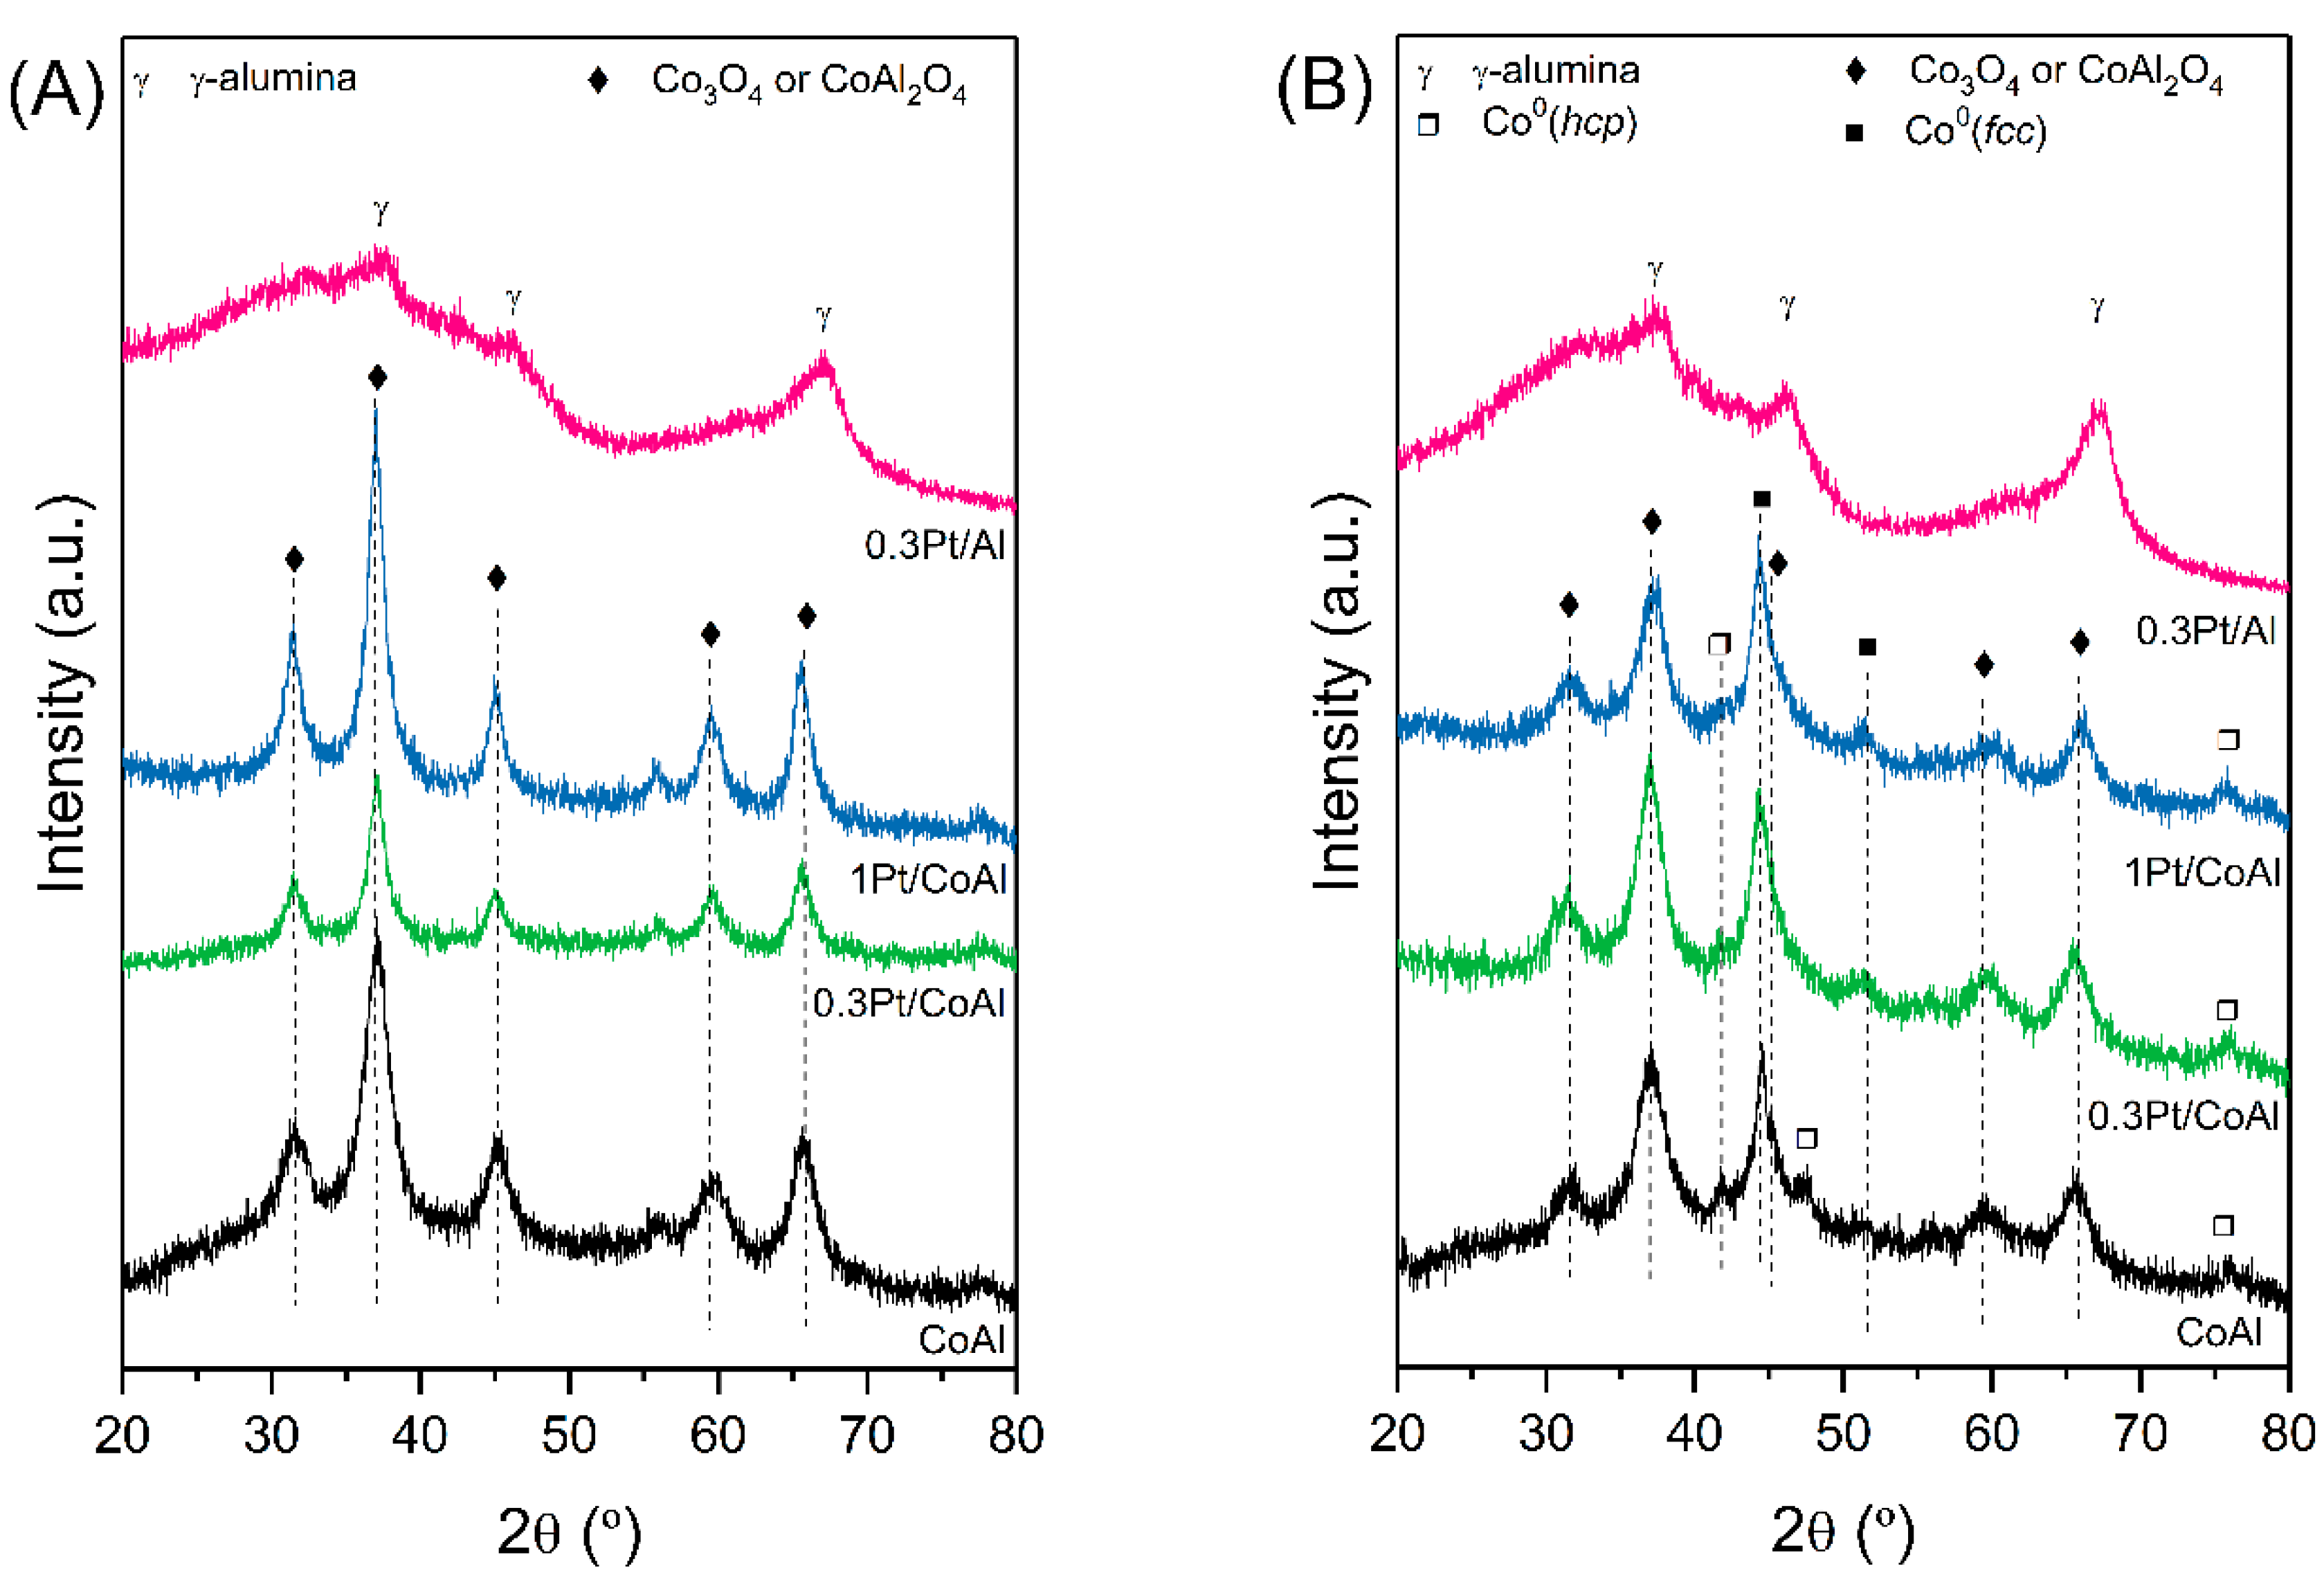
The phase composition and morphology of the samples was evaluated by XRD, and the obtained diffraction patterns are shown in Figure 1. Calcined CoAl and xPt/CoAl samples (Figure 1A) presented the characteristic diffraction peaks of cobalt aluminate (PDF 00-044-0160) and cobalt oxide (PDF 00-042-1467) spinels. Both species, with cubic crystal system and Fd3m space group, have almost the same diffraction angles and only could be distinguished by their different lattice parameters (smaller for Co3O4). The lattice parameter (a) of the calcined spinel phase was calculated from the Bragg equation, which holds for the fcc structure:
a = λ 2 sin θ h 2 + k 2 + l 2
The calculated parameter for the bare CoAl sample was 8.042 Å, which was lower than the lattice constant of standard stoichiometric CoAl2O4 (8.104 Å). This could be due to the non-stoichiometric composition of CoAl, caused by the higher Co/Al mole ratio (0.634) compared to the corresponding stoichiometric one. After the addition of Pt, the lattice parameter increased slightly, proportionally to platinum content, suggesting that Pt strongly interacted with the support. The average crystallite size of the spinel phase of the calcined samples was estimated by means of the Scherrer equation and indicated an increase of 26% with platinum addition. No characteristic peak of Pt species was observed, probably because of their high dispersion and low loadings. Catalyst 0.3Pt/Al showed characteristic peaks of γ-alumina, with a clear baseline elevation, indicative of its amorphous nature.
Regarding the reduced assays (Figure 1B), cobalt-containing catalysts showed diffraction peaks ascribed to metallic Co, prevailing in the fcc phase with respect to the hcp phase. In addition, the aforementioned cobalt spinel phase could be still identified. However, as for the calcined samples, no peak in metallic Pt was detected. After Pt loadings, metallic cobalt crystallite size decreased by half, suggesting that Pt acts as a structural promoter which decreases metallic Co particle size (Table 1).
H2-TPR experiments were carried out in order to gain information about reducible species. The H2-TPR profiles of all the prepared catalysts are displayed in Figure 2 (due to its low intensity, the signal from 0.3Pt/Al was five-fold magnified). The monometallic 0.3Pt/Al sample showed three reduction peaks, of low intensity. The two low temperature peaks were related to the reduction of platinum species (PtOx). The peak at 227 °C was attributed to the reduction of platinum species with low interaction with the alumina, and the one at 375 °C to platinum species in close interaction with the support. The high temperature peak, at around 660 °C, was due to the reduction of alumina, assisted by the hydrogen spillover on Pt0 [25]. For the CoAl sample, the reduction peaks at 292 and 413 °C came from the Co3+ → Co2+ reduction, the first of surface cobalt cations without interaction with the support and the latter from the Co3+ species in close interaction with the support. The peak at 594 °C was ascribed to Co2+ → Co0 reduction. Finally, the peak at 783 °C corresponded to the reduction of Co ions as cobalt aluminate (CoAl2O4) [16]. Regarding bimetallic xPt/CoAl samples, these presented four reduction peaks. The H2 uptake at low temperatures largely exceeded the theoretical hydrogen consumption of platinum species (Table 2). Based on this, the peaks centered at 192 °C (0.3Pt/CoAl) and 157 °C (1Pt/CoAl) were ascribed to the reduction of PtOx species alongside that of platinum-promoted (via hydrogen spillover) Co3+ → Co2+ reduction. As can be seen, the addition of Pt caused two different behaviors depending on its loading. On one hand, at the lowest loading (0.3 wt.%), the presence of Pt decreased the Co2+ → Co0 reduction temperature from 594 to 563 °C and that of cobalt ions in the spinel phase from 783 to 736 °C. Nevertheless, by increasing the Pt loading to 1 wt.%, the reduction temperature of the aforementioned cobalt species increased by 74 and 84 °C, respectively. Thus, it could be concluded that the addition of 0.3 wt.% Pt improved the reducibility of both metal species (Pt and Co), as deduced from the increased low temperature hydrogen consumption and the amount of available metallic Co with respect to reference CoAl (Table 2). This promotional effect could be attributed to a strong Pt–Co interaction. The smaller size of Co0 in the bimetallic samples, as estimated by XRD, could be also involved. As expected, the amount of available metallic Pt sites increased proportionally to Pt loading—that is, Pt dispersion remained practically unchanged (as seen in Table 2).
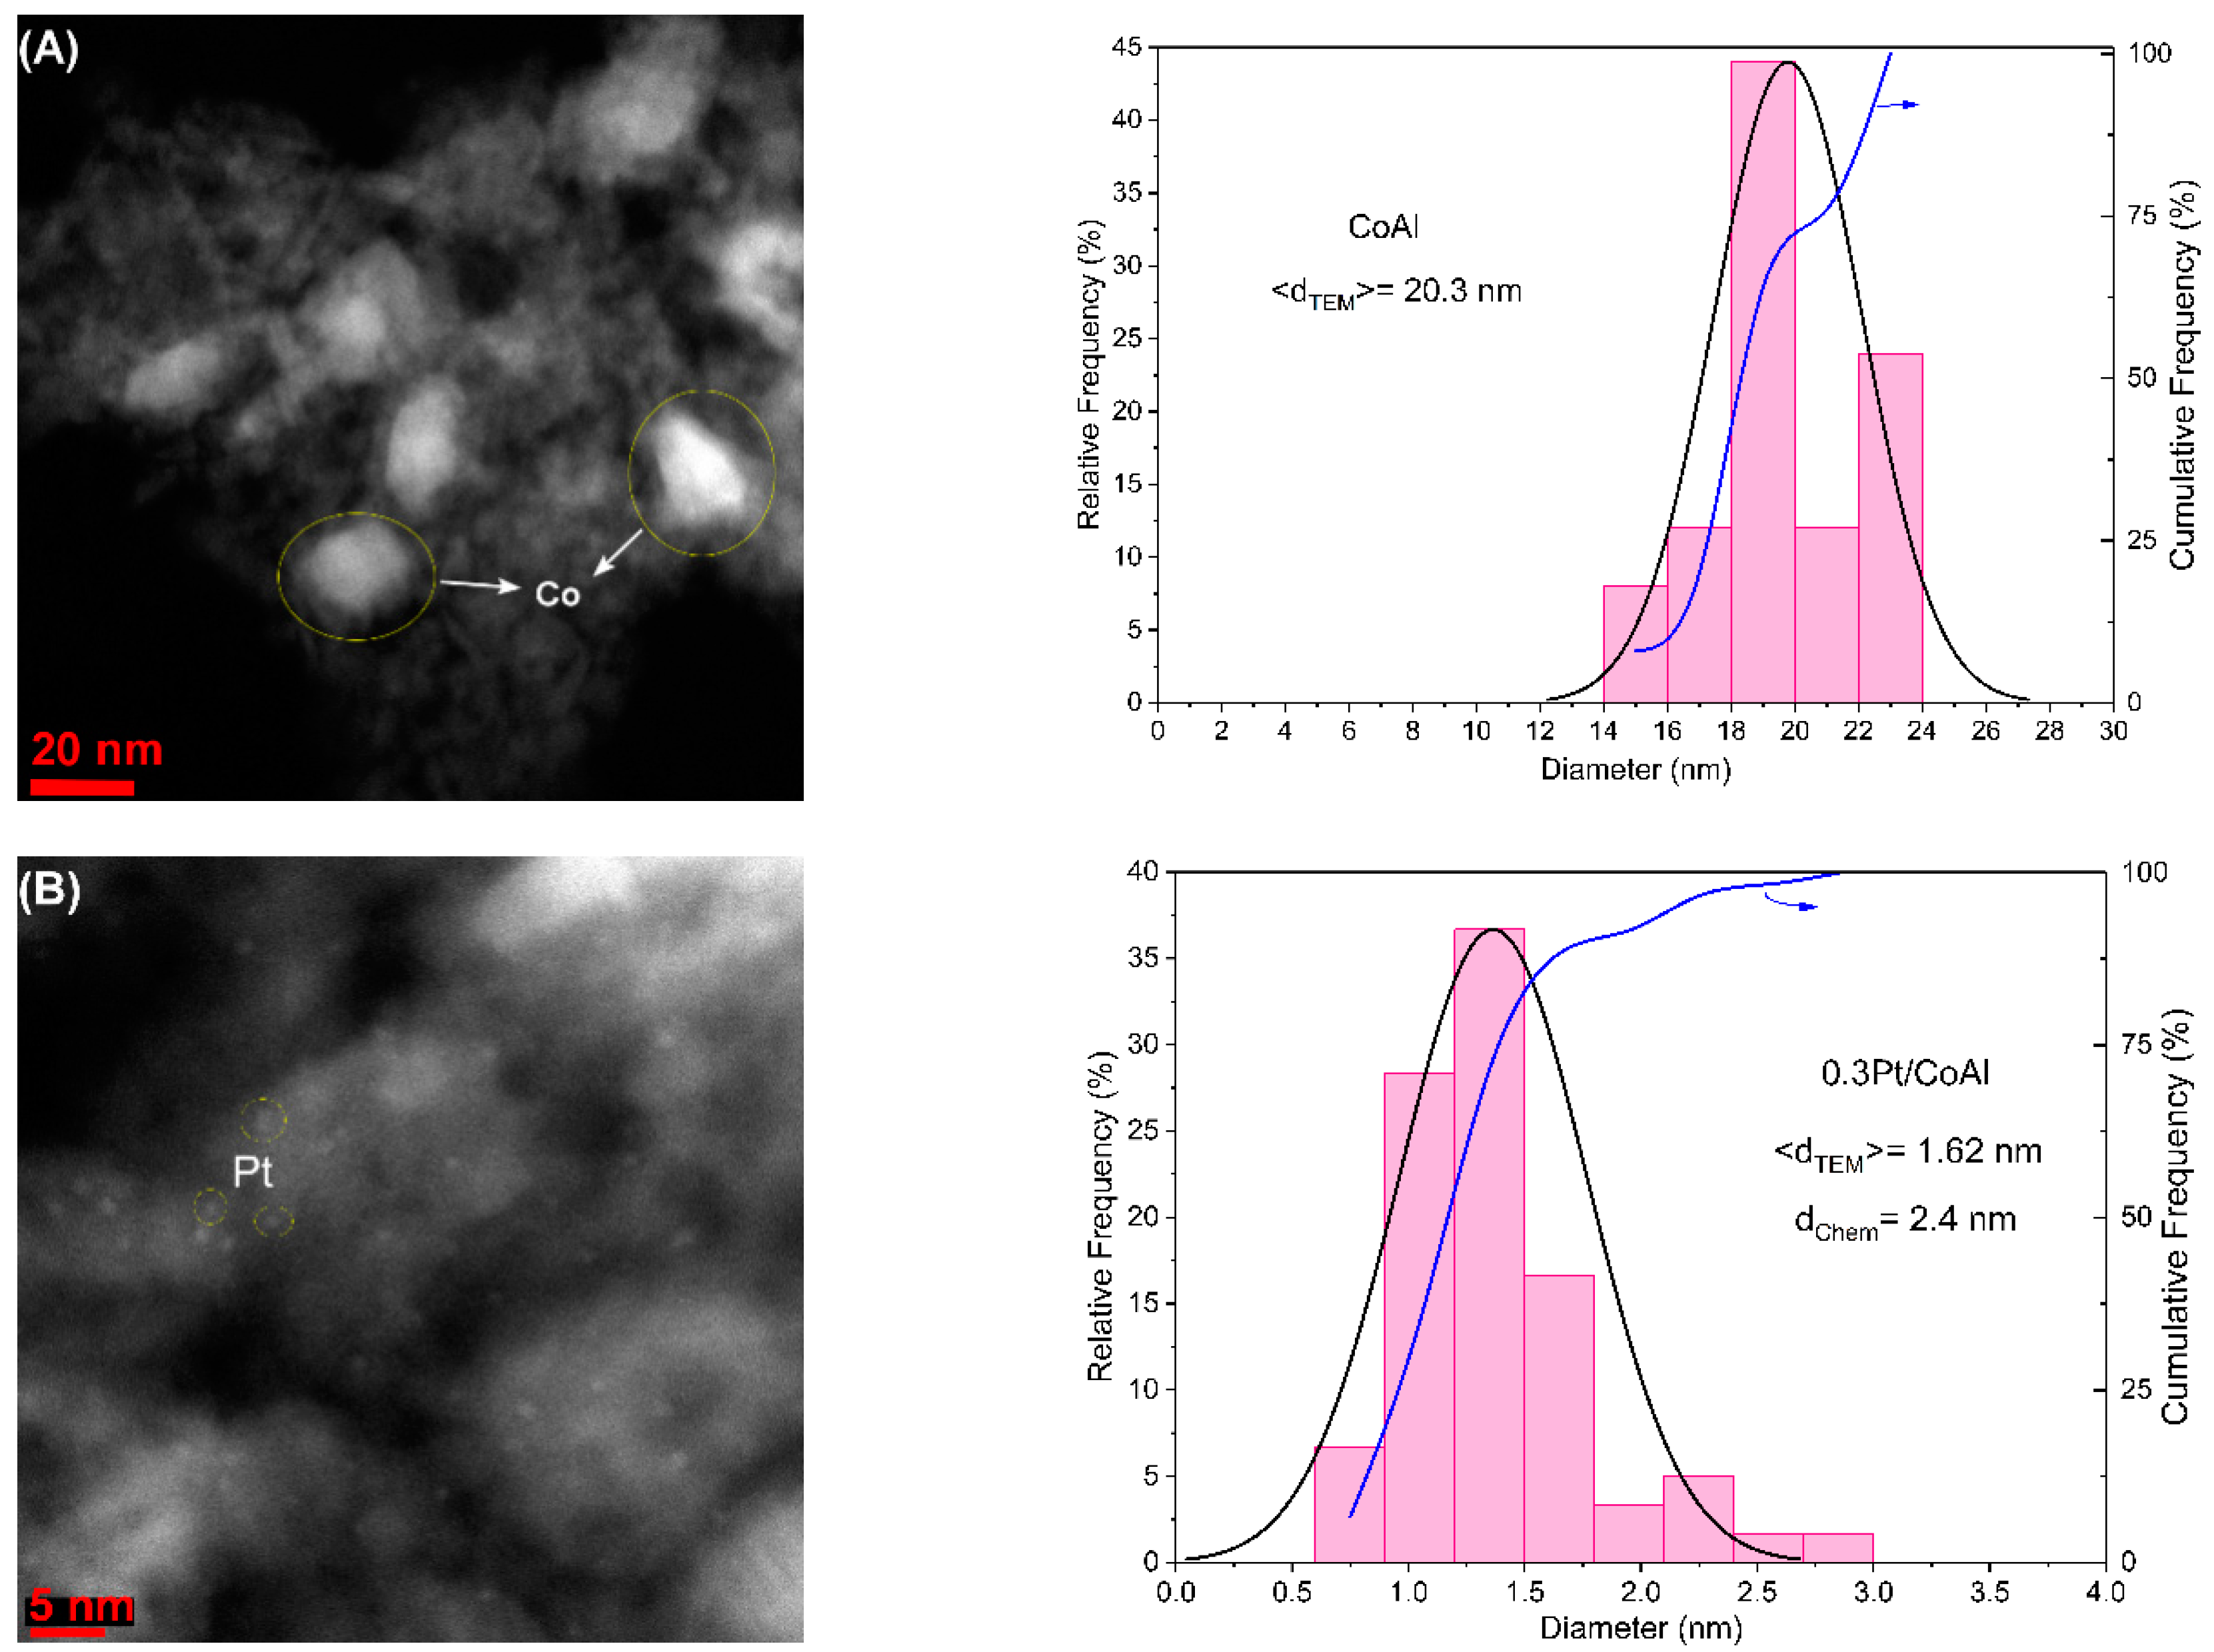
The morphology of the reduced samples was investigated by scanning transmission electron microscopy (STEM) techniques. Figure 3 shows their corresponding STEM micrographs and the resulting particle size distribution histograms. The surface morphology of cobalt aluminate support is basically preserved after Pt addition. The analysis revealed the presence of well-dispersed metallic particles of homogeneous size, especially in Pt-containing catalysts. The overall particle size of metallic cobalt nanoparticles in the CoAl sample was in the range of 14–24 nm, leading to an average size of 20.3 nm, with a cube/cuboid shape. On the other hand, Pt nanoparticles were of near-spherical shape, with a much smaller size, in concordance with the absence of diffraction peaks in XRD. Pt nanoparticles ranged between 0.6 and 3.0 nm, with an average size of 1.62 nm for 0.3Pt/CoAl and 1.88 nm for 1Pt/CoAl. Pt nanoparticles were homogeneously dispersed onto larger Co nanoparticles (comparable with those observed in the CoAl catalyst), as can be seen in Figure 3B,C. For the monometallic 0.3Pt/Al sample, most of the nanoparticles were uniform, with an average size of 1.84 nm. The energy dispersive X-ray spectra (EDX) analysis (Figure S2, Supplementary Materials) confirmed the metallic composition of the Pt nanoparticles.
Platinum particle size was also calculated from H2 chemisorption, and a mean diameter of about 2.2 nm was measured for all the samples, which was slightly larger than the STEM calculated value. This discrepancy could be due to a limited hydrogen adsorption capacity due to strong Pt–Co interactions and likely alloy formation. The large discrepancy in the 0.3Pt/CoAl catalyst suggested a stronger Pt–Co interaction, in agreement with H2-TPR. Pt dispersion was around 62% for the 1Pt/CoAl and 0.3Pt/Al samples and slightly lower (58%) in catalyst 0.3Pt/CoAl. We hypothesize that the dispersion measured by H2 chemisorption for 0.3Pt/CoAl was under-estimated due to the high Co–Pt interaction. In any case, it is worth noting the good agreement between the STEM and H2 chemisorption measured Pt dispersion data.
The density of the surface basic sites of the reduced catalysts was evaluated by thermogravimetry, measuring the sample mass gain upon CO2 chemisorption. As reported in Table 2, the CoAl sample had the highest density of surface basic sites, with 1.90 µmolCO2/m2. The xPt/CoAl series presented around 30%–40% lower density than monometallic CoAl. Among them, density slightly increased at 1 wt.% Pt loading, whereas it was the lowest for catalyst 0.3Pt/Al (0.32 µmolCO2/m2).
The effect of Pt addition on the distribution of Co species lying on the near-surface of the calcined and reduced samples was investigated by XPS. The binding energies (BE) of the Al, Co and Pt species and the surface Co/Al atomic ratios are reported in Table 3. The Co 2p and Al 2p X-ray photoelectron spectra for the reduced samples are shown in Figure 4 (Pt 4d5/2 spectra are given in Figure S3, Supplementary Materials). Prior to reduction, binding energies of Al 2p and Co 2p3/2 were significantly higher in CoAl than in Pt-impregnated catalysts. The higher values can be due to the strong interaction between aluminum and cobalt [26]. Upon reduction, all samples showed the characteristic Co 2p doublet (Co 2p3/2 and Co 2p1/2) due to spin-orbit splitting. The spectra were deconvoluted into Co0, Co2+ and shake up satellites; however, no peaks could be assigned to Co3+, probably due to the self-reduction in the high vacuum chamber. Co 2p peaks of the xPt/CoAl samples shifted to higher binding energies compared to parent CoAl. This upshift can be attributed to the electron transfer from less electronegative Co to Pt atoms that decreased electron density at the Co site [27]. The Al 2p peak at the binding energy of 74.2 eV corresponded to Al cations placed at the octahedral sites [28]. As the strong Al 2p peak overlaps with the most prominent platinum electron line (Pt 4f), the Pt 4d5/2 was analyzed instead. Although limited due to the low platinum content, the spectra of Pt 4d region showed peaks located at 314.0 ± 0.2 eV for the Pt-containing catalysts, which can be ascribed to the Pt0 phase [29].
The overall surface Co/Al atomic ratio, calculated from Co 2p to Al 2p peak intensities (Table 3), decreased in comparison to bulk composition (evaluated by ICP-AES). This surface enrichment on Al3+ ions was attributed to the lower surface free energy of Al as compared to Co [30]. Upon reduction, the Co/Al atomic ratio on surface decreased, probably due to the incorporation of metallic species into the porous structure [31], which would also explain the decrease in pore volume. Furthermore, it is interesting to note the higher Co/Al values measured for the bimetallic assays (as compared to parent CoAl), regardless of their calcined or reduced state.

2.2. Liquid-Phase WGS Activity in the Absence of Hydrogen (H2/CO = 0)

The WGS performance of the prepared catalysts was evaluated at 260 °C and 50 bar (which corresponded to 3.2 bar above saturation), with H2O/CO = 15/1 mole ratio in the feedstream and a space-time of 76.8 kgcat·s/molCO. The obtained CO conversion (XCO), CO2 yield (YCO2) and CH4 yield (YCH4) at 10 h TOS are shown in Figure 5. Among all those tested, the monometallic 0.3Pt/Al catalyst exhibited the lowest activity in the aqueous-phase WGS, with a 29.9% conversion of CO. The platinum-free monometallic CoAl catalyst was the most active assay, with 51.2% conversion. Bimetallic catalysts performed better; thereby, after the addition of 0.3% Pt to CoAl, CO conversion increased to 63.8%. Moreover, it was further improved by 1% Pt loading, which reached 97.1% conversion, very close to thermodynamic equilibrium (98.8%). It was evidenced that Pt loading on CoAl produced a promotional effect in the WGS activity and also confirmed the strong influence of the support on the catalytic behavior. The activation of the water molecule, a critical step in the WGS reaction, can occur either on the oxygen vacancies (reducible support) or on the metal particle. The H2-TPR results indicated the very low reducibility of the 0.3Pt/Al catalysts, which suggested that the support did not provide sufficient oxygen vacancies for the activation of water molecules, as cobalt-containing catalysts did. Therefore, the WGS activity of the 0.3Pt/Al catalyst should be related mainly to the available Pt particles, with competitive adsorption of both CO and H2O. The apparent reaction rate, normalized per Pt site (on the H2 chemisorption basis), was calculated and was used to compare the WGS activity for both catalysts with similar Pt content (0.3%). The obtained values (0.31 s−1 vs. 0.88 s−1 for 0.3Pt/Al and 0.3Pt/CoAl, respectively) supported the hypothesis of the active participation of the support in the reaction mechanism. On the other hand, the apparent reaction rates normalized per Co site (based on H2 chemisorption) for the CoAl and 0.3Pt/CoAl catalysts were very similar (around 0.16 s−1) and increased to 0.27 s−1 for the 1Pt/CoAl catalyst.
The acid/basic character of the surface can also affect the WGS catalyst activity [12,32]. Among our samples, the surface basic site density of 0.3Pt/Al (0.32 µmolCO2/m2) was lower than the cobalt-containing catalysts (1.16–1.90 µmolCO2/m2). The basic sites can polarize the water molecule and induce its dissociation to hydroxyl [12], which is the kinetically limiting step in WGS. The excellent WGS catalytic performance of the Pt-Co ensemble was ascribed to its improved ability for water dissociation (by the alloyed cobalt surface) as well as by a lowered CO binding energy, in comparison to monometallic catalysts [33].
Two general mechanisms are commonly accepted for the gas-phase WGS reaction over noble metals supported on oxides: (i) regenerative mechanism, where the labile oxygen from the support oxidizes CO adsorbed on the metal and the formed oxygen vacancy is re-oxidized by water; (ii) associative mechanism, where adsorbed CO reacts with terminal hydroxyl groups of the support to form a C-containing intermediate that is decomposed to CO2 and H2. Thus, both the dispersed metal and the support participate in the reaction. Figure 6 depicts the schematic representation of the WGS reaction when water reacts from the vapor or liquid phase. Davda et al. [10] contemplated the idea that WGS occurred in the gas bubbles formed within the liquid-phase reactor (scheme A), with the vapor water amount dictated by its liquid–vapor saturation. In scheme B, water reacts from the liquid phase and CO reacts from the gas phase, which implies that the reaction takes place at the gas–liquid–solid interface [14]. In both schemes, the CO reactant and the obtained products were partially dissolved in liquid water, dictated by the vapor/solution equilibrium (Henry’s law). Partial pressures of water, CO and H2, and the liquid/gas distribution of CO and H2 for each experiment, are given in Table S2, Supplementary Materials. As can be seen, the very high partial pressure of water, close to the operation pressure, has a large impact on the CO and H2 partial pressures, which are very low.
Under the investigated operation conditions, all the catalysts showed high CO2 yield (ranging from 27.4% for 0.3Pt/Al to 95.7% for 1Pt/CoAl). Moreover, CO2 selectivity was above 90% for all the catalysts. Thus, the CO2 yields indicated a satisfactory product distribution, with mainly H2 and CO2 in the gas product stream. Methane was also detected, though to a much lesser extent. Methane yield increased as follows: 0.3Pt/Al (0.3%) < 0.3Pt/CoAl (0.9%) < CoAl (1.5%) < 1Pt/CoAl (1.9%).
Two mechanisms are usually proposed for CO hydrogenation: (i) associative, where carbonyl combines with Hads followed by C–O bond cleavage, and (ii) dissociative, where C–O bond breaking takes place directly on the metal, before the hydrogenation step [34]. Under the investigated conditions (i.e., feedstream containing only CO and water), the negligible hydrogenation of CO was associated with the low availability of the in-situ produced hydrogen that, in fact, competed for the metal sites. Moreover, not all the hydrogen produced in the gas phase was readily available for CO hydrogenation, as it was partly dissolved in the aqueous phase. The Henry’s constants in Section 3.2 indicate the higher solubility of hydrogen gas as compared to CO. Nevertheless, the fraction of CO and H2 dissolved in the liquid phase was four orders of magnitude lower than that remaining in the liquid phase (see Table S2, Supplementary Materials). This was reflected in the large YCO2/YCH4 yields ratio for all the samples (Table 4), between 30.8 (for CoAl) and 88.1 (for 0.3Pt/Al), indicating the superior CO hydrogenation activity of cobalt in a hydrogen-lean scenario. Further investigation was carried out to simulate real APR operation conditions (high H2/CO ratio) and elucidate whether high hydrogen availability could overcome such CO hydrogenation limitations. The results are presented in the following section.

2.3. Liquid-Phase WGS Activity in the Presence of Hydrogen (H2/CO > 0)

In order to investigate the CO hydrogenation capacity of the catalysts under real APR conditions, H2 was co-fed at different H2/CO mole ratios (4/3, 7/3 and 12/3). The investigated H2/CO ratios were established based on the stoichiometric ratio in a typical APR process. Figure 7A displays the reached CO conversion as a function of the H2/CO ratio for all the catalysts assayed, evaluated at 260 °C and 50 bar after 10 h TOS. For comparison purposes, the XCO values attained for the hydrogen-free feedstream are also depicted (H2/CO = 0). For all the catalysts, the achieved CO conversion was lower than that obtained in the absence of hydrogen in the feedstream. Additionally, a decreasing trend of Xco with H2/CO was observed. The figure shows that bimetallic xPt/CoAl catalysts remained as the most active, independent of the H2/CO ratio. The achieved CO conversion values varied as follows: 1Pt/CoAl >> 0.3Pt/CoAl >> CoAl > 0.3Pt/Al. It is interesting to note that the monometallic CoAl catalyst was the most sensitive to the feedstream composition (it had the largest negative slope in the figure). Catalyst CoAl showed the major drop, of around 50% (XCO = 39.4% and dropped to 19.9% by passing from H2/CO = 4/3 to 12/3). The decrease was quite similar for 0.3Pt/Al (29%) and 0.3Pt/CoAl (25%) catalysts. As noted, 1Pt/CoAl was the least sensitive to H2/CO ratio, with only an 11% decrease in XCO. A possible explanation of the negative effect of H2/CO ratio on Xco could be the lower residence time of the gas phase (as H2/CO increased) and the competition between H2 and CO for the available metal sites. In addition, the higher H2/CO ratio decreased the CO partial pressure, which also might negatively affect the reaction rate. At these reaction conditions, CO was converted by both the WGS and CO hydrogenation reactions. It is known that CO poses a negative reaction order in the methanation reaction, whereas it is slightly positive for H2 [35]. The apparent reaction order with respect to CO was positive for all the catalysts and ranged between 0.12 and 0.17 for the bimetallic catalysts and 0.57 for the monometallic CoAl catalyst, while the order with respect to H2 was neatly negative (between −0.34 and −0.80 for bimetallic catalysts).
Regarding product distribution, unreacted H2 and CO, together with produced CO2, CH4 and traces of ethane, were detected in the reactor outlet. The very low production of C2+ alkanes indicated the low Fisher–Tropsch activity of our catalysts at these reaction conditions. Indeed, the production of methane was notably higher than under the hydrogen-free feed conditions, except for the 0.3Pt/Al catalysts, for which it slightly decreased. Several studies have shown that in the gas phase, the CO hydrogenation rate is higher than CO2 hydrogenation, evidencing that high concentrations of CO in the reaction bed could inhibit the reaction of CO2 [34]. On this basis, we assumed that methane was only formed from CO hydrogenation. In this scenario, CO was consumed by both WGS and CO hydrogenation reactions. Figure 7B shows the trend in the CO2 and CH4 yields with H2/CO ratio. The CO2 yield showed a similar decreasing trend to XCO. As occurred for H2/CO = 0 (hydrogen was not fed), the bimetallic xPt/CoAl catalysts remained the most selective to CO2, independent of the H2/CO ratio, while both monometallic catalysts showed similar values of YCO2, especially at H2/CO ≥ 7/3.
Methane yield (YCH4) was used as representative of the CO hydrogenation activity. The results in Figure 7B clearly evidence that hydrogenation activity was more pronounced for Co-containing catalysts, in agreement with the literature [36]. Not in vain, cobalt is one of the most used catalysts for CO hydrogenation [37]. On the opposite side, the 0.3Pt/Al catalyst showed very low YCH4. For example, at the highest H2/CO ratio of 12/3, catalyst 0.3Pt/Al showed 0.29% of methane yield, whereas the rest of the investigated catalysts ranged in the 3.1%–3.8% interval. Among the cobalt-containing catalysts, the different behavior of YCH4 for the monometallic CoAl is noticeable when changing H2/CO from 0 to 4/3—that is, for bimetallic catalysts, methane yield slightly decreased as H2 availability increased, while for the CoAl catalyst, methane yield was boosted. This behavior could be related to the size of the cobalt particles, which was two-fold larger in the monometallic sample. Indeed, the hydrogenation of CO is known to be favored onto large cobalt particles [38]. Note that, even in the case of more available hydrogen (higher H2/CO), YCH4 reached a plateau for the bimetallic catalysts. The effect on YCH4 of the H2/CO ratio change from 4/3 to 7/3 for cobalt-containing catalysts was also noticeable and could be related to the formation of cobalt carbide-like species at low hydrogen partial pressures [39].
As previously noted, we assumed that the CO2 hydrogenation rate was negligible with respect to CO hydrogenation. In addition, no carbon deposits were detected in the spent catalysts. Therefore, the yield ratio (YCO2/YCH4) could be assumed as representative of the selectivity to WGS reaction (instead of CO hydrogenation): higher YCO2/YCH4 indicated higher selectivity to WGS—that is, the CO was converted preferably by WGS rather than by CO hydrogenation. Table 4 shows the obtained YCO2/YCH4 values. Regardless of the catalyst, selectivity to WGS decreased with increasing hydrogen concentration in the feed, as more hydrogen is available for hydrogenation. It is interesting to note that the bimetallic xPt/CoAl catalysts experienced the highest drop in YCO2/YCH4 values (84.4% and 64.9% for 0.3 and 1% Pt loading, respectively), as can be seen in Table 4. Even so, they presented high WGS activity, only surpassed by the monometallic Pt sample.
Net hydrogen change (ΔH2) has been defined as the difference in hydrogen molar flow between the reactor outlet and inlet: it can be either positive or negative depending on the net generation or consumption of hydrogen in the reaction system. In addition, the ΔH2 parameter reflects the hydrogenation activity. CO hydrogenation (methanation) is a highly hydrogen-consuming reaction and pulls the ΔH2 parameter to negative values. As can be seen in Figure 8, for cobalt-containing catalysts, ΔH2 decreased with the increase of H2/CO, due to the hydrogenation capability of cobalt, boosted by the hydrogen excess. Among all catalysts, both bimetallic xPt/CoAl catalysts presented positive ΔH2, independent of the H2/CO used. The largest positive ΔH2 corresponded to the bimetallic 1Pt/CoAl catalysts, in agreement with its highest activity and selectivity to the WGS reaction, with a maximum value of 33.9% for H2/CO = 4/3. Catalyst 0.3Pt/Al presented slightly negative ΔH2 at a low H2/CO ratio (−1.02% at H2/CO = 4/3), which turned slightly positive (+0.52%) for the highest hydrogen to CO mole ratio.

2.4. Effect of Temperature and Pressure

Both the reaction temperature and pressure have a strong influence on the polyol APR activity and product distribution [40]. Whether the effect is related to reforming or to WGS is of great interest in order to understand the APR behavior. With this aim, further experiments were carried out with catalyst 0.3Pt/CoAl in order to investigate the influence of temperature and pressure on the WGS activity and with H2 co-feeding. 
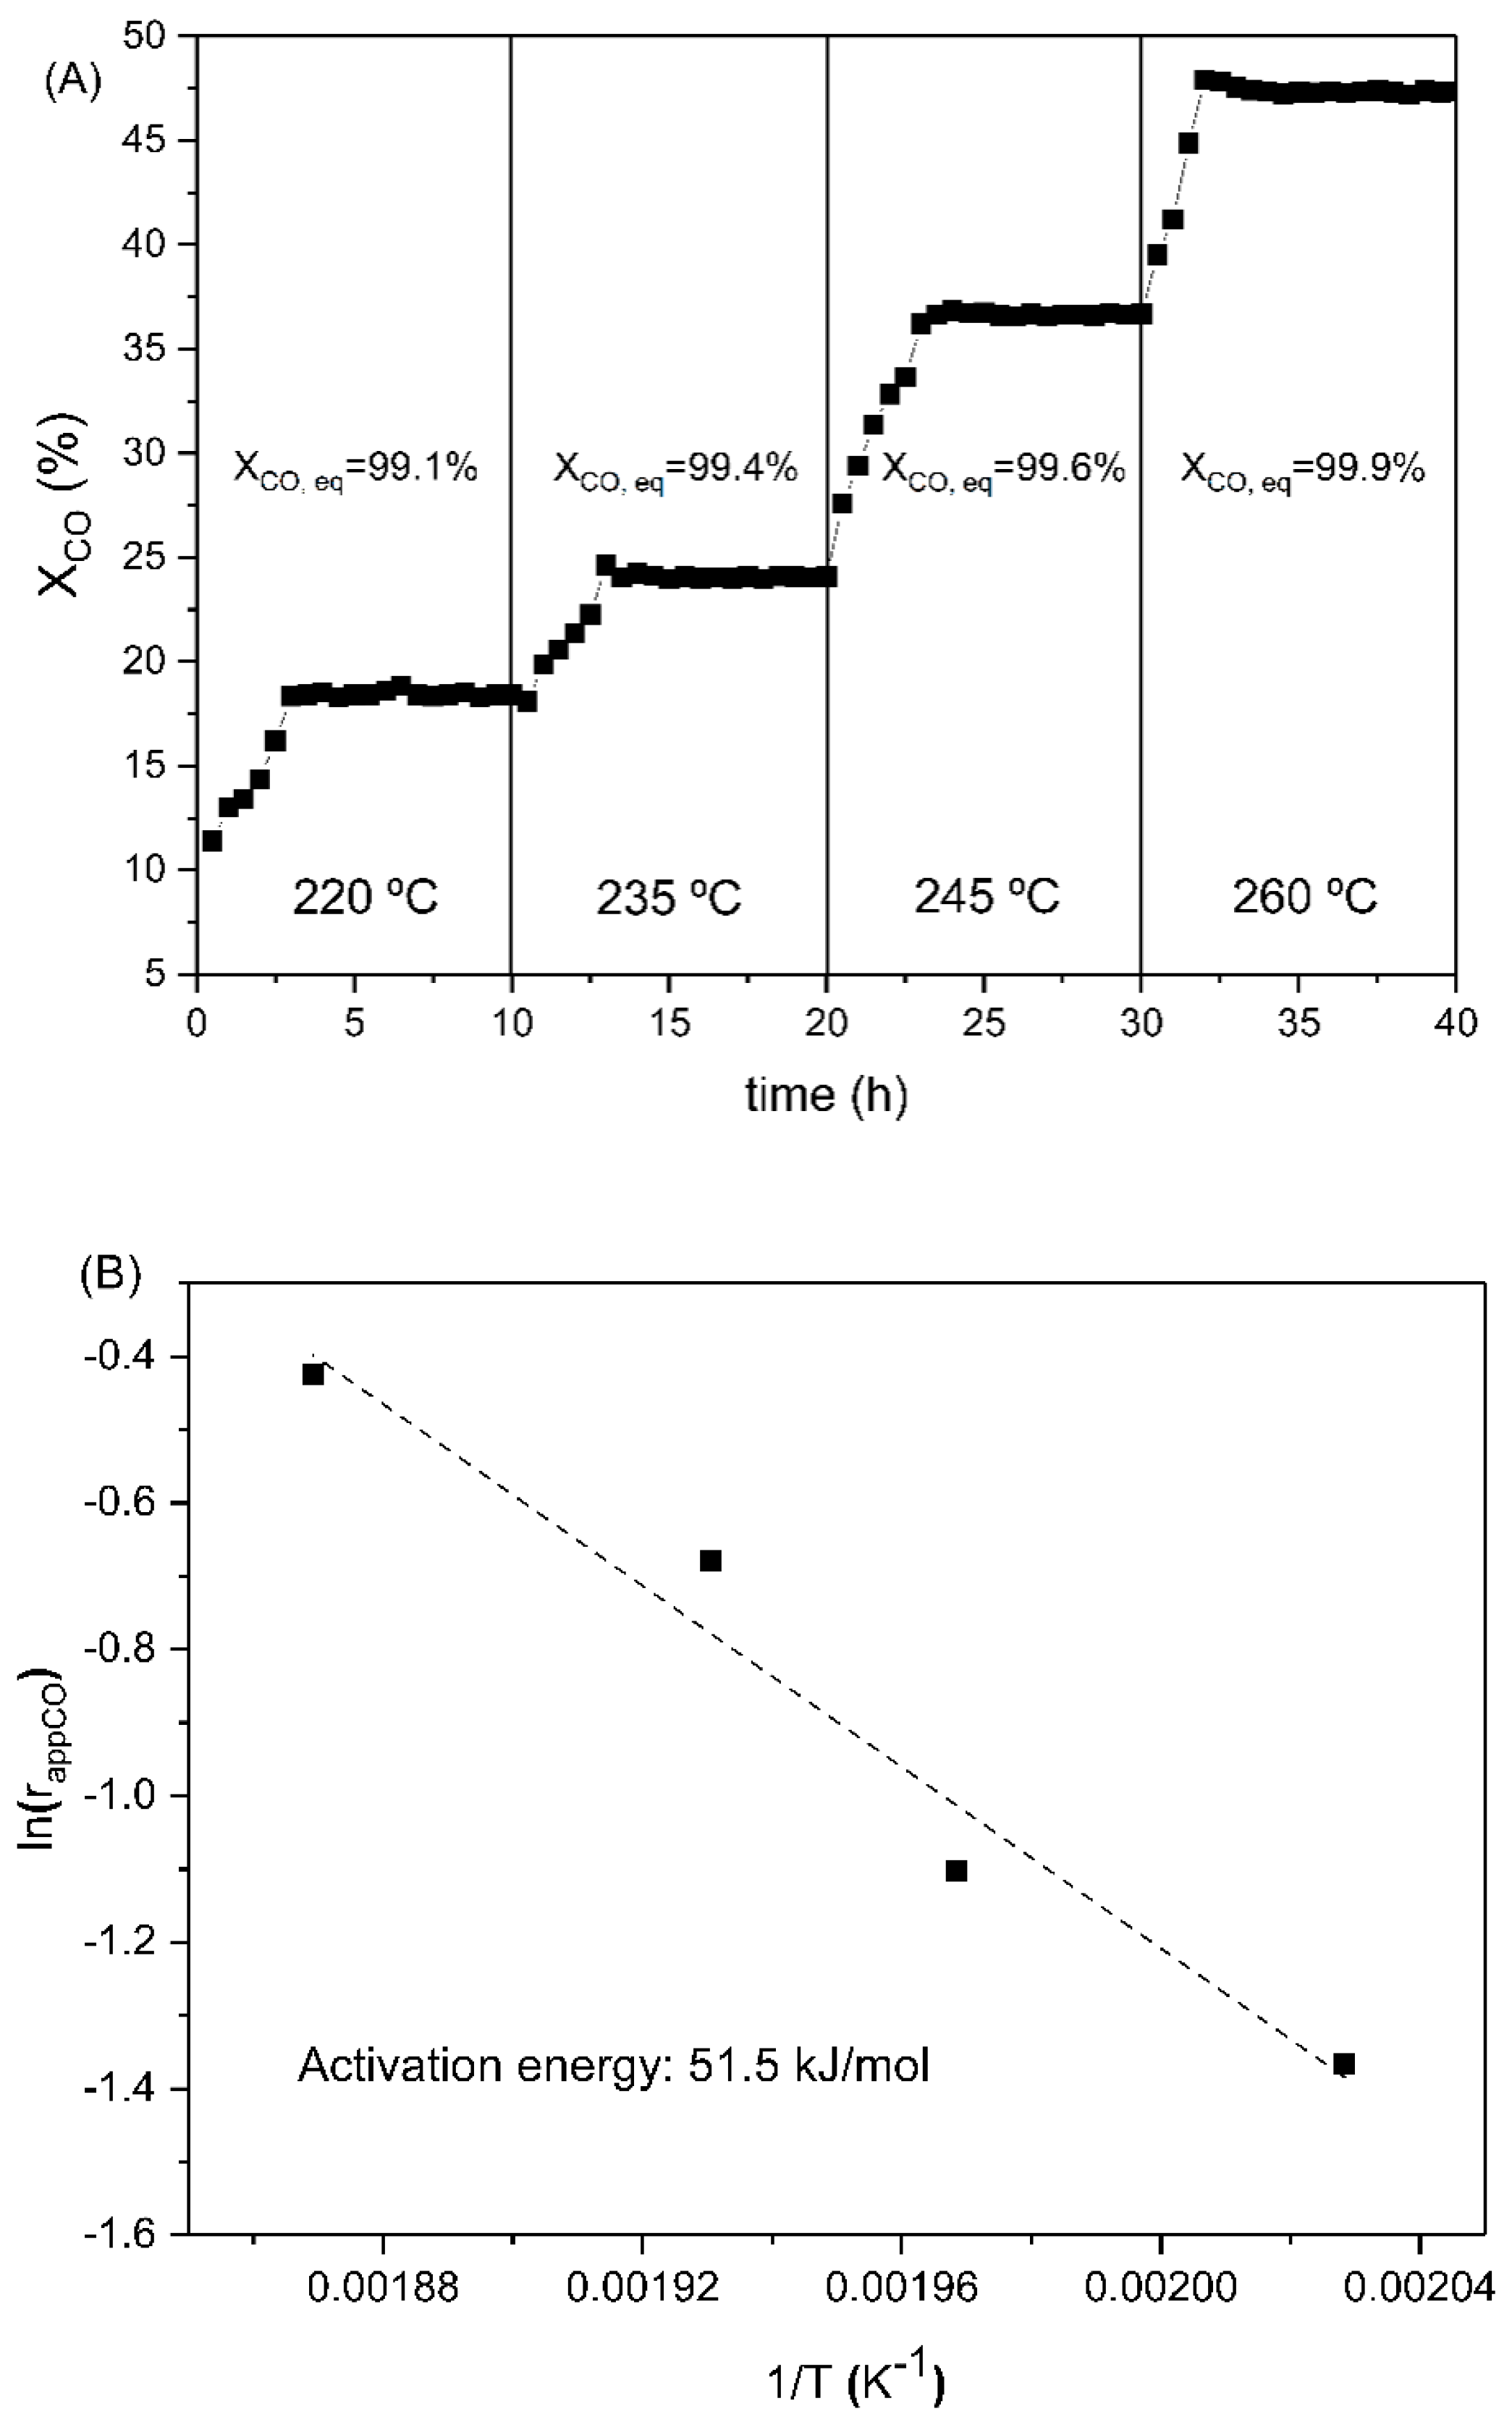
Figure 9A shows the CO conversion achieved at 50 bar at different reaction temperatures, at H2/CO = 12/3. The observed initial increase in the conversion (which lasted about 3 h) was due to unsteady operation due to the reaction protocol, where the temperature was ramped while holding pressure. Thereafter, the conversion of CO remained stable. Noticeably, the increase in the reaction temperature led to increased CO conversion values. However, the obtained values were far from the equilibrium (given in Figure 9), indicating a kinetically controlled reaction regime under these operation conditions. At low reaction temperatures, the higher overpressure may play a negative role in the catalytic activity, as the product’s desorption from the catalyst surface was hindered [41]. In addition, the water solubility of the reactants (CO and H2) increased according to Henry´s law (H constants from Section 3.2). The fact that these values barely varied with temperature (from 2.2 at 220 °C to 2.5 at 260 °C) suggested that solubility issues hardly affected the H2/CO mole ratio in the gas phase (see Table S2 in Supplementary Materials). According to Table 4, the YCO2/YCH4 ratio increased with the operation temperature, i.e., it became more selective to WGS. This trend could be explained by two reasons: firstly, the thermodynamics of the CO hydrogenation reaction (highly exothermic reaction), which is highly favorable at lower temperatures; secondly, the increased partial pressure of water in the gas phase, which would shift the WGS equilibrium towards the products.
The apparent reaction rate normalized per Pt site (rapp,co) (on the H2 chemisorption basis) was calculated for each reaction temperature, at 50 bar and H2/CO = 12/3 in the feedstream. Obtained values are shown in Table 5, and they revealed that rapp,co was strongly affected by the reaction temperature, as supported by the activation energy value of 51.5 kJ/mol calculated from the Arrhenius plot (Figure 9B). To our knowledge, this is the first approach to the experimental determination of the apparent activation energy for the liquid-phase WGS. For comparison purposes, the apparent activation energy values reported in the literature for Pt catalysts are shown in Table S1 (Supplementary Materials). It is of interest to note the inhibitory effect of hydrogen on the intrinsic reaction rate, as rapp,co decreased from 0.88 (for hydrogen-free feedstream) to 0.654 s−1 (for H2/CO = 12/3).
Figure 10 shows CO conversion at 220 °C for different reaction pressures, with H2/CO = 12/3. The observed gap in the first 2.5 h of reaction at each pressure is because the reactor outlet flow valve was shut until the desired pressure was achieved. Notably, CO conversion increased with operation pressure, at a constant reaction temperature. For example, at 25 bar, the obtained CO conversion was 9.6% and two-fold increased at 50 bar. The achieved CO conversions were far from the equilibrium (which decreased from 99.2% at 25 bar to 89.0% at 50 bar), which was a result of the slow kinetics due to the low reaction temperature.
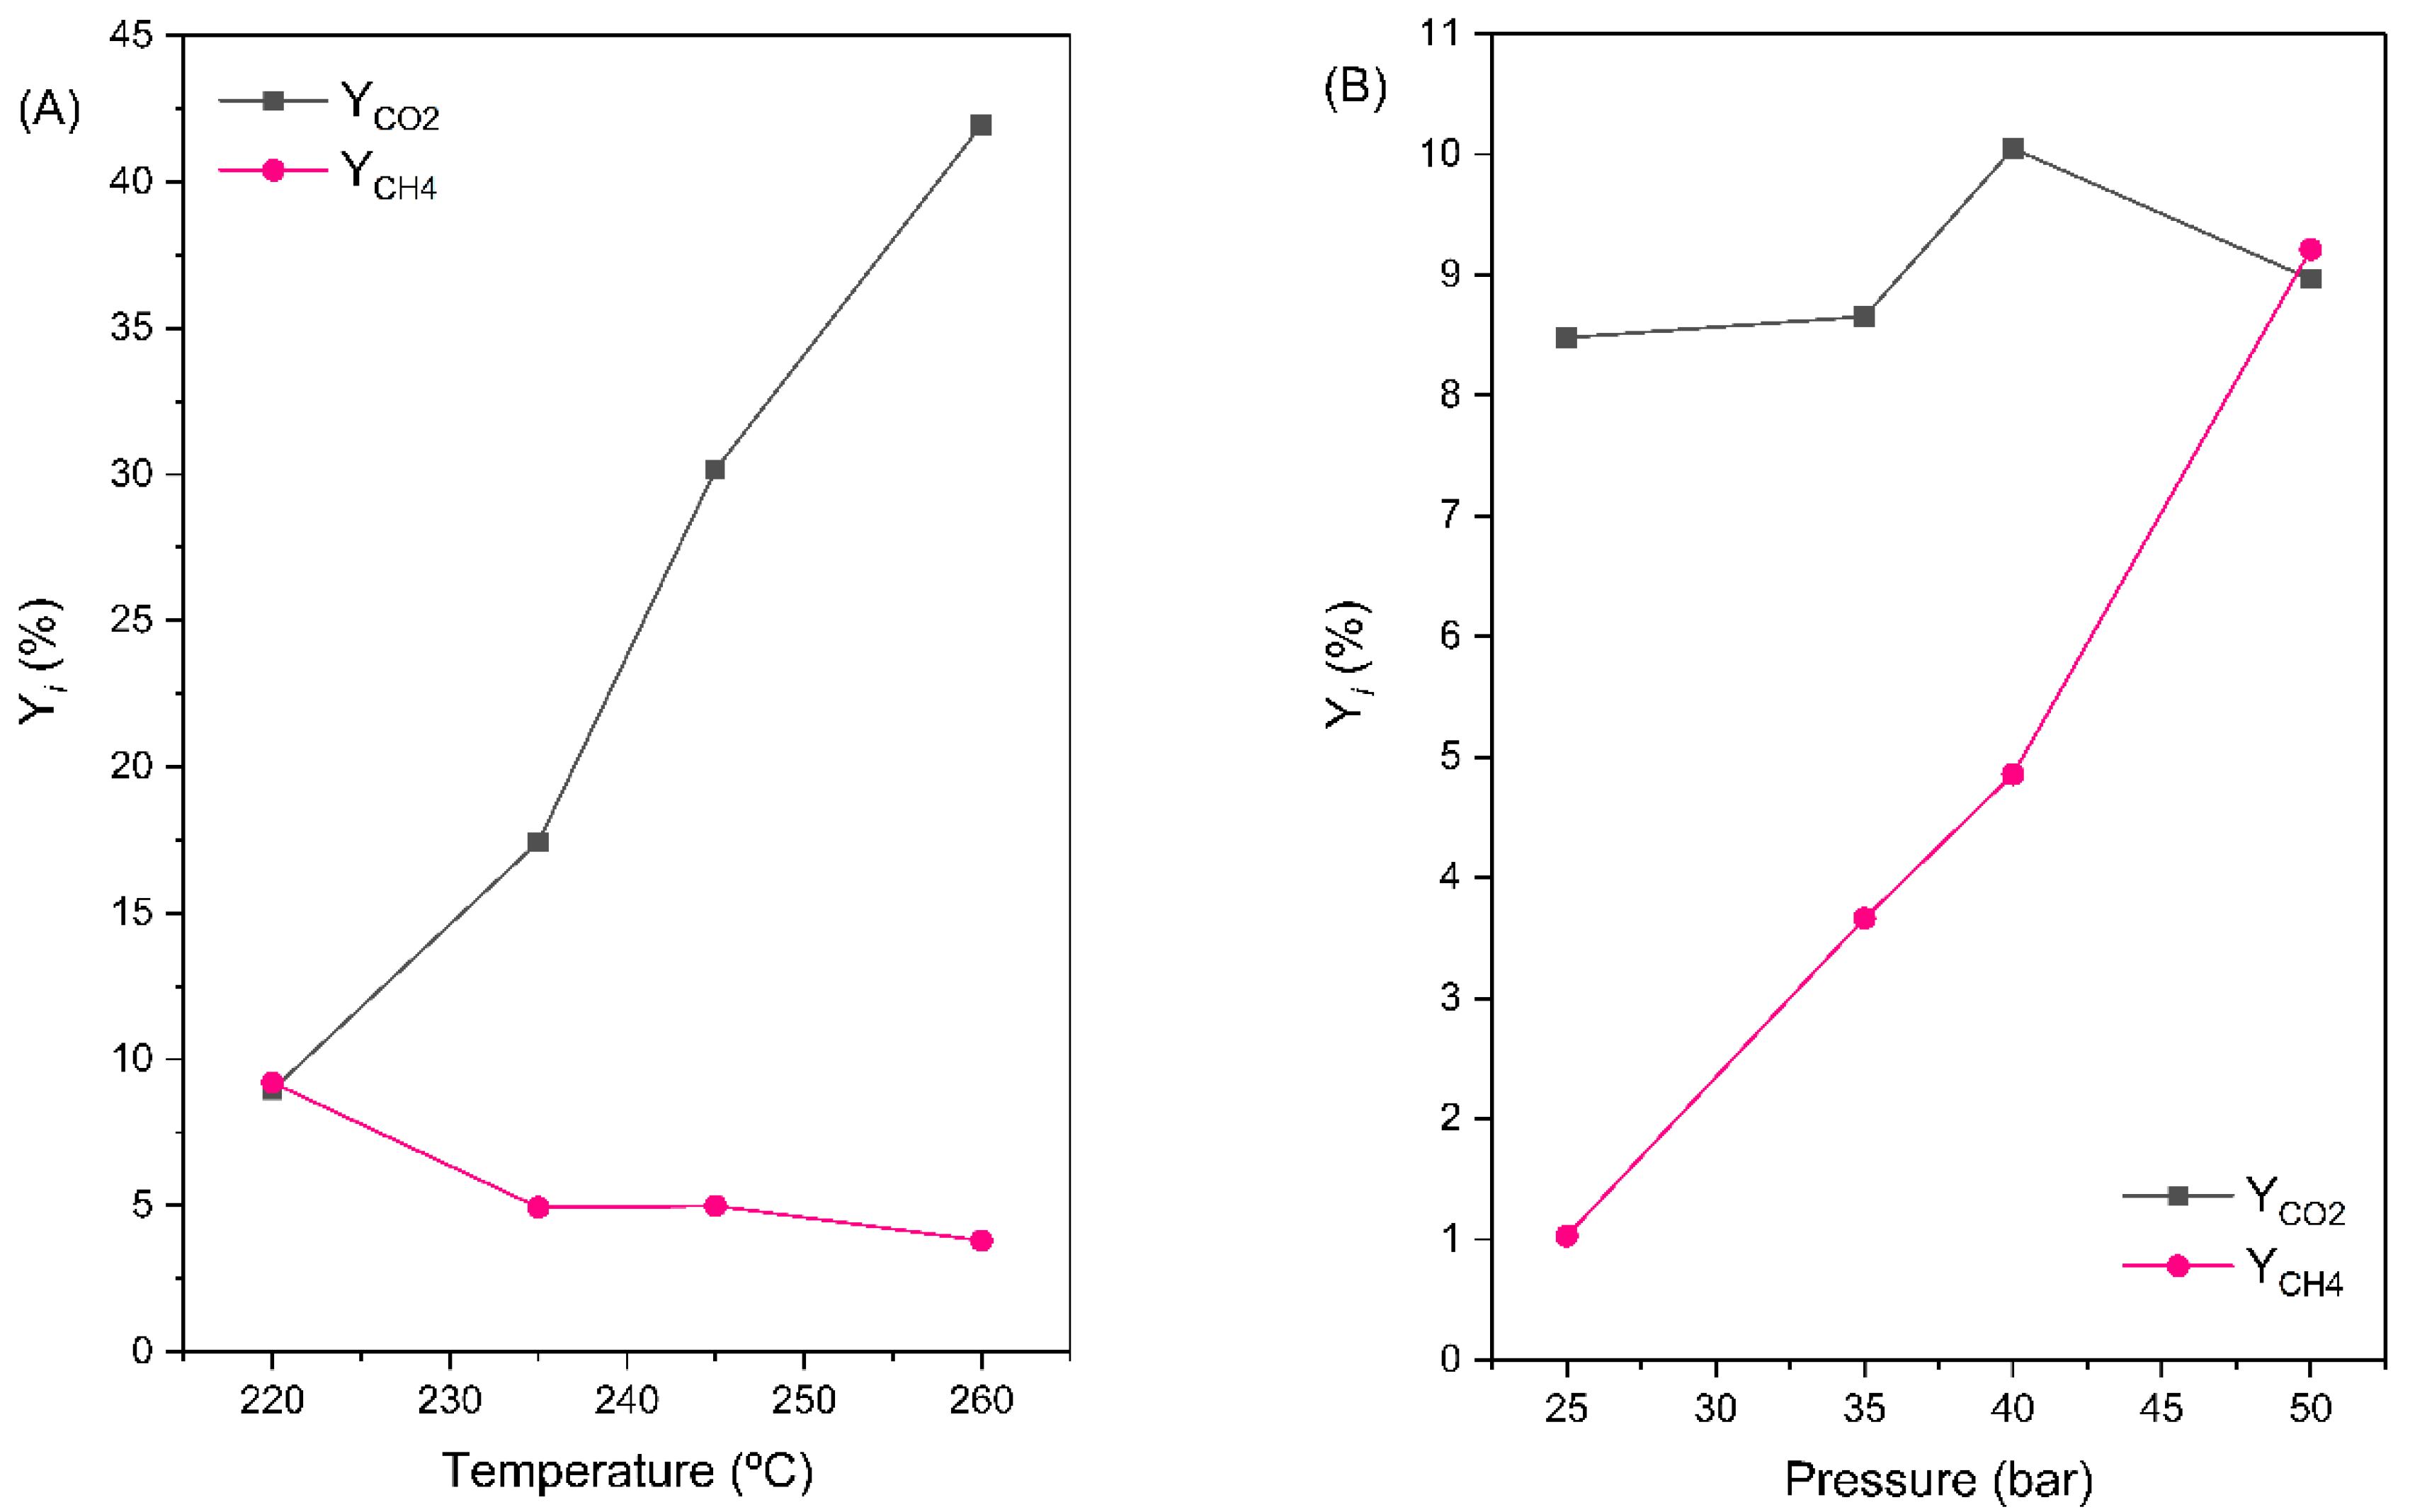
Product yields (YCO2 and YCH4) for 0.3Pt/CoAl at different temperatures (A) and pressure (B) values are displayed in Figure 11. CO2 yield turned out to be more sensitive to temperature than to pressure changes. For example, CO2 yield increased by 95% by passing from 220 to 235 °C. In like manner, a further increase in temperature to 260 °C caused an increase of about 140%. On the contrary, methane yield hardly varied with temperature, though a slight tendency to decrease with increasing temperature could be deduced. This led to a substantial increase in YCO2/YCH4, with around a ten-fold increase in the 220 to 260 °C range. As a result, the increase in WGS activity with respect to hydrogenation activity with increasing temperature is conclusive (Table 4). Regarding the influence of pressure on the product distribution, Figure 11B shows that CO2 yield slightly increased with pressure. Methane yield, however, increased ten-fold, from 25 to 50 bar. Therefore, the increased CO conversion at high pressure was due to a favored hydrogenation activity (i.e., ten-fold increase of YCH4 in the 25 to 50 bar range) rather than the WGS. Note that, at a constant temperature, the vapor pressure of water remained constant, thus the increase in the operating pressure was accomplished by increasing the partial pressures of the CO and H2 (see Table S2 in Supplementary Materials). Although the water solubility of hydrogen is twice that of CO, its effect on the available hydrogen in the gas phase was offset due to the high partial pressure of H2 under the established reaction conditions. Moreover, the fact that CO can react via WGS and produce even more hydrogen would also increase the hydrogenation rate [35]. The YCO2/YCH4 data in Table 4 clearly shows that the higher the overpressure, the less selectivity towards WGS, which is the opposite effect of the temperature increase.
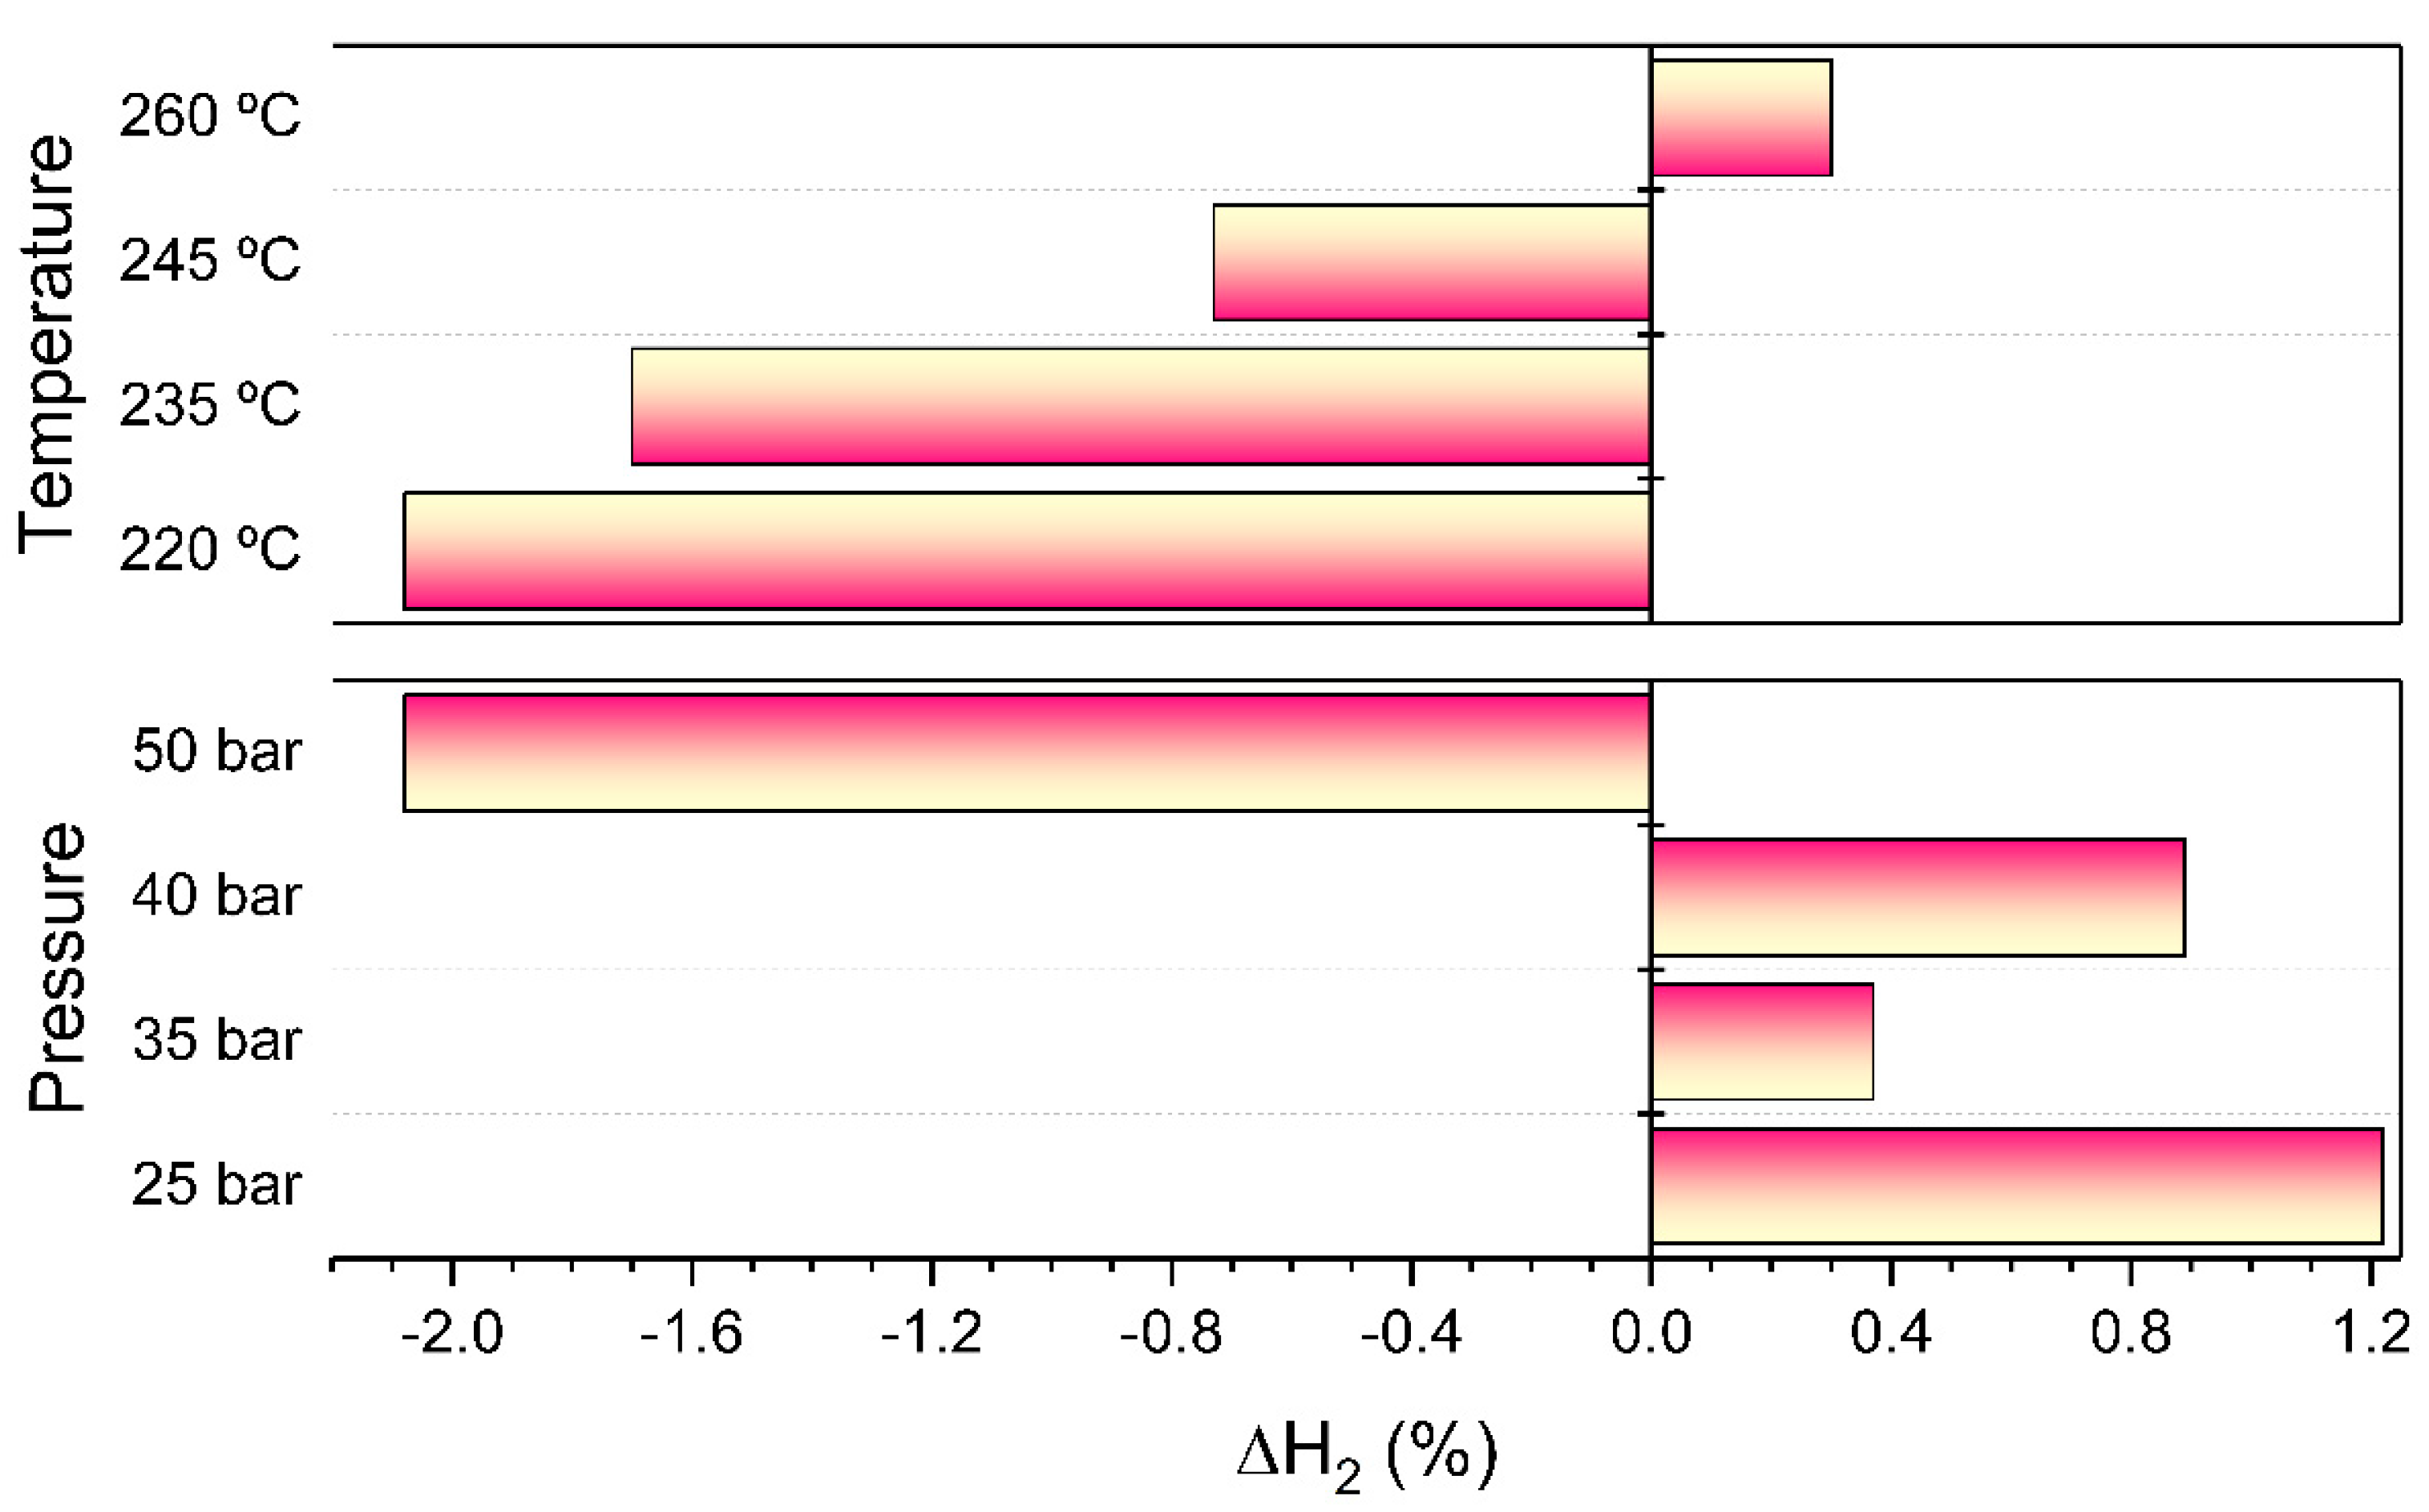
The evolution of the net hydrogen variation is shown in Figure 12. A large net hydrogen consumption (∆H2 < 0) was observed at low temperatures due to the high hydrogenation activity. It was verified that methane production decreased at increasing temperatures. Moreover, hydrogen consumption progressively decreased until a positive balance was obtained at the highest temperature screened. In agreement with the observed trend in the CO2 and CH4 yield, an increase in pressure favored selectivity towards CO hydrogenation. Hence, at the maximum working pressure, the rate of hydrogen consumption overtook that of production.

3. Materials and Methods

3.1. Catalyst Preparation

Cobalt aluminate catalyst was synthesized using a protocol reported elsewhere [16]. Briefly, appropriate amounts of dissolved nitrate salts (Co(NO3)2·6·H2O and Al(NO3)3·9·H2O), Co/Al molar ratio of 0.625, were coprecipitated into an aqueous solution of sodium carbonate at pH 10. The resulting suspension was aged at room temperature for 24 h, filtered, washed several times with de-ionized water, dried at 110 °C for 17 h and calcined in a muffle furnace at 500 °C (heating rate 5 °C/min) for 5 h in a static air atmosphere. This sample was abbreviated as CoAl.
Bimetallic xPt/CoAl (x: 0.3 and 1 wt.%) catalysts were prepared by the wet impregnation method. A controlled amount of aqueous solution of Pt(NH3)4(NO3)2 (Alfa Aesar, %99.99) was added to previously prepared CoAl. Then, the solids were dried at 110 °C for 17 h and finally calcined in air at 350 °C in a muffle furnace (heating rate 5 °C/min) for 3 h. For comparative purposes, a γ-Al2O3-supported Pt catalyst was prepared by the same procedure (abbreviated 0.3Pt/Al). γ-alumina was prepared by calcination of Al(NO3)3·9·H2O in air, at 500 °C for 4 h (heating rate 5 °C/min).

3.2. Catalyst Characterization

Metal contents were determined by inductively coupled plasma-atomic emission spectroscopy (ICP-AES) with a Perkin Elmer Optima 8300 apparatus. The specific surface area (SBET), pore size distribution (dpore) and pore volume (Vpore) were measured by nitrogen adsorption–desorption isotherms at 77 K, carried out with the Micromeritics TriStar II 3020 apparatus. The samples were outgassed at 300 °C for 10 h before the measurement. X-ray diffraction (XRD) studies were conducted on a PANalytical X’pert PRO diffractometer, using CuKα radiation (λaverage = 1.5418 Å). Each sample was scanned from 10 to 90° (2θ), with a step size of 0.026° (2θ) and a counting time of 2 s. Phase identification was done by comparison of the obtained spectra and the PDF database. The Scherrer equation, using a corrected full width at half maximum (FWHM) for instrumental broadening, was used to calculate the crystallite average size of the identified phases.
The reducibility of the samples was examined by temperature programmed reduction (H2-TPR) on a Micromeritics AutoChem 2920 apparatus equipped with a thermal conductivity detector (TCD). Before analysis, the sample (about 50 mg) was pretreated in He stream at 500 °C for 1 h (heating rate 10 °C/min) to clean the sample. Then, the temperature was cooled to ambient temperature into Ar flow. Finally, in 5% H2-Ar flow, the temperature was ramped to 950 °C at 10 °C/min heating rate and held for 1 h.
H2 chemisorption measurements were carried out on the same experimental setup used for H2-TPR experiments. Discrimination between Pt and Co metallic sites was effected by applying two consecutive pulse chemisorption analyses. Prior to the analysis, the surface was cleaned in He flow at 500 °C. Then, catalysts were reduced at 250 °C in 5% H2/Ar flow (heating rate 10 °C/min, hold 1 h) and cooled to 40 °C in Ar flow. Pulses of 5% H2/Ar were injected (loop volume 0.5312 mL) until peaks had equal areas. Secondly, the sample was heated in 5% H2/Ar flow to 600 °C (heating rate 10 °C/min, hold 1 h) and evacuated in Ar for 15 min. The temperature was cooled to 40 °C into Ar flow and a new H2 pulse chemisorption was completed. Hydrogen uptake by the sample reduced at 250 °C was assigned to Pt sites, while uptake after reduction at 600 °C was assigned to both Pt and Co sites. H/Me (Me=Pt, Co) stoichiometry of 1/1 was assumed. A spherical shape for Pt particles was assumed for the dispersion calculation, with 0.0655 nm2/at.Pt.
High-angle annular dark field scanning transmission (HAADF-STEM) images were obtained on a Titan cube (FEI, Thermo Fisher, Hillboro, OR, USA) system operated at 300 kV and coupled with a CCD camera (Gatan, Pleasanton, CA, USA). The nature of the particles was further confirmed by X-ray energy dispersive spectroscopy (X-EDS) in STEM mode. The samples for analysis were prepared by suspension of the corresponding sample in deionized water, dropping the suspension onto a 200-mesh carbon-coated copper grid and letting it dry under ambient air with the aid of anti-capillary tweezers. As the Pt particles were of the same shape, their average diameter was obtained from the measurement of at least 300 particles using ImageJ software, using the surface average diameter:
<d> = Σnidi3/Σnidi2 (di = diameter of ni particles)
For the calculation of the Pt dispersion from STEM, a spherical shape was assumed, with 1.3·1019 platinum atoms per unit area.
Total surface basicity was measured by weighing the sample upon CO2 chemisorption by thermogravimetry (Setaram Setsys, Caluire, France). About 80 mg of sample was placed in an alumina crucible and in-situ reduced at 600 °C for 2 h under 50 mL/min 5% H2/Ar flow. The sample was then cooled to 50 °C under 50 mL/min 5% H2/Ar flow. Thereafter, the flow was switched to 5% CO2/He (16 mL/min) for 1 h. Finally, the CO2 flow was stopped while 5% H2/Ar (50 mL/min) was still circulated through the reactor for 1 h in order to desorb the physisorbed CO2. The eventual mass gain of the sample corresponded to the chemisorbed CO2.
X-ray photoelectron spectroscopy (XPS) was used to detect the electronic state of Pt, Co and Al in the prepared samples. The spectra were measured using a SPECS spectrometer with Phoibos 150 1DDLD analyzer and monochromatized Al Kα (1486.7 eV) X-ray radiation in an ultrahigh vacuum. Binding energies were calibrated by taking the C 1s peak (284.6 eV) of adventitious carbon as a reference. The peaks were deconvoluted after Shirley background subtraction, using a mixed Gaussian-Lorentzian function and concentrations were calculated by correcting the values with relative atomic sensitivity factors (Scofield).
Nitrogen isotherms and XRD were carried out for samples reduced ex-situ in a tubular quartz reactor at 600 °C for 1 h (heating rate 5 °C/min) in 50% H2/He flow (50 mL/min).

3.3. Catalytic Activity

Liquid-phase WGS reaction was carried out in a Hastelloy fixed-bed up-flow reactor (Di = 5.1 mm; L = 305 mm) (Microactivity Effi, PID Eng&Tech). A total of 0.2 g of catalyst was used in each experiment and was placed between two quartz wool plugs in the middle of the reactor. A K-type thermocouple, inserted from the reactor top, measured the temperature of the catalytic bed. Prior to the reaction, the catalyst was reduced under 10% H2/He flow at 600 °C (0.3Pt/Al at 300 °C) for 2 h (heating rate 5 °C/min) at atmospheric pressure. After pressurizing, the reactor temperature was increased at a rate of 5 °C/min. He was switched to bypass when the set temperature was attained. The liquid stream was pumped using an HPLC pump (Gilson 307) and the gas inlet was regulated by a mass flow controller (Bronkhorst High-Tech, Ruurlo, The Netherlands). The reactor outlet stream was separated into liquid and gas products by cooling with a Peltier cell at near atmospheric pressure; otherwise, the analysis of the gas production would be affected by the gaseous compounds dissolved in the water solution. The output gas flow was passed through a 100 mL mixing vessel in order to minimize the pulses of gas products coming from the reactor, and it was analyzed online every 15 min by a gas chromatograph (μGC Agilent) equipped with four parallel columns.
For the liquid-phase WGS reaction, 0.04 mL/min of deionized water was fed together with 3.5 mL/min (STP) of pure CO (WHSV = 12.0 h−1, GHSV = 1,050 h−1, space-time = 76.8 kgcat·s/molCO), giving H2O/CO mole ratio = 15/1. The catalytic tests were carried out at 260 °C and 50 bar. Additional experiments co-feeding H2 were performed in the same reaction set-up and H2O/CO feed flowrate. Pure H2 was provided to obtain different H2/CO ratios (4/3, 7/3 and 12/3). Furthermore, additional experiments were conducted with 0.3Pt/CoAl catalysts in order to analyze the effects of reaction temperature and reaction pressure. In the first set of experiments, four levels of temperature were studied (220, 235, 245 and 260 °C), operating at H2/CO ratio = 12/3 and a steady pressure of 50 bar. In the second set of experiments, four levels of pressure were studied (25, 35, 40 and 50 bar) at isothermal conditions (220 °C) and H2/CO ratio = 12/3. The carbon balance was over 98% for all the experiments.
CO conversion (XCO), CO2 and CH4 yields (Yi, where i: CO2 or CH4) and net hydrogen variation (ΔH2) were calculated by using the corresponding inlet (Fin) and outlet (Fout) molar flow values:
X CO ( % ) = 100 × F CO in F CO out F CO in
Y i ( % ) = 100 × F in out F CO in
Δ H 2 ( % ) = 100 × F H 2 out F H 2 in F H 2 in
In all the experiments, traces of C2+ alkanes were detected (with yield below 0.1%). The sum of CO2 and CH4 yields matched the CO conversion, within the experimental error.
The different hydrodynamics of the APR reaction (where only liquid is fed and gas is formed) and the WGS carried out in this work (where both gas and liquid are co-fed) should be noted. In G–L–S catalytic systems, the liquid film around the catalyst particles can cause mass transfer limitations [42]. An important parameter in these kinds of systems is the liquid holdup (εL), which can cause the gas to bypass the catalyst for large εL values. The estimated εL values were below 20% for all the cases (Table S2, in Supplementary Materials).

3.4. Gas–Liquid Equilibrium Calculation

In order to gain knowledge on their solubility in water, Henry´s law constants (H) for the CO, CO2, H2 and CH4 gases were estimated, from the experimental data in reference [43]. The units of the constants were bar/mole fraction in gas. The temperature dependence of the constants has been described by the Van’t Hoff equation, which in its integrated form is the following:
H ( T ) = H ref · exp [ Δ sol H R ( 1 T 1 T ref ) ]
Href is the Henry’s constant at a reference temperature Tref = 298.15 K, and ∆solH is the enthalpy of dissolution. Table 6 shows the estimated H values.
The total pressure in the gas phase was due to the partial pressures of the gas compounds and to the partial pressure of the water vaporized in equilibrium with the liquid phase. Assuming liquid–vapor equilibrium for the water phase, the vapor pressure of water was calculated by the Antoine equation, and the obtained values are given in Table 6.
As seen in Table 6, the solubility of the gases in water decreased with temperature. Among them, CO2 and CH4 were the most and least soluble, the latter being the most sensitive to temperature. Interestingly, the solubility of H2 is almost twice of that of CO, which would decrease the H2/CO mole ratio in the gas phase. Indeed, the partial pressures of CO and H2 decreased with the increase of temperature, due to the increase in the partial pressure of water vapor.

4. Conclusions

The catalytic performance of the liquid-phase water–gas Shift (WGS) reaction and CO hydrogenation was investigated over bimetallic Pt-Co catalysts and their monometallic counterparts. Bimetallic xPt/CoAl catalysts clearly outperformed monometallic ones in all the investigated operating conditions (220 to 260 °C, 25 to 50 bar). The improved activity of these catalysts can be explained by their high density of basic sites, smaller particle size and the nature of the support. The strong Pt–Co interaction promoted reducibility and increased the availability of both metallic species.
It was concluded that bimetallic catalysts were more selective towards the WGS reaction than CO hydrogenation, despite the high availability of hydrogen in the reaction mixture. Furthermore, catalytic runs over 0.3Pt/CoAl with excess hydrogen in the feedstream demonstrated the positive effect of increasing temperature on WGS activity. The opposite effect was reported with increasing pressure, which led to improved methane production.
Apparent reaction rates and activation energies were also reported in this study. Further research should focus on a detailed numerical analysis in order to gain further insight into the rate-determining step and the reaction mechanism and elucidate whether gas or liquid phase water molecules are involved in the reaction mechanism. The characterization of spent catalysts is another issue that should be well investigated to shed light on metal state and possible carbon species formation on the sample surface.

Supplementary Materials

The following are available online at https://www.mdpi.com/2073-4344/10/8/830/s1. Figure S1: Nitrogen isotherms (A) and pore size distribution (B) of the calcined (solid lines) and reduced (dashed lines) samples, Figure S2: EDX spectra of reduced samples: (A) CoAl, (B) 0.3Pt/CoAl, (C) 1PtCoAl and (D) 0.3Pt/Al, Figure S3: XPS spectra corresponding to Pt 4d5/2, Figure S4: Outlet molar concentration of products during WGS reaction in the absence of hydrogen (H2/CO = 0). Reaction conditions: 260 °C/50 bar; Wcat (0.2 g), water (0.04 mL/min), CO (3.5 mL/min, STP), Figure S5: Outlet molar concentration of products during WGS experiments at different H2/CO ratios. Reaction conditions: 260 °C/50 bar; Wcat (0.2 g), water (0.04 mL/min), CO (3.5 mL/min, STP); H2/CO = 4/3 (0–10 h), H2/CO = 7/3 (11–20 h) and H2/CO = 4 (21–30 h), Figure S6: Outlet molar concentration of products during WGS experiments at different temperatures and pressures over Pt/CoAl. Reaction conditions: Wcat (0.2 g), water (0.04 mL/min), CO (3.5 mL/min, STP), H2 (14 mL/min, STP). Upper part: temperature variation (220, 235, 245, 260 °C) and 50 bar. Lower part: pressure variation (25, 35, 40, 50 bar) and 220 °C. Table S1. List of apparent activation energies reported in this work and in the literature for Pt catalysts. Table S2. Liquid holdup (εL), vapor composition and liquid/vapor distribution of CO and H2.

Author Contributions

Investigation and writing—original draft preparation, A.J.R.; conceptualization, methodology and writing—review and editing, J.L.A.; formal analysis and writing—review and editing, U.I.-V.; resources, funding acquisition and supervision, M.Á.G.-O. All authors have read and agreed to the published version of the manuscript.

Funding

This research was funded by Mineco (ENE2016-74850-R and PID2019-106692EB-I00) and FEDER. The APC was funded by ENE2016-74850-R. A.J.R. was supported by a PhD research fellowship provided by the University of the Basque Country UPV/EHU (PIF-17/319).

Acknowledgments

The authors are grateful for the technical support provided by SGIker of UPV/EHU and European funding (ERDF and ESF). The TEM measurements were conducted at the Laboratorio de Microscopías Avanzadas, Instituto de Nanociencia de Aragon, University of Zaragoza, Spain.

Conflicts of Interest

The authors declare no conflict of interest. The funders had no role in the design of the study; in the collection, analyses, or interpretation of data; in the writing of the manuscript, or in the decision to publish the results.

References

  1. Burns, D.T.; Piccardi, G.; Sabbatini, L. Some people and places important in the history of analytical chemistry in Italy. Microchim. Acta 2007, 160, 57–87. [Google Scholar] [CrossRef]
  2. Meland, H.; Johannessen, T.; Arstad, B.; Venvik, H.J.; Rønning, M.; Holmén, A. Preparation of low temperature water-gas shift catalysts by flame spray pyrolysis. Stud. Surf. Sci. Catal. 2006, 162, 985–992. [Google Scholar] [CrossRef]
  3. Damma, D.; Boningari, T.; Smirniotis, P. High-temperature water-gas shift over Fe/Ce/Co spinel catalysts: Study of the promotional effect of Ce and Co. Mol. Catal. 2018, 451, 20–32. [Google Scholar] [CrossRef]
  4. Noor, T.; Gil, M.V.; Chen, D. Production of fuel-cell grade hydrogen by sorption enhanced water gas shift reaction using Pd/Ni–Co catalysts. Appl. Catal. B Environ. 2014, 150, 585–595. [Google Scholar] [CrossRef] [Green Version]
  5. Pardey, A.J.; Ford, P.C. Homogeneous catalysis of the water-gas shift reaction by rhodium complexes in aqueous substituted pyridine solutions. J. Mol. Catal. 1989, 53, 247–263. [Google Scholar] [CrossRef]
  6. Laine, R.M.; Crawford, E.J. Homogeneous catalysis of the water-gas shift reaction. J. Mol. Catal. 1988, 44, 357–387. [Google Scholar] [CrossRef]
  7. Wolf, P.; Aubermann, M.; Wolf, M.; Bauer, T.; Blaumeiser, D.; Stepic, R.; Wick, C.R.; Smith, D.M.; Smith, A.-S.; Wasserscheid, P.; et al. Improving the performance of supported ionic liquid phase (SILP) catalysts for the ultra-low-temperature water–gas shift reaction using metal salt additives. Green Chem. 2019, 21, 5008–5018. [Google Scholar] [CrossRef]
  8. Kim, M.-S.; Fitriana, H.N.; Kim, T.W.; Kang, S.G.; Jeon, S.G.; Chung, S.H.; Park, G.W.; Na, J.-G. Enhancement of the hydrogen productivity in microbial water gas shift reaction by Thermococcus onnurineus NA1 using a pressurized bioreactor. Int. J. Hydrogen Energy 2017, 42, 27593–27599. [Google Scholar] [CrossRef]
  9. Cortright, R.D.; Davda, R.R.; Dumesic, J.A. Hydrogen from catalytic reforming of biomass-derived hydrocarbons in liquid water. Nature 2002, 418, 964–967. [Google Scholar] [CrossRef]
  10. Davda, R.; Shabaker, J.; Huber, G.; Cortright, R.; Dumesic, J.A. Aqueous-phase reforming of ethylene glycol on silica-supported metal catalysts. Appl. Catal. B Environ. 2003, 43, 13–26. [Google Scholar] [CrossRef]
  11. D’Angelo, M.F.N.; Schouten, J.C.; Van Der Schaaf, J.; Nijhuis, T. Three-Phase Reactor Model for the Aqueous Phase Reforming of Ethylene Glycol. Ind. Eng. Chem. Res. 2014, 53, 13892–13902. [Google Scholar] [CrossRef]
  12. Guo, Y.; Azmat, M.U.; Liu, X.; Wang, Y.; Lu, G. Effect of support’s basic properties on hydrogen production in aqueous-phase reforming of glycerol and correlation between WGS and APR. Appl. Energy 2012, 92, 218–223. [Google Scholar] [CrossRef]
  13. Ciftci, A.; Ligthart, D.M.; Sen, A.O.; Van Hoof, A.; Friedrich, H.; Hensen, E.J. Pt-Re synergy in aqueous-phase reforming of glycerol and the water–gas shift reaction. J. Catal. 2014, 311, 88–101. [Google Scholar] [CrossRef]
  14. Ripken, R.M.; Meuldijk, J.; Gardeniers, H.J.; Le Gac, S. Influence of the Water Phase State on the Thermodynamics of Aqueous-Phase Reforming for Hydrogen Production. ChemSusChem 2017, 10, 4909–4913. [Google Scholar] [CrossRef] [PubMed] [Green Version]
  15. Godina, L.I.; Kirilin, A.V.; Tokarev, A.V.; Simakova, I.L.; Murzin, D.Y. Sibunit-Supported Mono- and Bimetallic Catalysts Used in Aqueous-Phase Reforming of Xylitol. Ind. Eng. Chem. Res. 2018, 57, 2050–2067. [Google Scholar] [CrossRef]
  16. Reynoso, A.; Ayastuy, J.; Iriarte-Velasco, U.; Gutiérrez-Ortiz, M. Chemical Technologies for the Environmental Sustainability Group Cobalt aluminate spinel-derived catalysts for glycerol aqueous phase reforming. Appl. Catal. B Environ. 2018, 239, 86–101. [Google Scholar] [CrossRef]
  17. Kirilin, A.V.; Tokarev, A.V.; Manyar, H.; Hardacre, C.; Salmi, T.; Mikkola, J.-P.; Murzin, D.Y. Aqueous phase reforming of xylitol over Pt-Re bimetallic catalyst: Effect of the Re addition. Catal. Today 2014, 223, 97–107. [Google Scholar] [CrossRef]
  18. Subramanian, N.D.; Callison, J.; Catlow, C.R.A.; Wells, P.P.; Dimitratos, N. Optimised hydrogen production by aqueous phase reforming of glycerol on Pt/Al2O3. J. Hydrogen Energy 2016, 41, 18441–18450. [Google Scholar] [CrossRef]
  19. De León, J.D.; Loera-Serna, S.; Zepeda, T.; Domínguez, D.; Pawelec, B.; Venezia, A.; Fuentes-Moyado, S. Noble metals supported on binary γ-Al2O3-α-Ga2O3 oxide as potential low-temperature water-gas shift catalysts. Fuel 2020, 266. [Google Scholar] [CrossRef]
  20. Zhang, S.; Shan, J.; Zhu, Y.; Frenkel, A.I.; Patlolla, A.; Huang, W.; Yoon, S.J.; Wang, L.; Yoshida, H.; Takeda, S.; et al. WGS Catalysis and In Situ Studies of CoO1–x, PtCon/Co3O4, and PtmCom′/CoO1–x Nanorod Catalysts. J. Am. Chem. Soc. 2013, 135, 8283–8293. [Google Scholar] [CrossRef]
  21. Dietrich, P.J.; Akatay, M.C.; Sollberger, F.G.; Stach, E.A.; Miller, J.T.; Delgass, W.N.; Ribeiro, F.H. Effect of Co Loading on the Activity and Selectivity of PtCo Aqueous Phase Reforming Catalysts. ACS Catal. 2014, 4, 480–491. [Google Scholar] [CrossRef]
  22. Dosso, L.A.; Vera, C.R.; Grau, J.M.; Grau, J.M. Aqueous phase reforming of polyols from glucose degradation by reaction over Pt/alumina catalysts modified by Ni or Co. Int. J. Hydrogen Energy 2017, 42, 18853–18864. [Google Scholar] [CrossRef]
  23. Le, T.A.; Kim, M.S.; Lee, S.H.; Park, E.D. CO and CO2 Methanation Over Supported Cobalt Catalysts. Top. Catal. 2017, 60, 714–720. [Google Scholar] [CrossRef]
  24. Reynoso, A.; Iriarte-Velasco, U.; Gutiérrez-Ortiz, M.A.; Ayastuy, J. Highly stable Pt/CoAl2O4 catalysts in Aqueous-Phase Reforming of glycerol. Catal. Today 2020. [Google Scholar] [CrossRef]
  25. Benvenutti, E.V.; Franken, L.; Moro, C.; DaVanzo, C.U. FTIR Study of Hydrogen and Carbon Monoxide Adsorption on Pt/TiO2, Pt/ZrO2, and Pt/Al2O3. Langmuir 1999, 15, 8140–8146. [Google Scholar] [CrossRef]
  26. Liu, Y.; Jia, L.; Hou, B.; Sun, D.; Li, D. Cobalt aluminate-modified alumina as a carrier for cobalt in Fischer–Tropsch synthesis. Appl. Catal. A Gen. 2017, 530, 30–36. [Google Scholar] [CrossRef]
  27. Zhang, J.-M.; Sun, S.-N.; Li, Y.; Zhang, X.; Zhang, P.-Y.; Fan, Y.-J. A strategy in deep eutectic solvents for carbon nanotube-supported PtCo nanocatalysts with enhanced performance toward methanol electrooxidation. Int. J. Hydrogen Energy 2017, 42, 26744–26751. [Google Scholar] [CrossRef]
  28. Khassin, A.; Yurieva, T.M.; Kaichev, V.; Bukhtiyarov, V.I.; Budneva, A.A.; Paukshtis, E.A.; Parmon, V.N. Metal–support interactions in cobalt-aluminum co-precipitated catalysts: XPS and CO adsorption studies. J. Mol. Catal. A Chem. 2001, 175, 189–204. [Google Scholar] [CrossRef]
  29. Bergman, S.L.; Granestrand, J.; Tang, Y.; París, R.S.; Nilsson, M.; Tao, F.F.; Tang, C.; Pennycook, S.J.; Pettersson, L.J.; Bernasek, S.L. In-situ characterization by Near-Ambient Pressure XPS of the catalytically active phase of Pt/Al2O3 during NO and CO oxidation. Appl. Catal. B Environ. 2018, 220, 506–511. [Google Scholar] [CrossRef]
  30. Kannan, S.; Swamy, C. Catalytic decomposition of nitrous oxide over calcined cobalt aluminum hydrotalcites. Catal. Today 1999, 53, 725–737. [Google Scholar] [CrossRef]
  31. Iriondo, A.; Cambra, J.F.; Barrio, V.; Güemez, M.; Arias, P.L.; Sanchez-Sanchez, M.; Navarro, R.; Fierro, J.L.G. Glycerol liquid phase conversion over monometallic and bimetallic catalysts: Effect of metal, support type and reaction temperatures. Appl. Catal. B Environ. 2011, 106, 83–93. [Google Scholar] [CrossRef]
  32. De Farias, A.M.D.; Barandas, A.P.; Perez, R.F.; Fraga, M. Water-gas shift reaction over magnesia-modified Pt/CeO2 catalysts. J. Power Sources 2007, 165, 854–860. [Google Scholar] [CrossRef]
  33. Dietrich, P.J.; Sollberger, F.G.; Akatay, M.C.; Stach, E.A.; Delgass, W.N.; Miller, J.T.; Ribeiro, F.H. Structural and catalytic differences in the effect of Co and Mo as promoters for Pt-based aqueous phase reforming catalysts. Appl. Catal. B Environ. 2014, 156, 236–248. [Google Scholar] [CrossRef]
  34. Miao, B.; Ma, S.S.K.; Wang, X.; Su, H.; Chan, S.H. Catalysis mechanisms of CO2 and CO methanation. Catal. Sci. Technol. 2016, 6, 4048–4058. [Google Scholar] [CrossRef]
  35. Chen, W.; Pestman, R.; Zijlstra, B.; Filot, I.A.W.; Hensen, E.J. Mechanism of Cobalt-Catalyzed CO Hydrogenation: Methanation. ACS Catal. 2017, 7, 8050–8060. [Google Scholar] [CrossRef] [PubMed]
  36. Liu, Q.; Bian, B.; Fan, J.; Yang, J. Cobalt doped Ni based ordered mesoporous catalysts for CO2 methanation with enhanced catalytic performance. Int. J. Hydrogen Energy 2018, 43, 4893–4901. [Google Scholar] [CrossRef]
  37. Jahangiri, H.; Bennett, J.; Mahjoubi, P.; Wilson, K.; Gu, S. A review of advanced catalyst development for Fischer–Tropsch synthesis of hydrocarbons from biomass derived syn-gas. Catal. Sci. Technol. 2014, 4, 2210–2229. [Google Scholar] [CrossRef] [Green Version]
  38. Herranz, T.; Deng, X.; Cabot, A.; Guo, J.; Salmeron, M. Influence of the Cobalt Particle Size in the CO Hydrogenation Reaction Studied by In Situ X-Ray Absorption Spectroscopy. J. Phys. Chem. B 2009, 113, 10721–10727. [Google Scholar] [CrossRef] [Green Version]
  39. Xiang, Y.; Kovarik, L.; Kruse, N. Rate and selectivity hysteresis during the carbon monoxide hydrogenation over promoted Co/MnOx catalysts. Nat. Commun. 2019, 10, 3953–3957. [Google Scholar] [CrossRef] [Green Version]
  40. Shabaker, J. Aqueous-phase reforming of methanol and ethylene glycol over alumina-supported platinum catalysts. J. Catal. 2003, 215, 344–352. [Google Scholar] [CrossRef]
  41. Catti, M.; Ghaani, M.R.; Pinus, I. Overpressure Role in Isothermal Kinetics of H2 Desorption–Absorption: The 2LiBH4–Mg2FeH6 System. J. Phys. Chem. C 2013, 117, 26460–26465. [Google Scholar] [CrossRef]
  42. Lévêque, J.; Philippe, R.; Zanota, M.-L.; Meille, V.; Sarrazin, F.; Baussaron, L.; De Bellefon, C. Hydrodynamics and mass transfer in a tubular reactor containing foam packings for intensification of G-L-S catalytic reactions in co-current up-flow configuration. Chem. Eng. Res. Des. 2016, 109, 686–697. [Google Scholar] [CrossRef]
  43. Sander, R. Compilation of Henry’s law constants (version 4.0) for water as solvent. Atmos. Chem. Phys. Discuss. 2015, 15, 4399–4981. [Google Scholar] [CrossRef] [Green Version]
Figure 1. XRD patterns of (A) calcined and (B) reduced samples.
Catalysts 10 00830 g001
Figure 2. H2-TPR profiles of prepared samples.
Catalysts 10 00830 g002
Figure 3. STEM micrographs and size distribution histogram of the reduced samples: (A) CoAl, (B) 0.3Pt/CoAl, (C) 1Pt/CoAl and (D) 0.3Pt/Al.
Catalysts 10 00830 g003aCatalysts 10 00830 g003b
Figure 4. XPS spectra corresponding to (A) Co 2p and (B) Al 2p for reduced samples.
Catalysts 10 00830 g004
Figure 5. CO conversion and product yields in liquid phase WGS reaction at 260 °C/50 bar and TOS =t 10 h. Feedstream: H2O/CO = 15/1 mol ratio, space-time = 76.8 kgcat·s/molCO.
Catalysts 10 00830 g005
Figure 6. Schematic representation of the water–gas shift (WGS) reaction mechanisms for aqueous-phase reforming (APR) reacting H2O from liquid (A) or vapor (B) phase.
Catalysts 10 00830 g006
Figure 7. Catalytic activity in the WGS reaction at 260 °C/50 bar and H2 co-feeding: (A) CO conversion and (B) product yield. Reaction conditions: Wcat = 0.2 g, FH2O = 0.04 mL/min, FCO = 3.5 mL/min.
Catalysts 10 00830 g007
Figure 8. Net hydrogen variation in WGS reaction feeding H2 at 260 °C/50 bar. Reaction conditions: Wcat = 0.2 g, FH2O = 0.04 mL/min, FCO = 3.5 mL/min.
Catalysts 10 00830 g008
Figure 9. (A) Conversion of CO in WGS reaction feeding H2 over 0.3Pt/CoAl catalyst at 50 bar; (B) Arrhenius plot. Reaction conditions: Wcat = 0.2 g, FH2O = 0.04 mL/min, FCO = 3.5 mL/min, FH2 = 14 mL/min.
Catalysts 10 00830 g009
Figure 10. Conversion of CO in the presence of hydrogen over 0.3Pt/CoAl catalyst at 220 °C. Reaction conditions: Wcat = 0.2 g, FH2O = 0.04 mL/min, FCO = 3.5 mL/min, FH2 = 14 mL/min.
Catalysts 10 00830 g010
Figure 11. Evolution of product yields as a function of (A) temperature at P = 50 bar and (B) pressure at T = 220 °C over 0.3Pt/CoAl. Reaction conditions: Wcat = 0.2 g, FH2O = 0.04 mL/min, FCO = 3.5 mL/min, FH2 = 14 mL/min.
Catalysts 10 00830 g011
Figure 12. Net hydrogen variation in experiments with H2 co-feeding over 0.3Pt/CoAl catalyst at 50 bar (upper part) and 220 °C (lower part). Reaction conditions: Wcat = 0.2 g, FH2O = 0.04 mL/min, FCO = 3.5 mL/min, FH2 = 14 mL/min.
Catalysts 10 00830 g012
Table 1. Physico-chemical properties of the catalysts.
Catalyst Actual Pt a (wt.%)Bulk Co/Al aSBET b (m2/g)dpore b (nm)Vpore b (cm3/g)dspinel c (nm)dCo d (nm)a c (nm)
CoAl00.634125 (102)6.8 (11.8)0.28 (0.38)5.014.70.8042 ± 0.0014
0.3Pt/CoAl0.290.633146 (131)12.7 (14.8)0.56 (0.52)6.36.90.8052 ± 0.0011
1Pt/CoAl1.090.623139 (126)12.8 (14.9)0.54 (0.51)6.36.50.8063 ± 0.0060
0.3Pt/Al0.36n.d.138 (138)3.9 (4.0)0.19 (0.20)n.d.n.d.n.d.
a from ICP-AES. b from nitrogen isotherms. In parentheses are values for the reduced samples. c lattice parameter from XRD of the calcined samples. d metallic cobalt size from XRD of the reduced samples.
Table 2. Results from H2-TPR, H2 chemisorption and CO2-TPD studies.
CatalystH2 Uptake
(mmolH2/g)
Exposed Metal a (at.Pt/gcat)DPt (%)Surface Basic Sites Density c (µmolCO2/m2)
TotalBelow 250 °CCo0Pt0H2 Chem. aTEM b
CoAl7.04n.a.23.0·10180n.d.n.d.1.90
0.3Pt/CoAl7.290.516 (0.0149)30.4·10185.2·101858721.16
1Pt/CoAl7.360.659 (0.0559)25.5·101820.7·101862631.34
0.3Pt/Al0.350.0195 (0.0185)06.9·101862640.32
In parentheses is the theoretical amount assuming PtO species. a from H2 pulse chemisorption. b determined by TEM analysis. c from the sample mass gain in TGA.
Table 3. Binding energy values from XPS analysis.
Catalyst Al 2p (ev)Co 2p3/2 (eV)Pt 4d5/2 (eV)Surface Co/Al a
Co2+Co0Pt2+Pt0
CoAl75.6 (74.2)781.6 (781.3)n.d. (778.0)n.a.n.a.0.266 (0.139)
0.3Pt/CoAl74.2 (74.2)781.1 (781.6)n.d. (778.2)316.8 (n.d.)n.d. (314.0)0.271 (0.184)
1Pt/CoAl74.2 (74.2)781.2 (781.5)n.d. (778.2)317.7 (n.d.)n.d. (314.2)0.271 (0.186)
0.3Pt/Al74.0 (73.5)n.d.n.d.315.5 (n.d.)n.d. (313.8)n.d.
In parentheses are values for reduced samples. a from XPS of calcined samples.
Table 4. YCO2/YCH4 yields ratio for all the experiments.
Effect of FeedstockTemperature Effect
(@ 50 bar)
Pressure Effect
(@ 260 °C)
Catalyst H2/CO RatioTemperature (°C)YCO2/YCH4 for 0.3Pt/CoAlPressure (bar)YCO2/YCH4 for 0.3Pt/CoAl
04/37/312/3
CoAl30.88.56.74.62200.97258.2
0.3Pt/CoAl70.370.712.211.02353.5352.4
1Pt/CoAl50.762.421.721.92456.0402.1
0.3Pt/Al88.1131.7106.759.426011.0500.97
Table 5. Apparent reaction rate normalized per Pt site (rapp,co) on the H2 chemisorption basis.
Temperature (°C)rapp,co (s−1)
2200.255
2350.332
2450.507
2600.654
Table 6. Estimated H values and vapor pressure of water.
CompoundsolH (kJ/mol)H (bar/mole Fraction) (·10−4)
@ 220 °C@ 235 °C@ 245 °C@ 260 °C
CO10.832.034.636.439.0
CO219.94.04.75.15.8
H24.414.314.815.115.5
CH415.849.255.159.265.6
Vapor pressure of water (bar) 23.2030.7836.7747.36

