Abstract
Soybean is one of the essential ingredients when formulating a tube feeding formula. In this study, we initially focused on determining which enzyme is suitable for hydrolyzing soy and comparing the soy protein enzymatic hydrolysis of three different enzymes at the same enzyme content: Flavourzyme, Protamex, and Alcalase. The result showed that Flavourzyme attained the highest soluble protein recovery efficiency (SPRE). Secondly, the study determined the effect of thermal treatment conditions such as thermal treatment duration, and then it showed that when combining the thermal treatment and enzymatic hydrolysis, the yield reached (61.44 ± 0.22)%, which was much higher than only using enzymatic hydrolysis (52.57 ± 0.27)%. Next, optimizing the enzymatic hydrolysis (combining thermal treatment) using Flavourzyme and Alcalase, Flavourzyme achieved (62.47 ± 0.12)%, while Alcalase attained (41.32 ± 0.13)%. The soy hydrolyzate using Flavourzyme achieved an average molecular size of 3.19 kDa at the following optimizing conditions: enzyme concentration, 16.09 U·g−1; pH, 7.02; temperature, 45.8 °C; and beans/water ratio, 1:3. In contrast, when using Alcalase, the soy hydrolyzate achieved an average molecular size of 1.52 kDa at the following optimizing conditions: enzyme concentration, 28.01 U·g−1; pH, 7.2; temperature, 56.5 °C; beans/water ratio, 1:4.6. Soy protein hydrolyzate of suitable viscosity and particle size flow through the inhaler with branched-chain amino acids achieved a BCAA (Branched Amino Acid) ratio of 2:1:1 for Alcalase and 4:1:1 for Flavourzyme. Soybean hydrolyzate using both enzymes attained a high SPRE and was suitable for the digestive ability of patients recovering from surgery. Soy protein is divided into amino acids, di- and tri-amino acids, and peptides to create a soluble protein source that helps feed patients with a sonde tube easily. In addition, the molecular weight of peptides will reduce viscosity significantly when passing through a sonde tube, preventing tube congestion.
1. Introduction
The role of biofunctional peptides in diet and nutrition products for patients is increasingly noticeable because the biological functional peptides are protein parts that have a good effect on the function, condition, or physiology of the body. The most common method for making biopeptides is to use protein hydrolytic enzymes; many biological peptides are made by hydrolysis by digestive enzymes (pepsin, trypsin, chymotrypsin) or proteases from fungi or microorganisms (such as Alcalase) [1,2,3]. Protein hydrolysates containing short-chain amino acids and peptides with different molecular weights are a trend for formula-fed products and show superiority over single-molecule formulations. Protein uptake can occur immediately in the form of peptides and is more effective than the absorption of single amino acids thanks to the specific peptide transport system and the hydrolysis of intestinal peptidases [4,5]. Numerous studies show that feeding foods similar to the normal diet improves digestibility, supporting nutrition for patients. However, the difficulties encountered when preparing liquid foods containing nutrients from natural food ingredients can become blocked when flowing through the nebulizer. Levine et al. (1985) reported that a lack of knowledge of food science and technology among health professionals contributed to the problems related to producing feeding products in the health field [6]. In this study, it is necessary to determine the appropriate enzyme to hydrolyze and the proper soybean pretreatment to form peptides and amino acids with a molecular weight that is suitable for the poor digestion capability of the patient and an appropriate viscosity to flow through sonde tubes.
2. Materials and Methods
2.1. Materials
2.1.1. Soybean
The soybeans were supplied by MTV Long Han Phu Ltd., Company (Ho Chi Minh City, Vietnam). The soybeans were packed in a polyethylene plastic bag after classifying and sent to our laboratory to ensure the quality of ingredients. The soybeans were stored at 25 °C to create stability in nutrient composition and ensure the quality of material used in the research. Soybeans are an excellent source of fiber as well as primarily a plant protein, so it is often used as a source of fiber in many feeding foods [7,8,9]. Due to fiber fermentation, it produces short-chain fatty acids (mainly butyrates) that are the power for intestinal villi [10,11]. The crude composition of the soybean included moisture content (10 ± 14)%, lipid content (11 ± 15)%, protein content (33 ± 39)%; the surface was dry, clean, and free of impurities. Beans were soaked in water following a specified water/material ratio of 1:3 and maintained at the temperature of 40 °C.
2.1.2. Enzyme and Reagent
Flavourzyme (enzyme activity 500 LAPU/g), Protamex (enzyme activity 1.5 AU/g), and Alcalase (enzyme activity 2.4 AU/g) were purchased from Novozyme® Denmark. Protamex and Alcalase were from a Bacillus protease complex, while Flavourzyme was derived from Aspergillus oryzae. Flavourzyme and Protamex give a bit or no bitterness to products [12,13]. Alcalase is considered the most effective enzyme to produce a high percentage of protein recovery [14]. These enzymes were stored in a sealed bottle at 5 °C to ensure the enzyme quality and activity. Chymotrypsin and trypsin were purchased from Sigma-Aldrich (Singapore), while Pepsin was purchased from Himedia (India). All of the other chemicals used in this study were of analytical grade.
2.2. Methods
2.2.1. Preparation of Soybean Protein Hydrolysate
Soy protein hydrolysate was prepared from local ingredients. To be specific, the soybeans, following a specified water/material ratio ranging from 1:2 to 1:5, were cooked in a pressure cooker (120 °C, 1.2 atm), and maintained at this temperature for 10, 15, 20, 25, and 30 min. The ratio between beans and water, as well as the time of thermal pre-treatment giving the highest protein recovery efficiency, were chosen for the optimization study. During the boiling, the pot was covered in order to prevent water loss. The total protein concentration was determined by Lowry assay [15], based on the color change of the sample solution in proportion to the protein concentration, which can be measured by using a UV-Vis Spectrophotometer [16]. Figure 1 showed the research process:
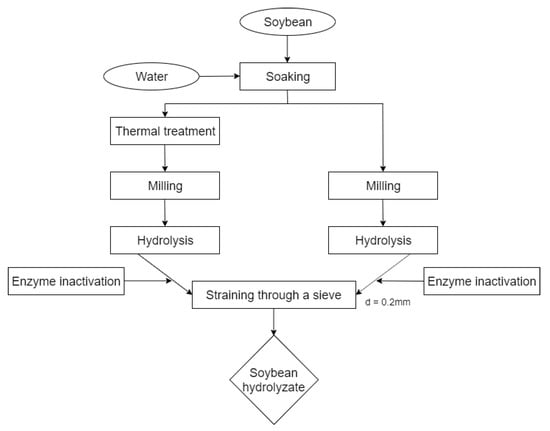
Figure 1.
The process of the study.
2.2.2. Enzymatic Hydrolysis of Soybean
To determine the effects of thermal pre-treatment, we carried out two different hydrolysis processes: one with a combination of thermal treatment and enzymatic hydrolysis and one with only enzymatic hydrolysis.
- -
- Process 1: only enzymatic hydrolysis
The hydrolysis of soybeans for each commercial food grade proteinase was carried out at the suggested conditions by their manufacturer. The ratio between soybean and water ranged from 1:3 to 1:7. In our research, soybean hydrolysis using enzyme Flavourzyme R was carried out at the varying conditions including temperature 40–60 °C, d = 5 °C; duration 60–180 min, d = 30 min; pH 5–7, d = 0.5 and concentration of the enzyme–substrate complex (E/S) 2.5 mL·100 g−1–17.5 mL·100 g−1, d = 2.5 mL·100 g−1.
- -
- Process 2: the combination of thermal treatment and enzymatic hydrolysis.
After thermal pre-treatment, soybean hydrolysis using enzyme Flavourzyme R and Alcalase R was conducted at the varying conditions including: temperature 40–60 °C, d = 5 °C; duration 90–210 min, d = 30 min; pH 5–8, d = 0.5 and concentration of the enzyme–substrate complex (E/S) 1 mL·100 g−1–9 mL·100 g−1, d = 2 mL·100 g−1. Enzymatic hydrolysis was carried out in a thermostatic tank. Once the enzymatic hydrolysis was completed, the hydrolysis process of the mixture was ceased by heating to inactivate the enzyme. Following that, the soybean soup was filtered, and 100 g of the hydrolysate was packed into bags for further analysis.
2.2.3. Enzyme Activity Determination
The activity of an enzyme preparation is specific to the purity of the enzyme preparation. The specific activity is expressed as the number of enzyme units/mg of protein (U/mg protein), in which the protein content is determined by the Lowry method. The Lowry protein assay is based on the biuret reaction with additional steps and reagents to increase the sensitivity of detection. A Folin–Ciocalteu reagent was used. This reagent interacts with the cuprous ions and the side chains of tyrosine, tryptophan, and cysteine to produce a blue-green color that can be detected at 660 nm.
2.2.4. Molecular Mass Distribution
Gel filtration chromatography (GPC) [17] was used to analyze the molecular mass distribution of the peptides in the hydrolysates. The mobile phase mixed 0.1 M sodium nitrate solution with distilled water twice, after which it was filtered through a 0.45 µm filter. Then, we subjected the air bubbles to ultrasound for 45 min. Static phase: Ultra hydrogel 500 column (300 mm × 7.8 mm ID). Column furnace temperature: 30 °C, probe temperature 35 °C, mobile phase flow rate: 1 mL/min, and injection volume: 20 µL.
2.2.5. Statistical Analysis
All experiments were repeated at least three times. The experimental results presented are the average values of the repetitions. Data were subjected to analysis of variance by ANOVA; mean values were accepted as significantly different at the 95% level (H0: p < 0.05). In this study, the statistical program Minitab 18 and Microsoft Excel software were used for data processing and statistical analysis. The comparison of means is analyzed by the Tukey test.
3. Results and Discussion
3.1. Enzyme Selection for Soybean Hydrolysis
To select an enzyme that is suitable for the soybean hydrolysis process, three commercial enzymes (Alcalase, Protamex, Flavourzyme) were experimented on soybean. Based on previous results, the enzyme activity was 15.54 U·g−1 and the hydrolysis time was selected as 180 min in this experiment. This activity corresponds to an E/S concentration of Alcalase 0.95%; Protamex 0.96%; and Flavourzyme 7 mL·100 g−1. Table 1 detailed the hydrolysis conditions for this experiment and described the experimental results.

Table 1.
Viscosity of soy protein hydrolysates using protease enzymes.
Table 1 shows that soybean soup using Flavourzyme had the highest SPRE (58.79 ± 0.21%) compared to Alcalase and Protamex (29.62 ± 0.003% and 18.85 ± 0.11%). Alcalase showed the lowest viscosity (8.3 ± 0.1 cP) compared to Flavourzyme and Protamex (9.6 ± 0.1 cP and 13.4 ± 0.1 cP). As a result of the feeding product properties, the viscosity index and the proportion of amino acids generated, as well as the molecular size of the hydrolyzate, are quite significant, so in this study, we continue to use Flavourzyme and Alcalase enzymes to find the most effective enzyme for soybean enzymatic hydrolysis. When it comes to sensory evaluation, Flavourzyme prevailed over Alcalase and Protamex because of creating hydrolyzed products without bitterness. The study of Seo et al. (2008) researched the bitterness of hydrolyzed products from soybean using enzymes (Flavourzyme, Alcalase, Neutrase, Protamex, Papain, and Bromelain) and found that as the level of protein hydrolysate increased, the level of protein hydrolysis increased. The bitter taste was caused by the production of peptide chains containing hydrophobic amino acids. However, Flavourzyme is the opposite, as the level of hydrolysis increases gradually without causing a bitter taste. Many studies have shown that Flavourzyme effectively hydrolyzes hydrophobic peptides containing amino acids at the –NH2 group at the end of the vessels, reducing the bitter taste of hydrolyzed products [18,19,20]. From the preliminary results, we conducted research focusing on the enzymatic hydrolysis conditions using Flavourzyme in the absence of heat treatment and with heat treatment to determine the conditions giving the highest SPRE.
3.2. Single Factor Analysis for the Soluble Protein Extraction by Flavourzyme without Thermal Pre-Treatment
3.2.1. Soybean/Water Ratio (w/w)
Several studies have demonstrated that the substrate/water ratio affects the efficiency of hydrolysis. According to Figure 2, in turn, changing the soybean/water ratio to 1/3, 1/4, 1/5, 1/6, and 1/7, the highest ratio of soybean/water to the ratio of SPRE reached 47.33%.
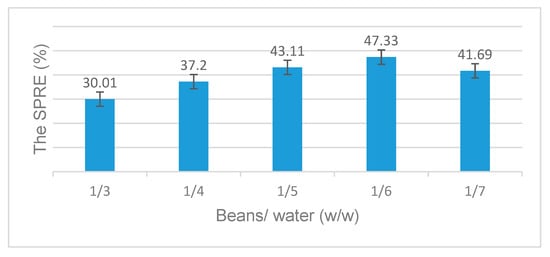
Figure 2.
The effect of beans/water ratio on the SPRE.
3.2.2. Enzyme Content
Next, we investigated the effect of enzyme content on the hydrolysis process by Flavourzyme to determine the suitable enzyme for hydrolysis to achieve the best SPRE. Figure 3 shows that increasing the enzyme content from 2.5 to 5, 7.5, 10, and 12.5 mL·100 g−1 (corresponding to the activity of 5.55 U·g−1, 11.1 U·g−1, 16.65 U·g−1, 22.20 U·g−1, and 27.75 U·g−1), the SPRE gradually increased from 30.68% to 50.35%. Continuing to increase the enzyme content to 15–17.5 mL·100 g−1 (corresponding to activity 33.30 ug−1, 38.85 U·g−1), the SPRE reached equilibrium. Therefore, the enzyme content of 12.5 mL·100 g−1 was selected for the next experiments.
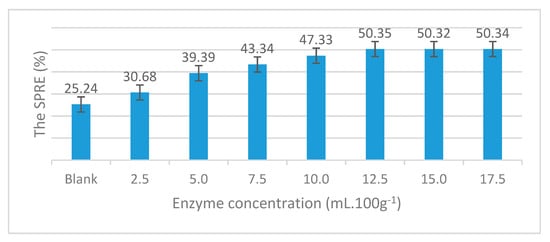
Figure 3.
The effect of enzyme content on the SPRE.
3.2.3. pH
pH plays an important role in moderating enzyme activity due to its strong influence on the ionization of protein and enzyme stability. The soluble protein recovery efficiency depends on the optimal pH, so pH is the top-priority factor to be identified. In addition, the optimal pH for hydrolysis varies depending on the substrate. To be specific, when using Alcalase, upon the substrate of salmon skin, optimal enzymatic hydrolysis was found to correspond with the pH of 8.39 [21]. The hydrolysis values of the blood of basa fish and fish waste of iridescent shark were 7.05 and 9.45, respectively [22,23]. According to the survey results, when the pH increased from 5 to 5.5, 6, and 6.5, then the SPRE increased. Continuing to increase from 6.5 to 7, the SPRE tended to decrease. From Figure 4, it is found that at pH 6.5, the SPRE was the highest (52.48%). Therefore, pH 6.5 is chosen as the appropriate pH for the enzymatically hydrolyzed soy protein using Flavourzyme.
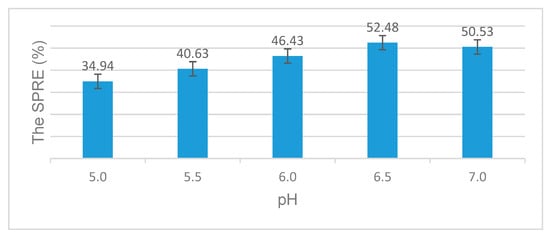
Figure 4.
The effect of pH on the SPRE.
This phenomenon is explained as follows: pH affects the reaction speed because the changing pH affects the ionization status of the ionizing functional groups involved in the enzyme activity center, changing the ability of the enzyme to link with the substrate and changing the enzyme catalytic activity as well. Besides, the enzyme’s nature is protein, so pH also affects its durability.
3.2.4. Hydrolysis Temperature
Each enzyme exhibits an optimal rate of reaction depending on the type of enzyme and substrate. In this analysis, experiments were conducted at different temperatures to find out the optimal hydrolysis temperature for maximizing the protein retention. The experiments were conducted at pH 6.5 and used the enzyme content of 12.5 mL·100 g−1, which was chosen in the previous experiments. Figure 5 shows the influence of hydrolysis temperature. It was indicated in Figure 5 that the SPRE peaked at the temperature of 50 °C and decreased thereafter.
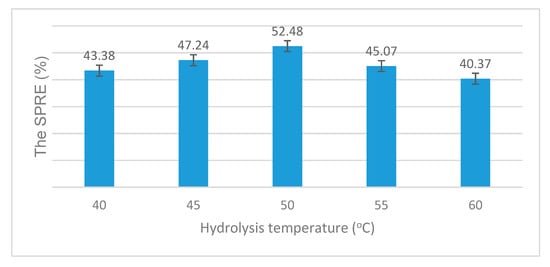
Figure 5.
The effect of hydrolysis temperature on the SPRE.
The improved recovery rate experienced when raising the heat could be explained by the acceleration of enzymatic reactions within the optimal temperature range. In the temperature range from 45 to 50 °C, the increasing trend of SPRE could be attributed to the greater kinetic energy of the enzyme molecules. Enhancing the contact between the enzyme and substrate improves the effectiveness of the protein hydrolysis, leading to a higher SPRE. Besides, an excessively high temperature causes enzymes to denature or inactivate. The denaturation is irreversible and difficult to recover, overturning the substrate contact and in turn, lowering the SPRE. In this study, the best hydrolysis efficiency is with an SPRE of 52.48%, which was attained at 50 °C.
3.2.5. Hydrolysis Duration
The hydrolysis time is positively correlated with hydrolysis efficiency. In this experiment, the time varied from 60 to 180 min to investigate its effect on the recovered protein. Figure 6 shows that generally, the substrate hydrolysis reaction occurs quickly in the first 2 h; the SPRE increased from 25.24% to 52.57%. After that, even if it increased to 150 or 180 min, the SPRE reached equilibrium. Therefore, 120 min was chosen as a suitable duration to conduct enzymatic hydrolysis using Flavourzyme without thermal treatment.
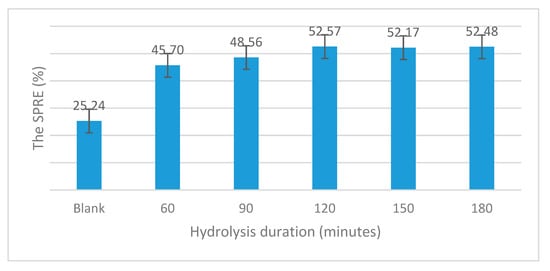
Figure 6.
The effect of hydrolysis duration on the SPRE.
3.3. Single Factor Analysis for the Soluble Protein Extraction Using Thermal Treatment and Enzymatic Hydrolysis
3.3.1. Duration of Thermal Pre-Treatment of Soybean
Figure 7 shows the results of changing the duration of thermal treatment from 10 to 15, 20, 25, and 30 min, respectively, while fixing the bean/water ratio at 1:3 and the temperature at 100 °C. After that, during the enzymatic hydrolysis, we chose the soybean/water ratio of 1:6, the enzyme concentration of 12.5 mL·g−1, and pH 6.5 at 50 °C for 120 min.
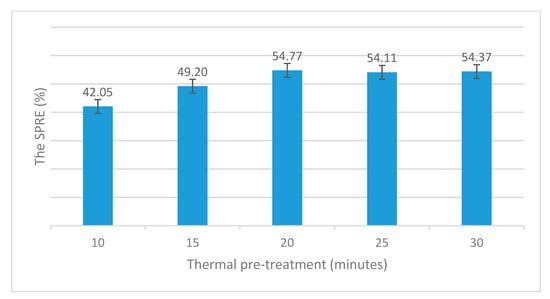
Figure 7.
The effect of thermal pre-treatment duration on the SPRE.
The results showed that the thermal treatment duration increased gradually, and the SPRE also increased. Continuing to increase the time to 20–30 min, the SPRE did not change because the heat denatured the properties of the protein in the soybeans. When the protein reaches a certain level of denaturation, despite prolonging the heat treatment time, the SPRE is also constant.
3.3.2. Comparison of the SPRE in the Enzymatic Hydrolysis with and without Thermal Treatment
Table 2 showed that in the absence of thermal treatment, the enzyme concentration used was higher because the untreated soybeans were tightly packed, so the commercial protease enzyme found it challenging to hydrolyze the substrate. In summary, the SPRE, in the case of using thermal treatment, proved that thermal treatment helped the hydrolysis process become more efficient, giving a very low peroxide value (PV) of 1.9. Thus, the thermal treatment duration for soybeans was 20 min at 100 °C, inactivating the lipoxygenase enzyme system and the preliminary protein denaturation in soybeans, leading to an increase in SPRE and acceptable PV.
Table 2.
Comparison of the SPRE in the enzymatic hydrolysis with and without thermal treatment.
3.3.3. Beans/Water Ratio
Figure 8 shows that when using Flavourzyme, changing the ratio of beans/water respectively from 1:5 to 1:3, the concentration of the substrate increased gradually, while the SPRE increased from 38.17% and reached the highest value of 54.77%. However, if the substrate concentration continued to increase (corresponding to the ratio of beans/water increasing from 1:3 to 1:2.5 and 1:2), the achieved SPRE decreased from 54.77% to 40.41%. Therefore, we chose the ratio of 1:3 for the production process to reach the highest SPRE.
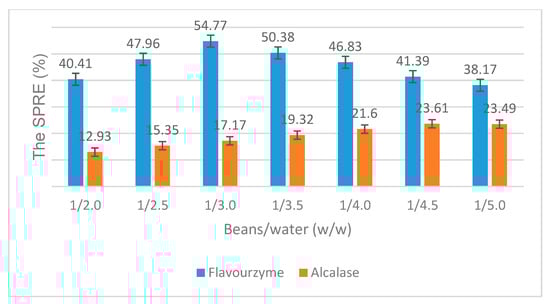
Figure 8.
The effect of the beans/water ratio on the SPRE.
On the other hand, for Alcalase, the SPRE increased when changing the ratio of beans/water from 1:5.0 to 1:4.5. When the substrate content increased, the SPRE remained constant, after which it increased insignificantly, from 23.49% to 23.61%. When changing the substrate content (corresponding to the ratio of beans/water from 1:4.5 to 1:2.0), the SPRE did not increase, but it did decrease significantly from 23.61% to 12.93%. Therefore, the ratio of 1:4.5 leads to a faster transfer rate, and the SPRE reaches its maximum. When the substrate content increases beyond the appropriate ratio, the enzyme will be inhibited, leading to a decrease in the SPRE. The SPRE obtained when hydrolyzing with Flavourzyme was higher and significantly different from Alcalase. For Flavourzyme, at the beans/water ratio of 1:3, the SPRE reached its highest, 54.77%; also, at 1:4.5, when using Alcalase, the SPRE reached its highest at 23.61%.
3.3.4. Enzyme Content
From Figure 9, when using Flavourzyme, changing the enzyme content to 1, 3, 5, 7, and 9 mL·100 g−1, respectively (corresponding to the activities of 2.22 U·g−1, 6.66 U·g−1, 11.10 U·g−1, 15.54 U·g−1, and 19.98 U·g−1), the results showed that when the enzyme content increased, the SPRE also increased. Specifically, when the enzyme content increased from 1% to 7%, the SPRE increased from 35.86% to 58.79%. However, when the enzyme content increased from 7% to 9%, the SPRE reached unchanged. According to ANOVA and LSD (Least Significant Difference) analysis, the SPRE achieved at 7% and 9% was not significantly different. The highest enzyme content of 7% (corresponding to activity 15.54 U·g−1) was selected for the next experiments. Compared with the control sample (without enzymatic hydrolysis), which only reached about 13.05%, the hydrolytic enzyme samples achieved higher figures. Similarly, when using Alcalase, the enzyme content of 1.5% (corresponding to the activity of 26.74 U·g−1) gave the highest SPRE and was selected for the next experiments.
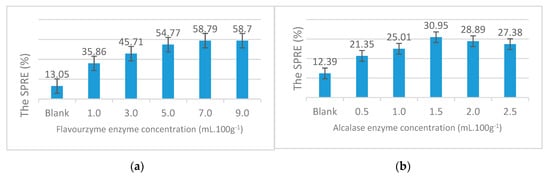
Figure 9.
The effect of enzyme content on the SPRE (a) Flavourzyme. (b) Alcalase.
3.3.5. pH
pH is a factor that significantly affects enzyme activity. According to Figure 10, examining the activity of two protease enzymes from pH 5 to 8 found that with Flavourzyme, when the pH changed from 5 to 5.5, 6, and 6.5, the SPRE gradually increased from 45.35% and reached the highest value of 61.27% at pH 6.5. However, when increasing the pH from 6.5 to 8, the SPRE tends to decrease, from 61.27% to 49.78%. The SPRE at pH 6.5 reached the highest value (p < 0.05) at the 95% confidence level.
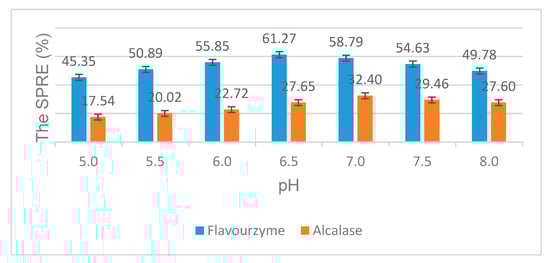
Figure 10.
The effect of pH on the SPRE.
For Alcalase, SPRE tends to increase gradually in the range of pH 5–7 and gradually decreased at pH 7–8. At pH 7, the highest SPRE is 32.4%. As the pH continued to rise, all the figures decreased. At pH 7, SPRE reached the highest point (p < 0.05) at 95% confidence. The results showed that using Flavourzyme in hydrolyzing soy protein gives the higher SPRE compared with Alcalase’s performance (1.89 times). Each enzyme has an optimal pH point suitable for each type of substrate. The optimal pH of Flavourzyme in this study is 6.5, which is the same as the pH of soybean after milling, so it is not necessary to adjust. According to Morten Fischer [24], the pH suitable for Flavourzyme hydrolyzed soy flour is 7, while the pH suitable for SPRE hydrolysis is 7.1 [25].
3.3.6. Hydrolysis Temperature
Figure 11 shows that for Flavourzyme, when the hydrolysis temperature increased from 40 to 45 and 50 °C, the SPRE respectively increased from 50.10% to 61.27%. Moreover, continuing to increase the temperature up to 55 and 60 °C, the SPRE achieved was reduced. To sum up, at 50 °C, the SPRE was the highest (61.27%) when using Flavourzyme for soybean enzymatic hydrolysis (p < 0.05). For Alcalase, the SPRE increased while increasing the hydrolysis temperature from 40 to 55 °C and tended to decrease slightly when increasing the temperature to 60 °C. When the hydrolysis temperature reached 55 °C, the SPRE was the highest at 37.47%. Nevertheless, when heating to 60 °C, the figure decreased to 34.38%. According to ANOVA and LSD analysis, the SPRE figure of Alcalase at 55 °C was the highest (p < 0.05). The results showed that using Flavourzyme achieved a SPRE 1.63 times higher than that of Alcalase.
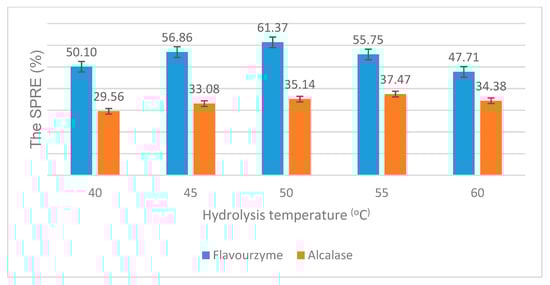
Figure 11.
The effect of hydrolysis temperature on the SPRE.
3.3.7. Hydrolysis Duration
Figure 12 shows that for Flavourzyme, when the hydrolysis time increased, the SPRE also increased. The enzymatic hydrolysis reaction occurred strongly in the first stage when using Flavourzyme; the SPRE increased from 13.05% to 50.24% (at 90 min). Over time, the enzymatic hydrolysis still occurred, and the bonds decreased, while the protein content still increased but not as much as the first time. When the hydrolysis duration reached 150 min, the SPRE reached the highest level (61.44%). After that, when prolonging to 180 and 210 min, the SPRE increased insignificantly.
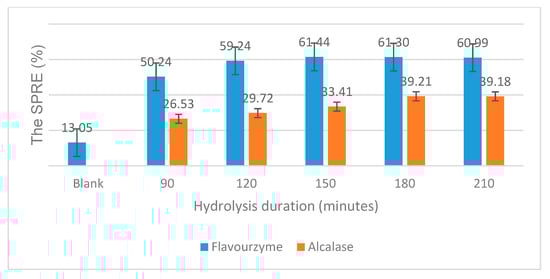
Figure 12.
The effect of hydrolysis duration on the SPRE.
Similarly, when using Alcalase and increasing the duration from 90 to 180 min, the SPRE increased from 26.53% to 39.21%. However, if the duration was up to 210 min, the SPRE increase was not significant. According to ANOVA, when using Flavourzyme, the SPRE at 150, 180, and 210 min had no statistically significant difference (p < 0.05). For Alcalase, the SPRE at the duration of 180 min was not significantly different from 210 min. So, 150 min is a reasonable hydrolysis duration to hydrolyze with Flavourzyme; while 180 min is a reasonable hydrolysis duration with Alcalase to make the process highly effective and economical. Compared with some previous studies, there were differences due to the differences in substrate characteristics and hydrolysis conditions (enzyme activity, enzyme activity). According to Lee et al. (2001), the SPRE attained 59.5% when combining thermal pre-treatment and enzymatic hydrolysis 95 °C for 1 h [26].
3.4. Optimizing Protein Hydrolysis
Through two investigations of factors affecting the soy protein enzymatic hydrolysis by Flavourzyme, only enzymatic hydrolysis, and combining thermal pre-treatment and enzymatic hydrolysis, we realize that the latter yields the SPRE of 61.44 ± 0.22%, which is higher than that without thermal treatment: 52.57 ± 0.27%. Therefore, we optimize the enzymatic hydrolysis of soy protein in the case of combining thermal treatment and enzymatic hydrolysis to find the best hydrolysis conditions for two enzymes (Flavourzyme and Alcalase). We design a series of experiments by using response surface methodology (RSM) to optimize the hydrolysis conditions of food and other products [27,28,29,30,31,32]. Single factor analysis in which investigated factors would be individually varied was performed first. By using the Modde12 software, output results from the single factor analysis would be used in a response surface optimization to establish multiple models that describe the influence of the experimental conditions on the desired characteristics of the final product [33,34]. Five factors associated with the hydrolysis process (enzyme concentration, pH, hydrolysis temperature, duration, and beans/water ratio) were taken into consideration for response surface optimization.
3.4.1. Flavourzyme-Catalyzed Hydrolysis
The simultaneous influence of the investigating factors, including enzyme content, pH, hydrolysis temperature, duration, and beans/water ratio on the SPRE of soy hydrolyzate was examined with the experimental parameters presented in Table 3.
Table 3.
Parameters of enzymatic hydrolysis conditions optimization using Flavourzyme.
After fitting the data and adjusting the model, the final quadratic model is described:
SPRE(%) = 59.34 + 0.87x1 + 1.67x2 − 2.49x3 + 1.42x4 + 1.06x5 − 1.46x12 − 2.29x22 − 3.55x32 − 1.96x42 − 2.08x52 + 1.71x1x3 − 2.50x1x3 + 1.18x2x4 − 1.22x4x5.
Table 4 shows the Lack of Fit coefficient. In terms of model performance, both the coefficients of determination and cross-validation achieved relatively high values. This indicates that the estimated parameters are robust and reliable.
Table 4.
Lack of Fit coefficient of Flavourzyme-catalyzed hydrolysis.
According to the Optimizer tool of the software program Modde 12.1, the maximum SPRE 61.98% at enzyme concentration, pH, temperature, duration, and beans/water ratio values were 7.25 mL·100 g−1, 7.00, 46 °C, 171 min, and 1:3, respectively.
3.4.2. Alcalase-Catalyzed Hydrolysis
Table 5 showed all parameters of enzymatic hydrolysis conditions optimization using Alcalase. After fitting the data and adjusting the model, the final quadratic model is described:
SPRE(%) = 38.95 + 0.82x1 + 1.17x2 + 2.36x4 − 2.71x12 − 2.95x22 − 2.49x32 − 1.85x42 − 1.51x52 + 0.69x1x2 + 1.72x1x3 − 1.18x1x4 + 0.56x2x4 + 1.97x2x5 + 1.32x3x4.
Table 5.
Parameters of enzymatic hydrolysis conditions optimization using Alcalase.
The regression equation is expressed in three-dimensional space and on the response surface. The SPRE reached a peak of 40.1% at an enzyme concentration of 28.01 U·g−1, pH 7.2, hydrolysis temperature of 56.5 °C for 203 min, and beans/water ratio of 1:4.6. The experiment was repeated, and the SPRE reached 41.32 ± 0.13%.
3.5. Evaluating the Quality of Hydrolyzed Soup at Optimal Conditions
3.5.1. Molecular Mass Distribution
The molecular weight of soy protein hydrolyzate using Flavourzyme and Alcalase, respectively, was analyzed by the gel chromatography method (Table 6). The enzyme Alcalase produced the hydrolysate with the lowest average molecular mass.
Table 6.
Results Mw, Mn and the multiple dispersion index of the molecular weight of soy protein hydrolyzate measured by gel filtration chromatography (GPC).
Compared with the study of Mo-Nan Zhang (2011), SPI hydrolysis obtained the majority of peptides with molecular weight from 2 to 10 kDa in a DH (Degree of Hydrolysis) of 6.79%, while raw fluid had a molecular weight from 10 to 23 kDa [35]. According to Jin Yeol Lee (2001), hydrolyzed skimmed soybean powder with Alcalase and Flavourzyme yields peptides with much lower molecular weight, from 0.36 to 2 kDa. In summary, soy protein hydrolysis not only contributes to protein extraction to increase the nutritional value of the product by forming short-circuit, low molecular weight, easy to dissolve peptides, increasing the absorption in the digestive process in the body, but it also produces bioactive peptides with properties such as anticancer, anti-hypertension, blood cholesterol-lowering, blood triglyceride-lowering [36].
Corresponding to the flow rate of the hydrolyzate through the common 12F inhalers with the SPRE, the viscosity and particle size of the hydrolyzate are shown in Table 7. The results showed that the viscosity values of the hydrolyzate using Flavourzyme and Alcalase were 7.9 cP and 12.2 cP in turn, which are much lower than the viscosity of other medical foods (26 cP) [37,38].
Table 7.
Flow rate through feeding tubes of size 12F and particle size in soybean juice after hydrolysis using enzyme Alcalase and Flavourzyme.
3.5.2. Amino Acids Determination
The amino acid composition of soybean hydrolyzate analyzed by gas chromatography HPLC is presented in Table 8, containing 18 kinds of necessary amino acids for the human body. The essential amino acids content (Val, Leu, Ile, Thr, Met, Phe, Lys) is quite high, with the figure of 36.5% when hydrolyzed with Flavourzyme and 32.2% when hydrolyzed with Alcalase.
Table 8.
The amino acid composition of the hydrolyzed soup collected at the optimal conditions.
The BCAA (Branched Amino Acid) from hydrolysis by Flavourzyme and Alcalase sequentially included leucine (0.94 g·100 g−1; 0.96 g·100 g−1), isoleucine (0.25 g·100 g−1; 0.44 g·100 g−1), and valin (0.28 g·100 g−1; 0.46 g·100 g−1) corresponding to leucine/isoleucine/valine ratios of 4:1:1 and 2:1:1. Thus, when hydrolyzing soy protein with Alcalase produces a BCAA 2:1:1 ratio, the enzyme Alcalase is chosen to hydrolyze soy protein. Leucine, isoleucine, and valine are effective for liver failure, and they contribute to improving the mental status for patients with hepatic coma. Moreover, BCAA can be used in peripheral tissues or wounds as a source of energy [39,40,41].
4. Conclusions
This research has proposed a thermal treatment method for soybeans and determined the optimal enzymatic hydrolysis conditions for soy protein, describing the effect of enzyme content, hydrolysis temperature, pH, and duration on the value of SPRE. Soybean hydrolysis with Alcalase reached a peptide value of 1.52 kDa with a BCAA ratio of 2:1:1, while soybean hydrolysis with Flavourzyme achieved a peptide valueof 3.19 kDa with a BCAA ratio of 4:1:1. In the feeding products, we could use other materials, so the BCAA can be changed. Based on the research results, we are clarifying the theory of the correlation among molecular size distribution, particle size, viscosity, and flow rate of a mixture of components such as protein after hydrolysis under dark conditions to the digestive ability of patients recovering from surgery. This theory identified the optimum hydrolysis conditions based on the lowest viscosity of the nutrient components. The results showed that a little viscosity mixture after hydrolysis causes no sedimentation and meets the required flow rate through the thick nasal catheter.
Author Contributions
Investigation: T.L.Q.A., P.D.T.N., P.B.N., H.V.T., L.T.H.A. and N.T.Q.H.; Supervisor: D.T.A.D.; Writing—original draft, T.L.Q.A.; Writing—review: D.T.A.D. and editing: T.L.Q.A. All authors have read and agreed to the published version of the manuscript.
Funding
This research received no external funding.
Acknowledgments
We acknowledge the support of time and facilities from Ho Chi Minh City University of Technology (HCMUT), VNU-HCM for this study.
Conflicts of Interest
The authors declare no conflict of interest.
References
- Korhonen, H.; Pihlanto, A. Food-derived bioactive peptides opportunities for designing future foods. Food Res. Dev. 2003, 9, 1297–1308. [Google Scholar] [CrossRef] [PubMed]
- Kilara, A.; Panyam, D. Peptides from milk proteins and their properties. Crit. Rev. Food Sci. Nutr. 2003, 43, 607–633. [Google Scholar] [CrossRef] [PubMed]
- Hartmann, R.; Meisel, H. Food-derived peptides with biogogical activity: From research to food applications. Curr. Opin. Biotechnol. 2007, 18, 103–109. [Google Scholar] [CrossRef]
- Siemensma, A.; Weijer, W.; Bak, H. The important of peptide lengths in hypoallergenic infant formulae. Trends Food Sci. Technol. 1993, 4, 16–21. [Google Scholar] [CrossRef]
- Grimble, G.; Rees, R.; Keohane, P.; Cartwright, T.; Desreumaux, M.; Silk, D. Effects of peptide chain length on absorption of egg protein hydrolysates in the normal human jejunum. Gastroenterology 1987, 92, 136–142. [Google Scholar] [CrossRef]
- Levine, A.; Labuza, T.; Morley, J. Food technology: A Primer for physicians. N. Engl. J. Med. 1985, 312, 628–634. [Google Scholar] [CrossRef]
- Scheppach, W.; Burghardt, W.; Bartram, P.; Kasper, H. Addition of dietary fiber to liquid formula diets: The pros and cons. J. Parenter. Enter. Nutr. 1990, 14, 204–209. [Google Scholar] [CrossRef]
- Kapadia, S.A.; Raimundo, A.H.; Grimble, G.K.; Aimer, P.; Silk, D.B.A. Influence of three different fibre supplemented enteral diets on bowel function and short-chain fatty acid production. J. Parenter. Enter. Nutr. 1995, 19, 63–68. [Google Scholar] [CrossRef]
- Lien, K.A.; McBurney, M.I.; Beyde, B.I.; Thompson, A.B.R.; Sauer, W.C. Ileal recovery of nutrients and mucinin humans fed total enteral formulas supplemented with soy fibren. Am. J. Clin. Nutr. 1996, 63, 584–595. [Google Scholar] [CrossRef]
- Rays, N.; Seehofer, D.; Theruvath, T.; Schiller, R.A.; Langrehr, J.; Jonas, S.; Bengmark, S.; Neuhaus, P. Supply of pre-and probiotics reduces bacterial infection rates after liver transplantation a randomized, double-blindtrial. Am. J. Transplant. 2005, 5, 125. [Google Scholar] [CrossRef]
- Frankenfield, D.; Beyer, P. Soy polysaccharide effect on diarrhoea in tube-fed, head injured patients. Am. J. Clin. Nutr. 1989, 50, 553–558. [Google Scholar] [CrossRef] [PubMed]
- Aaslyng, M.D.; Larsen, L.M.; Nielsen, P.M. Development of chemical and sensory characteristics during enzymatic hydrolysis of soy. Zeitschrift Für Lebensmitteluntersuchung Und-Forschung A 1999, 208, 50–56. [Google Scholar] [CrossRef]
- Liaset, B.; Julshamn, K.; Espe, M. Chemical composition and theoretical nutritional evaluation of the produced fractions from enzymic hydrolysis of salmon frames with ProtamexTM. Process Biochem. 2003, 38, 1747–1759. [Google Scholar] [CrossRef]
- Kristinsson, H.G.; Rasco, B.A. Fish protein hydrolysates: Production, biochemical, and functional properties. Crit. Rev. Food Sci. Nutr. 2000, 40, 43–81. [Google Scholar] [CrossRef] [PubMed]
- Mæhre, H.; Dalheim, L.; Edvinsen, G.; Elvevoll, E.; Jensen, I.J. Protein determination—Method matters. Foods 2018, 7, 5. [Google Scholar] [CrossRef] [PubMed]
- Bigio, I.J.; Mourant, J.R. Ultraviolet and visible spectroscopies for tissue diagnostics: Fluorescence spectroscopy and elastic-scatterin spectroscopy. Phys. Med. Biol. 1997, 40, 803. [Google Scholar] [CrossRef]
- Ouano, A.C.; Gel-permeation chromatography. VII. Molecular weight de- tection of GPC effluents. J. Polym. Sci. Part A Polym. Chem. 1972, 10, 2169–2180. [Google Scholar] [CrossRef]
- Seo, W.H.; Lee, H.G.; Baek, H.H. Evaluation of bitterness in enzymatic hydrolysates of soy protein isolate by taste dilution analysis. J. Food Sci. 2008, 73, S41–S46. [Google Scholar] [CrossRef]
- Meinlschmidt, P.; Schweiggert-Weisz, U.; Eisner, P. Soy protein hydrolysates fermentation: Effect of debittering and degradation of major soy allergens. LWT Food Sci. Technol. 2016, 71, 202–212. [Google Scholar] [CrossRef]
- Ma, Y.; Wang, L.; Sun, X.; Zhang, J.; Wang, J.; Li, Y. Study on hydrolysis conditions of flavourzyme in soybean polypeptide alcalase hydrolysate and soybean polypeptide refining process. Adv. J. Food Sci. Technol. 2014, 6, 1027–1032. [Google Scholar] [CrossRef]
- See, S.F.; Hoo, L.L.; Babji, A.S. Optimization of enzymatic hydrolysis of Salmon (Salmo salar) skin by Alcalase. Int. Food Res. J. 2011, 18, 1359–1365. [Google Scholar]
- Tran, T.N.; Tran, N.T.O. Optimization of the processing of basa fish blood. Med. Res. Ho Chi Minh City 2013, 15, 5. [Google Scholar]
- Amiza, M.A.; Ashikin, S.N.; Faazaz, A.L. Optimization of enzymatic protein hydrolysis from silver catfish (Pangasius sp.) frame. Int. Food J. 2011, 18, 775–781. [Google Scholar]
- Hodge, L.; Swain, A.; Faulkner-Hogg, K. Food allergy and intolerance. Aust. Fam. Physician 2009, 38, 705. [Google Scholar]
- Zopf, Y.; Baenkler, H.-W.; Silbermann, A.; Hahn, E.G.; Raithel, M. The differential diagnosis of food intolerance. Dtsch. Arztebl. Int. 2009, 106, 359. [Google Scholar] [CrossRef] [PubMed]
- Lee, J.Y.; Lee, H.D.; Lee, C.H. Characterization of hydrolysates produced by mild-acid treatment and enzymatic hydrolysis of defatted soybean flour. Food Res. Int. 2001, 34, 217–222. [Google Scholar] [CrossRef]
- Hao, X. Orthogonal test methods applications on testing designs. Sci. Technol. Henan Commun. 1999, 6, 20–22. [Google Scholar]
- Gunst, R.F. Response surface methodology: Process and product optimization using designed experiments. Technometrics 1996, 38, 284–286. [Google Scholar] [CrossRef]
- Zhang, H.F.; Yang, X.H.; Zhao, L.D.; Wang, Y. Ultrasonic-assisted extraction of epimedin C from fresh leaves of Epimedium and extraction mechanism. Innov. Food Sci. Emerg. Technol. 2009, 10, 54–56. [Google Scholar] [CrossRef]
- Zhu, L.; Zhang, Q.; Wang, Y.; Cen, Y. Optimum extraction process of polysaccharides from Grateloupia filicina by orthogonal test. Food Sci. 2006, 2, 90–95. [Google Scholar]
- Bucher, C.; Bourgund, U. A fast and efficient response surface approach for structural reliability problems. Struct. Saf. 1990, 7, 57–66. [Google Scholar] [CrossRef]
- Box, G.E.P.; Draper, N.R. A basis for the selection of a response surface design. J. Am. Stat. Assoc. 1990, 54, 622–654. [Google Scholar] [CrossRef]
- Wangtueai, S.; Noomhorm, A. Processing optimization and charaterization of gelatin from lizardfish (Saurida spp.) scales. LWT Food Sci. Technol. 2009, 42, 825–834. [Google Scholar] [CrossRef]
- Abdi, H.; Dzung, N.H. Analysis of Experimental Data; Vietnam National University Publisher: Ho Chi Minh City, Vietnam, 2012. [Google Scholar]
- Zhang, M.N.; Huang, G.R.; Jiang, J.X. Iron binding capacity of dephytinised soy protein isolate hydrolysate as influenced by the degree of hydrolysis and enzyme type. J. Food Sci. Technol. 2014, 51, 994–999. [Google Scholar] [CrossRef] [PubMed]
- Dixit, A.; Antony, J.I.; Sharma, N.K.; Tiwari, R.K. Soybean constituents and their functional benefits. Opportunity, challenge and scope of natural products in medicinal chemistry. Res. Singpost 2011, 367–383. [Google Scholar]
- Kaur, M. Medical Foods from Natural Sources; Springer: New York, NY, USA, 2009. [Google Scholar]
- Casas-Augustench, P.; Salas-Salvado, J. Viscosity and flow-rate of three high-energy, high-fibre enteral nutrition formulas. Nutr. Hosp. 2009, 24, 492–497. [Google Scholar]
- Clemmesen, J.O.; Kondrup, J.; Ott, P. Splanchnic and leg exchange of amino acids and ammonia in acute liver failure. Gastroenterology 2000, 118, 1131–1139. [Google Scholar] [CrossRef]
- Plauth, M.; Cabré, E.; Riggio, O.; Assis-Camilo, M.; Pirlich, M.; Kondrup, J.; DGEM (German Society for Nutritional Medicine); Ferenci, P.; Holm, E.; Dahl, S.V.; et al. ESPEN Guidelines on Enteral Nutrition: Liver disease. Clin. Nutr. 2006, 25, 258–294. [Google Scholar] [CrossRef]
- Plauth, M.; Merli, M.; Kondrup, J.; Weimann, A.; Ferenci, P.; Muller, M.J. ESPEN guidelines for nutrition in liver disease and transplantation. Clin. Nutr. 1997, 16, 43–55. [Google Scholar] [CrossRef]
© 2020 by the authors. Licensee MDPI, Basel, Switzerland. This article is an open access article distributed under the terms and conditions of the Creative Commons Attribution (CC BY) license (http://creativecommons.org/licenses/by/4.0/).