Abstract
Developing simple and effective synthetic strategies regarding the formation of heterostructure photocatalytic semiconductors remains an intense challenge in research matters. Uniform heterostructure cobalt oxide@meso–CN@MoS2 (CoO@meso–CN@MoS2) photocatalyst exhibits excellent photocatalytic redox performance for pollutant degradation under visible light. By adjusting the weight ratio of CoO@meso–CN and MoS2, we fabricated a CoO@meso–CN@MoS2 heterostructure photocatalyst, and the established heterostructure between CoO@meso–CN and MoS2 was indicated by various physicochemical and morphological characterizations. The photocatalytic response to the fabricated hybrid was determined by rodamine B (RhB), methylene blue (MB), and congo red (CR) degradation in aqueous solution under visible light, and the nanocomposites with a slight content consisting of CoO@meso–CN achieved better catalysis than pure MoS2. This finding confirmed the propriety of this heterostructure as a valuable photocatalyst. The experimental results demonstrated that the apparent reaction rate constant of the 3 wt% CoO@meso–CN modified MoS2 was about two times higher than that of pure MoS2. The present work serves as a new approach for designing highly efficient visible light-induced heterostructure-based photocatalysts for environmental applications in the future.
1. Introduction
Contaminations of water systems with organic compounds is a significant source of environmental pollution. All possible refinement pathways, such as direct photodegradation, microbial degradation, or related hydrolysis, are slow [1,2,3]. Researchers have conducted many attempts to create improved photocatalysts that are efficient and show favorable charge separation and transport effects. In recent years, nanoscale heterostructure photocatalysis has become more attractive, because it can remediate such environmental issues. Nanoscale-based technologies have been established to benefit as heterostructure photocatalysts in certain environmentally significant returns. Nanomaterials used for visible-light photocatalytic degradation of organic pollutants has attracted increasing consideration due to the fact of their potential to meet communal energy and environmental issues [4,5]. Recent work suggested that molybdenum disulfide (MoS2), a typical two-dimensional (2D) material, is a favorable and noticeable photocatalyst for environmental applications. At the same time, 2D nanomaterials like MoS2, MoSe2, WS2, and WSe2 have recently received an extensive amount of attention [6,7,8] in the catalysis literature because of their construction and diminished scale. MoS2 shows excellent adsorption capacity and the efficiency to enhance photocatalyst reactivity for driving away organic chemicals like organic dye molecules, oil, and antibiotics [8,9]. Although MoS2 has mostly been approved to be employed in the photocatalytic oxidation of various pollutants, catalyst development is essential to organizing the achievement potential for the catalytic model and for impacting the lifetimes and recovery of the nanomaterial. Heterogeneous photocatalysis has been confirmed as effective for degrading both water and air organic contaminants [10] and the part of degradation of organic pollutants in aqueous solutions to the MoS2 heterostructure [11]. These results established that the existence of MoS2 shows outstanding efficiency for improvement of light harvesting, electron drift from interfaces, and charge separation in the heterogeneous.
To date, different methods have been used to establish MoS2 materials [8]. They are generally represented as sharp conditions that are responsive to the environment, and they are time consuming, pricey, and hazardous organic solvents. In addition, hydrothermal processes significantly affect environmental profits. Thus, the evolution of the hydrothermal route of heterostructure CoO@meso–CN@MoS2 materials is extremely interesting. Among those systems, hydrothermal processes are preferable due to the fact of their easy employment, flexible synthetic conditions, profitable and environmental practicability, etc. [12]. Nanomaterials have very particular chemical and physical properties compared to bulk components. Whereas, when they serve as catalysts, their catalytic action is proved to be promoted not only on their extended surface area but also owing to the improvement of surface properties like surface defects. The enhanced driving force arising from the enlarged redox potential and the constant solvent reconstruction free energy in diameter reduced systems is proposed to enhance the rate constant of charge transport and may result in elevated photo capability for routes in which the rate-determining stage is charging to transfer. Results demonstrate that, in general, the photocatalytic action of heterostructure CoO@meso–CN@MoS2 was superior to those of bulk MoS2 as well as MoS2 nanomaterials. Hence, the progress of the hydrothermal process formation of heterostructure nanomaterials is much favored. The high photocatalytic action of the heterostructure CoO@meso–CN@MoS2 could be referred to the extended separation potential of photogenerated electron and hole pairs. The photocatalytic response from the bulk MoS2, which is normally inefficient owing to the fast recombination of electrons and holes, is raised through heterojunction formation among CoO@meso–CN nanocrystals. Herein, an accessible pathway was provided for the efficient synthesis of heterostructure CoO@meso–CN@MoS2 photocatalysts hydrothermally for their employment in the visible-light photocatalytic degradation of organic contaminants. This work is effective and promotes innovative visible-light sensitive photocatalysts for inexpensive, high performance, and great cycling stability.
2. Results and Discussion
2.1. Optical Properties Analysis
In order to analyze the performance of CoO@meso–CN@MoS2 supplements with optical properties and to analyze the light absorption range and intensity, UV-Vis spectra were carried out on the as-prepared samples (Figure 1a). The as-prepared MoS2 composites with CoO@meso–CN content of 0% (pure MoS2), 3 and 5 wt%, respectively. It can be observed that both of the CoO@meso–CN@MoS2 photocatalysts and the MoS2 photocatalysts presented broad absorption in the visible region. The CoO@meso–CN@MoS2 material suggests an intense absorption character of absorption edge beginning at about 405 nm (Figure 1a). Upon modification with CoO@meso–CN, the visible light absorption shape (385–525 nm) of all the heterogeneous has benefited significantly. The optical band gap among CoO@meso–CN@MoS2 hybrids is estimated in the Tauc plot (Figure 1b). The CoO@meso–CN@MoS2 material presented an energy gap between 2.87 and 2.88 eV, while the band gap between bulk MoS2 was 1.81 eV. It is recognized that the quantum confinement effects and the coefficient reaction to nanostructure CoO@meso–CN contributed to the bandgap increment [13]. The UV-Vis spectra result displays the propriety of the CoO@meso–CN@MoS2 heterostructure hybrids with a visible light sensitive photocatalyst. The photocatalytic efficiency of a photocatalyst is based on the separation performance of photoexcited charges carriers. Therefore, the establishment of CoO@meso–CN enhanced the light absorption potential of the catalyst and advanced the light application performance.
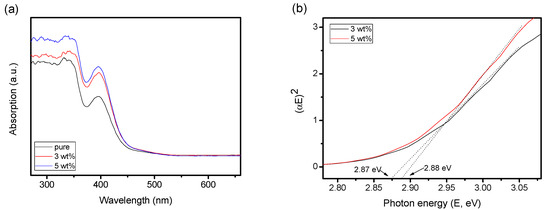
Figure 1.
(a) UV-Vis spectra of MoS2, 3 wt%, and 5 wt% CoO@meso–CN@MoS2 heterojunction photocatalysts. (b) The band-gap energy of samples.
2.2. X-ray Diffraction Analysis
The powder X-ray diffraction (XRD) profiles for the CoO@meso–CN@MoS2 heterostructure with different ratios are presented in Figure 2. All of the feature XRD peaks of the hexagonal phase are revealed in the heterostructure hybrids [14]. Pure MoS2 suggests a set of diffraction peaks that represent the hexagonal phase crystal structure. The primary peaks of 14.34°, 39.56°, 44.23°, 49.86°, and 60.2° can be applied to the (002), (103), (006), (105), and (110) planes of MoS2 (JCPDS No-75-1539). No peak adjustments appeared in any of the samples, suggesting that the production of CoO@meso–CN had a negligible response to the crystal structure of MoS2. However, no characteristic peak of CoO@meso–CN were detected in the hybrids because of its low content. In addition to the CoO@meso–CN phase, the hybrids displayed few intense and broad peaks at 2θ values of 14.34, 39.56, 44.23, 49.86, and 60.2 degrees which correlate to the crystalline CoO@meso–CN@MoS2 phase. The XRD peaks of the MoS2 phase reduce intensity with increasing CoO@meso–CN content of the heterostructure hybrids. Simultaneously, a broad peak at 2θ values of 14.34° for the MoS2 phase was recorded.
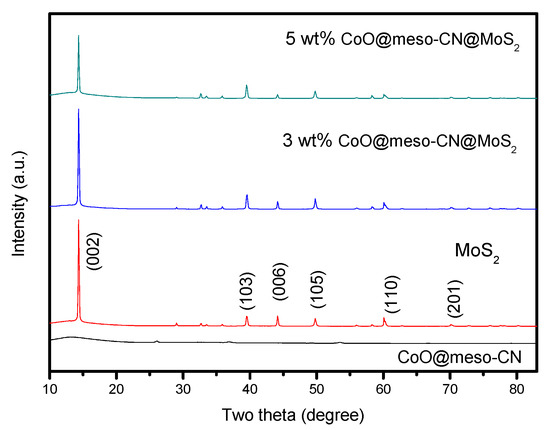
Figure 2.
XRD profiles of heterojunction photocatalysts.
2.3. Morphological Characterization
The morphology and structure of pure MoS2 and CoO@meso–CN@MoS2 were performed by SEM (Figure 3a–c). The SEM image of CoO@meso–CN@MoS2 photocatalyst indicates the proof of sheets with length of 200 nm and diameter about 50 nm, respectively (Figure 3b,c). With increasing CoO@meso–CN content, the surface density of the CoO@meso–CN@MoS2 nanoplates increases in MoS2 plates. At the same time, no apparent alteration in length and diameter of CoO@meso–CN@MoS2 nanosheets was seen. It was believed that the doped nanostructured CoO@meso–CN expanded the change in Gibbs free energy (∆G) and at the same time decreased the surface energy of CoO@meso–CN@MoS2 photocatalyst [15]. The corresponding energy-dispersive X-ray spectroscopy (EDS) elemental analysis indicated that most of the elements were Mo (65.6%), S (23.3%), and Co (1.79%), respectively, which are characteristic elements corresponding to the 3 wt% CoO@meso–CN@MoS2 heterostructure materials (Figure 3d). The molar ratio of the elements Mo to S was identified to be approximately 2:1 for heterostructure materials.
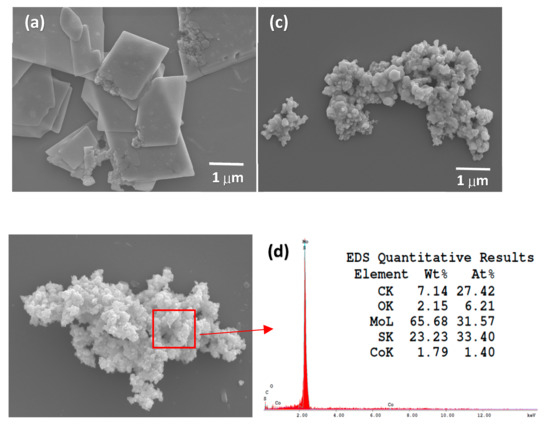
Figure 3.
FESEM images of (a) pure MoS2, (b) 3 wt%, (c) 5 wt% CoO@meso–CN@MoS2.photocatalysts, and (d) EDS pattern of 3 wt% CoO@meso–CN@MoS2.
Transmission electron microscopy (TEM) was implemented on the CoO@meso–CN@MoS2 photocatalyst. The TEM images of CoO@meso–CN@MoS2 hybrids further established the presence of CoO@meso–CN@MoS2 nanocomposites and pure MoS2 materials in the sample (Figure 4). The single 3 wt% CoO@meso–CN@MoS2 nanocomposites is shown in Figure 4a. The conjunction of two sets of lattice fringes corresponding to the (002) and (111) crystal planes of MoS2 and CoO@meso–CN, respectively, was obviously observed for the CoO@meso–CN@MoS2 heterostructure material (Figure 4b). The measured interplanar spacings of 0.28 nm and 0.36 nm can be applied to the (111) plane of CoO@meso–CN photocatalyst and the (002) plane of hexagonal MoS2, respectively. The close contact among the heterostructure promotes powerful drift of charge carriers at the interfacial zone, increasing their separation. According to the TEM measurement results, it can be observed that the nanomaterials CoO@ meso-CN firmly attach to the surface of MoS2 photocatalyst. The structured deepness that reached between the CoO@meso–CN and MoS2 photocatalyst was partially attributed to Van der Walls interactions [16]. The lattice fringes suggest the high quality of crystallinity of the MoS2 and CoO@meso–CN photocatalyst. Elemental mapping images (Figure 3c–f) suggest that Mo, S, Co, and O elements were uniformly distributed in nanocomposites. Therefore, the above results indicate the successive growth of 3 wt% CoO@meso–CN@MoS2.
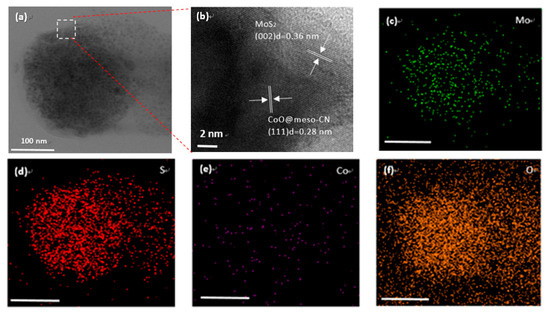
Figure 4.
TEM images of 3 wt% CoO@meso–CN@MoS2 heterojunction photocatalysts. (a) TEM images, (b) HRTEM image, (c–f) EDS spectra elemental mapping of Mo, S, Co, and O, respectively. Scale bar is 100 nm as shown in the inset.
2.4. Structural and Surface Properties Analysis
The FTIR spectrum of the CoO@meso–CN@MoS2 heterostructure nanomaterial with different concentrations is shown in Figure 5a. Absorption bands were raised at 534, 820, 1140, 1384, 1695, and 2395 cm−1 of MoS2 nanomaterials (dotted line) [17]. The band at 534 cm−1 was due to the Mo–S bonds, and the band at 820 cm−1 was due to the construction of S–S bonds for the synthesis of the MoS2 heterostructure nanomaterial. The broad absorbance bands of 3430 cm−1 can be attributed to the adsorbed hydroxyl groups of the surface of MoS2. The crystal structure of the hybrids could be further supported by Raman spectroscopy. As shown in Figure 5b, the Raman spectrum of the hybrids was comparable to that of the bulk component. The frequencies of 380 and 406 cm−1 can be referred to the MoS2 modes [17,18]. Comparing the two component Raman peaks of the as-prepared hybrid, it was apparent that the Raman bands shift towards higher energy (Figure 3b inset), and their intensities relatively decline as the grain size diminishes. Therefore, the recognized shift was due to the effect of diminishing grain size on alternative properties of the nanoparticles. When the grain size reduces, the vibrational properties of these components may change. Mostly, contraction appears within the nanoparticles that is due to the size-induced radial pressure, which serves to increase the drive constants following declines in interatomic distances. We infer that the shift in the Raman spectra of the nanohybrid is due to the narrower grain size and its impact on the drive constants and vibrational amplitudes of the nearest neighbor bonds. X-ray photoelectron spectroscopy (XPS) was carried out to verify the chemical states and bonding architecture of hybrids (Figure 5c–e). The survey XPS spectra imply that the prepared hybrids consist of Mo, S, and Co. These clear peaks of the heterostructure can be apparently recognized in the hybrid sample. The high-resolution XPS of the Mo spectrum demonstrated two peaks at 229.5 and 395.7 eV, which could be attributed to Mo 3d5/2 and Mo 3p3/2, respectively. The famed feature peaks at 162.4 eV can be attributed to S, which reveal S 2p3/2, verifying the chemical structure of MoS2 [18]. In addition, measurement of the thermal gravimetric analysis (TGA) data (Figure 5f), and the amount of CoO@meso–CN nanoparticles in MoS2 hybrids was only 14.48 wt%, suggesting that the CoO@meso–CN on the MoS2 hybrid was quite less. The uniform distribution of less CoO@meso–CN nanoparticles on the MoS2 hybrid was critical to the construction of the CoO@meso–CN@MoS2 heterostructure materials. BET analysis showed that the composite possesses high surface area (10.43 m2/g) shown in Figure 5g,h. The Barrett–Joyner–Halenda method was applied for determining the pore size, i.e., diameter ~24 nm.
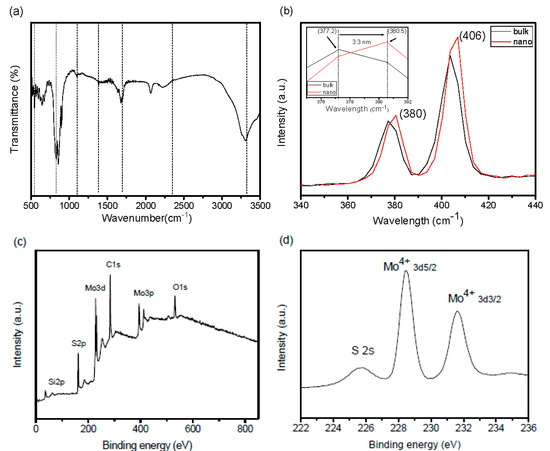
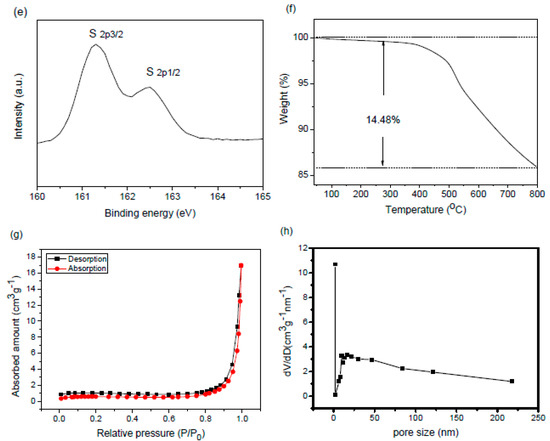
Figure 5.
(a) The FTIR spectra of heterojunction photocatalysts, (b) Raman spectra, (c) overall XPS survey spectra of heterostructure materials, (d) XPS analysis of Mo 3d, (e) XPS analysis of S 2p, (f) TGA profiles, (g) N2 adsorption/desorption isotherms, and (h) pore size distribution of 3 wt% CoO/meso–CN/MoS2 heterostructure materials.
2.5. Photocatalytic Degradation Performance
The photocatalytic action of the nanocomposites has been explored to understand the degradation of organic chemicals using visible light for essential energy. The optimization of the photocatalytic degradation response is achieved by applying aqueous solution to RhB as a classical pollutant. Figure 6 indicates the photocatalytic performance of 60 mg of nanohybrid photocatalysts with different ratios via the degradation of 20 ppm aqueous solution of RhB under visible light. Over 60 min of degradation time, from 73% to 92% degradation of RhB was observed using a nanohybrid photocatalyst with varied concentration, respectively (Figure 6a,b). In addition, the reaction rate constant of the 3 wt% nanohybrid was around two times (2.5 and 11 times) higher than that of pure MoS2 (CoO@meso–CN and TiO2) for the degradation of RhB. The pure MoS2 photocatalysts declined by only approximately 73% of the RhB, which is rather lower than the degradation observed for the nanohybrid photocatalyst alone. These results suggest that the nanohybrid is a capable photocatalyst and that the hybrid formation is favorable for response improvement. However, the entire 3 wt% nanocomposites exhibited relatively enhanced photocatalytic capability compared with the pure essentials (73%) and pure CoO@meso–CN nanoparticles (61%). The probable pseudo-first-order rate constant (kapp) for RhB degradation is revealed in Figure 6c. All of the nanocomposites showed greater degradation rates for RhB compared with the pure MoS2 and CoO@meso–CN components. The apparent rate constant for the 3 wt% nanohybrid was approximately 2 and 2.5 times higher than that of the pure MoS2 and pure CoO@ meso-CN nanoparticles, respectively. The effect of the catalyst amount of RhB degradation has been investigated by using different masses of nanohybrid photocatalysts (20–80 mg), and the rate of RhB degradation enhanced considerably, up to 60 mg. Also, the catalyst amount had a small effect on the degradation rate (Figure 6d). The initial RhB amount was also assorted between 20–80 ppm using 60 mg of the nanohybrid photocatalyst. Using up to 20 ppm for initial RhB amounts, the degradation rate achieved >93% degradation in 60 min of irradiation time (Figure 6e). With 40 ppm used as initial RhB amounts, 80% degradation was reached after 60 min of irradiation. The degradation efficiency decayed gradually with increased RhB amount. The gradual reduction in the RhB degradation rate at higher initial amounts was due to the saturation of the action section over the photocatalyst surface. The optimization investigation showed that 60 mg of CoO@meso–CN@MoS2 hybrid was able to reach 93% degradation of a 20 ppm RhB solution during 60 min of response time. On the other hand, we constructed cycling studies of the photocatalytic degradation progression by repeatedly presenting the same catalyst five times. Figure 6f shows that after five continual runs, no significant deactivation of nanohybrid was recognized, and the degradation potential of RhB reduced lower than 1%, suggesting that the hybrid had positive cycling stability. Only ≈3% of the catalytic performance declined after it was irradiated under visible light for a long time (10 h). The recycling efficiency and durability of photocatalysts are two essential points that should be verified in future functional applications. The nanostructured CoO@meso–CN firmly attached to the surface of the MoS2 and acts as a valuable electron transfer medium, building charge separation due to the electron–hole recombination, then enhancing the photocatalytic capability. Although the photocatalytic abilities of the nanohybrid varied based on different ratios, they were all superior to that of the MoS2 photocatalysts. With increases in concentrations of CoO@meso–CN nanoparticles, the photocatalysis of the developed heterojunction nanocomposites reached a maximum for the hybrid with 60 min, and it declined when the process was further prolonged. Similar studies were also conducted for the commercially available MoS2 in which the hybrid preceded by 60 min exhibited the best photocatalytic performance. Obviously, the nanohybrid displayed outstanding visible light photocatalytic efficiency compared with that of commercially available MoS2 powder. This result demonstrates that this nanohybrid decline organic compound has improved performance compared with pure MoS2 and CoO@meso–CN nanoparticles.
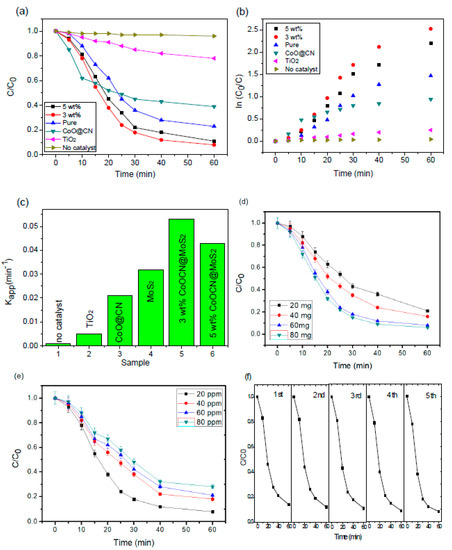
Figure 6.
Photocatalytic activity of CoO@meso–CN@MoS2 heterostructure materials towards MB degradation under visible light (60 mg catalyst, 500 mL 20 ppm RhB aqueous solution). (a) The photodegradation rate of RhB with different photocatalysts under visible light; (b) kinetics of degradation; (c) photodegradation rate constant; (d) various amount towards RhB degradation (3 wt% sample, 500 mL, 20 ppm RhB aqueous solution); (e) RhB degradation for various concentration (60 mg catalyst); and (f) the photocatalytic degradation of RhB for five cycles by photocatalyst.
The effect of the initial pH of the solution and the nanohybrid dosage from various organic compounds has been studied in this work. Figure 7a shows that the pH of the initial solution significantly impacts the photodegradation of RhB, CR, and MB. When the solution was neutral or alkaline, the removal performance of RhB, CR, and MB was lower than in the acidic solution (removal was raised from 42% to 92%, 32% to 95%, and 38% to 96%). However, the inter-attraction was weak when the pH value of solution was raised (pH > 7). Therefore, RhB, CR, and MB has distinguished remove performance in acidic solution because of the chromophore molecules. The percentage of RhB, CR, and MB removal was raised from 28% to 88%, 46% to 92% and 52% to 94% (pH = 7) when the nanohybrid dosage extended from 1 to 80 mg per 500 mL, as presented in Figure 7b. That is because the developed nanohybrid will contribute further oxidizing species to proceed with RhB, CR, and MB molecules. However, when the nanohybrid dosage is expanded to 40 mg per 500 mL, the percentage of dye removal slightly decreased due to the extra nanohybrid that increased the turbidity of the solution and covered part of the visible light. The degradation efficiency gradually decreases with increasing concentration of the three organic compound molecules. In order to assess the degradation rate of the organic pollutants (RhB, CR, and MB) examined in this work, total organic carbon (TOC) values of the pollutants were determined before and after 60 min of halogen lamps irradiation, and the results are presented in Figure 7c simultaneously with the degradation performance measured under the same conditions. The degradation rate of RhB, CR, and MB was verified by measuring the total organic carbon (TOC) degeneration. The TOC removal performance of RhB, CR, and MB reached 70.3%, 56.9%, and 83.2%, respectively. Note that all of the studied target pollutants can be significantly degraded with a halogen lamp as the driving light source. Therefore, using halogen lamps irradiation as the driving energy of a nanohybrid photocatalyst can be a potential tool for wastewater management. In order to recognize the stability and reusability of the as-prepared catalyst, nanocomposites were involved to reuse in the recycling test. The result is further achieved by XRD analysis of CoO@meso–CN@MoS2 nanohybrid before and after the photocatalytic degradation pathway of RhB. As shown in Figure 7d, it is remarkable that the major peaks of XRD pattern has nearly no changes after three continuing cycles, which serve to demonstrate that it has great photostability and reusability.
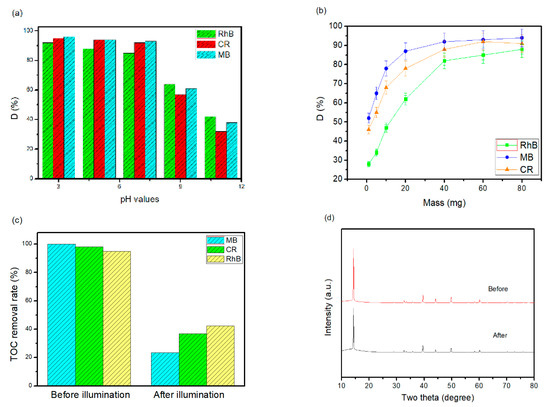
Figure 7.
(a) The effect of initial pH, (b) the effect of dosage on the degradation under visible light (500 mL, 20 ppm aqueous solution), (c) the TOC amount of organic dye before and after irradiation, and (d) XRD patterns of the fresh and used nanohybrid photocatalysts.
To further understand the photocatalysis process, trapping analyses of the active species were carried out during photocatalytic degradation of RhB. As indicated in Figure 8a, for nanocomposites, the photocatalytic degradation of RhB presents no noticeable change with isopropanol (IPA, 1 mmol/L, quencher of •OH) compared with no quencher, which suggests that •OH is not the primary active specie. When ethylenediaminetetraacetic acid disodium (EDTA-2Na, 1 mmol/L, quencher of h+) was included in the solution, the degradation of RhB slowed down slightly but was achieved at about 80 min, which implies that the photogenerated holes play a small part in the photocatalytic process. In comparison, a supplement of 1, 4-benzoquinone (BQ, 0.1 mmol/L, quencher of •O2−) led to complete quenching of photodegradation, suggesting that •O2− was the primary active species and plays a major role in the photocatalytic process. Thus, it is apparent that •O2− from the reaction of photogenerated electrons and O2 are the essential oxidative species, while the photogenerated h+ also support the absolute term for the degradation of RhB in the nanohybrid composite photocatalyst system. In addition, to demonstrate the active species generated in the scheme, an electron paramagnetic resonance (EPR) system was implemented to notice the generated radicals in the photocatalytic process under visible light irradiation using 5,5-dimethyl-1-pyrroline N-oxide (DMPO) as the radical trapping agent (Figure 8b), which can trap the •O2− form DMPO•O2− complexes. It is established that DMPO is commonly employed as a radical trapping agent forming DMPO•O2− and DMPO•OH− [19,20]. Briefly, 4 mg of the nanohybrid sample was dispersed in methanol (for •O2−) and, thus, DMPO (20 mM) was included with ultrasonic dispersion for 5 min. The signal intensity is continuously raised with increasing irradiation time. The component peaks of DMPO•O2—and DMPO•OH− can be detected in the methanol and aqueous dispersion of nanohybrid nanocomposite after visible light irradiation, implying that the •O2− radicals were developed from the reaction of photogenerated electrons and O2 molecules in the photocatalytic processes. Associated with the trapping analyze (Figure 8a), it can be assumed that •O2− played a crucial role in the photocatalytic process. These results suggest that •O2− is the primary active species and the principal mechanism for the great photocatalytic action, supported by h+, whereas •OH showed only a rather trivial role in the whole photocatalytic process.
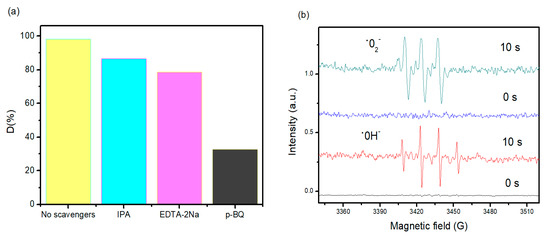
Figure 8.
(a) Trapping experiment of the active species during photocatalytic degradation of MB over nanohybrid nanocomposite alone and with the addition of EDTA (quencher of h+), BQ (quencher of •O2−), and IPA (quencher of •OH) under visible light irradiation, (b) EPR spectra of the superoxide radical adducts with DMPO in the nanohybrid system methanol and aqueous dispersion under visible light irradiation.
Photocatalytic response was formed when the photoexcited electron was benefit of the packed valence band of composite photocatalyst to the vacant conduction band as the absorbed photon energy, hν, equals or exceeds the band gap between the composite photocatalyst moving rear a hole in the valence band. Therefore, electron and hole pair (e−–h+) were formed. The bands of motive in photocatalysis are the occupied valence band (VB) and it is quite vacant conduction band (CB), which is commonly identified by band gap energy (Ebg). The heterostructure may be photoexcited by electron-donor zone (reducing locations) and electron-acceptor zone (oxidizing locations), serving superiority range of redox process. When the composite is irradiated with light (hν) of the largest power than that of the band gap, an electron is generated from the VB to the CB moving a positive hole from the valence band and a negative electron from the conduction bands as described in Figure 9. As visible light irradiation, negative electrons (e−) from the VB of MoS2 was excited to the CB, with equal amount of positive holes (h+) moved from VB. Transferred via the reduced potential energy, the photogenerated electrons from CB of MoS2 tended to move to that of CoO@meso–CN. As a result, the electron-hole separation from MoS2 interface would be two ways, namely, the photogenerated electrons from CB of CoO@meso–CN prone to move to CB of MoS2 with reducing potential, although the holes from VB of MoS2 shift to VB of CoO@meso–CN with higher potential. The photogenerated electrons and holes were separated from the interfaces of CoO@meso–CN@MoS2, which decreased their recombination opportunity and promoted them to emigrate productively to the interface of CoO@meso–CN and MoS2, respectively. Besides, another point suppressing the catalysis may be the apparent scale growth of the MoS2 aggregates which increased the migration distance among the interface-separated electrons from the surfaces of MoS2 and raised their recombination probability.
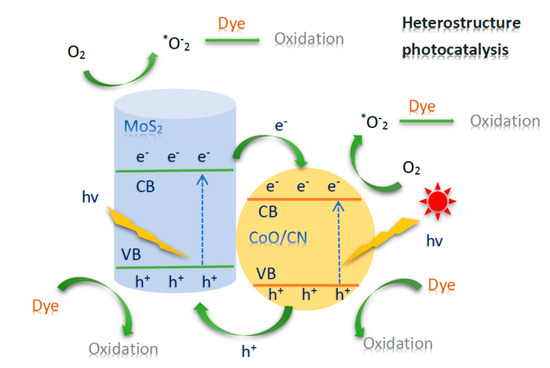
Figure 9.
Schematic illustration and energy diagram of the charge transfer and photocatalytic redox reaction in CoO@meso–CN@MoS2 photocatalysts.
3. Materials and Methods
3.1. Materials
Sodium molybdenum oxide dehydrated (Na2MoO4·2H2O, 98%), sodium thiocyanate (NaSCN, 98.0%), 1-methy-2-pyrrolidinone (NMP, 99%), acetone (CH3COCH3, 99.9%), anhydrous ethanol (C2H5OH, 98%), hydrochloric acid (36.5%), methylene blue (MB, C16H18CIN3S, 99%), Congo red (CR, C32H22N6Na2O6S2, ≥35%), degussa p25 titanium dioxide. (TiO2, Degussa, 99.9%), and methylene orange (MO, C14H14N3NaO3S, 85%) were purchased from (Sigma–Aldrich, St. Louis, MO, USA). All chemicals used in the experiments were utilized without further purification.
3.2. Synthesis of CoO/meso–CN/MoS2 Nanocrystals by a Hydrothermal Method
In a typical synthesis of MoS2 nanocrystals: 12.5 mmol (1.01 g) sodium molybdenum oxide dehydrate (Na2MoO4·2H2O), 5 mmol (1.21 g) sodium thiocyanate (NaSCN), and the 3~5 wt% CoO/mpg–CN nanoparticles [21] was independently ultrasonically dissolved in 30 mL of deionized water. Later, the following suspension was assigned to a 50 mL Teflon-lined autoclave. The hydrothermal operation was received at 200 °C for 24 h. Afterward, the autoclave’s temperature about the room was naturally cool. The precipitate was filtered and washed with deionized water, NMP, acetone, and absolute ethanol several times to take out the by-products. Suddenly, the comparable product was centrifuged at 12,000 rpms for 15 min to receive the hybrid nanocrystals. Subsequently, the product was dried under vacuum at 70 °C overnight and collected for its characterization, obtaining a nanocrystal yield of 35 wt%. The hydrothermal treatment and processing steps were carried out as described above.
where min and mout correspond to the mass of nanomaterial in the precursor and product, respectively.
3.3. Structure Characterization
Transmission electron microscopic (TEM) and high-resolution transmission electron microscopic (HRTEM) report were observed on a field-emission transmission electron microscopy (JEM-2000EX) employing an accelerating voltage of 160 kV (JEOL, Akishima, Tokyo, JAPAN). Ultraviolet–visible (UV–Vis) spectroscopy was indicated on a Hitachi U-3900H spectrophotometer (Hitachinaka-shi, Ibaraki, JAPAN). X-ray photoelectron spectroscopy (XPS) analyzes were operated on an X-ray photoelectron spectrometer (Thermo Fisher Scientific, Waltham, MA, USA). Raman spectra were indicated on a 3D Nanometer Scale Raman PL Microspectrometer Nanofinder 30, Tokyo Instruments using a 632 nm He-Ne laser. The BET analysis was reported to calculate the surface areas and pore size distributions (Micromeritics, Norcross, USA), while pore volume was displayed from the adsorption branches of the BJH method. The Nicolet iS10 FTIR spectrometer (Thermo Electron Scientific Instruments Corp., Shanghai, China) was noted to promote the functional groups of the sample (in the range of 500−4000 cm−1) by associating 0.01 g of the sample with 0.1 g of KBr (spectroscopy grade). The TGA analysis was achieved by applying a TA Instruments Q500 Thermogravimetric Analyzer (Hitachinaka-shi, Ibaraki, Japan), in what respect the samples were heated between 30 and 800 °C at a rate of 10 °C min−1 under a nitrogen atmosphere. Total organic carbon (TOC) is determined using a LOTIX-US 16011003 Carbon Analyzer.
3.4. Photocatalytic Performance
The organic compounds of Rhodamine B (RhB), methylene blue (MB), and Congo red (CR) were employed as the study molecule to explore the photocatalytic performance of the hybrids by visible light irradiation at room temperature. The photocatalysis analysis of visible light was conducted in a 50 mL glass bottle. Thus, a 300 W tungsten halogen lamp located around 10 cm from one side of the bottle, was presented as the illuminating energy source. Typically, 60 mg of materials was dispersed in 500 mL of 2 × 10⁻⁴ M (20 ppm) organic compound aqueous solution to serve as the control suspension. Before the irradiation of photodegradation action was established, all of the samples were magnetically stirred in the dark for 24 h to confirm the foundation of absorption/desorption equilibrium of organic compound on the component surfaces. Just as the irradiation, 4 mL aliquots were arranged at the applied time intervals and centrifuged for eliminate the catalysts and were analyzed on a UV–Vis spectroscopy (Hitachi U-3900H). The evolution of visible absorption spectrum was monitored within 2 h to prevent evaporation of solution. The samples were taken and analyzed periodically each 5 min and centrifuged with a speed of 8000 rpm/min for 5 min. The degradability of organic compound was indicated by C/C0, while C0 and C reveal the main absorption peak intensities of organic compound before and after irradiation.
The photodegradation performance (R, %) of organic dye can be counted following to Equation (6):
where, C0 (mg/L) is the initial amount of dye solution, Ct (mg/L) is the amount of dye solution after photoirradiation at time t (min), A0 is the factor of absorbance of dye solution after adsorption in the dark, and A is the factor of absorbance of dye solution after reaction. Nevertheless, adsorption/desorption equilibrium is to be confirmed under irradiation and catalysis actions, which is a significant matter necessity for the effectiveness of the Langmuir–Hinshelwood (L–H) standard. When the chemical amount C is millimolar solution, the combined form of Equation (7) is an apparent first order equation:
where, kapp represents apparent first order rate constant of the photocatalytic degradation, and t is response time. A plot of ln (C0/Ct) versus time shows a straight line, the slope of which upon linear reverted matches the apparent first order rate constant kapp.
4. Conclusions
As a heterostructure photocatalyst, CoO@meso–CN@MoS2 nanocomposites displayed excellent photocatalytic redox efficiency for pollutant degradation under visible light. This MoS2 heterojunction-based work demonstrates a potential inspiration for developing a number of suitable heterojunction semiconductor photocatalysts for the improvement of photocatalytic activity. The effect of variation of the amount of catalyst, initial dye concentration and pH on the degradation of organic compounds was investigated. The experimental results demonstrated that, under ultraviolet light, nanocomposites had a degradation rate of 93% for RhB, which was two times more than that of the pure MoS2 catalysts. Moreover, our nanocomposites also exhibited excellent reusability and stability, resulting from the stable chemical connection between CoO@meso–CN and MoS2. In these processes, the highly active holes induced by photoexcitation had a great effect on photocatalytic degradation of organic compounds. In summary, the long-term stability of the photocatalyst was investigated to utilize it as a desired property to satisfy the application in real wastewater treatment in the future.
Author Contributions
Methodology, J.-H.C., and L.C.; investigation, L.C. and S.T.; resources, Y.-L.L., C.-H.W., L.C. and T.B.N.; writing—original draft preparation, L.C.; writing—review and editing, L.C.; T.B.N.; C.-W.C. and C.-D.D.; supervision, C.-W.C. and C.-D.D.; project administration, C.-W.C., and C.-D.D. All authors have read and agreed to the published version of the manuscript.
Funding
The authors wish to thank the Ministry of Science and Technology (MOST), Taiwan, for generous financial support under grant No. 106-2221-E-002-002-MY3.
Conflicts of Interest
The authors declare no conflict of interest.
References
- Li, P.; Kim, S.; Jin, J.; Do, H.C.; Park, J.H. Efficient photodegradation of volatile organic compounds by iron-based metal-organic frameworks with high adsorption capacity. Appl. Catal. B Environ. 2020, 263, 118284. [Google Scholar] [CrossRef]
- Bazta, O.; Urbieta, A.; Trasobares, S.; Piqueras, J.; Fernández, P.; Addou, M.; Calvino, J.J.; Hungría, A.B. In-Depth Structural and Optical Analysis of Ce-modified ZnO Nanopowders with Enhanced Photocatalytic Activity Prepared by Microwave-Assisted Hydrothermal Method. Catalysts 2020, 10, 551. [Google Scholar] [CrossRef]
- Khalil, A.; Nasser, W.S.; Osman, T.A.; Toprak, M.S.; Muhammed, M.; Uheida, A. Surface modified of polyacrylonitrile nanofibers by TiO2/MWCNT for photodegradation of organic dyes and pharmaceutical drugs under visible light irradiation. Environ. Res. 2019, 179, 108788. [Google Scholar] [CrossRef]
- Chenab, K.K.; Sohrabi, B.; Jafari, A.; Ramakrishna, S. Water treatment: Functional nanomaterials and applications from adsorption to photodegradation. Mater. Today Chem. 2020, 16, 100262. [Google Scholar] [CrossRef]
- Ali, L.I.; El-Molla, S.A.; Ibrahim, M.; Mahmoud, H.; Naghmash, M.A. Effect of preparation methods and optical band gap of ZnO nanomaterials on photodegradation studies. Opt. Mater. 2016, 58, 484–490. [Google Scholar] [CrossRef]
- Liu, B.; Zhou, K. Recent progress on graphene-analogous 2D nanomaterials: Properties, modeling and applications. Prog. Mater. Sci. 2019, 100, 99–169. [Google Scholar] [CrossRef]
- Li, H.; Shen, H.; Duan, L.; Liu, R.; Li, Q.; Zhang, Q.; Zhao, X. Enhanced photocatalytic activity and synthesis of ZnO nanorods/MoS2 composites. Superlattices Microstruct. 2018, 117, 336–341. [Google Scholar] [CrossRef]
- Wu, M.-H.; Li, L.; Liu, N.; Wang, D.-J.; Xue, Y.-C.; Tang, L. Molybdenum disulfide (MoS2) as a co-catalyst for photocatalytic degradation of organic contaminants: A review. Process. Saf. Environ. Prot. 2018, 118, 40–58. [Google Scholar] [CrossRef]
- Alhaddada, M.; Shawky, A. Superior photooxidative desulfurization of thiophene by reduced graphene oxide-supported MoS2 nanoflakes under visible light. Fuel Process. Technol. 2020, 205, 106453. [Google Scholar] [CrossRef]
- Si, Y.; Chen, Y.; Fu, Y.; Zhang, X.; Zuo, F.; Zhang, T.; Yan, Q. Hierarchical self-assembly of graphene-bridged on AgIO3/BiVO4: An efficient heterogeneous photocatalyst with enhanced photodegradation of organic pollutant under visible light. J. Alloys Compd. 2020, 831, 154820. [Google Scholar] [CrossRef]
- Bai, J.; Lv, W.; Ni, Z.; Wang, Z.; Chen, G.; Xu, H.; Qin, H.; Zheng, Z.; Lib, X. Integrating MoS2 on sulfur-doped porous g-C3N4 iostype heterojunction hybrids enhances visible-light photocatalytic performance. J. Alloys Compd. 2018, 768, 766–774. [Google Scholar] [CrossRef]
- Ruidíaz-Martínez, M.; Álvarez, M.A.; López-Ramón, M.V.; Cruz-Quesada, G.; Rivera-Utrilla, J.; Sánchez-Polo, M. Hydrothermal Synthesis of rGO-TiO2 Composites as High-Performance UV Photocatalysts for Ethylparaben Degradation. Catalysts 2020, 10, 520. [Google Scholar] [CrossRef]
- Borah, P.; Siboh, D.; Kalita, P.; Sarma, J.; Nath, N.M. Quantum confinement induced shift in energy band edges and band gap of a spherical quantum dot. Phys. B Condens. Matter 2018, 530, 208–214. [Google Scholar] [CrossRef]
- Vattikuti, S.P.; Nagajyothi, P.C.; Reddy, P.A.K.; Kumar, M.K.; Shim, J.; Byon, C. Tiny MoO3 nanocrystals self-assembled on folded molybdenum disulfide nanosheets via a hydrothermal method for supercapacitor. Mater. Res. Lett. 2018, 6, 432–441. [Google Scholar] [CrossRef]
- Luo, W.; Hu, W. Gibbs free energy, surface stress and melting point of nanoparticle. Phys. B Condens. Matter 2013, 425, 90–94. [Google Scholar] [CrossRef]
- Maret, M.; Gilles, B.; Simon, J.P.; Verdier, M.; Guhr, I.; Riedlinger, B.; Albrecht, M.; Schatz, G. Self-assemblingof alloy nanostructures on van der Waals surfaces. J. Cryst. Growth 2005, 275, e2289–e2293. [Google Scholar] [CrossRef]
- Sim, D.M.; Han, H.J.; Yim, S.; Choi, M.-J.; Jeon, J.; Jung, Y.S. Long-Term Stable 2H-MoS2 Dispersion: Critical Role of Solvent for Simultaneous Phase Restoration and Surface Functionalization of Liquid-Exfoliated MoS2. ACS Omega 2017, 2, 4678–4687. [Google Scholar] [CrossRef]
- Zhang, F.-J.; Li, X.; Sun, X.-Y.; Kong, C.; Xie, W.-J.; Li, Z.; Liu, J.; Li, Z. Surface partially oxidized MoS2 nanosheets as a higher efficient cocatalyst for photocatalytic hydrogen production. Appl. Surf. Sci. 2019, 487, 734–742. [Google Scholar] [CrossRef]
- Liu, H.; Liang, J.; Shao, L.; Du, J.; Gao, Q.; Fu, S.; Li, L.; Hu, M.; Zhao, F.; Zhou, J. Promoting charge separation in dual defect mediated Z-scheme MoS2/gC3N4 photocatalysts for enhanced photocatalytic degradation activity: Synergistic effect insight. Colloids Surf. A 2020, 594, 124668. [Google Scholar] [CrossRef]
- Ahamad, T.; Naushad, M.; Al-Saeedi, S.I.; Almotairi, S.; Alshehri, S.M. Fabrication of MoS2/ZnS embedded in N/S doped carbon for the photocatalytic degradation of pesticide. Mater. Lett. 2020, 263, 127271. [Google Scholar] [CrossRef]
- Nguyen, T.B.; Doong, R.-A.; Huang, C.-P.; Chen, C.-W.; Dong, C.-D. Activation of persulfate by CoO nanoparticles loaded on 3D mesoporous carbon nitride (CoO@meso-CN) for the degradation of methylene blue (MB). Sci. Total Environ. 2019, 675, 531–541. [Google Scholar] [CrossRef] [PubMed]
© 2020 by the authors. Licensee MDPI, Basel, Switzerland. This article is an open access article distributed under the terms and conditions of the Creative Commons Attribution (CC BY) license (http://creativecommons.org/licenses/by/4.0/).