Article

The Effect of Electrolytes on the Photodegradation Kinetics of Caffeine

1
Environmental Physical Chemistry Laboratory, MIGAL, Galilee Research Institute, Kiryat Shmona 1101600, Israel
2
Department of Environmental Sciences, Tel-Hai College, Upper Galilee 1220800, Israel
*
Author to whom correspondence should be addressed.
Catalysts 2020, 10(6), 644; https://doi.org/10.3390/catal10060644
Submission received: 23 April 2020 / Revised: 2 June 2020 / Accepted: 4 June 2020 / Published: 8 June 2020
(This article belongs to the Special Issue Photocatalytic Degradation of Organic Wastes in Water)

Abstract

:
Unsuccessfully treated by the existing wastewater-treatment processes, caffeine concentrations in wastewater effluents and natural reservoirs are constantly rising. Photodegradation treatment processes are drawing much attention due to their potential to oxidize and remove such, and similar contaminating compounds from treated waters. In continuation to our previous work on the photodegradation kinetics of caffeine in water by UV/H2O2 and UV/TiO2, this work evaluates the influence of various electrolytes, including NaCl, KCl, MgCl2, NaBr, and KBr, on the kinetics of the UV/H2O2 photodegradation of caffeine, aiming at estimating the efficiency of the method in more complex water systems. Results show that the efficiency of the UV/H2O2 photodegradation reactions is strongly affected by ionic strength and the presence of electrolytes in the solution. While chloride electrolytes were shown to optimize or reduce the process efficiency pending on their concentration. The sole presence of NaBr and KBr shows an immediate reduction in the efficiency of the photodegradation. Empirical apparent-rate-coefficients and curves describing the effect of the different electrolytes on the photodegradation kinetics of caffeine are presented.

Graphical Abstract

1. Introduction

Caffeine is a naturally occurring alkaloid compound widely consumed by the world’s population, with an estimated average daily per capita consumption of about 320 mg day−1 [1]. Thus, it is widely identified in seawater, lakes, and aquifers around the globe [2,3,4,5], consequently rising concerns regarding its potential impact on natural ecosystems, as well as on agriculture and aquaculture. Such concerns intensify in arid countries where potable desalinated water is regularly consumed, and wastewaters are widely recycled for agriculture use [6].
With the wide recognition of caffeine and other pharmaceutical and personal care products (PPCPs) as emerging contaminants in the aquatic environment [4,7,8,9], there is an increasing demand to incorporate innovative and complementary water-treatment technologies in municipal wastewater-treatment facilities, in order to reduce the presence of emerging contaminants from the treated effluents [10,11,12]. Thus, a comprehensive evaluation of the photodegradation kinetics of such contaminants and the possible effect of other constituents in the solution is crucial for the optimization and scale-up of new emerging technologies.
Advanced oxidation processes (AOP) are defined as “those which involve the generation of hydroxyl radicals in sufficient quantity to affect water purification” [13]. AOPs include several catalytic or non-catalytic processes that take advantage of the high oxidizing capacity of such radicals, regardless of how this radical is generated [9]. Research on AOP processes increases constantly [14]. Many AOP processes and technologies are being developed and evaluated to tackle the efficient removal of pollutants with the minimum formation of hazardous byproducts [15,16,17,18,19,20]. In our previous study [21], we experimentally evaluated the degradation kinetics of pure caffeine solutions by UV/H2O2 means and established new empirical and theoretical rate laws that describe the degradation kinetics at various UV-C doses (1.9–15.2 mJ cm−2 s−1, λ = 254 nm).
Despite great advances in the field, there are rising concerns regarding the efficiency and ability of AOP processes in general, and UV/H2O2 photodegradation methods and technologies to cope with large-scale water treatments that include solutions like brines, seawater and common wastewater. These solutions may challenge degradation technologies as they include inorganic salts, large organic loads, and solid particles, which may significantly change the way degradation reactions occur [22,23,24,25,26,27]. For example, it was shown that chloride, nitrate, perchlorate, and sulfate ions considerably influence the oxidation of organic compounds by Fenton’s process performed in the dark [28]. Furthermore, AOP processes might yield to the formation of dangerous halogenated compounds [29]. Thus, such solutions are mostly avoided as their complexity may impose technical challenges as well as barriers in the interpretation of experimental results. Therefore, a more gradually complexation of the experimental solutions may bridge up the gap.
Aiming to estimate the efficiency of the UV/H2O2 photodegradation method in more complex water systems, we expanded our experimental work by introducing various electrolytes into the caffeine solution. The photodegradation kinetics of caffeine in solutions containing different concentrations of NaCl, KCl, MgCl2, NaBr, and KBr were evaluated. The finding of this work may be used as a preliminary guideline for future research and the evaluation of UV/H2O2 treatments in more complex solutions.

2. Results and Discussion

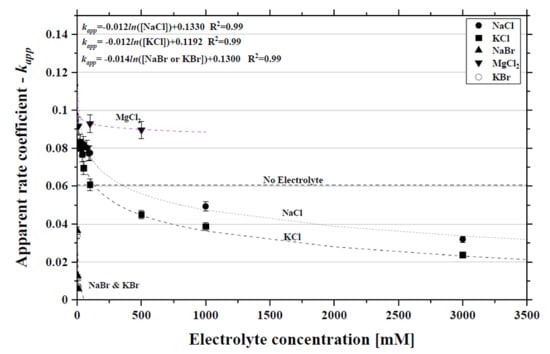
2.1. Caffeine Photodegradation in the Presence of NaCl, KCl and MgCl2 Electrolytes

The photodegradation of caffeine as a function of NaCl, KCl, and MgCl2 concentration is presented in Figure 1. The red marked plot in all panels shows the experimental results of an experiment without electrolytes (further referred to as “base-line”), plots obtained above and below the “base-line”, show to have slower or faster kinetics respectively. Note that not all the experimental results are plotted in Figure 1; since results in the range of 1–100 Mm NaCl and 1–50 mM KCl tend to have similar rate coefficients (within uncertainty), their results overlap and therefore, are represented by a single representative experiment in each plot. The experiments show a removal rate of ~80%–95% (further degradation was not evaluated due to analytical limitations). The photodegradation trend fits very well with pseudo-zero-order kinetics (Appendix A) as shown by the linear decrease in the relative concentration A with time (Equation (A1)). Compared to the “base-line”, the apparent rate coefficient kapp in experiments with very low electrolytes concentrations (<50 mM for KCl and <100 mM for NaCl) appears to be stable (within uncertainties) with a slightly higher efficiency increases as it can be measured by the decrease in half-life time (as seen in Figure 1) from about 8 to 5–7 min. Each rate coefficient shows an average increase of 31%, 27%, and 39% respectively (Figure 2), whereas, in experiments with higher concentrations, it shows to follow a logarithmic decline. Consequently, in those experiments (>0.5 M of NaCl and KCl), the apparent rate coefficient decreases below the “base-line” resulting in a slower reaction rate. Half-life time increases up to 15 min for NaCl and even 20 min for KCl (Figure 1). An exception was obtained in experiments with MgCl2, where reaction rates stayed above the “base-line” at concentrations of up to 0.5 M (Figure 3), which was the maximum concentration tested for that electrolyte. Note that due to a lack of sufficient data, the regression of the MgCl2 experiments is only an approximation, and no equation is provided.
The improved photodegradation at low concentrations of sodium and potassium chloride, accompanied by a decrease in efficiency at higher concentrations correlate with other recent findings that reported photodegradation rates in the presence of low concentrations of electrolytes [24,25,26]. MgCl2 behaves differently, with improved efficiency at 0.1 M remaining stable at 0.5 M.
Lanzafame et al. (2017) reported a higher photodegradation rate while photodegrading methyl-anthranilate in the presence of a low concentration of NaCl (0.1 M) and suggested a possible explanation to these phenomena, based on the affinity of chloride to accelerate UV/H2O2 photodegradation reactions by scavenging ·HO radicals and yielding “more reactive” Cl2 radicals as described in the following reaction path (Equations (1)–(3)) [24]:
HO + Cl ↔ HOCl [Keq,1 = 0.70 M−1],
HOCl·+ H+ ↔ H2O + Cl· [Keq,2 = 1.6 × 10⁷ M−1],
Cl·+ Cl ↔ Cl2 [Keq,3 = 1.9 × 10⁵ M−1].
It should be taken into account that the suggested mechanism by Lanzafame et al., (2017) reduces the concentration of the hydroxyl radicals in the solution (i.e., ·HO), therefore occasionally it might reduce the efficiency of the process if the product of the process (Cl2) results to be less efficient in the degradation of the tested compound. However, the mentioned researchers deduced that the product’s degradation efficiency is larger than that of ·HO.
Despite the possible positive effect Cl may have on the photodegradation rates, slower rates were measured in the experiments with high chloride concentrations (0.5, 1, and 3 M). In order to determine the optimal concentration of electrolyte for maximum efficiency and minimum half-life time, a continuation study including additional experimental data-points in the range of 0.1–1 M of chloride salts is needed. Such a study might help to elucidate the full degradation path.
As a preliminary assumption, we hypothesize that the positive influence on the photodegradation rates attributed to the newly formed chlorine radicals might be hindered at high electrolyte concentrations experiments (>0.5 M) by other possible influences related to the very high ionic strength. At such conditions, the activity coefficient of the species in solution reaches relatively high values. For example, the activity coefficients of Cl and Na+ increase from 0.077 to 0.644 and from 0.079 to 0.781 when solution concentrations increase from 0.1 and 1 M for NaCl and KCl respectively (calculated using Phreeqc v.3, USGS, USA [30]). Therefore, the possible effect of such changes on the overall chemical processes, including photodegradation cannot be ruled out.
The possible influence of the different cations is also unclear. By comparing experiments with concentrations higher than 100 mM of KCl and NaCl, similar trends can be seen but at different degradation rates (Figure 3). On the other hand, Mg2+ has a much stable behavior than the monovalent cations, even though each mole of MgCl2 has twice as moles of Cl than Mg2+. In general, it seems that Mg2+ yields a completely different effect from the observed with Na+ or K+. It can also be seen that Mg2+ tends to enhance the reaction rate and lower the time required for degradation (see Figure 1c). Such differences might be related to specific interactions or the different hydration shells, however, further studies are required in order to fully elucidate the possible effect of each specific cation (K+, Na+ and, Mg2+) on photodegradation kinetics, and research on the full degradation mechanisms is needed.

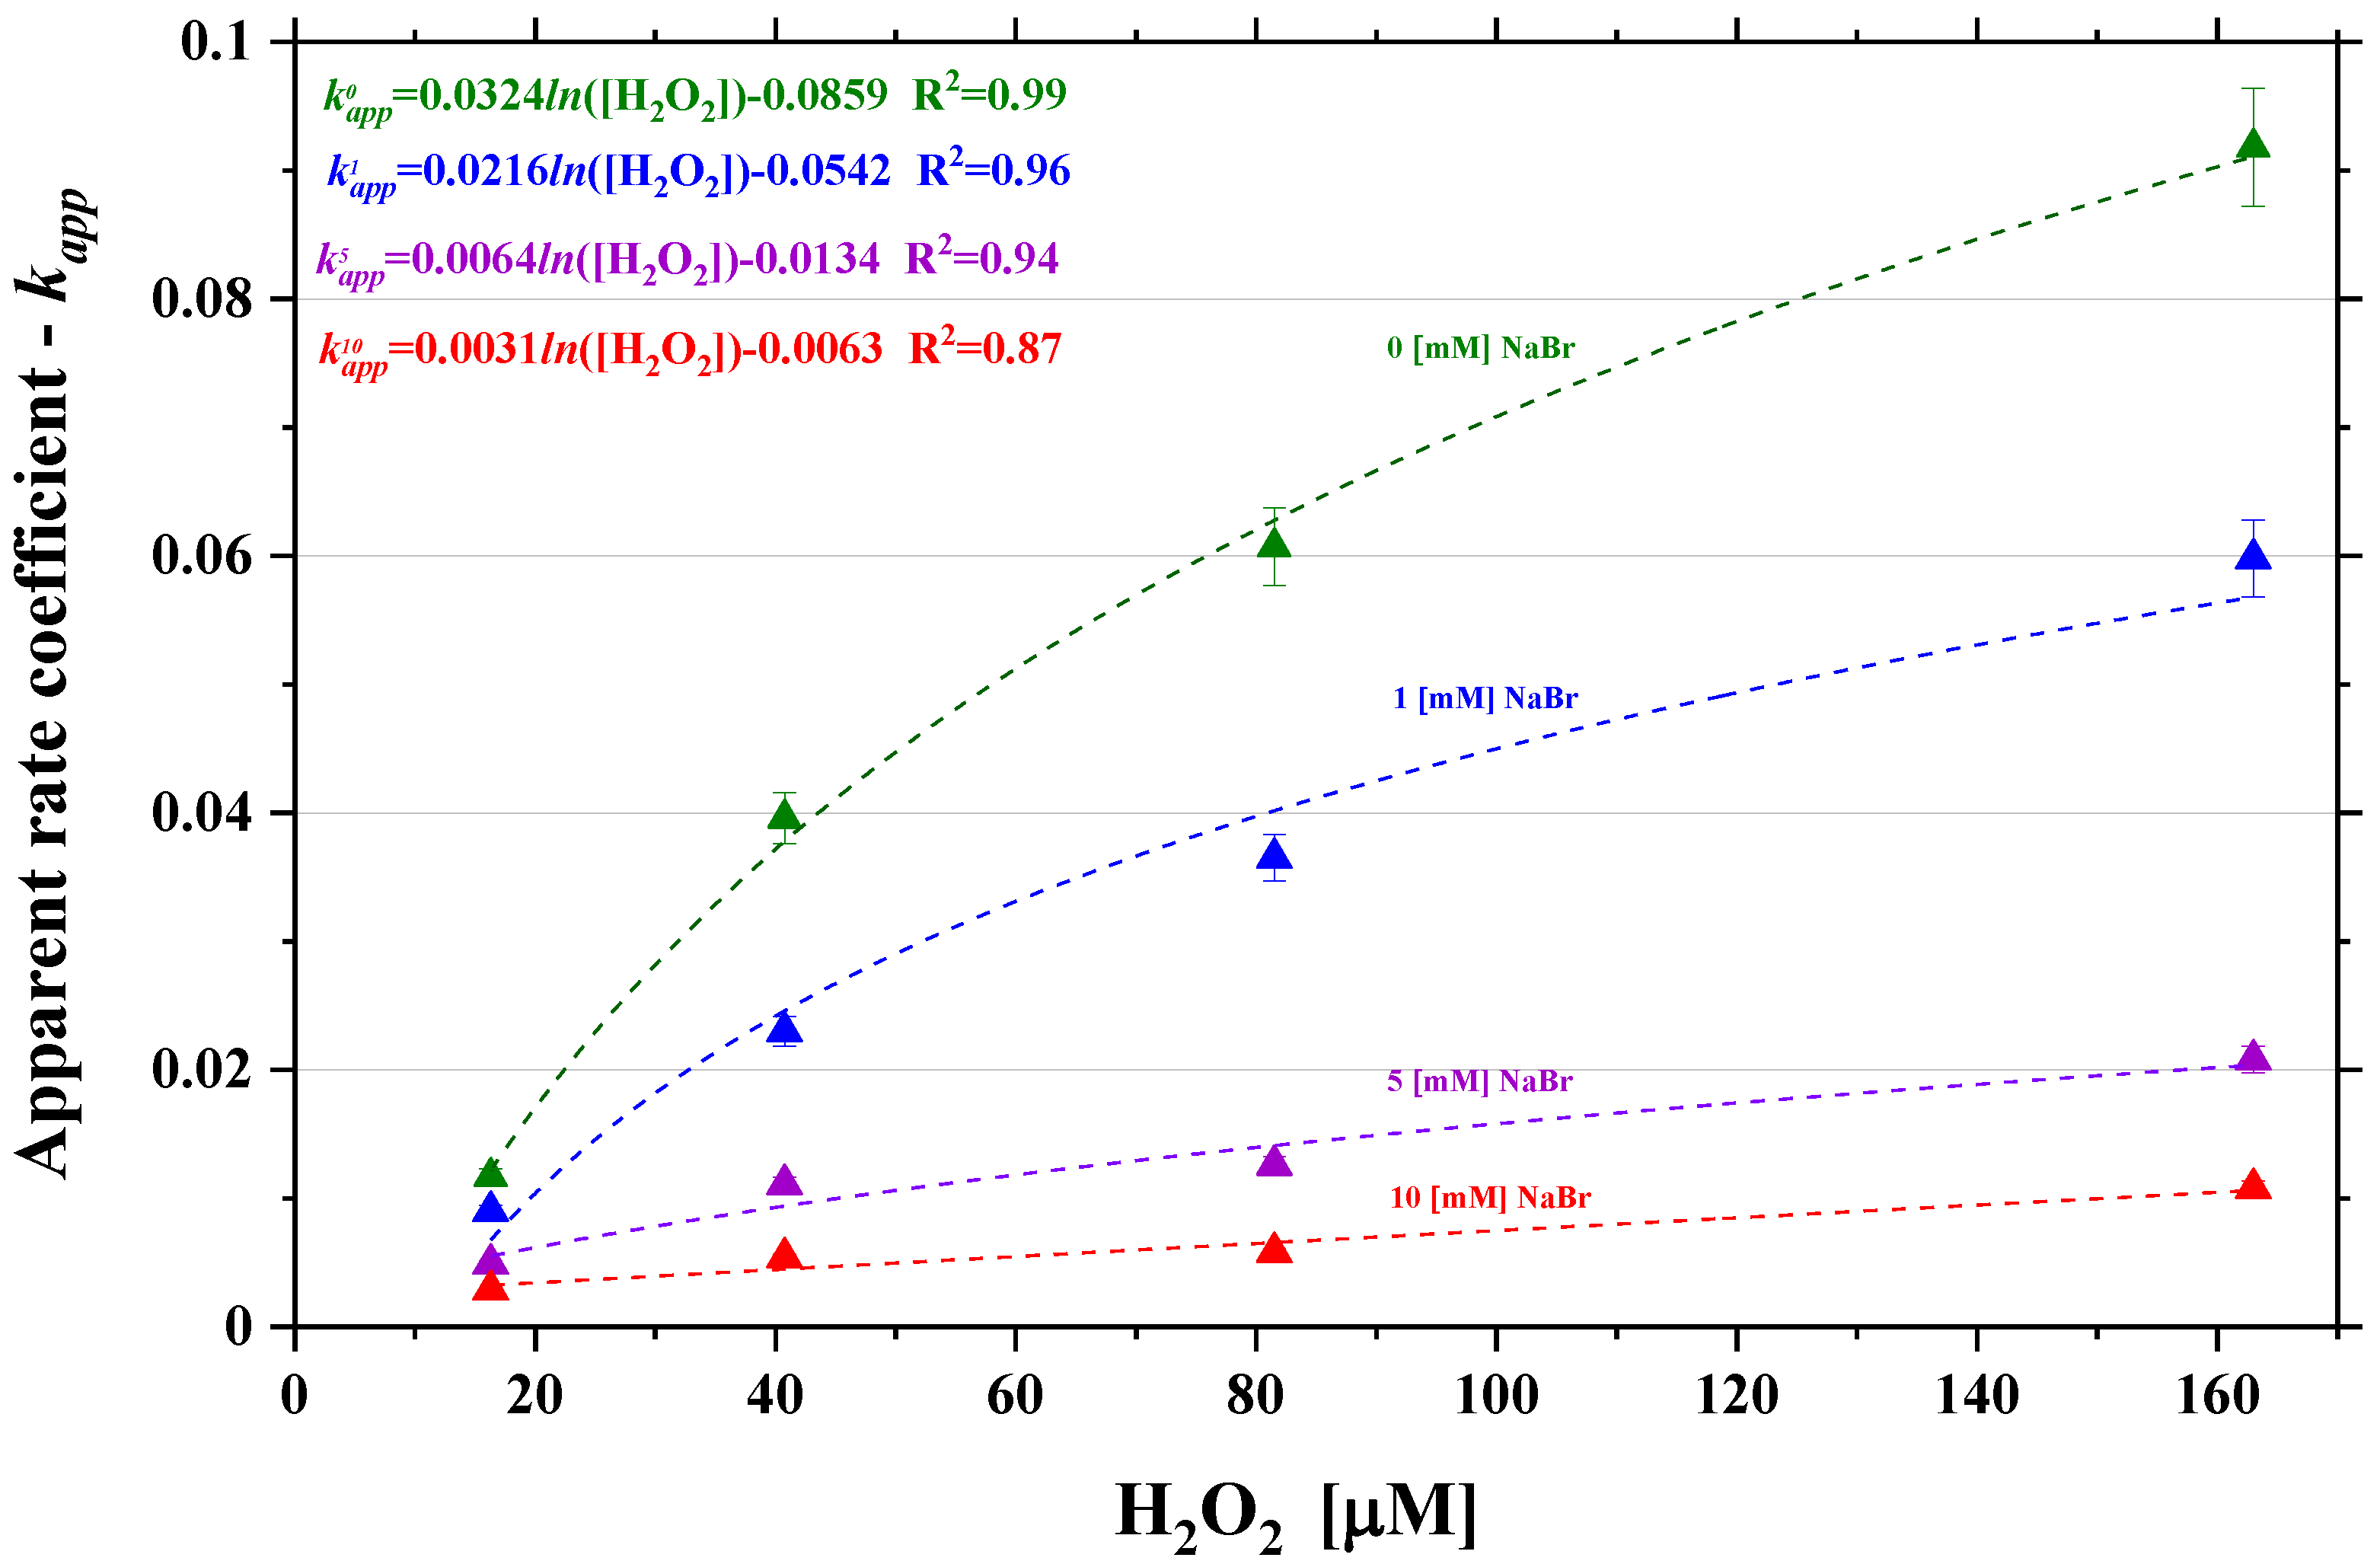
2.2. Caffeine Photodegradation in the Presence of KBr and NaBr Electrolytes

The presence KBr and NaBr electrolytes had a strong impact on the photodegradation rates of caffeine, as the apparent rate coefficient decreased by more than 40% in the presence of a very low concentration of roughly 1 mM of KBr or NaBr (Figure 2). Both bromide salts follow a similar degradation trend, implying that the Br anion is the one responsible for the observed effect. Similar to the other discussed electrolytes, the apparent rate coefficient to decreased logarithmically as the concentration increased. The apparent rate coefficient as a function of a low-range NaBr concentration (<10 mM) in the presence of different H2O2 concentrations is shown in Figure 4 and Figure 5. As previously seen, the results show a significant decrease in the photodegradation rate of caffeine, while NaBr is introduced into the solution.
This sharp decrease in the photodegradation rate can be explained by two H2O2 competing decomposition-reactions which take place simultaneously in the solution: (a) photocatalytic decomposition, which creates ·OH radicals by decomposing H2O2 with UVC radiation (Equation (4)); (b) Br catalysis, on which Br acts as a catalyst in the decomposition reaction of H2O2 in the solution, and turns H2O2 into H2O and O2 (Equations (5) and (6)) [31].
H2O2 + hv → 2·OH,
H2O2 + 2Br + 2H+ → Br2 + 2H2O,
Br2 + H2O2 → 2Br + 2H+ + O2.
The Br catalytic reaction appears to have much faster kinetics than the photocatalytic reaction has, resulting in low concentrations of ·OH radicals, which are an essential component in any degradation process. Therefore, the introduction of any Br into the system may eventually prevent the photocatalytic degradation reaction to take place as expected.
Further reinforcement to this conclusion can be seen in Figure 5 wherein experiments with higher concentrations of H2O2 have higher degradation efficiency, proving that the lack of ·OH radicals may be the reason for the reduction of the photodegradation efficiency.
Apparently, pH should have a direct impact on the H2O2 decomposition catalyzed by Br, since protons react according to Equation (5) but are a product of Equation (6); their total concentration remains unchanged and their influence is mainly on the rate of decomposition of H2O2 that increases at very low pH values [31]. However, it remains significant even at neutral pH as it is shown in our study.
Figure 4 and Figure 5 present calculated apparent rate coefficients for Equation (A1), according to a pseudo-zero-order process, since such order yields a relatively good fit for all experiments. Table A1 in Appendix B presents the apparent rate coefficients and the empirical equations for each order, and their relative R2 fitting parameters.
It can be seen that at high NaBr concentrations (see Table A2), the fit to pseudo-zero-order decreases and a slightly better fit (in terms of R2) to pseudo-first, and even -second-order reaction is observed. We assume that if those slight differences indicate real effects, this might be ascribed to the fact that as bromine concentration increases, the influence on the H2O2-degradation changes the overall process, making the influence of caffeine concentration more significant. Such changes in the order of the process can only be fully elucidated by finding a full set of elementary steps for the whole process as presented in the past for processes like Michaelis-Menten, Lindeman-Hindelwood, or even our previous study [21].

3. Materials and Methods

The degradation kinetics of caffeine in the presence of the different electrolytes was evaluated by performing a series of batch experiments in a mini photochemical chamber reactor following the same procedure previously described at Rendel and Rytwo, (2020) [21]. Electrolyte solutions with concentrations ranging from 1.0 mM to 3.0 M were prepared by mixing their corresponding salts (Sigma-Aldrich, St. Louis, MI, USA) with deionized water. Final solutions containing both caffeine and the different electrolytes were exposed to UV-C radiation (254 nm wavelength and intensity of 15.2 mJ cm−2 s−1) in the presence of 81.5 µmol L−1 (2.77 mg L−1) H2O2 oxidation agent (Merck, Darmstadt, Germany). An exception was done in the experiments with NaBr were H2O2 concentration varies in the range of 16.3–163 µmol L−1 (0.55–5.54 mg L−1). A detailed experimental plan is presented in Table 1.

Experimental Setup

The degradation reaction was performed in a Rayonet RMR-600 mini photochemical chamber reactor (Southern New England Ultraviolet Company, Branford, CT, USA) and periodically sampled for UV–VIS spectroscopy measurement of caffeine concentration in a 8452A diode array spectrophotometer driven by Chemstation 06.03 software (Hewlett Packard Palo Alto, Ca, USA). Following the same protocol detailed described in Reference [21]. The uncertainty of the measurements was estimated at less than 3%.

4. Summary and Conclusions

Considering the present constituents in treated waters are crucial to accurately evaluate the efficiency of AOP processes, this study presents an experimental work performed to elucidate the effect of electrolytes on the photocatalytic degradation process, using caffeine as a representative PPCPs substance contaminating the aquatic environment. The experimental work focused on the effect caused by the presence of different concentrations of chloride and bromide electrolytes in caffeine solutions, reacting in a photocatalytic reactor in the presence of H2O2. As for relatively low chloride electrolytes, the results (Figure 2), show that the apparent rate coefficient (as presented in Equation (A1)) increased, whereas at higher electrolyte concentrations a decrease in kapp was observed in the presence of monovalent cations, whereas as for a divalent cation (Mg2+) this effect was not seen. The results as presented in Figure 3 show good agreement with the regression equations that empirically correlate between the apparent coefficient and the electrolyte concentration. Such kind of empirical curve might be used in combination with pseudo-rate-laws (as Equation (A1)) to deliver an evaluation of photodegradation processes at different electrolyte concentrations in the range of 0.1–3 M.
This study provides further evidence on the crucial role electrolytes might have, either in the creation of potential radicals that contribute to the acceleration or inhibition of the degradation reaction (as in Cl) or in the complete “quenching” of the degradation (as in Br).
As for the chloride electrolytes, no clear explanation was found for the differences in efficiency as a function of Cl concentration, although it may be assumed that the overall reduction of the reaction rate at high salt concentrations may be related to effects of the ionic strength on the activity coefficients, to the formation of other species, or the influence of specific cations in the solution matrix, as has been shown in the case of KCl and NaCl. It can be concluded that waters with up to 100 mM of chloridic electrolytes have a good response to photocatalytic degradation treatments, but a possible reduction in the process efficiency may be found at higher concentrations. On the other hand, MgCl2 has an overall positive effect on the photodegradation reaction rates (Figure 3). If the effect is proven to be real for other cases, this electrolyte may be considered as a potential additive to accelerate photodegradation reactions. However, additional studies are required to indeed fully understand if it is a specific effect of Mg2+ or if other divalent (as Ca2+) or even trivalent (Y3+, La3+) cations act similarly when added as chloride salts.
As mentioned above, for the bromidic electrolytes, measurements show a massive decrease in the reaction rate even at very low electrolyte concentrations, completely interfering with the photodegradation process in the presence of more than 1 mM Br, as shown in Figure 4. This could be assumed a priori, considering studies on the fast catalytic degradation of H2O2 by Br ions in the solution [31], leading to a reduction in oxidation potential due to the lack of ·OH radicals created by the interaction with the UVC radiation. It can be concluded that even at low concentrations of Br in solution (either in natural water or in industrial effluents) UV/H2O2 degradation processes should be completely avoided.
In summary, this work exhibits an empiric relation between the presence of different electrolytes and their effect on caffeine degradation rates, as well as some preliminary hypotheses on the possible reasons leading to these changes. The presented conclusions, as well as the apparent coefficients equations combined with Equation (A1) pseudo-rate-law, can be used as a preliminary guideline to evaluate the potential effect of dissolved electrolytes in water and effluents’ treatments based on UV/H2O2 technologies.

Author Contributions

P.M.R., designed and performed the experiments, derived the models and analyzed the data and wrote the manuscript with inputs from G.R., which designed the experimental setup, and supervised the project. All authors have read and agreed to the published version of the manuscript.

Funding

This research was supported by a MIGAL internal grant.

Acknowledgments

We would like to express our gratitude to J. Borzenko and C. Michaeli for their technical assistance and to the guest editors of this special issue for their consideration, José Rivera-Utrilla, María V. López-Ramón, and Manuel Sánchez-Polo. We would also like to express our gratitude and appreciation for the detailed and enlightening review carried out by the editor and anonymous reviewers.

Conflicts of Interest

The authors declare no conflict of interest.

Appendix A

Apparent Rate Coefficient Calculations

Caffeine degradation can be defined by a simple rate law while considering all parameters (e.g., degradation agent concentration, irradiation rate, temperature, etc.) as constant:
υ = d [ C ] d t = k a p p [ C ] n a p p ,
where υ is the reaction rate, kapp is the apparent rate coefficient, C is the caffeine concentration and napp is the apparent or “pseudo” reaction order. napp can be found empirically and is related to the mechanism by which the process occurs. The term “pseudo” is usually used to acknowledge the fact that all other influencing parameters (degradation agent, temperature, light, etc.) were kept constant, either actually (as in catalysts) or virtually (their initial concentration was so large that the change in concentration was insignificant [32].
To simplify the calculations and allow comparisons between parameters in different reaction mechanisms, the “relative concentration at time t” (A) was defined as Ct/C0 (the ratio of actual to initial concentration); thus A0 = 1. Since A is dimensionless, none of the parameters had concentration units. This is convenient since it yields apparent kinetic coefficients that always have dimensions per time, regardless of the order of the process [16]. Specific rate laws for pseudo zero and first-order kinetics are shown in Appendix B at Rendel and Rytwo, (2020) [21].

Appendix B

Table A1. Apparent rate coefficients for Equation (A1) at pseudo-zero, -first, and -second-order reaction derived from the NaBr-KBr experimental results.
Exp. #Apparent Rate Coefficient kapp [min−1]
Pseudo-Zero-OrderR2Pseudo-First-OrderR2Pseudo-Second-OrderR2
320.00900.93740.01500.99870.02880.9485
330.00490.93470.00630.98310.00840.9974
340.00290.89800.00350.94230.00500.9916
350.02860.99140.04510.97710.07990.8629
360.02300.99020.03680.97550.06690.8508
370.01110.96260.01680.99850.02830.9564
380.00540.93070.00720.98590.00980.9980
390.03650.99360.06140.97880.13200.8342
400.01260.93180.02080.99880.03920.9389
410.00580.76680.00910.93980.01570.9930
420.05980.99190.09340.98420.16250.8967
430.02080.96300.03480.99210.07840.8814
440.01080.91940.01760.99720.03400.9691
450.03410.99060.05040.99010.10090.8736
460.01110.87090.02050.99580.04670.9304
470.00690.87040.01010.96590.01590.9934
An estimated 5% uncertainty is considered for the presented apparent rate coefficient values.
Table A2. Equations for the evaluation of the apparent rate coefficients in Equation (A1), assuming pseudo-zero, -first, or -second-order reaction derived from the NaBr-KBr experimental results.
Empirical Curves
NaBr [mM]Pseudo-zero-orderR2Pseudo-first-orderR2Pseudo-second-orderR2
1kapp = 0.0216ln([H2O2]) − 0.05420.96kapp = 0.0338ln([H2O2]) − 0.08360.98kapp = 0.0609ln([H2O2]) − 0.14610.97
5kapp = 0.0064ln([H2O2]) − 0.01340.94kapp = 0.0117ln([H2O2]) − 0.02710.95kapp = 0.0287ln([H2O2]) − 0.07610.92
10kapp = 0.0031ln([H2O2]) − 0.00630.87kapp = 0.0057ln([H2O2]) − 0.01350.89kapp = 0.0119ln([H2O2]) − 0.03160.86
H2O2 [µM]Pseudo-zero-orderR2Pseudo-first-orderR2Pseudo-second-orderR2
163.0kapp = −0.022ln([NaBr]) + 0.20950.99kapp = −0.034ln([NaBr]) + 0.32400.99kapp = −0.055ln([NaBr]) + 0.54480.99
81.50kapp = −0.014ln([NaBr]) + 0.13000.99kapp = −0.023ln([NaBr]) + 0.22060.99kapp = −0.052ln([NaBr]) + 0.48740.99
40.75kapp = −0.008ln([NaBr]) + 0.07610.99kapp = −0.013ln([NaBr]) + 0.12370.99kapp = −0.024ln([NaBr]) + 0.22770.99
16.30kapp = −0.003ln([NaBr]) + 0.02720.99kapp = −0.005ln([NaBr]) + 0.04990.99kapp = −0.011ln([NaBr]) + 0.10230.97

References

  1. Gracia-Lor, E.; Rousis, N.I.; Zuccato, E.; Bade, R.; Baz-Lomba, J.A.; Castrignanò, E.; Causanilles, A.; Hernández, F.; Kasprzyk-Hordern, B.; Kinyua, J.; et al. Estimation of caffeine intake from analysis of caffeine metabolites in wastewater. Sci. Total Environ. 2017, 609, 1582–1588. [Google Scholar] [CrossRef] [PubMed] [Green Version]
  2. Dafouz, R.; Cáceres, N.; Rodríguez-Gil, J.L.; Mastroianni, N.; López de Alda, M.; Barceló, D.; de Miguel, Á.G.; Valcárcel, Y. Does the presence of caffeine in the marine environment represent an environmental risk? A regional and global study. Sci. Total Environ. 2018, 615, 632–642. [Google Scholar] [CrossRef] [PubMed]
  3. Nödler, K.; Voutsa, D.; Licha, T. Polar organic micropollutants in the coastal environment of different marine systems. Mar. Pollut. Bull. 2014, 85, 50–59. [Google Scholar] [CrossRef] [PubMed]
  4. Buerge, I.J.; Poiger, T.; Müller, M.D.; Buser, H.R. Caffeine, an anthropogenic marker for wastewater contamination of surface waters. Environ. Sci. Technol. 2003, 37, 691–700. [Google Scholar] [CrossRef]
  5. Pearson, H. Caffeine tracks contamination. Nature 2003. [Google Scholar] [CrossRef]
  6. Wu, X.; Ernst, F.; Conkle, J.L.; Gan, J. Comparative uptake and translocation of pharmaceutical and personal care products (PPCPs) by common vegetables. Environ. Int. 2013, 60, 15–22. [Google Scholar] [CrossRef]
  7. Petrie, B.; Barden, R.; Kasprzyk-Hordern, B. A review on emerging contaminants in wastewaters and the environment: Current knowledge, understudied areas and recommendations for future monitoring. Water Res. 2015, 72, 3–27. [Google Scholar] [CrossRef]
  8. Ebele, A.J.; Abou-Elwafa Abdallah, M.; Harrad, S. Pharmaceuticals and personal care products (PPCPs) in the freshwater aquatic environment. Emerg. Contam. 2017, 3, 1–16. [Google Scholar] [CrossRef]
  9. Loos, R.; Carvalho, R.; Comero, S.; António, D.; Ghiani, M.; Lettieri, T.; Locoro, G.; Paracchini, B.; Tavazzi, S.; Gawlik, B. EU Wide Monitoring Survey on Waste Water Treatment Plant Effluents. Water Res. 2013, 47, 6475–6487. [Google Scholar] [CrossRef]
  10. Sui, Q.; Huang, J.; Deng, S.; Yu, G.; Fan, Q. Occurrence and removal of pharmaceuticals, caffeine and DEET in wastewater treatment plants of Beijing, China. Water Res. 2010, 44, 417–426. [Google Scholar] [CrossRef]
  11. Froehner, S.; Piccioni, W.; Machado, K.S.; Aisse, M.M. Removal capacity of caffeine, hormones, and bisphenol by aerobic and anaerobic sewage treatment. Water. Air Soil Pollut. 2011, 216, 463–471. [Google Scholar] [CrossRef]
  12. Trovó, A.G.; Silva, T.F.S.; Gomes, O.; Machado, A.E.H.; Neto, W.B.; Muller, P.S.; Daniel, D. Degradation of caffeine by photo-Fenton process: Optimization of treatment conditions using experimental design. Chemosphere 2013, 90, 170–175. [Google Scholar] [CrossRef] [PubMed] [Green Version]
  13. Glaze, W.H.; Kang, J.-W.; Chapin, D.H. The Chemistry of Water Treatment Processes Involving Ozone, Hydrogen Peroxide and Ultraviolet Radiation. Ozone Sci. Eng. 1987, 9, 335–352. [Google Scholar] [CrossRef]
  14. Garrido-Cardenas, J.A.; Esteban-García, B.; Agüera, A.; Sánchez-Pérez, J.A.; Manzano-Agugliaro, F. Wastewater treatment by advanced oxidation process and their worldwide research trends. Int. J. Environ. Res. Public Health 2020, 17, 170. [Google Scholar] [CrossRef] [Green Version]
  15. Cuerda-correa, E.M.; Alexandre-franco, M.F.; Fern, C. Antibiotics from Water. An Overview. Water 2020, 12, 1–50. [Google Scholar]
  16. Rytwo, G.; Klein, T.; Margalit, S.; Mor, O.; Naftaly, A.; Daskal, G. A continuous-flow device for photocatalytic degradation and full mineralization of priority pollutants in water. Desalin. Water Treat. 2015, 57, 16424–16434. [Google Scholar] [CrossRef]
  17. Rytwo, G.; Daskal, G. A System for Treatment of Polluted Effluents 2016. U.S. Patent 15/512,516, 19 October 2017. [Google Scholar]
  18. Oturan, M.A.; Aaron, J.-J. Advanced Oxidation Processes in Water/Wastewater Treatment: Principles and Applications. A Review. Crit. Rev. Environ. Sci. Technol. 2014, 44, 2577–2641. [Google Scholar] [CrossRef]
  19. Deng, Y.; Zhao, R. Advanced Oxidation Processes (AOPs) in Wastewater Treatment. Curr. Pollut. Rep. 2015, 1, 167–176. [Google Scholar] [CrossRef] [Green Version]
  20. Chong, M.N.; Jin, B.; Chow, C.W.K.; Saint, C. Recent developments in photocatalytic water treatment technology: A review. Water Res. 2010, 44, 2997–3027. [Google Scholar] [CrossRef]
  21. Rendel, P.M.; Rytwo, G. Degradation kinetics of caffeine in water by UV/H2O2 and UV/TiO2. Desalin. Water Treat. 2020, 173, 231–242. [Google Scholar] [CrossRef]
  22. Autin, O.; Hart, J.; Jarvis, P.; MacAdam, J.; Parsons, S.A.; Jefferson, B. The impact of background organic matter and alkalinity on the degradation of the pesticide metaldehyde by two advanced oxidation processes: UV/H2O2 and UV/TiO2. Water Res. 2013, 47, 2041–2049. [Google Scholar] [CrossRef] [PubMed]
  23. Garcia-Muñoz, P.; Dachtler, W.; Altmayer, B.; Schulz, R.; Robert, D.; Seitz, F.; Rosenfeldt, R.; Keller, N. Reaction pathways, kinetics and toxicity assessment during the photocatalytic degradation of glyphosate and myclobutanil pesticides: Influence of the aqueous matrix. Chem. Eng. J. 2020, 384, 123315. [Google Scholar] [CrossRef]
  24. Lanzafame, G.M.; Sarakha, M.; Fabbri, D.; Vione, D. Degradation of methyl 2-aminobenzoate (methyl anthranilate) by H2O2/UV: Effect of inorganic anions and derived radicals. Molecules 2017, 22, 619. [Google Scholar] [CrossRef] [PubMed] [Green Version]
  25. Liao, C.H.; Kang, S.F.; Wu, F.A. Hydroxyl radical scavenging role of chloride and bicarbonate ions in the H2O2/UV process. Chemosphere 2001, 44, 1193–1200. [Google Scholar] [CrossRef]
  26. Riga, A.; Soutsas, K.; Ntampegliotis, K.; Karayannis, V.; Papapolymerou, G. Effect of system parameters and of inorganic salts on the decolorization and degradation of Procion H-exl dyes. Comparison of H2O2/UV, Fenton, UV/Fenton, TiO2/UV and TiO2/UV/H2O2 processes. Desalination 2007, 211, 72–86. [Google Scholar] [CrossRef]
  27. Rioja, N.; Zorita, S.; Peñas, F.J. Effect of water matrix on photocatalytic degradation and general kinetic modeling. Appl. Catal. B Environ. 2016, 180, 330–335. [Google Scholar] [CrossRef]
  28. De Laat, J.; Truong Le, G.; Legube, B. A comparative study of the effects of chloride, sulfate and nitrate ions on the rates of decomposition of H2O2 and organic compounds by Fe(II)/H2O2 and Fe(III)/H2O2. Chemosphere 2004, 55, 715–723. [Google Scholar] [CrossRef] [PubMed]
  29. Sharma, A.; Ahmad, J.; Flora, S.J.S. Application of advanced oxidation processes and toxicity assessment of transformation products. Environ. Res. 2018, 167, 223–233. [Google Scholar] [CrossRef] [PubMed]
  30. Parkhurst, D.L.; Appelo, C.A.J. PHREEQC 2.14. 3 A computer program for speciation, batch-reaction, one-dimentional transport and inverse geochemical calculation. Water-Resour. Investig. Rep. 2007, 99, 4259. [Google Scholar]
  31. Bray, W.C.; Livingston, R.S. The catalytic decomposition of hydrogen peroxide in a bromine-bromide solution, and a study of the steady state. J. Am. Chem. Soc. 1923, 45, 1251–1271. [Google Scholar] [CrossRef]
  32. IUPAC. Compendium of Chemical Terminology: Gold Book. IUPAC Compend. Chem. Terminol. 2014, 1670. [Google Scholar]
Figure 1. Degradation of caffeine as a function of time, at various NaCl (a), KCl (b), and MgCl2 (c) concentrations. Plots were evaluated using a pseudo-zero-order kinetic model.
Catalysts 10 00644 g001
Figure 2. Apparent rate coefficients (kapp) as a function of low electrolytes concentrations (<120 mM). (electrolytes are represented by different symbols). Dashed plots represent a logarithmic regression fitting as described by the equations in Figure 2.
Catalysts 10 00644 g002
Figure 3. Apparent rate coefficients (kapp) as a function of electrolyte concentration (electrolytes are represented by different symbols). Dashed plots represent a logarithmic regression fitting as described by the equations inside the figure.
Catalysts 10 00644 g003
Figure 4. Apparent rate coefficients (kapp) as a function of NaBr concentrations, in the presence of different H2O2 concentrations in µM (16.3, 40.75, 81.5 and 163 represented by the different colors: red, purple, blue and green respectively). Dashed plots represent a logarithmic regression fitting as described by the equations.
Catalysts 10 00644 g004
Figure 5. Apparent rate coefficients (kapp) as a function of H2O2 concentrations, in the presence of different NaBr concentrations in mM (10, 5, 1, and 0 represented by the different colors: red, purple, blue and green respectively). Dashed plots represent a logarithmic regression fitting as described by the equations.
Catalysts 10 00644 g005
Table 1. Experiments and results.
Exp. #Electrolyte TypeElectrolyte Concentration [mmol L−1]H2O2 Concentration [µmol L−1]Apparent Rate Coefficient kapp [min−1]
1Non,Baseline081.50.0607
2NaCl181.50.0760
3NaCl381.50.0816
4NaCl581.50.0805
5NaCl1081.50.0796
6NaCl2581.50.0794
7NaCl5081.50.0821
8NaCl7581.50.0802
9NaCl9081.50.0772
10NaCl10081.50.0786
11NaCl100081.50.0493
12NaCl300081.50.0320
13KCl181.50.0725
14KCl1.581.50.0804
15KCl381.50.0851
16KCl581.50.0762
17KCl1081.50.0742
18KCl1581.50.0744
19KCl2081.50.0768
20KCl2581.50.0831
21KCl3081.50.0800
22KCl4081.50.0766
23KCl5081.50.0695
24KCl10081.50.0607
25KCl50081.50.0450
26KCl100081.50.0387
27KCl300081.50.0237
28MgCl2181.50.0771
29MgCl21081.50.0917
30MgCl210081.50.0929
31MgCl250081.50.0896
32NaBr116.30.0090
33NaBr516.30.0049
34NaBr1016.30.0029
35NaBr0.540.750.0286
36NaBr140.750.0230
37NaBr540.750.0111
38NaBr1040.750.0054
39NaBr181.50.0365
40NaBr581.50.0126
41NaBr1081.50.0058
42NaBr11630.0598
43NaBr51630.0208
44NaBr101630.0108
45KBr181.50.0341
46KBr581.50.0111
47KBr1081.50.0069
All experiments conducted with a caffeine concentration of 19.6 mg L−1, a 5% uncertainty is estimated for the apparent rate-coefficients.

