Article

Parametric Sensitivity Analysis for the Industrial Case of O-Xylene Oxidation to Phthalic Anhydride in a Packed Bed Catalytic Reactor

by
Santiago Zuluaga-Botero
1,
Izabela Dobrosz-Gómez
2 and
Miguel-Ángel Gómez-García
1,*
1
Grupo de Investigación en Procesos Reactivos Intensificados y Materiales Avanzados—PRISMA, Departamento de Ingeniería Química, Facultad de Ingeniería y Arquitectura, Universidad Nacional de Colombia, Sede Manizales, Manizales 170004, Colombia
2
Grupo de Investigación en Procesos Reactivos Intensificados y Materiales Avanzados—PRISMA, Departamento de Física y Química, Facultad de Ciencias Exactas y Naturales, Universidad Nacional de Colombia, Sede Manizales, Manizales 170004, Colombia
*
Author to whom correspondence should be addressed.
Catalysts 2020, 10(6), 626; https://doi.org/10.3390/catal10060626
Submission received: 1 May 2020 / Revised: 27 May 2020 / Accepted: 28 May 2020 / Published: 4 June 2020
(This article belongs to the Special Issue Commemorative Issue in Honor of Professor Hugo de Lasa)

Abstract

:
The operation of packed bed tubular reactors, for exothermic catalytic reactions, presents special challenges provoked by hotspot development. Their potential safety risk can be assessed using different mathematical methodologies, among them, the so-called parametric sensitivity analysis (PSA). This study deals with the identification of safe operational conditions (e.g., feed temperature conditions) for the catalytic oxidation of o-xylene. Three different reaction networks, with different degrees of complexity, were analyzed. Thus, the critical values of the operating parameters, allowing us to define run-away and stable operation conditions, were provided for different reactive configurations. The obtained results were compared with the data reported by various authors who used similar reaction rate laws. The purpose of the present study is to illustrate the peculiarities of the PSA and its application for the design, analysis, and operation of o-xylene multitubular catalytic reactor.

Graphical Abstract

1. Introduction

It is with great respect and profound admiration that we dedicate this work to Professor Hugo de Lasa on the occasion of honoring and recognizing his outstanding career contributions to the fields of heterogeneous catalysis, photocatalysis and catalytic reaction engineering. In the subject of modelling and analysis of catalytic chemical reactors, it is not unjust to claim a starring place for Professor Hugo de Lasa. Indeed, from the intelligent use of mathematical models during his early contributions (e.g., Soria Lopez and de Lasa, 1981 [1]; de Lasa, 1983 [2]; Arandes and de Lasa, 1995 [3]), Professor de Lasa exemplified his remarkable modeling and analytical skills. Professor de Lasa has set inspiration and charted the course between the oversimplification and clouding details for parametric sensitivity analysis of fixed bed catalytic reactors. So far, his intellect, wisdom and research contributions continue to influence us deeply.
Packed Bed Tubular Reactors (PBRs) are considered the workhorses of the chemical and petrochemical industries. Indeed, they are usually the first choice for large-scale production. PBRs, in their multi-tubular scheme, are preferred for highly exothermic reactions, such as the partial oxidation of different hydrocarbons [4]. Any effort to quantify the phenomena taking place in a PBR must consider the mass and heat transport between the reactive fluid and the catalyst, the pressure drop for flow through the packed bed, and the energy balance on the heat-exchange fluid. The inherent two-way coupling between concentration and temperature causes chemical reactors to show exceptional behaviors, such as a slight change in one or more inlet parameter, which can enormously alter the reactor effluent conditions. Bilous and Amundson [5] called this phenomenon parametric sensitivity. When a PBR operates in the parametrically sensitive region, its performance becomes unreliable. For instance, a slight increase in the inlet reactive-fluid temperature can lead to a large rise in the reaction rate (due to the exponential temperature dependence of the rate constant). The increased reaction rate results in more heat generation which furthermore increases the reaction temperature. This feedback mechanism results in the so-called reactor runaway (when the rate of heat generation far exceeds the rate of heat removal). Such increase in the reaction temperature can damage the reactor, can generate safety hazards, can cause catalyst deactivation, and can propitiate undesirable side reactions [6]. Thus, it would be of great value to reactor designers and operators to be able to predict parametric sensitivity conditions.
The solution of the rigorous model describing non-isothermal PBRs has proven to be extremely challenging. Additionally, the level of complexity increases when including mathematical tools for parametric sensitivity analysis. Fortunately, recent advances in computational resources have enabled their simultaneous simulation. During the last three decades, the use of the following four methodologies for parametric sensitivity analysis has become widespread: (i) Temperature-partial pressure phase plane [7]; (ii) The sensitivity indices method [8]; (iii) The divergence methods, based on chaos theory [9] and (iv) The methods of trajectory extension [10]. This rough classification implies that, although the runaway phenomenon is well known, a unique analysis approach does not exist. One of the purposes of the present work is to compare the results obtained using the temperature-partial pressure phase plane (e.g., by de Lasa, [2]) vs. those obtained using the sensitivity indices method for the case of the catalytic (with V2O5) oxidation of ortho-xylene (o-xylene) for producing phthalic anhydride. This is a classic example of a fast oxidation reaction which, if not controlled, produces CO and CO2 (COx) instead of valuable products. It has been pointed out in the open literature that a multitubular PBR is indispensable and that procedures for obtaining nearly complete conversion without causing a runaway must be guaranteed [11]. Industrially, the reactive process proceeds at atmospheric pressure, in the temperature range of 360–400 °C, reaching almost complete o-xylene conversion and with a phthalic anhydride selectivity between 70–75% [12]. Ortho-tolualdehyde (o-tolualdehyde) and phthalide are the main intermediates. However, depending on operation conditions, maleic anhydride can also be generated (Figure 1). It is evident that the o-xylene oxidation process is highly complex.
Different approaches and assumptions, proposed by several researchers in the literature, yielded some models for o-xylene disappearance. The only probable agreement between the different authors is that the reactions occur through a “redox” mechanism. Table 1 includes some of the reaction steps considered by different investigators for kinetic studies or reactor modelling. For practical purposes, more than just the reaction rate of o-xylene to phthalic anhydride (step 6 in Figure 1) is needed. To model the highly temperature-sensitive system, the competition between phthalic anhydride and complete oxidation must be followed at least, which causes large heat effects [14,15].
To illustrate the effect of o-xylene oxidation mechanism on reactor performance prediction, three different models were considered in Figure 2 (data used for simulation will be presented later on). Regardless of the difference of the kinetic model used for simulation, a common behavior of the temperature profile occurs: a hotspot is predicted at some position in the PBR. However, the magnitude of the hotspot depends on the reaction kinetics. It is also interesting to note that, for the conditions used in these calculations, the predicted o-xylene conversions are significantly different.
The influence of the PBR parameters (parametric sensitivity), such as operation conditions and reaction kinetics on o-xylene oxidation, with constant physicochemical properties, was analyzed using the temperature-partial pressure phase plane by several authors as follows:
  • van Welsenaere and Froment, (1970) [7] introduced, for an ideal, one-dimensional PBR model, with constant wall temperature, two criteria for runaway based on an intrinsic property of the reactive system. They transposed the peak temperature and the conditions of the inflexion points for the prediction of the critical values for the operating variables. Their work also treats the related problem of a hotspot which has to be limited for reasons other than runaway.
  • Soria-López et al. (1981) [1], as an extension of van Welsenaere and Froment’s [7] work, analyzed an ideal, one-dimensional PBR model, with co-current external cooling, under two types of operation modes: (i) the temperature along the reactor axis increases monotonically; that is, without a hotspot can occur under certain conditions (referred to as pseudo-adiabatic operations, PAO), and (ii) the temperature shows a maximum at a finite axial reactor position (MFARP). Limiting operation conditions were defined between MFARP temperature curves and PAO curves.
  • de Lasa (1983) [2], continuing Soria-López et al.’s work [1], studied the peculiarities of PAO and its significance for the design and operational conditions of o-xylene oxidation in multi-tubular reactors using reaction networks models of different complexity.
  • Akella and Lee (1983) [22] studied, for an ideal, one-dimensional PBR model, a counter-current operation. The runaway conditions were derived from a phase plane of feed and coolant inlet temperatures.
  • Hosten and Froment (1986) [23] extended the van Welsenaere and Froment (1970) [7] approach to co-currently cooled PBRs with wall temperature variation with reactor length.
  • Later, Arandes and de Lasa (1995) [3] extended the PAO analysis to the following operation regimens in PBRs: isothermal, decreasing temperature profile, cold spot, hotspot–cold spot, and cold spot–hotspot.
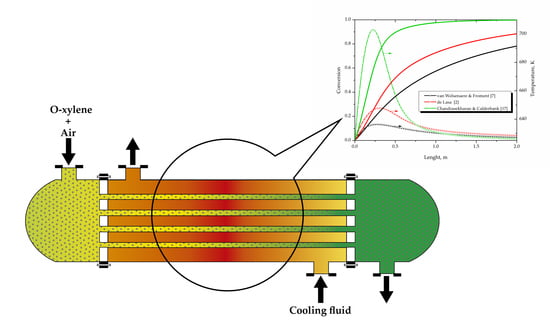
From another perspective of analysis, Henning and Perez (1986) [16] defined, for o-xylene oxidation reaction, a criterion for runaway in PBRs based on the behavior of the sensitivity indices along the reactor, when the temperature variation in a co-current cooling medium is considered. Their analysis was not restricted to simple kinetics.
It is interesting to observe that all of the above-mentioned works neglected the pressure drop for flow through a packed bed. However, in gas phase reactions, the concentration of the reacting species is proportional to the total pressure. Therefore, a proper account of the effect of pressure variation on the PBR is a key factor in the success of reactor operation.
This work deals with the definition of suitable inlet reactor conditions (e.g., temperature and pressure leading to safe o-xylene oxidation reactor operation) applying a sensitivity indices method to the analysis of a non-isothermal PBR model, which includes: mass and heat balances inside (packed bed) and outside (shell side: in co-current or countercurrent flow) the reactor tubes and the pressure drop balance (Ergun equation). For comparison, three different reaction networks, with different degrees of complexity, are analyzed: (i) a pseudo-first-order kinetic model, used by van Welsenaere and Froment [7], which includes a single reaction (step 6 in Figure 1); (ii) a three-step reaction model (steps 5, 6 and 11 in Figure 1), as used by de Lasa [2], and (iii) the Chandrasekharan and Calderbank [17] kinetic model involving five steps of reaction (steps 1, 2, 3, 6 and 11 in Figure 1). Thus, the previously reported a priori runaway conditions for hotspot operation are compared with the new obtained criteria. Additionally, the boundary between safe and unsafe operation regions will be established.

2. Reactor Model

Previous work [24,25] indicated that a one-dimensional, pseudo-homogeneous, PBR model can be considered adequate for the analysis for o-xylene oxidation. Thus, the model used in this work is based on the following assumptions:
  • The PBR is operating at steady state conditions.
  • Molar flows, pressure and temperature gradients only occur in the axial direction. The only transport mechanism operating in this direction is the overall flow itself, and this is considered to be of the plug flow type.
  • The parameters M, u, ρg, C p g ρc, C p c wc, U, G, Rep are assumed to be independent of temperature.
  • There are neither temperature nor concentration differences between the fluid and the catalyst particle.
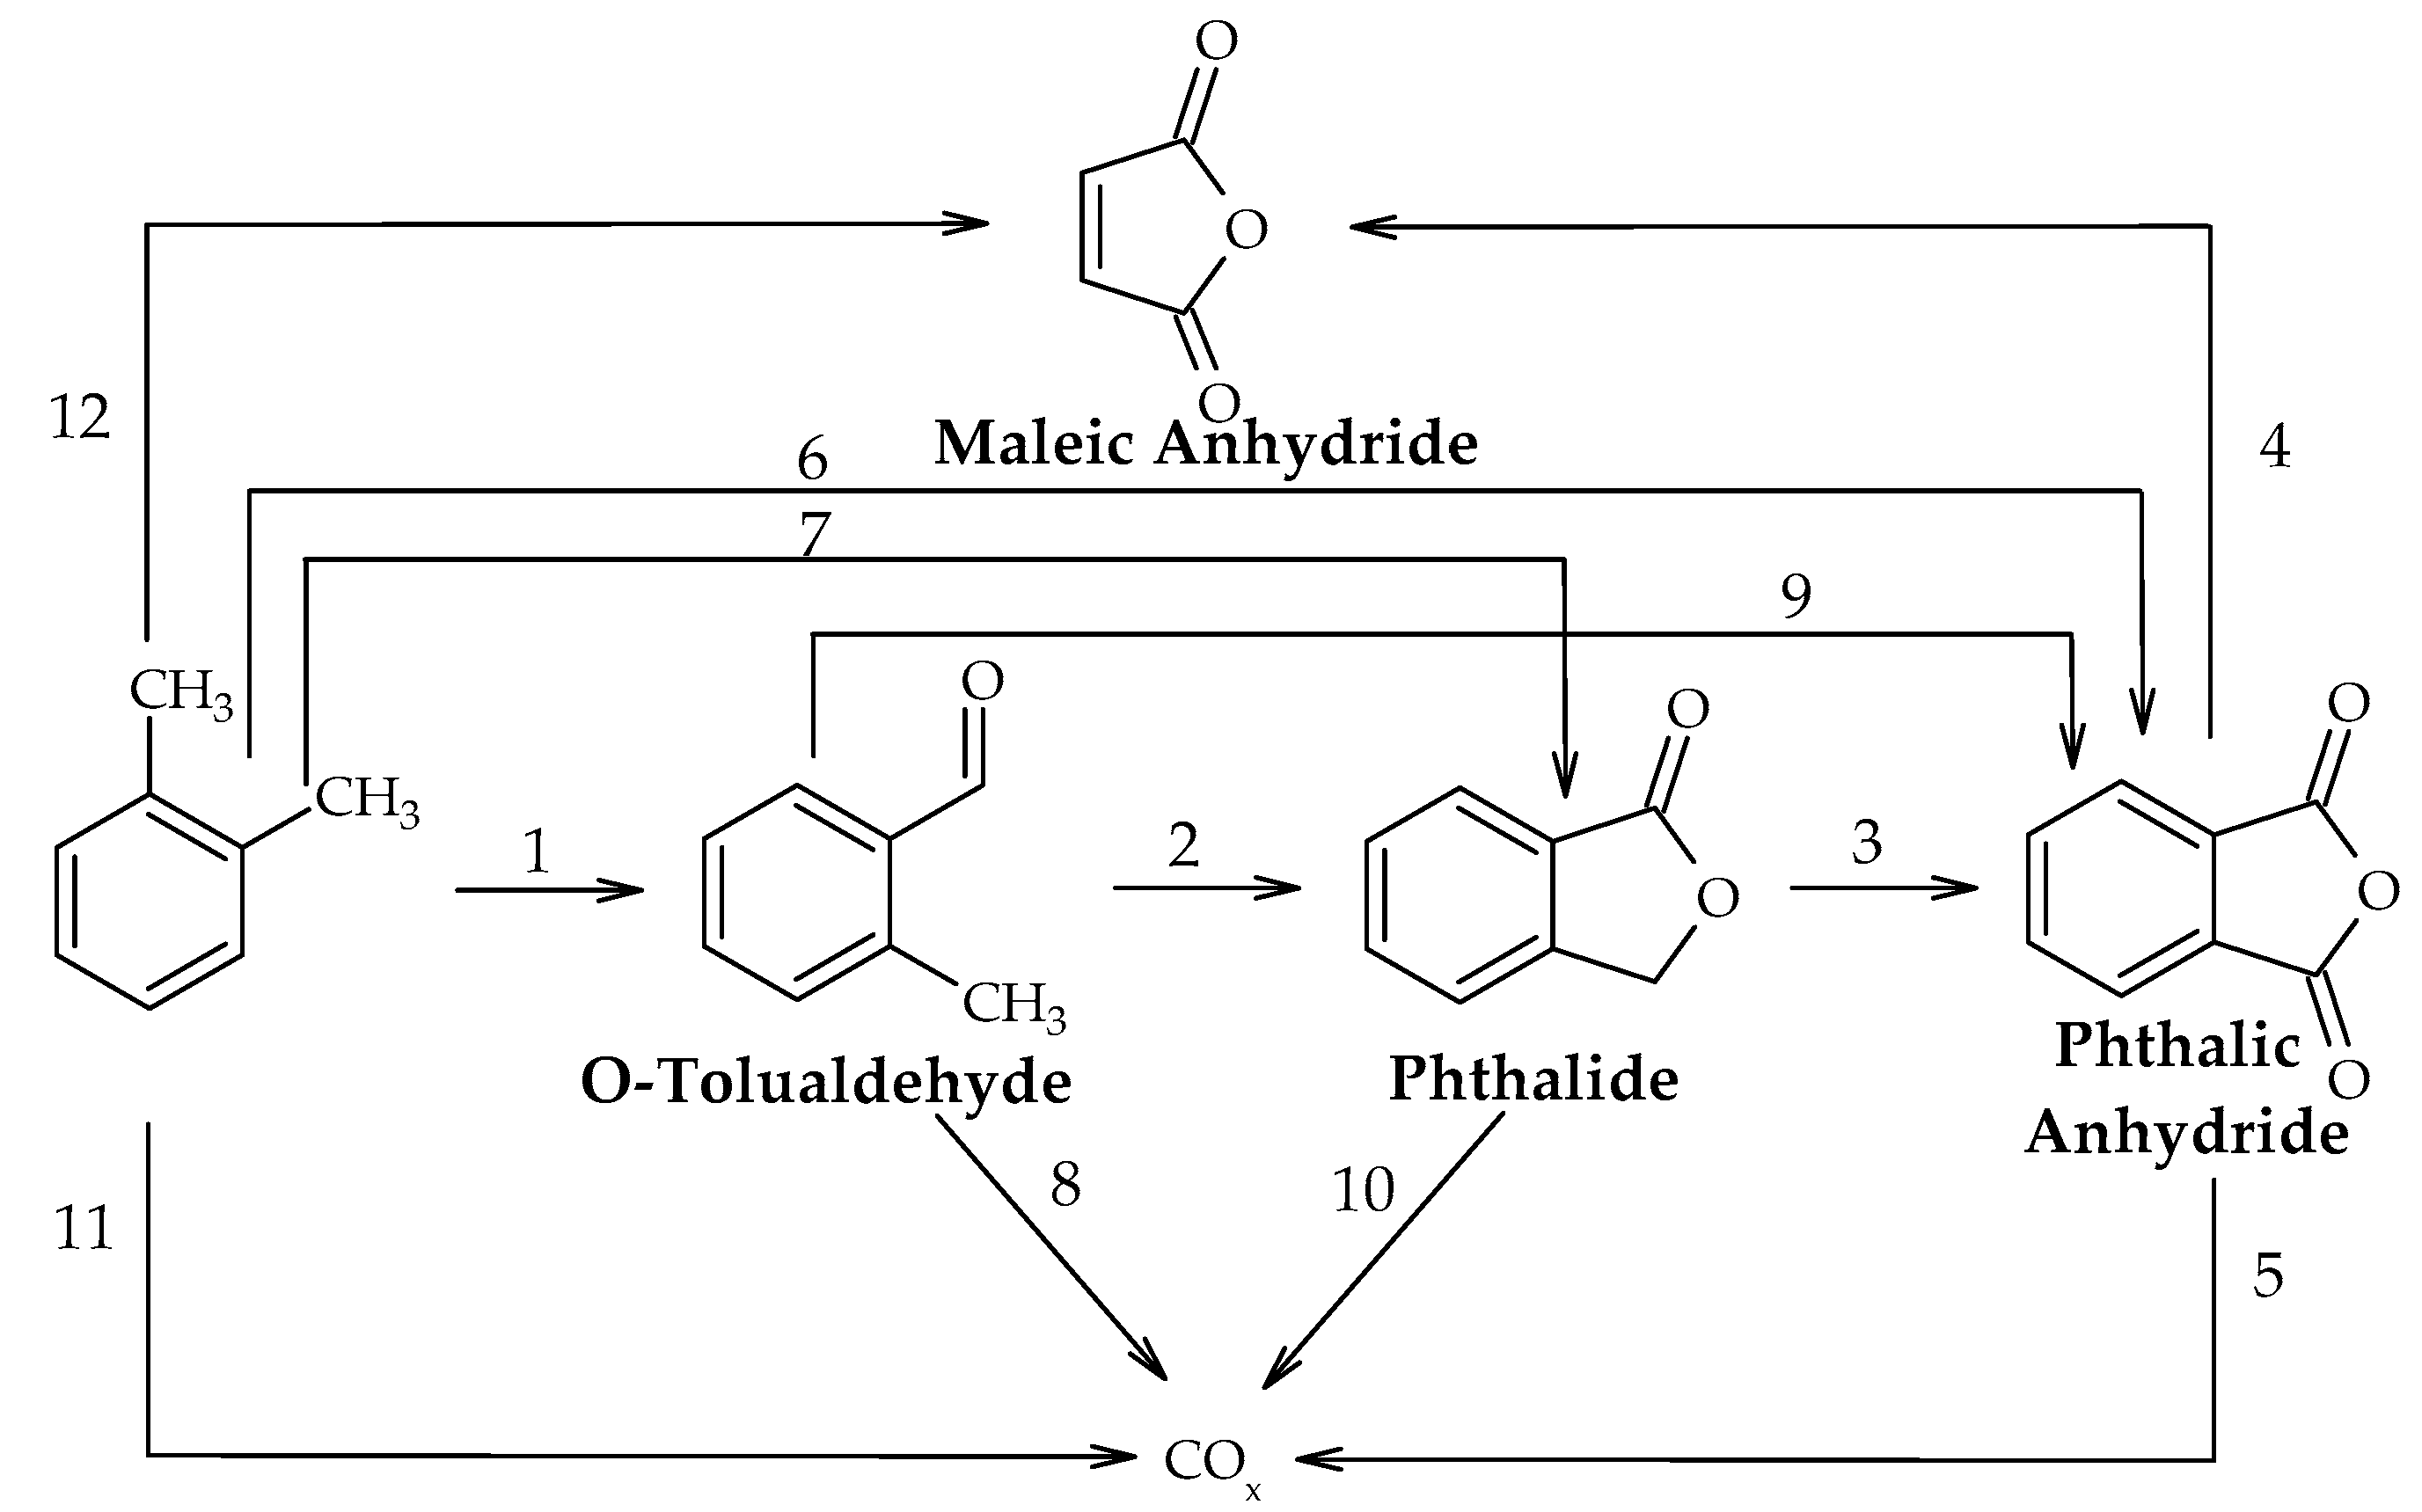
Thus, the mass, heat, and pressure balances can be written as follows [26]:
(1) Mass   balance d F j d z = i = 1 N r i j (2) Heat   balance inside   the   reactor d T d z = ρ b u ρ g C p g j = 1 q i = 1 N ( r i j ) Δ H r x n i 4 U ( T T C ) u ρ g C p g D t (3) Pressure   drop equation d P d z = G 2 ( 1 ε ) ρ g D p ε 3 ( 150 ( 1 ε ) Re p + 1.75 ) (4) Heat   balance outside   the   reactor d T C d z = t n π D t U ( T T C ) C p C w C Co current   flow d T C d z = t n π D t U ( T C T ) C p C w C Countercurrent   flow
The parameter values used for simulation runs are listed in Table 2.

3. Kinetic Models

In the context of the present study, three different o-xylene oxidation models were selected: (i) the single reaction model used by van Welsenaere and Froment [7]; (ii) the three-step oxidation process reported by de Lasa [2]; and (iii) the Chandrasekharan and Calderbank [17] kinetic model, which includes five steps of reaction. The rate law and kinetic parameters for each of these models as well as the heat of reaction of each step are presented in Table 3.

4. Computation of Sensitivity Indices

Sensitivity analysis can be divided as “global” and “local”. Global sensitivity analysis describes the effect of the simultaneous large variation of all parameters on the dependent variables. On the other hand, the local sensitivity method provides information on the effect of a model output when only one input factor is changed at a time while all other input factors are held fixed (at their nominal value). Local sensitivity analysis is essentially linear, and it is the one used in this work. Following the ideas proposed by Varma et al. [8], Equations (1) to (4) can be described by a vector y of the n dependent variables (e.g., Fj, T, P, and Tc), which changes in reactor length (z) rendering to the following general differential equation:
d y d z = f ( y ; φ ; z ) y = y ( z ; φ )
where the initial conditions y(0) = y0 and φ representing the vector comprising the m system input parameters. It is assumed that f is continuously differentiable in all its arguments (as denoted at the right-hand side of the arrow in Equation (14)). If a small alteration of any input parameter occurs (e.g., from φj to φj + Δφj), the corresponding solution for the dependent variables becomes y = y ( z ; φ j + Δ φ j ) . In this way, n first-order local sensitivity indices (S) of the vector of dependent variables, y, concerning the same input parameter, φ j , follows the form:
S ( y ; φ j ) = y ( z ; φ j ) φ j = L i m Δ φ j 0 ( y ( z ; φ j + Δ φ j ) y ( z ; φ j ) Δ φ j )
The local sensitivity indices can be evaluated using the direct differential method (Varma et al. [8]), which implies differentiate both sides of Equation (14) leading to:
d ( y φ j ) d z = d ( S ( y ; φ j ) ) d z = f y y φ j = f y S ( y ; φ j ) + f φ j
Its initial conditions can also be obtained by differentiating the initial condition of Equation (14). Thus, depending on which input parameter in the vector φ is chosen, it is possible to obtain:
S ( y ; φ j ) | z = 0 = { 0 , φ j y ( 0 ) 1 , φ j = y ( 0 )
Thus, the simultaneous solution of Equation (14) (e.g., Equations (1) to (4)) and sensitivity Equation (16), along with their corresponding initial conditions, obtain the value of the dependent variable and the corresponding local sensibility index, as a function of the independent variable (z). For comparison with the above-mentioned works [7,12,13,16,28], sensitivity indices with respect to the inlet temperature of the reactants (To) are evaluated for Fj, T and Tc as follows:
d S ( F i , T o ) d z = j = 1 M f i F j S ( F j , T o ) + f i T S ( T , T o )
d S ( T , T o ) d z = j = 1 M f i F j S ( F j , T o ) + f i T S ( T , T o ) + f i T C S ( T C , T o )
d S ( T C , T o ) d z = f i T S ( T , T o ) + f i T C S ( T C , T o )
with the initial conditions:
z = 0 ,   i   S ( F i ,   T o ) = 0 ,   S ( T ,   T o ) = 1 ,   S ( T C ,   T o ) = 0

5. Numerical Simulation

It is worthy of note that, depending on the reaction rate expressions included in the mathematical model, the final form and the number of parametric sensitivity equations will be different for each case analyzed in this work. Consequently, each reaction problem will correspond to a different numerical challenge, because each mechanism must fulfill the operating sensitivity limit (S (T; To) = 1) at a single point for the interval z = (0.2]. Their solution strategies are summarized in Section 5.1. and Section 5.2.

5.1. For Constant Temperature or Co-Current Flow in the Shell Side

These cases imply the integration of a set of, initial value, ordinary differential equations (ODE). Their solution is based on the execution of the ode15s MatLab® function, linked to the following condition: ∃! z [0,2]: S(T; To) = 1. This means that it is necessary to search, within the solution range of the sensitivity index of the reactive temperature, relative to the inlet temperature, a single condition different from the initial one, such that S(T; To) = 1. Thus, if the inlet temperature is set, the inlet o-xylene pressure will be varied until the criterion will be met (using additionally the fsolve MatLab® function with a tolerance of 1 × 10⁻⁶).

5.2. For Countercurrent Flow in the Shell Side
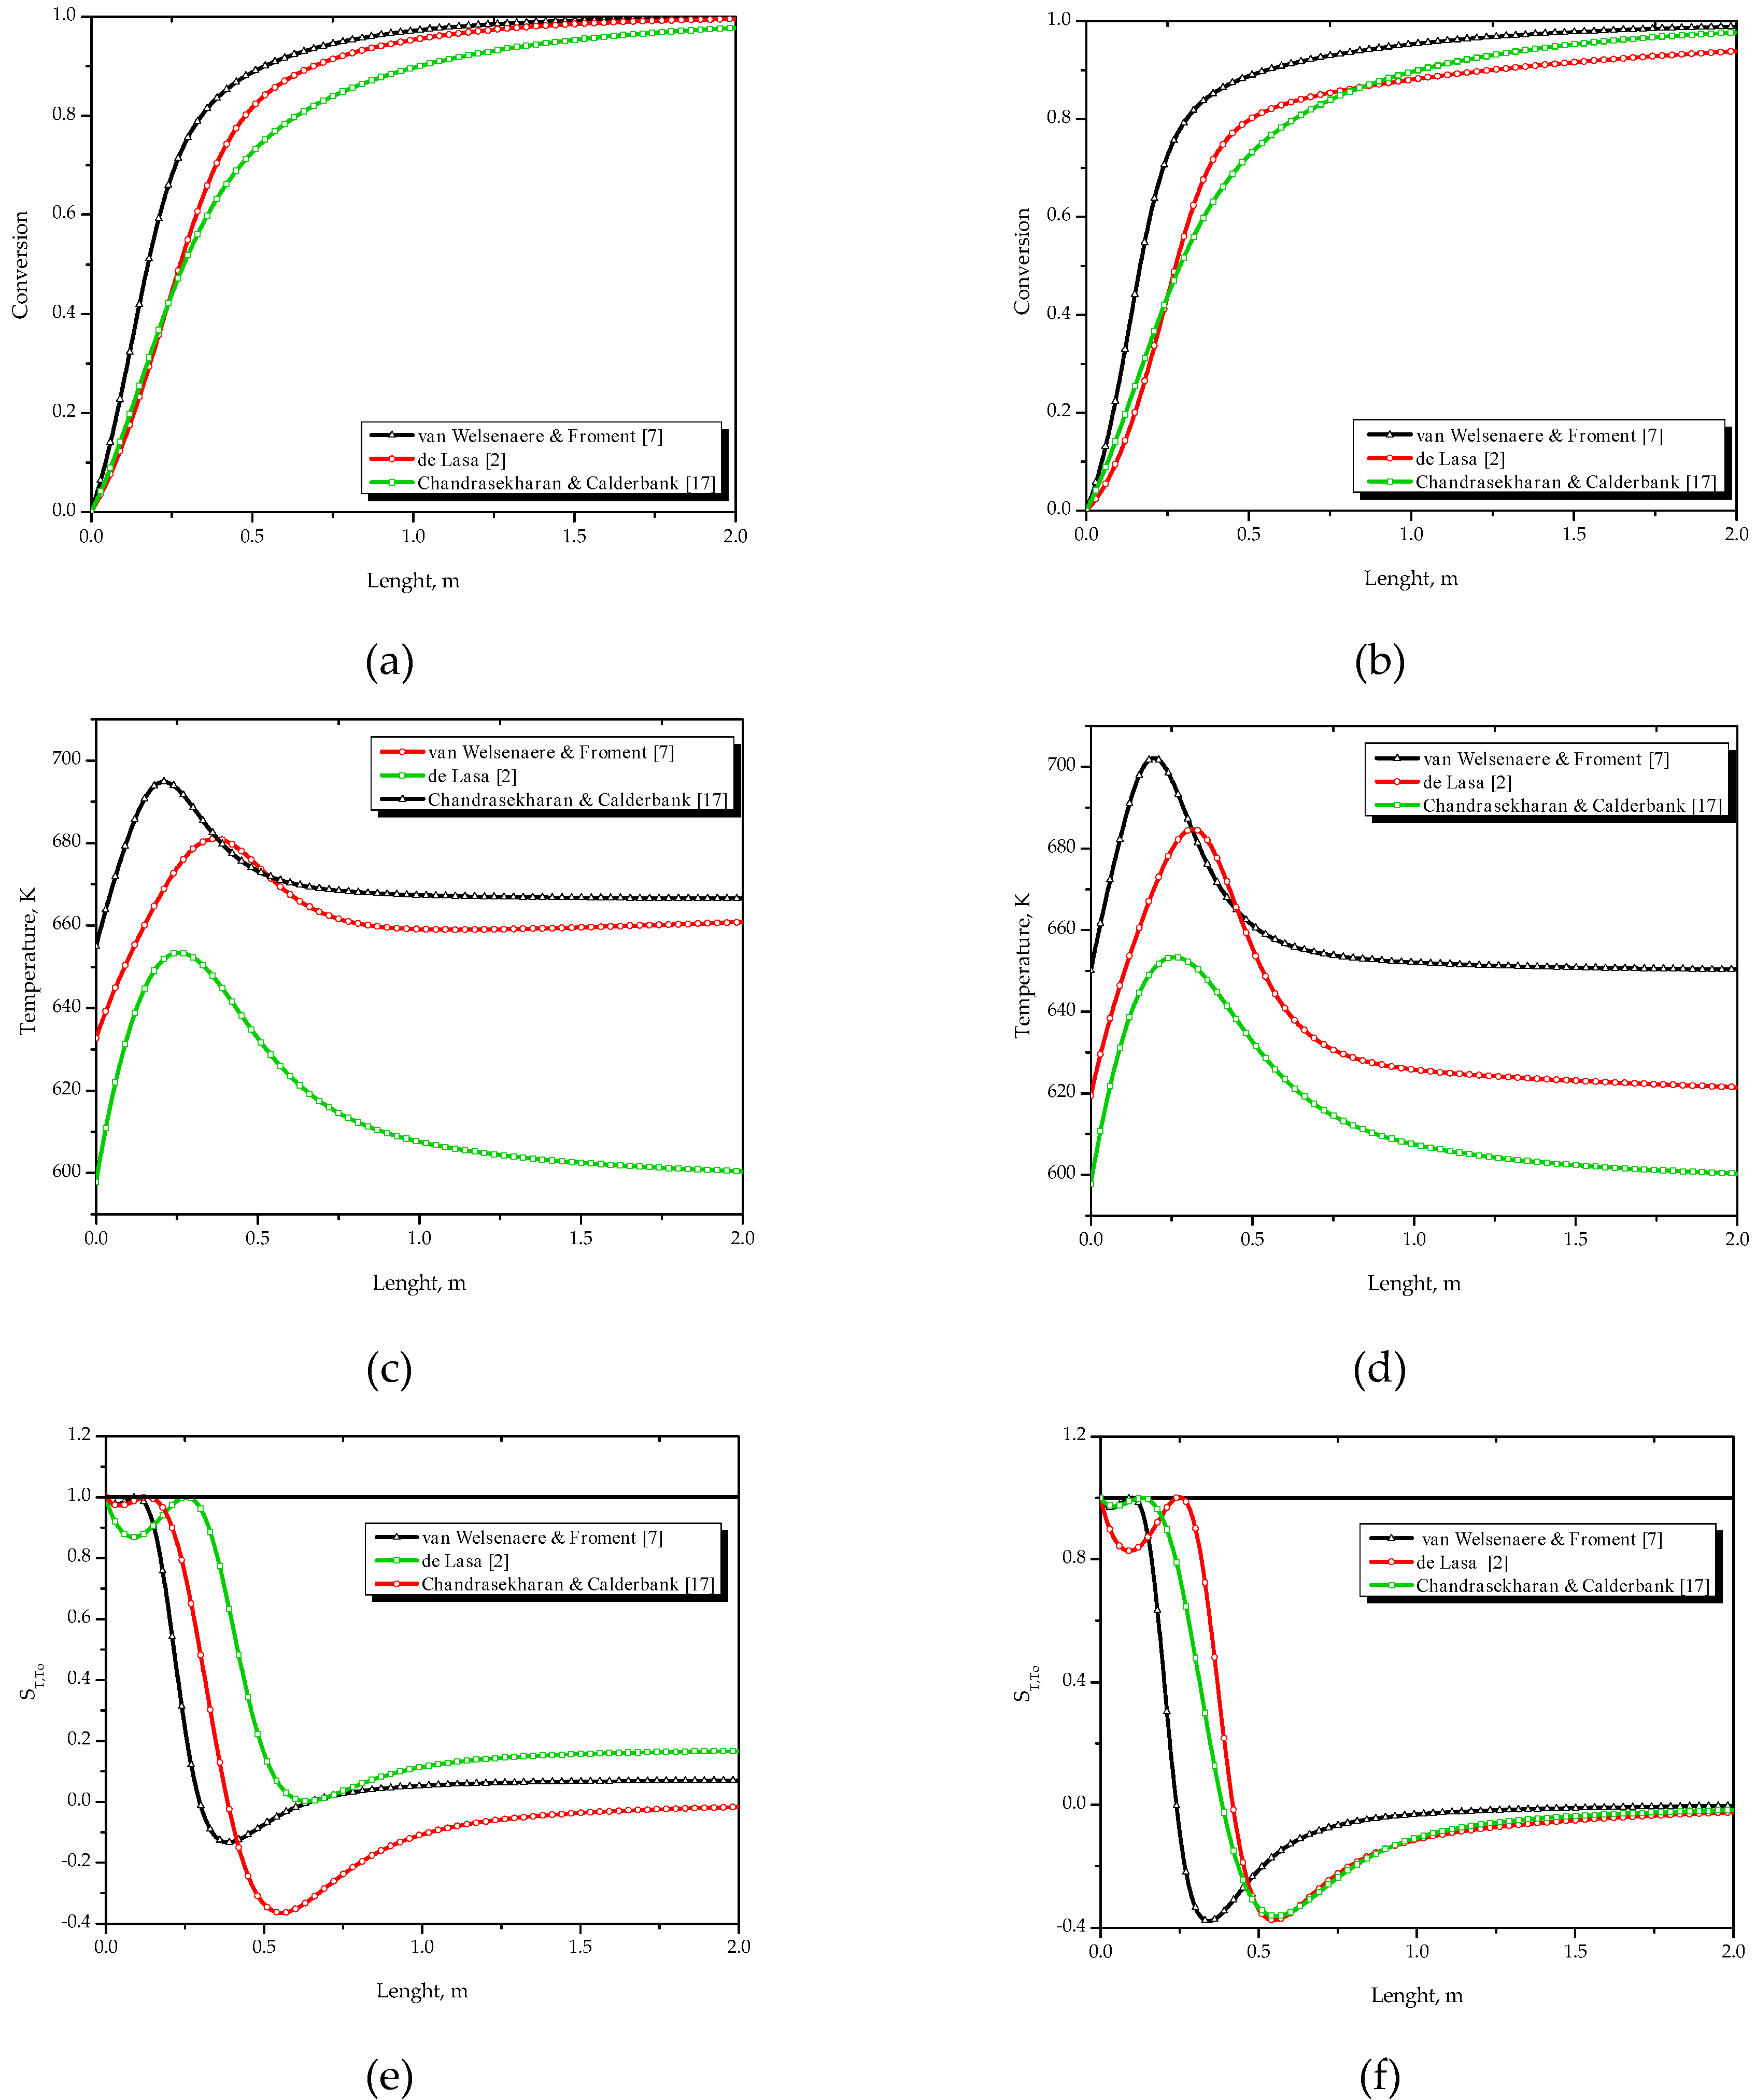
The solution of this case infers, in addition to the sensitivity index restriction, the fulfillment of the boundary conditions imposed by the fluid in the shell side. Thus, it is necessary to include two more restrictions: i) z = 2 → Tco = To and ii) z = 2 → S(TC; To) = 0; generating a quite challenging numerical problem which requires modifying, simultaneously, three joint variables and a trial-and-error procedure. To achieve this, the shooting method was used where the inlet pressure or temperature (depending on the case), the outlet temperature of the reactive fluid and the sensitivity index for the inlet temperature, relative to the reactive temperature at the reactor outlet, were set. Then, to minimize the objective functions, a restricted nonlinear least-squares minimization method (using the lsqnonlin MatLab® function) allows for the limiting of the solutions to those corresponding to logical intervals of system operational conditions. For very demanding cases, such as the one including five reactions, numerical difficulties were overcome by an orthogonal collocation method (using the bvp4c Matlab® function).

6. Results

To analyze the behavior of o-xylene conversion and the reaction temperature, and to give a clear interpretation of the temperature sensitivity index, the reactor performance was examined on the basis of each of the three kinetic models. Moreover, the influence of the two types of heat exchange operation (e.g., variable fluid temperature with co-current or countercurrent operation) was also compared.

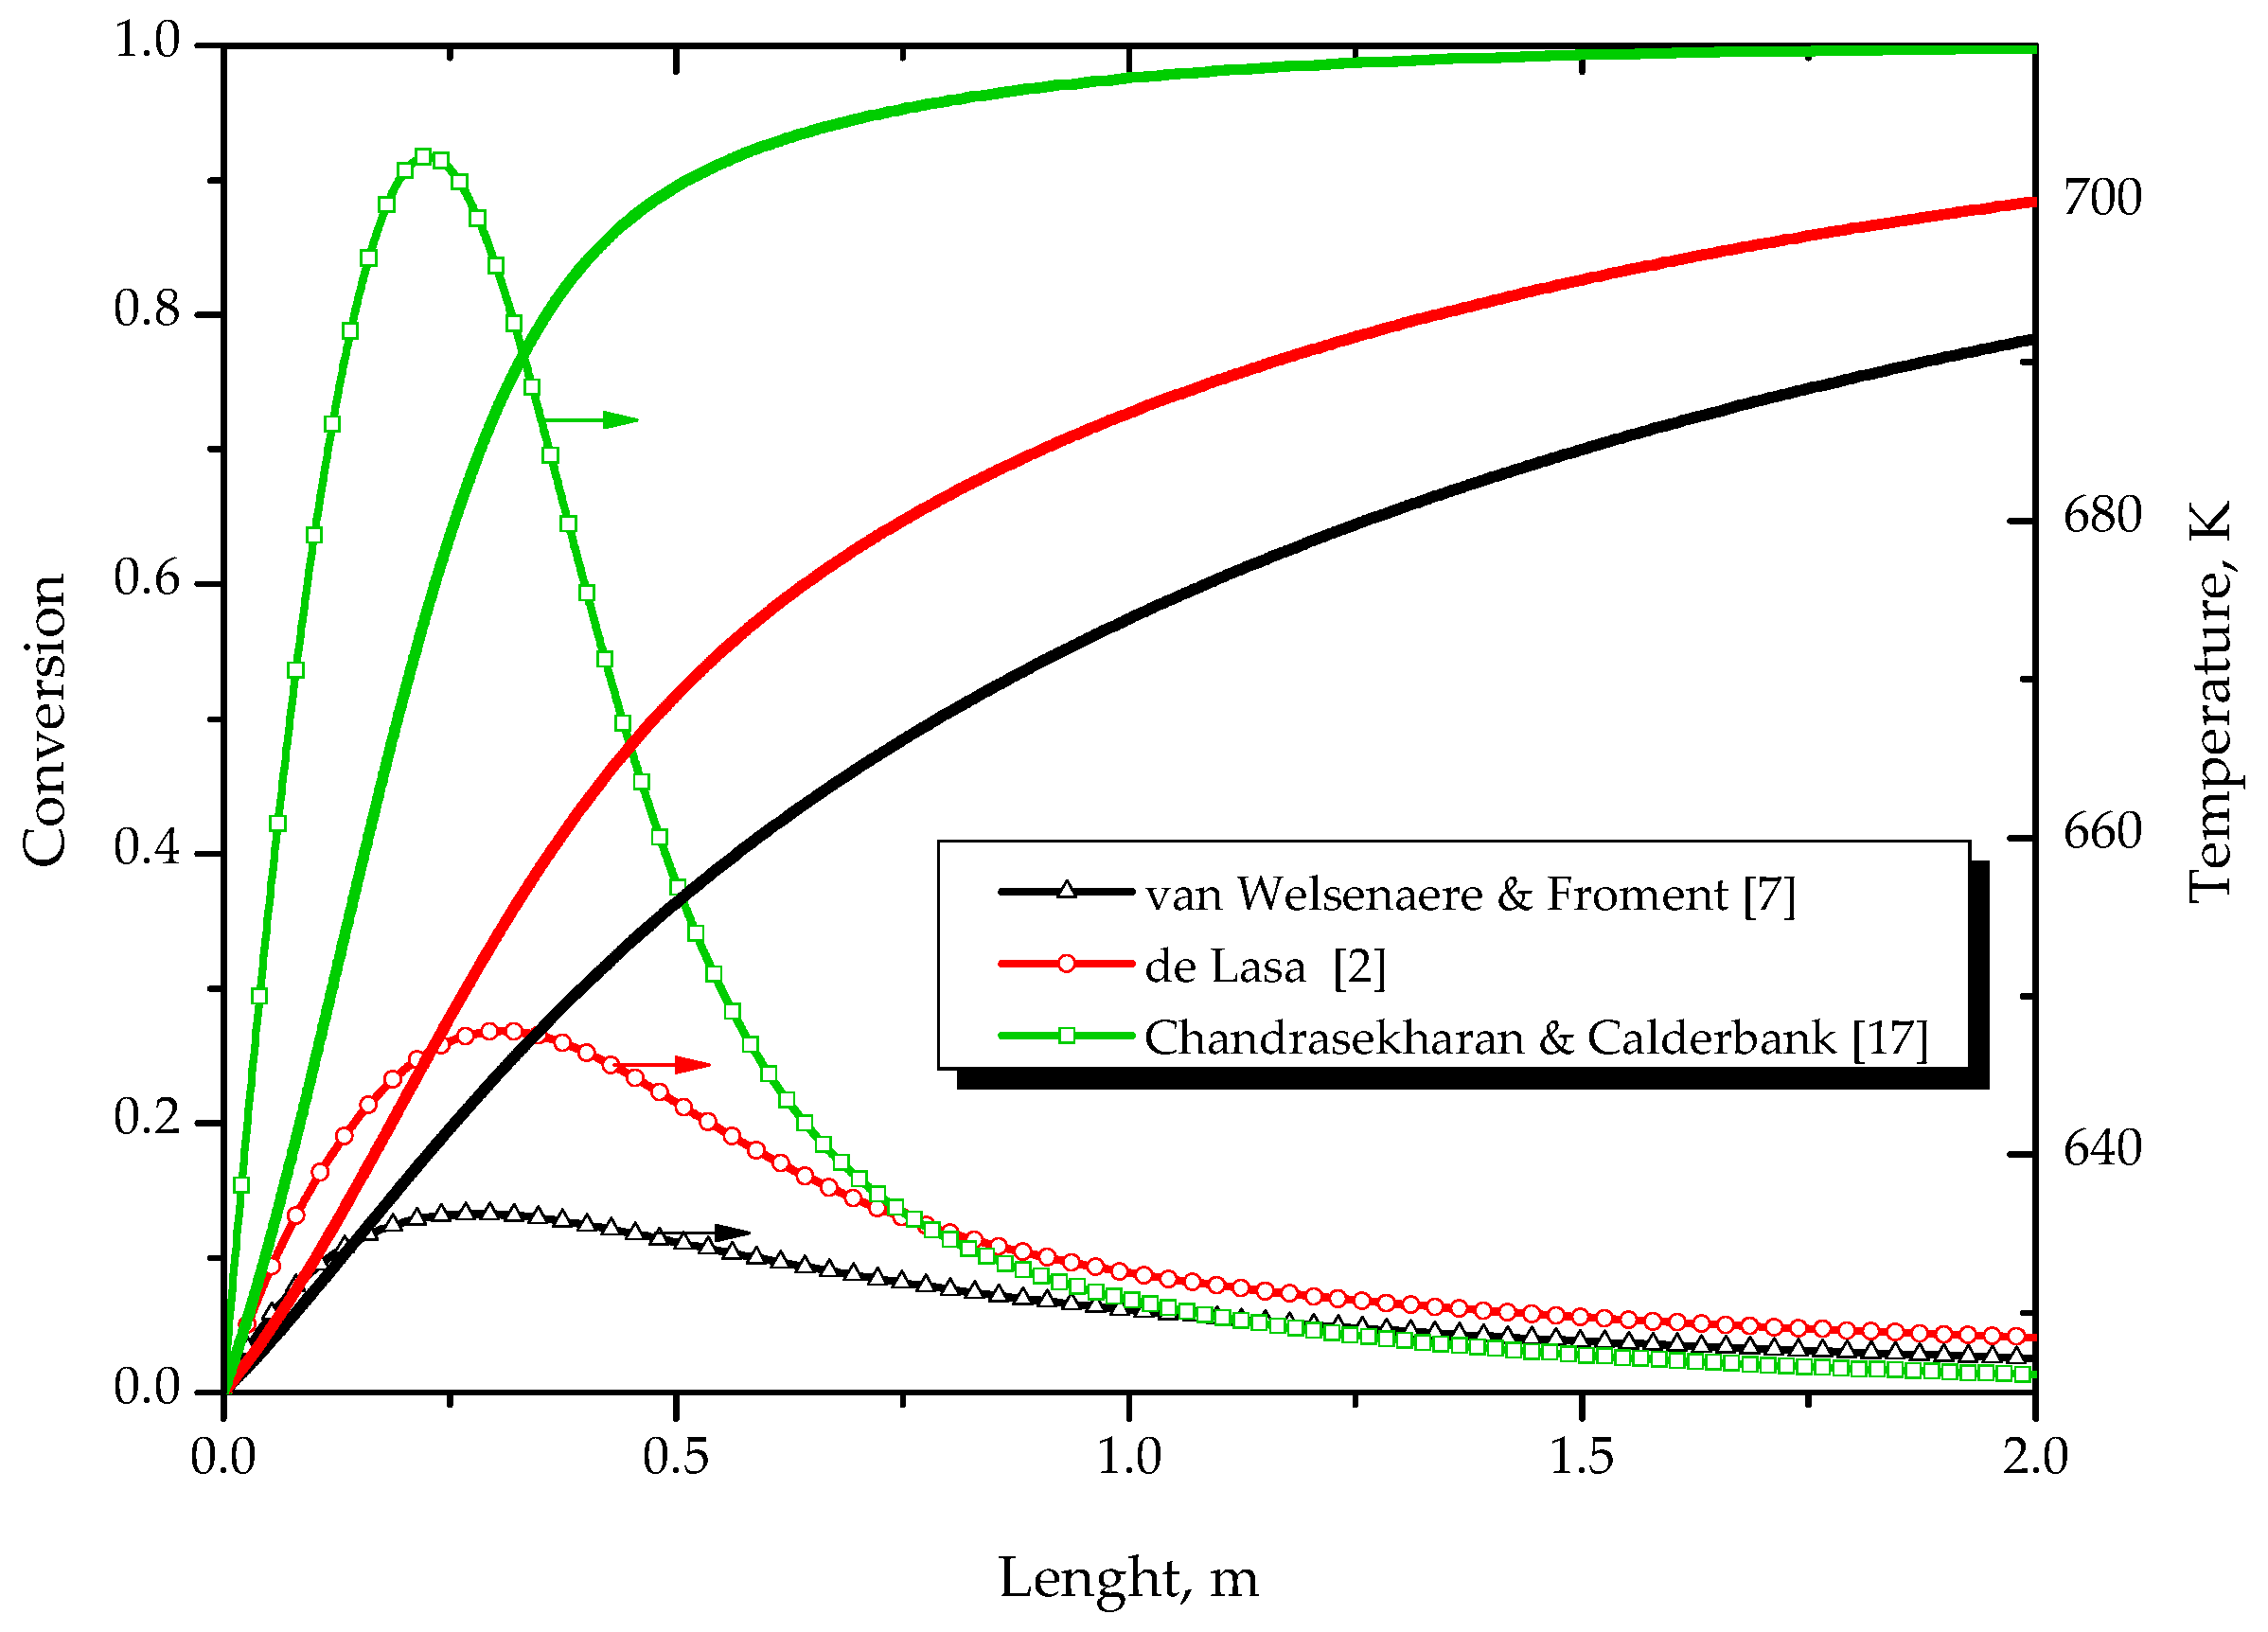
6.1. Constant Cooling Temperature (TC = T0 = 625 K)

At first, critical feed pressure values, under constant cooling temperature of 625 K, were calculated according to the approach proposed in this manuscript as well as to the models previously presented by van Welsenaere and Froment [7]; Hlavacek [28]; and Henning and Perez [16] and are resumed in Table 4. Notice that these simplified models [7,16,28] did not contemplate the pressure drop equation. For the single reaction kinetic model, the application of our approach allows us to use the higher value of P o-x y l e n e 0 , implying less conservative operation conditions. Notice that, in addition, the value of critical inlet o-xylene pressure depends on the complexity of the kinetic model: it decreases with an increase in the number of considered reactions. This is probably due to the high exothermicity of additional reactions.

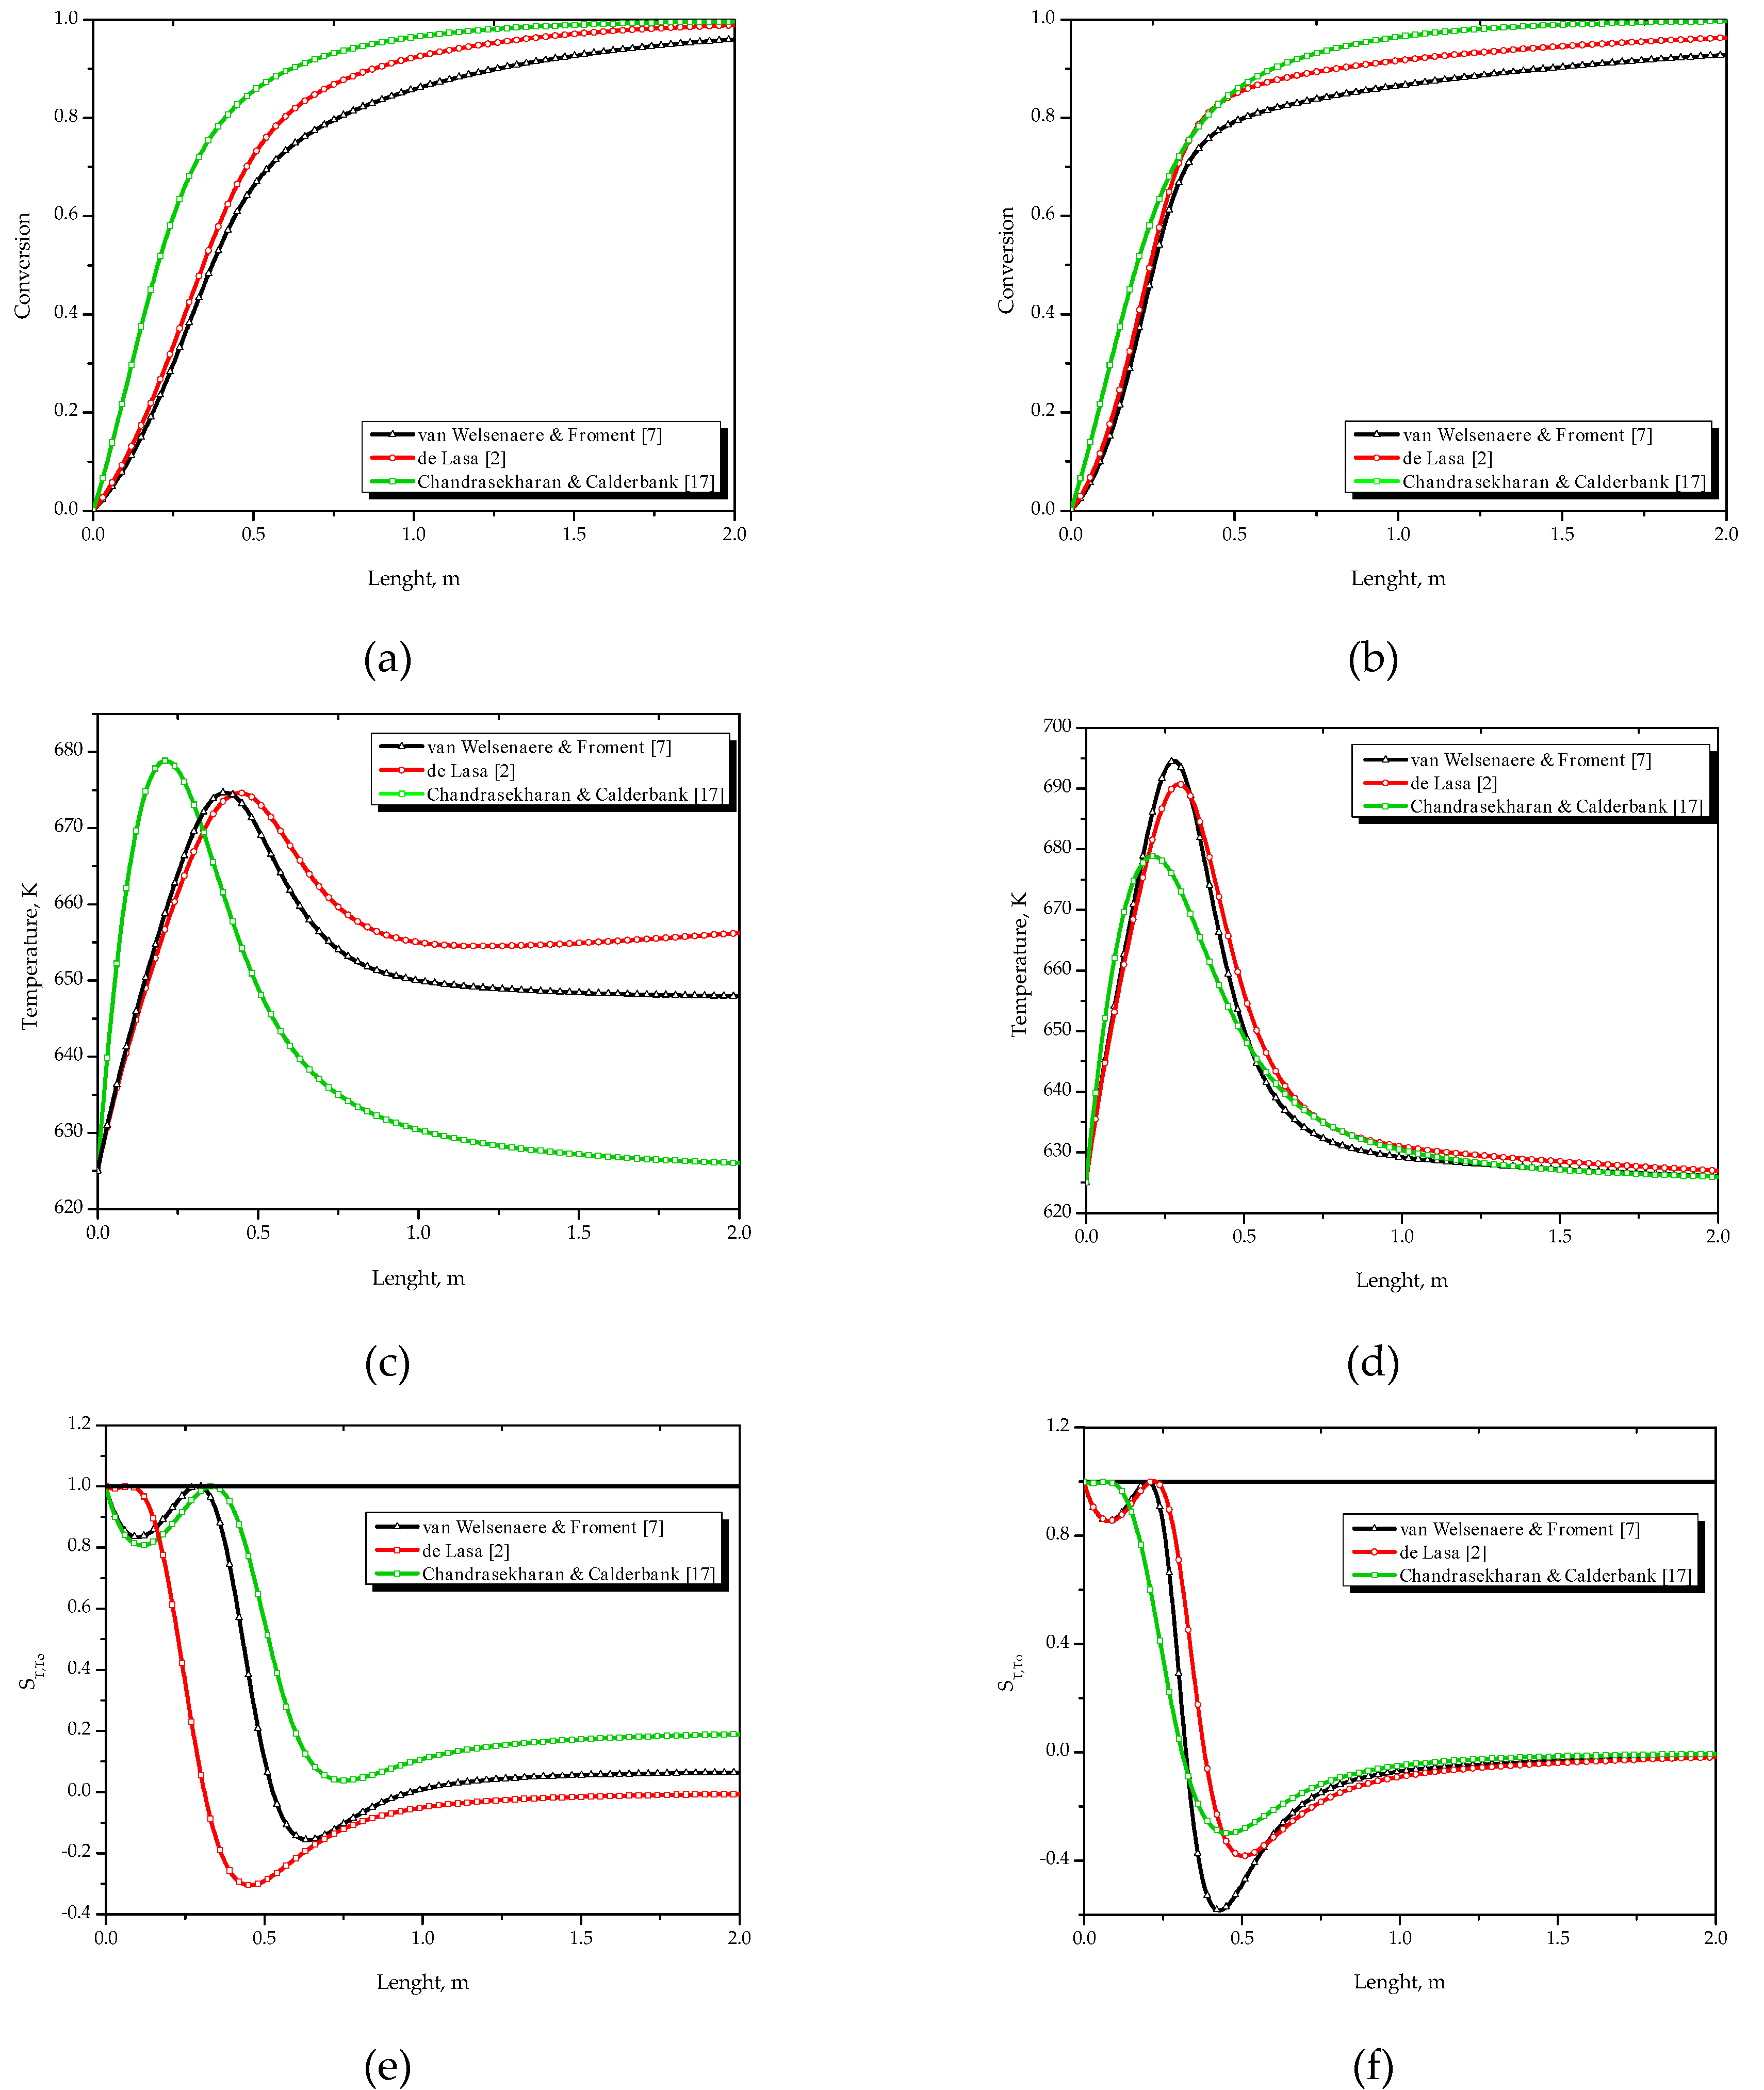
6.2. Variable Cooling Temperature According to Co-Current or Countercurrent Pattern (TCo = To = 625 K)

Next, critical feed pressure values, obtained under variable cooling temperature, for both co-current or countercurrent pattern, were calculated using the proposed model, and are also presented in Table 4 for the three kinetic models. In the case of co-current flow pattern, the comparison of the values obtained using the proposed approach with these previously reported by Soria-López et al. [1], de Lasa [2] and Henning and Perez [16] shows significant differences. They can be related to the effect of pressure drop balance used in our model (approach). Both for the single step and three-step reaction kinetic model, higher critical feed pressure values are predicted using our model. However, the contrary occurs for the kinetic model involving five steps of reaction. These results prove the importance of both the reactor model and the kinetic model for the selection of safe operation conditions. Figure 3 shows the resulting conversion, reaction temperature and temperature sensitivity index profiles, illustrating the sensitivity of the system with respect to the kinetic model and cooling flow configuration. The co-current case was also analyzed by Soria-López et al. [1] and de Lasa [2], assuming a negligible pressure drop in the catalytic bed. Total o-xylene conversion was predicted only for the five-reaction kinetic model (Figure 3a,b). An inspection of temperature profiles shows how the hotspot position and intensity (ca. 675 K) are similarly predicted from one- or three-reaction kinetic models for the co-current case. However, the more rigorous kinetic model predicts a faster and higher temperature increase in the PBR (Figure 3c,d). A change in the cooling pattern, to the countercurrent one, amplifies the maximum temperature for one- and three-reaction kinetic models (maximum of temperature of 695 K and 691 K, respectively), while it remains constant for the five-reaction mechanism. The corresponding S(T, To)-z trajectories are presented in Figure 3e,f). As defined previously, the zone where the derivative of the sensitivity index with respect to z is positive (for z ≠ 0) is of special interest. Thus, for the operation conditions presented in Table 2, the critical inlet o-xylene pressure is summarized in Table 4 for different kinetic models and criteria. As in the constant cooling temperature case, our criterion is less conservative than these previously reported in the literature.

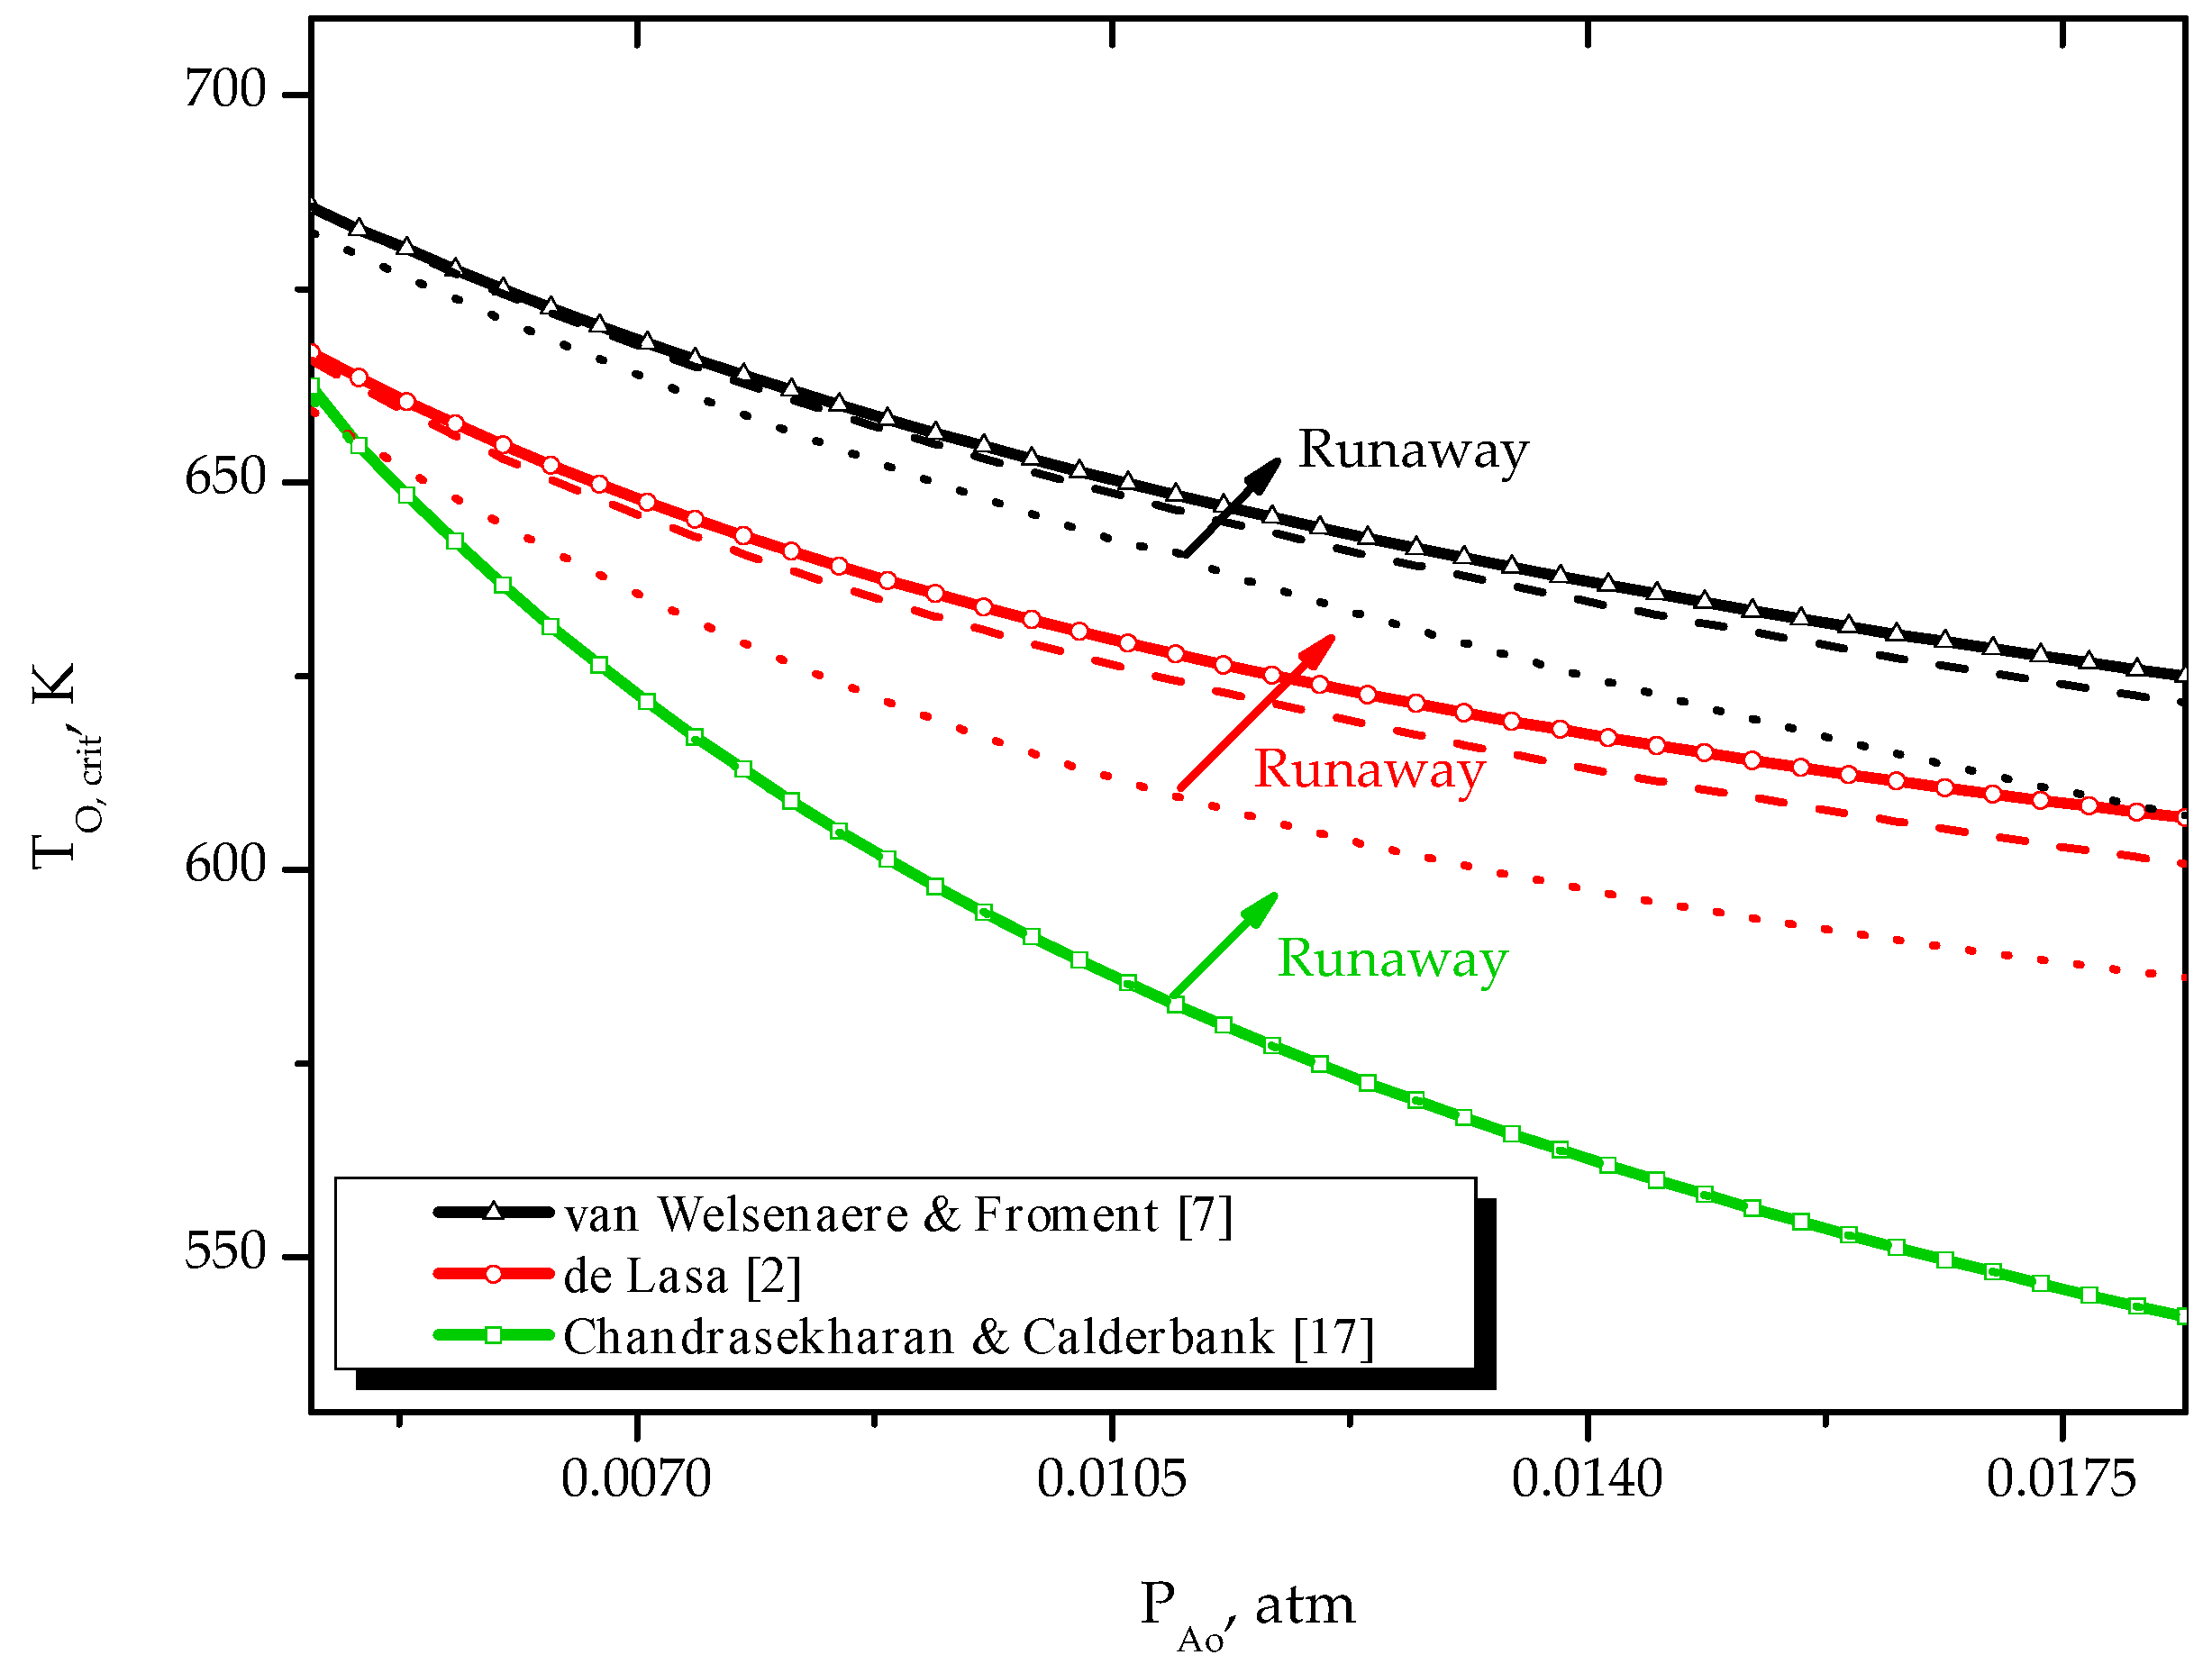
6.3. Variable Cooling Temperature According to Co-Current or Countercurrent Pattern (PAo = 0.9322 kPa)

This case is concerned with the determination of the maximum permissible inlet temperature of the reactor fluid, as a function of cooling flow pattern and the kinetic model, for a given inlet o-xylene partial pressure (the selected value of PAo = 0.9322 kPa was justified elsewhere [27,29]). Here, as defined in Section 5.2, for each kinetic model, the solution must fulfill both the sensitivity index restriction and the boundary conditions imposed by the fluid in the shell side. Figure 4 presents the obtained results for both cooling flow configurations. It illustrates the sensitivity of inlet temperature with respect to both the kinetic model and cooling flow configuration. In all cases, the lower feed temperatures, for safe operation conditions, is suggested by the five-reaction kinetic model (e.g., (i) van Welsenaere and Froment [7] = 655 K and 650 K, (ii) de Lasa [2] = 633 K and 619 K and (iii) Chandrasekharan and Calderbank [17] = 598 K and 598 K for co-current and countercurrent patterns, respectively).
Finally, the critical operation values are found readily by imposing the conditions of Equation (21), as in Figure 3e,f, Figure 4e,f. Thus, safe operation behavior is fully determined by inspecting a very large number of numerical solutions of the model (reactor and sensitivity index) for a wide variation of a specific inlet parameter. Figure 5 illustrates the runaway diagram for the o-xylene oxidation, specifically the effect of o-xylene partial pressure feed, in the range of 0.0046 to 0.0184, according to [29], for the three analyzed kinetic models. The curves in Figure 5 define a sepatrix that limits two regions: if the operating conditions are such that they lead to a coordinate in Figure 5 above the corresponding curve, extreme parametric sensitivity and runaway is expected; but if it is located under the curves, the reactor is insensitive to small fluctuations. Notice that only the five-step reaction kinetic model defines a single runaway region, regardless of the cooling flow pattern. As expected, the simplest kinetic model predicts the smaller runaway region.

7. Conclusions

The parametric sensitivity of a Packed Bed Catalytic Reactor depends on the cooling flow pattern and kinetic model. The required mathematical model, involving a one-dimensional reactor model and a sensitivity index formulation, was analyzed to predict an a priori estimation of safe reactor operation conditions. An effective numerical routine for the solution of the countercurrent flow pattern was also presented. The o-xylene oxidation was analyzed as an example of a complex kinetic model and it was successfully solved. It provided less conservative operational conditions compared to the models previously proposed, even in the case of low inlet pressures of a key reactant. The benefits of detailed kinetic models include the possibility of analyzing product selectivity as additional criteria for the selection of reactor operation conditions (to be explored in a future contribution). The presented methodology is generic and can accommodate rigorous kinetic, reactor and sensitivity models, which could provide significant results for reactor design and operation.

Author Contributions

Conceptualization: S.Z.-B., I.D.-G. and M.-Á.G.-G.; methodology: S.Z.-B., I.D.-G. and M.-Á.G.-G.; software, S.Z.-B., I.D.-G. and M.-Á.G.-G.; formal analysis: S.Z.-B., I.D.-G. and M.-Á.G.-G.; investigation: S.Z.-B., I.D.-G. and M.-Á.G.-G.; resources: S.Z.-B., I.D.-G. and M.-Á.G.-G.; writing—original draft preparation: S.Z.-B., I.D.-G. and M.-Á.G.-G.; writing—review and editing: S.Z.-B., I.D.-G. and M.-Á.G.-G. All authors have read and agreed to the published version of the manuscript.

Funding

This research received no external funding.

Conflicts of Interest

The authors declare no conflict of interest.

Notation

aKinetic parameter (K−1)uSuperficial velocity (m/h)
C p c Heat capacity of the cooling medium ( k c a l k g   K ) wcCooling medium flow rate (kg/h)
C p g Heat capacity of the gaseous mixture ( k c a l k g   K ) yDependent’s variables vector
DpParticle diameter (m)zAxial coordinate (m)
DtTube diameter (m)ΔHrxnHeat of reaction (kcal/kmol)
fContinuous functionGreek letters
FMolar flow (kmol/h)αKinetic constant ( h   m 2 k m o l )
FtTotal molar flow (kmol/h)εBed porosity
GMass flow ( k g m 2   h ) θvKinetic parameter
kKinetic constant ( k m o l h   k g c a t   k P a ) ρbBulk density of the fixed bed (kg/m3)
LTotal reactor length (m)ρgGas mixture density (kg/m3)
MMolecular weight of gaseous mixture (kg/m3)ρLLinear density (kgcat/m3)
NTotal number of reactionsφInput parameters
PTotal pressure (kPa)Subscripts
P O 2 0 Oxygen’s partial pressure (kPa)iCounter for reactions
qTotal number of compoundsjCounter for compounds
rReaction rate ( k m o l m   h ) oInlet conditions
RepParticle Reynolds number1O-xylene to phthalic anhydride
SSensitivity coefficient21O-xylene to phthalic anhydride step
S(F,To)Molar flow sensitivity coefficient with respect to the inlet temperature22Phthalic anhydride to CO and CO2 step
S(T,To)Temperature sensitivity coefficient with respect to the inlet temperature 23O-xylene to CO and CO2 step
S(Tc,To)Cooling medium sensitivity coefficient with respect to the inlet temperature31O-xylene to O-tolualdehyde step
TTemperature inside the reactor (K)32O-xylene to phthalic anhydride step
TcTemperature of the cooling medium (K)33O-xylene to COx step
tnNumber of tubes34O-tolualdehyde to Phthalide step
UOverall heat transfer coefficient ( k c a l m 2   h   K ) 35Phthalide to phthalic anhydride step

References

  1. Lopez, A.; De Lasa, H.; Porras, J. Parametric Sensitivity of a Fixed Bed Catalytic Reactor. Chem. Eng. Sci. 1981, 36, 285–291. [Google Scholar] [CrossRef]
  2. De Lasa, H. Application of the Pseudoadiabatic Operation to Catalytic Fixed Bed Reactors Case of the Orthoxylene Oxidation. Can. J. Chem. Eng. 1983, 61, 710–718. [Google Scholar] [CrossRef]
  3. Arandes, J.; De Lasa, H. Pseudoadiabatic Operation for Fixed-Bed Catalytic Reactors: Methods for Finding the Limits of the Regime. Chem. Eng. J. Biochem. Eng. J. 1995, 58, 33–44. [Google Scholar] [CrossRef]
  4. Richter, O.; Mestl, G. Deactivation of Commercial, High-Load o-Xylene Feed VOx/TiO2 Phthalic Anhydride Catalyst by Unusual Over-Reduction. Catalisis 2019, 9, 435. [Google Scholar] [CrossRef] [Green Version]
  5. Bilous, O.; Amundson, N.R. Chemical Reactor Stability and Sensitivity: II. Effect of Parameters on Sensitivity of Empty Tubular Reactors. AIChE J. 1956, 2, 117–126. [Google Scholar] [CrossRef]
  6. Balakotaiah, V.; Luss, D. Explicit Runaway Criterion for Catalytic Reactors with Transport Limitations. AIChE J. 1991, 37, 1780–1788. [Google Scholar] [CrossRef]
  7. Van Welsenaere, R.; Froment, G. Parametric Sensitivity and Runaway in Fixed Bed Catalytic Reactors. Chem. Eng. Sci. 1970, 25, 1503–1516. [Google Scholar] [CrossRef]
  8. Varma, A.; Morbidelli, M.; Wu, H. Parametric Sensitivity in Chemical Systems; Cambridge University Press (CUP): Cambridge, UK, 1999. [Google Scholar]
  9. Strozzi, F.; Zaldívar, J. A General Method for Assessing the Thermal Stability of Batch Chemical Reactors by Sensitivity Calculation Based on Lyapunov Exponents. Chem. Eng. Sci. 1994, 49, 2681–2688. [Google Scholar] [CrossRef]
  10. Bosch, J.; Strozzi, F.; Snee, T.; Hare, J.; Zaldívar, J. A Comparative Analysis between Temperature and Pressure Measurements for Early Detection of Runaway Initiation. J. Loss Prev. Process. Ind. 2004, 17, 389–395. [Google Scholar] [CrossRef]
  11. Rase, H.F. Fixed-Bed Reactor Design and Diagnostics; Butterworth-Heinemann: Oxford, UK, 1990. [Google Scholar]
  12. Papageorgiou, J.; Froment, G. Phthalic Anhydride Synthesis. Reactor Optimization Aspects. Chem. Eng. Sci. 1996, 51, 2091–2098. [Google Scholar] [CrossRef]
  13. Gimeno, M.P.; Gascón, J.; Téllez, C.; Herguido, J.; Menéndez, M. Selective Oxidation of O-Xylene to Phthalic Anhydride over V2O5/TiO2: Kinetic Study in a Fluidized Bed Reactor. Chem. Eng. Process 2008, 47, 1844–1852. [Google Scholar] [CrossRef]
  14. Anastov, A.I. Deactivation of an Industrial V2O5–TiO2 Catalyst for Oxidation of O-Xylene into Phthalic Anhydride. Chem. Eng. Process 2003, 42, 449–460. [Google Scholar] [CrossRef]
  15. Anastov, A.I.; Nikolov, V.A. Optimal Policies of Operation of a Fixed-Bed Reactor for Oxidation of O-Xylene into Phthalic Anhydride. Ind. Eng. Chem. Res. 1998, 37, 3424–3433. [Google Scholar] [CrossRef]
  16. Henning, G.P.; Perez, G.A. Parametric Sensivity in Fixed-Bed Catalytic Reactors. Chem. Eng. Sci. 1986, 41, 83–88. [Google Scholar] [CrossRef]
  17. Chandrasekharan, K.; Calderbank, P. Prediction of packed-bed catalytic reactor performance for a complex reaction (oxidation of o-xylene to phthalic anhydride). Chem. Eng. Sci. 1979, 34, 1323–1331. [Google Scholar] [CrossRef]
  18. Wainwright, M.S.; Foster, N.R. Catalysts, Kinetics and Reactor Design in Phthalic Anhydride Synthesis. Catal. Rev. 1979, 19, 211–292. [Google Scholar] [CrossRef]
  19. Skrzypek, J.; Grzesik, M.; Galantowicz, M.; Solinski, J. Kinetics of the Catalytic Air Oxidation of O-Xylene over a Commercial V2O5/TiO2 Catalyst. Chem. Eng. Sci. 1985, 40, 611–620. [Google Scholar] [CrossRef]
  20. Dias, C.R.; Farinha Portela, M.; Bond, G.C. Oxidation of O-Xylene to Phthalic Anhydride over V2O5/TiO2 Catalysts. IV Mathematical Modelling Study and Analysis of the Reaction Network. J. Catal. 1996, 164, 276–287. [Google Scholar] [CrossRef]
  21. Yabrov, A.A.; Ivanov, A.A. Response studies of the mechanism of o-xylene oxidation over a vanadium-titanium oxide catalyst. React. Kinet. Catal. Lett. 1980, 14, 347–351. [Google Scholar] [CrossRef]
  22. Akella, L.M.; Lee, H.H. A Design Approach Based on Pase Plane Analysis: Countercurrent Reactor/Heat Exchanger with Parametric Sensitivity. AIChE J. 1983, 29, 87–94. [Google Scholar] [CrossRef]
  23. Hosten, L.; Froment, G. Parametric Sensitivity in co-Currently Cooled Tubular Reactors. Chem. Eng. Sci. 1986, 41, 1073–1080. [Google Scholar] [CrossRef]
  24. Rajadhyaksha, R.; Vasudeva, K.; Doraiswamy, L. Parametric Sensitivity in Fixed-Bed Reactors. Chem. Eng. Sci. 1975, 30, 1399–1408. [Google Scholar] [CrossRef]
  25. McGreavy, C.; Adderley, C.I. Parametric Sensitivity and Temperature Runaway in Heterogeneous Fixed Bed Reactors. Adv. Chem. 1974, 133, 519–531. [Google Scholar] [CrossRef]
  26. Fogler, H.S. Elements of Chemical Reaction Engineering. Chem. Eng. Sci. 1987, 42, 2493. [Google Scholar] [CrossRef]
  27. Rosendall, B.; Finlayson, B.A. Transport Effects in Packed–Bed Oxidation Reactors. Comput. Chem. Eng. 1995, 19, 1207–1218. [Google Scholar] [CrossRef]
  28. Hlavacek, V. Aspects in Design of Packed Catalytic Reactors. Ind. Eng. Chem. 1970, 62, 8–26. [Google Scholar] [CrossRef]
  29. Elnashaie, S.S.E.H.; Elshishini, S.S. Modelling, Simulation and Optimization of Industrial Fixed Bed Reactors; Gordon & Breach Science Publishers: Yverdon, Switzerland, 1993; pp. 383–384. [Google Scholar]
Figure 1. Reaction scheme for o-xylene oxidation. Adapted with permission from [13], copyright 2008, Elsevier.
Catalysts 10 00626 g001
Figure 2. O-xylene conversion and reactive temperature profiles obtained with a one-dimensional Packed Bed Tubular Reactor (PBR) model using three different kinetic models.
Catalysts 10 00626 g002
Figure 3. Effect of cooling flow pattern and kinetic model on: conversion, reaction temperature and temperature sensitivity index profiles. Co-current flow: (a,c,e); and countercurrent flow (b,d,f). Tco = To = 625 K, other simulation conditions from Table 2.
Catalysts 10 00626 g003
Figure 4. Effect of cooling flow pattern and kinetic model on: conversion, reaction temperature and temperature sensitivity index profiles. Co-current flow: (a,c,e) and countercurrent flow (b,d,f). PAo = 0.9322 kPa, other simulation conditions from Table 2.
Catalysts 10 00626 g004
Figure 5. Runaway diagram for the o-xylene oxidation as relation of inlet o-xylene partial pressure and temperature. Curves obtained for three kinetic models of different complexity: (i) One reaction, as used by van Welsenaere and Froment [7]; (ii) Three reactions, as used by de Lasa [2]; and (iii) Five reactions, as proposed by Chandrasekharan and Calderbank [17]. Cooling flow pattern: constant cooling temperature (-), co-current direction (- -) and countercurrent direction (· ·).
Catalysts 10 00626 g005
Table 1. Reaction steps considered by different authors for kinetic studies or reactor modelling.
MechanismReferenceReaction Step
123456789101112
1[7] X
2[2,16] XX X
3[17]XXX X X
4[12]XXX X X
5[14]XXX XX X
6[18]XXXX X X
7[19]XXX XX X X
8[20]XXX XXXXXXX
9[21]XXX XXXXXXXX
X: Reaction step from Figure 1.
Table 2. Data used for the o-xylene oxidation simulation [7,12,27].
Molecular weight of gaseous mixture M 29480   k g k m o l
Superficial velocity u 3600   m h
Total pressure P 101.325   k P a
Heat capacity of the gaseous mixture C p g 0.2498   k c a l k g   K
Tube diameter D t 0.025   m
Number of tubes t n 3000
Gas mixture density ρ g 1.293   k g m 3
Oxygen’s partial pressure P O 2 0 21.07   k P a
Bulk density of the fixed bed ρ b 1300   k g m 3
Heat capacity of the cooling medium C p c 0.3105   k c a l k g   K
Cooling medium flow rate w c 72000   k g h
Overall heat transfer coefficient U 82.7   k c a l m 2   h   K
Total reactor length L 2   m
Particle diameter D p 0.022   m
Bed porosity ε 0.5
Particle Reynolds number Re p 121
Table 3. Kinetic models for o-xylene oxidation considered in this work.
van Welsenaere and Froment [7] Catalysts 10 00626 i001
r A = ρ L k 1 e ( a T ) P A
ρ L = 0.5203   k g c a t m
a = 13636   K 1
k 1 = 21.07 e 19.837   k m o l   ( h   k g c a t   k P a ) 1
Δ H r x n 1 = 306707   k c a l / k m o l
de Lasa [2] Catalysts 10 00626 i002
r A = ρ L ( k 21 + k 23 ) P A
r B = ρ L ( k 21 P A k 22 P B )
r C = 8 ρ L ( k 23 P A + k 22 P B )
k 21 = 21.07 e ( 10.59 13587.68 T )   k m o l   ( h   k g c a t   k P a ) 1
k 22 = 21.07 e ( 11.62 15801.97 T )   k m o l   ( h   k g c a t   k P a ) 1
k 23 = 21.07 e ( 9.73 14392.88 T )   k m o l   ( h   k g c a t   k P a ) 1
Δ H r x n 21 = 307122   k c a l / k m o l
Δ H r x n 22 = 7837000   k c a l / k m o l
Δ H r x n 23 = 1090822   k c a l / k m o l
Chandrasekharan and Calderbank [17] Catalysts 10 00626 i003
r A = θ v α ρ b F t ( k 31 + k 22 + k 33 ) P A
r B = θ v α ρ b F t ( k 32 P A + k 35 P E )
r C = 8 θ v α ρ b F t k 33 P A
r D = θ v α ρ b F t ( k 31 P A k 34 P D )
r E = θ v α ρ b F t ( k 34 P D k 35 P E )
θ v = 0.026 0.026 + ( k 31 + 3 k 32 + 6.5 k 33 ) P A + k 34 P D + k 35 P E
α = 3.2832 × 1 0 3   h   m 2 / k m o l
F t = k m o l / h
k 31 = 137.808 e ( 7381.11 T )   k m o l   ( h   k g c a t   k P a ) 1
k 32 = 46.62 e ( 6552.43 T )   k m o l   ( h   k g c a t   k P a ) 1
k 33 = 12.888 e ( 6153.13 T )   k m o l   ( h   k g c a t   k P a ) 1
k 34 = 20.016 e ( 5585.44 T )   k m o l   ( h   k g c a t   k P a ) 1
k 35 = 114.84 e ( 6962.56 T )   k m o l   ( h   k g c a t   k P a ) 1
Δ H r x n 31 = 108999   k c a l / k m o l
Δ H r x n 32 = 295999   k c a l / k m o l
Δ H r x n 33 = 550000   k c a l / k m o l
Δ H r x n 34 = 99001   k c a l / k m o l
Δ H r x n 35 = 87800   k c a l / k m o l
Table 4. Critical feed pressures at different service fluid configurations. Comparison between different criteria obtained from different kinetic models.
Kinetic ModelConstant
Tc = To = 625 K
Co-Current
Tco = To = 625 K
Countercurrent
Tco = To = 625 K
Author Criterion
P o-x y l e n e , c r i t i c a l 0
kPa
This Work
P o-x y l e n e , c r i t i c a l 0
kPa
Author Criterion
P o-x y l e n e , c r i t i c a l 0
kPa
This Work
P o-x y l e n e , c r i t i c a l 0
kPa
This Work
P o-x y l e n e , c r i t i c a l 0
kPa
One reaction1.677 [7]
1.778 [16]
1.815 [28]
1.8631.422 [1]1.7331.417
Three reactions0.867 [16] a1.1870.867 [16] a
1.014 [2]
1.106 a
1.097
0.847
Five reactions-0.6920.800 [2]0.6920.689
a for a cooling flow of 79,200 kg/h.

