Article

Synthesis of Titanium Dioxide via Surfactant-Assisted Microwave Method for Photocatalytic and Dye-Sensitized Solar Cells Applications

by
Adam Kubiak
1,
Zuzanna Bielan
2,
Aleksandra Bartkowiak
3,
Elżbieta Gabała
4,
Adam Piasecki
5,
Maciej Zalas
3,
Anna Zielińska-Jurek
2,
Marcin Janczarek
1,
Katarzyna Siwińska-Ciesielczyk
1,* and
Teofil Jesionowski
1,*
1
Institute of Chemical Technology and Engineering, Faculty of Chemical Technology, Poznan University of Technology, Berdychowo 4, PL-60965 Poznan, Poland
2
Department of Process Engineering and Chemical Technology, Faculty of Chemistry, Gdansk University of Technology, Narutowicza 11/12, PL-80233 Gdansk, Poland
3
Faculty of Chemistry, Adam Mickiewicz University Poznan, Uniwersytetu Poznanskiego 8, PL-61614 Poznan, Poland
4
Institute of Plant Protection, National Research Institute, Węgorka 20, PL-60318 Poznan, Poland
5
Institute of Materials Science and Engineering, Faculty of Mechanical Engineering and Management, Poznan University of Technology, Jana Pawla II 24, PL-60965 Poznan, Poland
*
Authors to whom correspondence should be addressed.
Catalysts 2020, 10(5), 586; https://doi.org/10.3390/catal10050586
Submission received: 5 May 2020 / Revised: 18 May 2020 / Accepted: 19 May 2020 / Published: 23 May 2020

Abstract

:
In this study, titania nanoparticles were obtained using the microwave-assisted technique. Moreover, different surfactants (PEG (Mn = 400), Pluronic P123 and Triton X−100) were used during the synthesis in order to determine their impact on the crystallinity and morphology of the final products. Subsequently, techniques such as XRD, SEM and TEM (performed in high contrast and high-resolution mode), diffuse reflectance spectroscopy (DRS), low temperature N2 sorption (BET model), FTIR and TGA were carried out. Based on the crystallinity analysis of the obtained materials, it was established that the addition of surfactants results in greater (PEG and Triton X−100) or smaller (Pluronic P123) average crystallite size. The main purpose of this study was to use the synthesized nanomaterials in the photodegradation process (in the UV light range) of the model organic pollutants – phenol (20 mg/L) and etodolac (15 mg/L). Furthermore, it was also pointed out that the dye-sensitized solar cells can be a second application for the synthesized titania nanomaterials. The photo-oxidation and photovoltaic tests have shown that the titanium dioxide obtained using the surfactant-assisted microwave method is characterized not only by better photodegradation efficiency of phenol and etodolac, but also by higher photocurrent density compared to the reference titania samples—the pristine TiO2 and commercial P25.

1. Introduction

Currently, the issues related to environmental pollution and renewable energy technologies play a key role in environmental protection. It should be noted that an economy based on fossil fuels results in a growing amount of environmental waste, including sewage as well as air pollution [1,2,3]. It is estimated that the reserves throughout the world could only last for 40 years in the case of oil, 60 years for natural gas and 200 years for coal. Therefore, a change of strategy which entails the development of new technologies [4] that will not have a negative impact on the natural environment [5] is one of the most important goals for humans. To this end, green chemistry assumptions have been developed and, in recent years, they have been focused on processes such as the photocatalysis [6] or dye-sensitized solar cells (DSSC) [7]. The growing interest in the above-mentioned processes is also reflected by the increasing number of scientific articles. A summary of the number of searches in the Scopus database over the past three years for keywords such as photocatalysis, photovoltaics and environmental protection are presented in Figure 1.
Many researchers have indicated that, to date, the environmental protection studies have focused only on the degradation of pollutants in wastewater [8,9]. Nevertheless, the air pollution is equally important [10]. Air pollution, as defined by the World Health Organization (WHO), is any substance which is harmful to health or dangerous for other reasons [11,12,13]. The reports of the Global Health Observatory (GHO) indicate that every year approximately 4 million people die due to air pollution. Hüsken et al. [14] and Olmo et al. [15] have stated that the increasing road traffic, the industrial revolution as well as the district heating based on fossil fuels were the main sources of air pollution. For this reason, it is necessary to introduce appropriate restrictions. Currently, the directives of the European Union (EU) indicate that renewable energy must account for 27% of all energy produced starting from 2030 [16]. Furthermore, the EU is still working on new directives for reducing the emission of CO2 and other air pollutants [17]. It is worth mentioning that the United States have invested more than $90 billion in clean energy development through the Recovery Act [18]. Based on the above-mentioned results, an increasing awareness about caring for the environment can be observed.
However, in order to introduce the directives, it is also necessary to develop the technology and, consequently, to develop materials engineering. The available literature reports indicate that the photocatalytic process can be successful not only in case of wastewater pollutants, such as phenolic derivatives [19] or pharmaceuticals [20], but also for the purification of the environment from volatile organic compounds [21]. The first efforts have been made since the 1990s in Japan, and include the applications of the photocatalytic reaction for air-purifying purposes and self-cleaning applications [22]. Another method for the improvement of air quality is to limit the energy production from fossil fuels. For this purpose, the application of dye-sensitized solar cells seems very promising. In the case of DSSC, there are three important steps to convert energy [23]. The first is based on the visible photo-excitation of dyes triggering an electron transfer into the conduction band of the metal oxide semiconductor. Subsequently, the regeneration of the oxidized dye by electron donation from the redox couple in the electrolyte occurs. The final step is the migration of electron through the external load to complete the circuit [24]. However, the most important issue for the DSSC efficiency is the selection of a photoanode material and its structure which determines the current–voltage characteristics [25].
For this reason, the engineering of the above-mentioned material is extremely important in order to obtain the products with designed properties, which can be used for environmental protection [26]. The available scientific reports indicate that titanium dioxide is one of the most common photoanode materials used in DSSC [27]. However, titania nanocrystalline particles exhibit high transparency in the solar spectrum due to their small size, and therefore it is necessary to improve the light absorption and scattering capability of such photoanodes so that the sensitizer within the semiconductor architecture may efficiently collect energy [28]. It should be noted that the design of titanium dioxide with defined crystallite size and particles morphology can improve both the photovoltaic and photocatalytic properties. Researchers have established that the doping of TiO2 with nitrogen [29] or fluorine [30] allows to obtain a hollow mesoporous structure of titania [31,32], but also enhances its the photovoltaic and photocatalytic activity. Furthermore, Canevali et al. [33] and Nam et al. [34] have reported that the method of synthesis, such as the hydrothermal as well as ultrasonic-assisted approaches, influence the applications of the synthesized materials. Based on this, it should be noted that the selection of an appropriate modifier and synthesis method plays an important role in the improvement of photovoltaic and photocatalytic properties.
In this work, the surfactant-assisted (PEG (Mn = 400), Pluronic P123 and Triton X−100) synthesis of titania nanocrystalline particles are described, with the effects of the selection of surfactants on the crystallinity and morphology observed. Cubic and octahedral-like particles of the materials have been obtained as a result of the surfactant-assisted synthesis. Additional investigations revealed good thermal stability of all synthesized titania materials and differences in the amount of hydroxyl groups. The key point of the conducted research was to analyze the photocatalytic properties of synthesized nanomaterials towards phenol and etodolac. High crystallinity and cubic shape of the particles (considering the use of surfactants such as PEG and Triton X−100 in the synthesis) play an important role in the improvement of photocatalytic activity in comparison to commercially available titania (P25). The described materials have also exhibited satisfactory properties when used as semiconducting layers in DSSCs. The best photovoltaic parameters have been found for TiO2_Triton−X100 material, which was characterized by an optimal ratio between the surface −OH groups concentration, crystallite size, and mesoporous parameters. The results show that the synthesized titanium dioxide samples are promising materials for both photocatalytic and photovoltaic applications.

2. Results and Discussion

2.1. Morphology

At the outset, the scanning electron microscopy (SEM) was carried out. The results of the SEM analysis are shown in Figure 2.
On the basis of the presented images, a tendency to aggregation for all analyzed materials was found. It should be noted that both the reference sample—pristine TiO2 (Figure 2a)—as well as the materials obtained using the surfactant-assisted method (Figure 2b–d) were characterized by similar morphology. Moreover, in case of the synthesized titania materials the particle diameter was below 100 nm, which allows the obtained materials to be qualified as nanomaterials [35]. Particles with a bigger diameter compared to other materials were observed only for the TiO2_Pluronic P123. Furthermore, a single cubic-like particles shape was observed for this oxide material. However, based on the obtained SEM results, it is not possible to interpret the influence of the addition of surfactants on the shape of a single TiO2 particle in detail. Therefore, transmission electron microscopy (TEM) analysis (Figure 3) was carried out for this purpose.
Based on the TEM image obtained for the reference sample (TiO2), it should be noted particles with a rod-like shape were observed. Moreover, the particles are characterized by a diameter of approximately 50 nm and length of 150 nm. In addition, the crystallographic spacing of 0.35 nm which matches well with the (101) plane of anatase was observed in the high-resolution images (Figure 3a). For the TiO2_PEG material, cubic-like particles were observed, with a diameter of approximately 25 nm. Furthermore, it should be emphasized that polyethylene glycol-modified titania is characterized by smaller particles compared to the reference sample. Moreover, the crystallographic spacings of 0.35 and 0.24 nm which match well with the (101) and (004) planes of anatase were observed for the above-mentioned material. Otherwise, it was found that the difference in the FFT images is associated with the change of crystallinity (Figure 3b). However, it should be noted that the Pluronic P123-modified TiO2 (sample TiO2_Pluronic P123) is characterized by rod-like and octahedral shapes of particles. Additionally, the crystallographic spacings characteristic for (101) and (004) planes of anatase were observed. The analysis of the HRTEM results indicates that aside from the crystallographic spacings of 0.35 nm, spacings of 0.24 nm were also determined in the rod structure. Significant changes in the crystallinity of the materials were shown based on the FFT images (Figure 3c). For the TiO2_Trition X−100 sample (Trition X−100-modified TiO2), the rod and cubic-like shape particles can be observed. Additionally, the rod particles possess a diameter of approximately 25 nm and length of approximately 50 nm. Moreover, the diameter of the cubic structure is equal to approximately 15 nm. Furthermore, in case of the Triton X−100 modified titania the lattice fringes matching well with the (101) and (004) planes of anatase were observed (Figure 3d).
Based on the presented results, it was found that smaller particles size for TiO2 materials were obtained with a surfactants-assisted microwave method. Furthermore, it should be noted that different shapes of the obtained titania nanomaterial particles were reported. Moreover, the changes of the crystallinity of the synthesized materials caused should also be highlighted. In case of the reference sample only crystallography spacing of 0.35 nm was observed as opposed to modified TiO2, in case of which the lattice fringes matching well with the (004) plane were also observed.
The effect of surfactants on the particle morphology of synthesized materials is well known. This fact was described among others by Yu et al. [36], who indicated that the addition of surfactants such as ionic e.g., hexadecyl(trimethyl)ammonium bromide (CTAB) and sodium dodecyl sulfate (SDS) or nonionic PEG400 and polyvinylpyrrolidone (PVP) influenced the final morphology, including the particle size. In the case of ZnO, the surfactants-assisted synthesis allows us to obtain a 3D hierarchical structure. Many researchers [37,38] are working on the formation of new structures of well-known oxide materials due to the appropriate exposition of the crystal facets, e.g., in titania materials [39], which allows to achieve higher photocatalytic efficiency. However, the addition of surfactants can influence not only the morphology but also other physicochemical properties.
After a comparison of the obtained results with the available literature reports, it was established that the change of particle shape and size under the influence of surfactants-assisted synthesis is well known, however, the influence of the addition of the surfactant on the change of crystallinity of fabricated particles is not described comprehensively.

2.2. Crystalline Structure

The crystalline structure is a crucial issue for each material, which can be potentially used in the photocatalytic process. The results of X-ray diffraction analysis (XRD) are presented in Figure 4.
At the outset, it should be noted that the anatase (crystallographic database card no. 9009086) crystalline structure (space group I41/amd, no. 141) was observed [40] both for the reference sample as well as for surfactant-modified titania nanomaterials. Furthermore, it was found that the crystalline planes such as (101), (103), (004), (200), (105), (211), (204), (116), (220) and (215) occur in the titanium dioxide nanomaterials [41]. However, in order to determine the difference in terms of the crystalline structure of the obtained oxide materials, the average crystallite size was determined. The average crystallite size was calculated based on the Scherrer equation [40]. The results of the above-mentioned mathematic operations are shown in Table 1.
Based on the presented results (Table 1), it was found that the inclusion of surfactants into the microwave-assisted synthesis of titanium dioxide influences the crystallite size. In the case of the reference sample TiO2, the crystallite size was equal to 15.2 nm. The addition of Triton X−100 and polyethylene glycol (PEG) improves the crystallinity of synthesized nanomaterials (17.4 and 16.9 nm, respectively). While the introduction of Pluronic P123 to the reaction system resulted in the opposite effect—deterioration of crystallinity (9.8 nm).
A comparison of the obtained results regarding the crystalline structure with the scientific literature indicates that the surfactants-assisted synthesis of titania nanoparticles allows us to obtain anatase or rutile crystalline structure. Wang et al. [42] synthesized titanium dioxide using the hydrothermal method. Titanium(IV) isopropoxide and dodecanediamine were used as a precursor and surfactant, respectively. The Researchers obtained anatase nanoparticles with a flower-like structure. Galkina et al. [43] prepared titanium dioxide nanomaterials using the sol-gel method. Titanium(IV) isopropoxide was used as precursor of TiO2 and Pluronic P123 and polyethylenimine were used as surfactants for the synthesis. The obtained materials were calcined at 400 °C for 4 h. It was found that the addition of polyethylenimine resulted in faster anatase-to-rutile phase transformation. Whereas the introduction of Pluronic P123 did not adversely affect the crystallographic properties of the final material. In both works of Hu et al. [39] and Chan et al. [44], Triton X−100 was used as a surfactant for the synthesis of titania nanomaterials. Although Chan et al. [44] synthesized TiO2 using the sol-gel method, while Hu et al. [39] applied the hydrothermal-assisted method, in both cases the anatase crystalline structure has been observed.
In recent years, many research teams have attempted to determine the effects of surfactants on the synthesis of titanium dioxide nanoparticles. On this basis, it was found that surfactants play a key role in the formation of various particle shapes of titanium oxide nanomaterials [45]. Furthermore, Jun et al. [46] indicated that the modulation of surface energies of different crystal facets is responsible for shape control. However, it should be noted that the addition of surfactants can also influence other physicochemical parameters. The available literature reports have described the improvement of parameters of the porous structure as the result of the addition of surfactants into reaction systems. Jang et al. [47] have reported that the BET surface area was equal to 97 m2/g for the sample synthesized with the addition of Pluronic P123, compared to 56 m2/g in case of TiO2 (P25). The triblock copolymers such as Pluronic P123 or F127 are used in the synthesis of nanomaterials not only in conventional methods, e.g., sol-gel, but also in the hydrothermal technique. However, the crucial role of the above-mentioned surfactants, regardless of the method of synthesis, is to control the formation of a mesoporous structure. Other surfactants (PEG and Triton X−100) were used to achieve the formation of different particle shape. The application of Triton X−100 for the preparation of nano-sized titanium dioxide has been described by Yener et al. [48]. According to the current scientific knowledge, the improvement of the BET surface area may be associated with the deterioration of crystallinity. On this basis, the smaller average crystallite size for a sample prepared with Pluronic P123 can be justified. Whereas, according to theory proposed by Jun et al. [46], it can be explained as the effect of the surfactant on the crystal facets. Therefore, the addition of PEG or Triton X−100 influences the formation of the defined shape particles with exposed facets, which leads to an improvement in the crystallinity of nanomaterials.

2.3. Analysis of Parameters of the Porous Structure

A textural structure is one of the most critical parameters (e.g., dye adsorption, diffusion of electrolyte, light scattering) in all processes using the light (UV or Vis). In order to determine the parameters of the porous structure, the BET analysis was carried out. The isotherms of low-temperature N2 adsorption/desorption were presented in Figure 5. Moreover, the parameters of the porous structure for obtained TiO2 nanomaterials were presented in Table 2.
Based on the obtained results, it was found that type IV [49] isotherm was observed for all obtained TiO2 materials. Moreover, the H1 type hysteresis loop [49] was demonstrated for the reference sample (TiO2) and titanium dioxide modified with PEG and Triton X−100. In contrast, the H2 type [49] hysteresis loop was observed for the TiO2_Pluronic P123 sample. Moreover, it should be mentioned that the hysteresis loop for the samples TiO2 and TiO2_PEG occurs in the same range of relative pressure (p/p0) - 0.6 to 0.95, whereas a shift in the range of relative pressure (0.55−0.98) was observed for the Triton X−100 modified sample.
It should be highlighted that the parameters such as volume and diameter of pores were similar in case of the reference titanium dioxide and the sample modified with polyethylene glycol. The described similarity directly arises from the course of N2 adsorption/desorption isotherms. The above-mentioned materials differ only in terms of the BET surface area—the values of 118 m2/g and 128 m2/g were reported for TiO2 and TiO2_PEG, respectively. Furthermore, it was found that for the TiO2_Trition X−100 sample the effects of surfactant-assisted synthesis on the parameters of the porous structure were observed. The BET surface area increased to 138 m2/g; however, the volume and diameter of pores decreased compared to the reference sample (Vp = 0.28 cm3/g; Sp = 7.9 nm). Moreover, it should be noted that increased average size of crystallite was observed for the above-mentioned material, which should cause a decrease of the BET surface area. On this basis, it was established that the surfactants-assisted microwave synthesis allows to modify not only the shape of particles or their crystallinity but also the parameters of the porous structure. This dependence was also observed for the Pluronic P123 modified titanium dioxide, as the highest BET surface area (200 m2/g) and the smallest volume (0.21 cm3/g) as well as diameter (5.1 nm) of pores were determined for this material. However, in contrast to samples of TiO2_PEG and TiO2_Trition X−100, a smaller average size of crystallite was observed for this material, which also affects the growth of the BET surface area. However, it be noted that only the TiO2_Pluronic P123 sample was characterized by a type II hysteresis loop, which clearly indicates that the change of the parameters of the porous structure is associated with surfactants-assisted synthesis.
The available scientific reports indicate that surfactants such as copolymers (e.g., Pluronic P123 or F127) have a lot of applications in the synthesis of mesoporous oxide materials. The use of the above-mentioned surfactants was described by Abdolahi Sadatlu et al. [50], who obtained the mesoporous titania materials with a BET surface area of 114 m2/g. The materials synthesized with the soft template method were characterized by a specific ordered structure of the particles, which was discussed in the research works by Liu et al. [51] and Rathouský et al. [52]. Moreover, it was found that a well-developed BET surface area can be crucial in the application of the materials in the DSSC. However, not only copolymers can be used in the synthesis of nanomaterials. Guo et al. [53] used different surfactants such as PVP or CTAB in the hydrothermal-assisted synthesis of photocatalysts. In another work, Suthakaran et al. [54] described the use of PEG, CTAB and SDS for the synthesis of SnO2 with potential application in water purification and energy conversion. Based on this, it was found that the surfactants-assisted synthesis contributes to new possibilities, since it allows the synthesis of nanomaterials with designed properties.

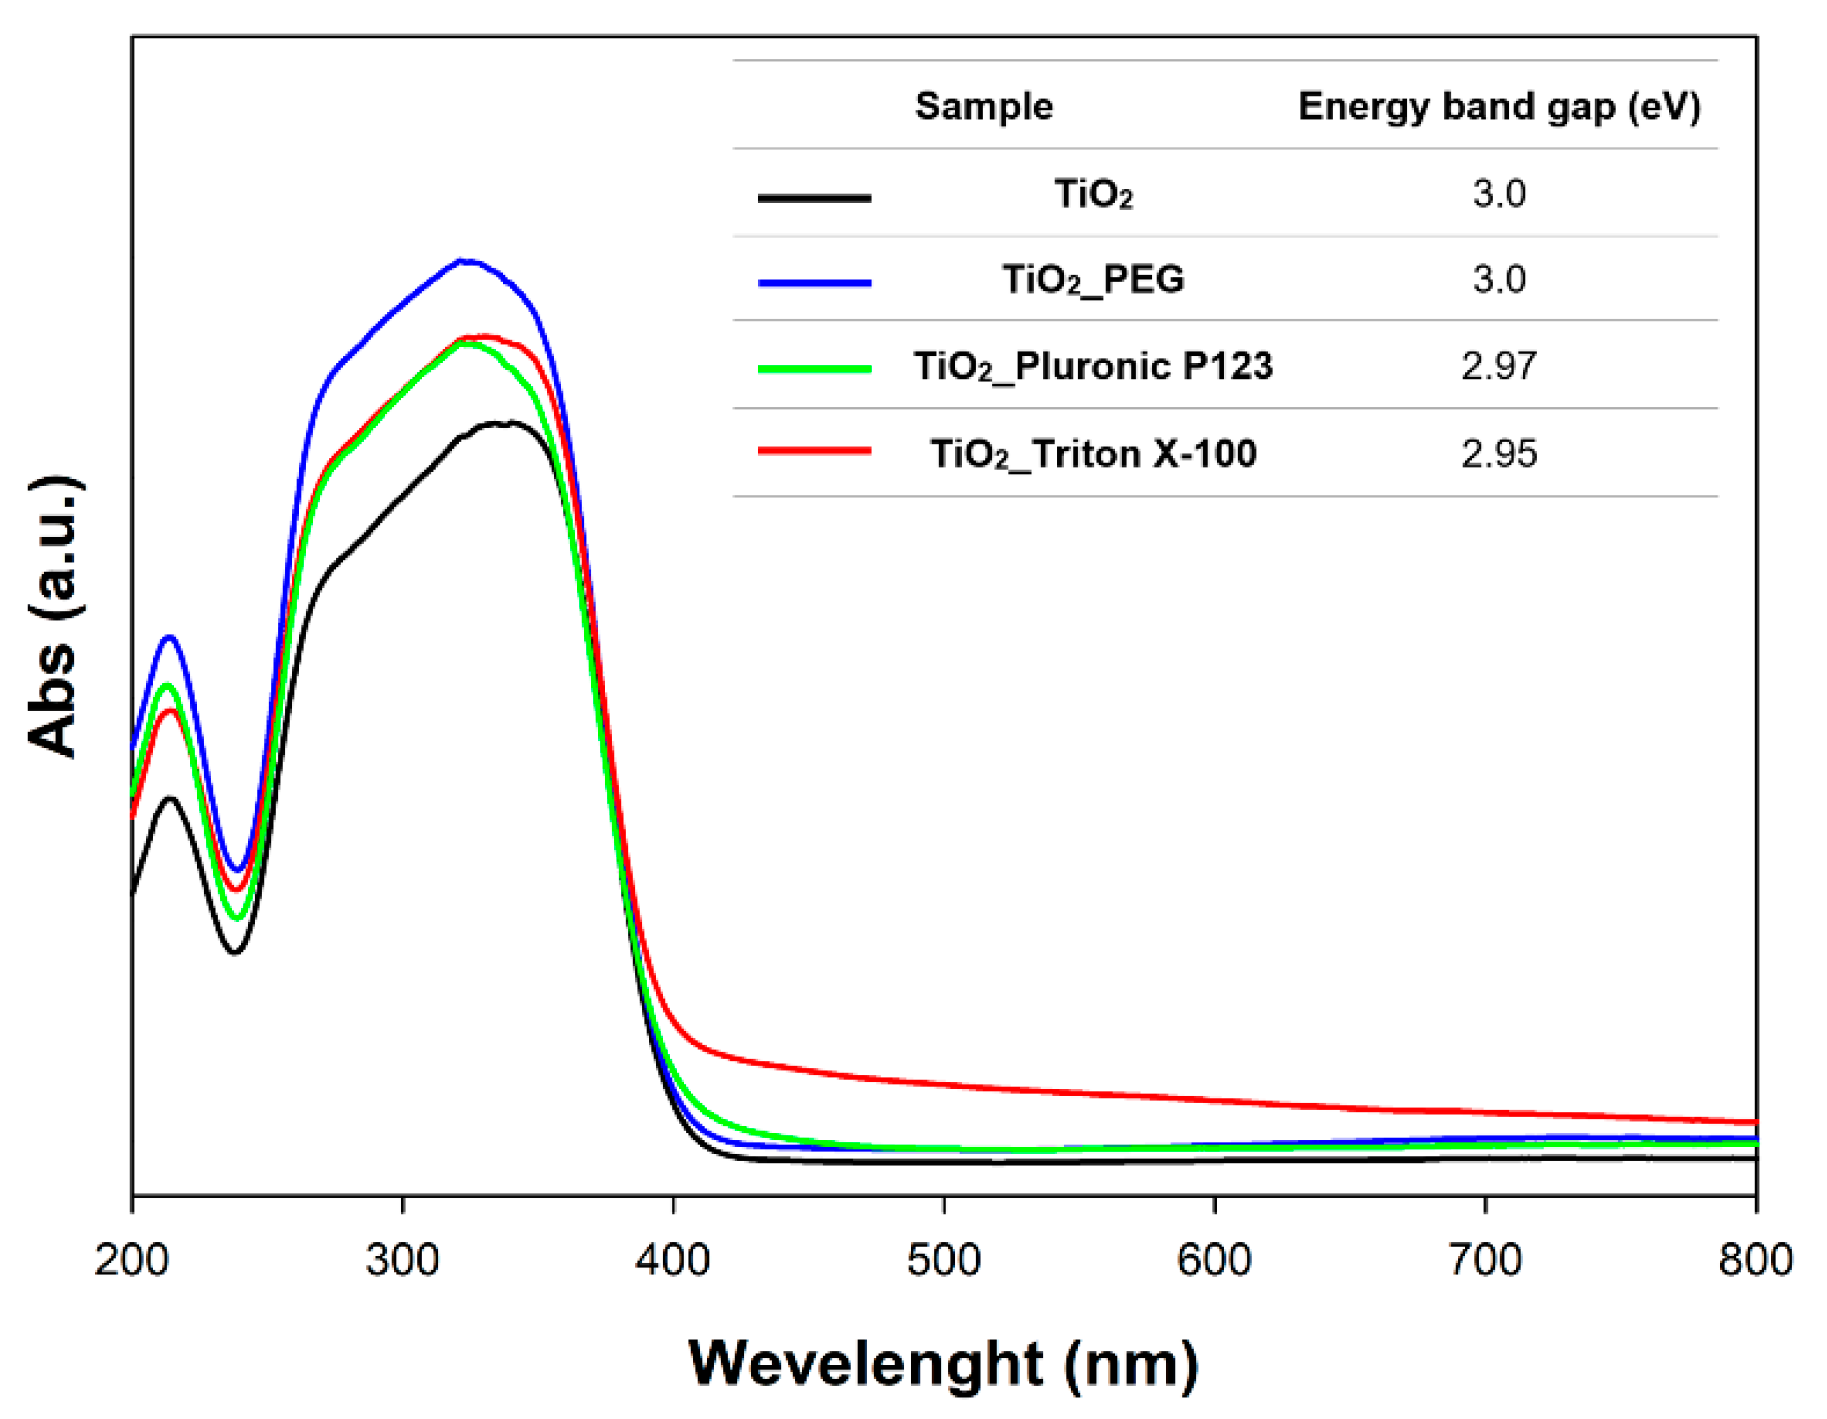
2.4. Diffuse Reflectance Spectroscopy (DRS)
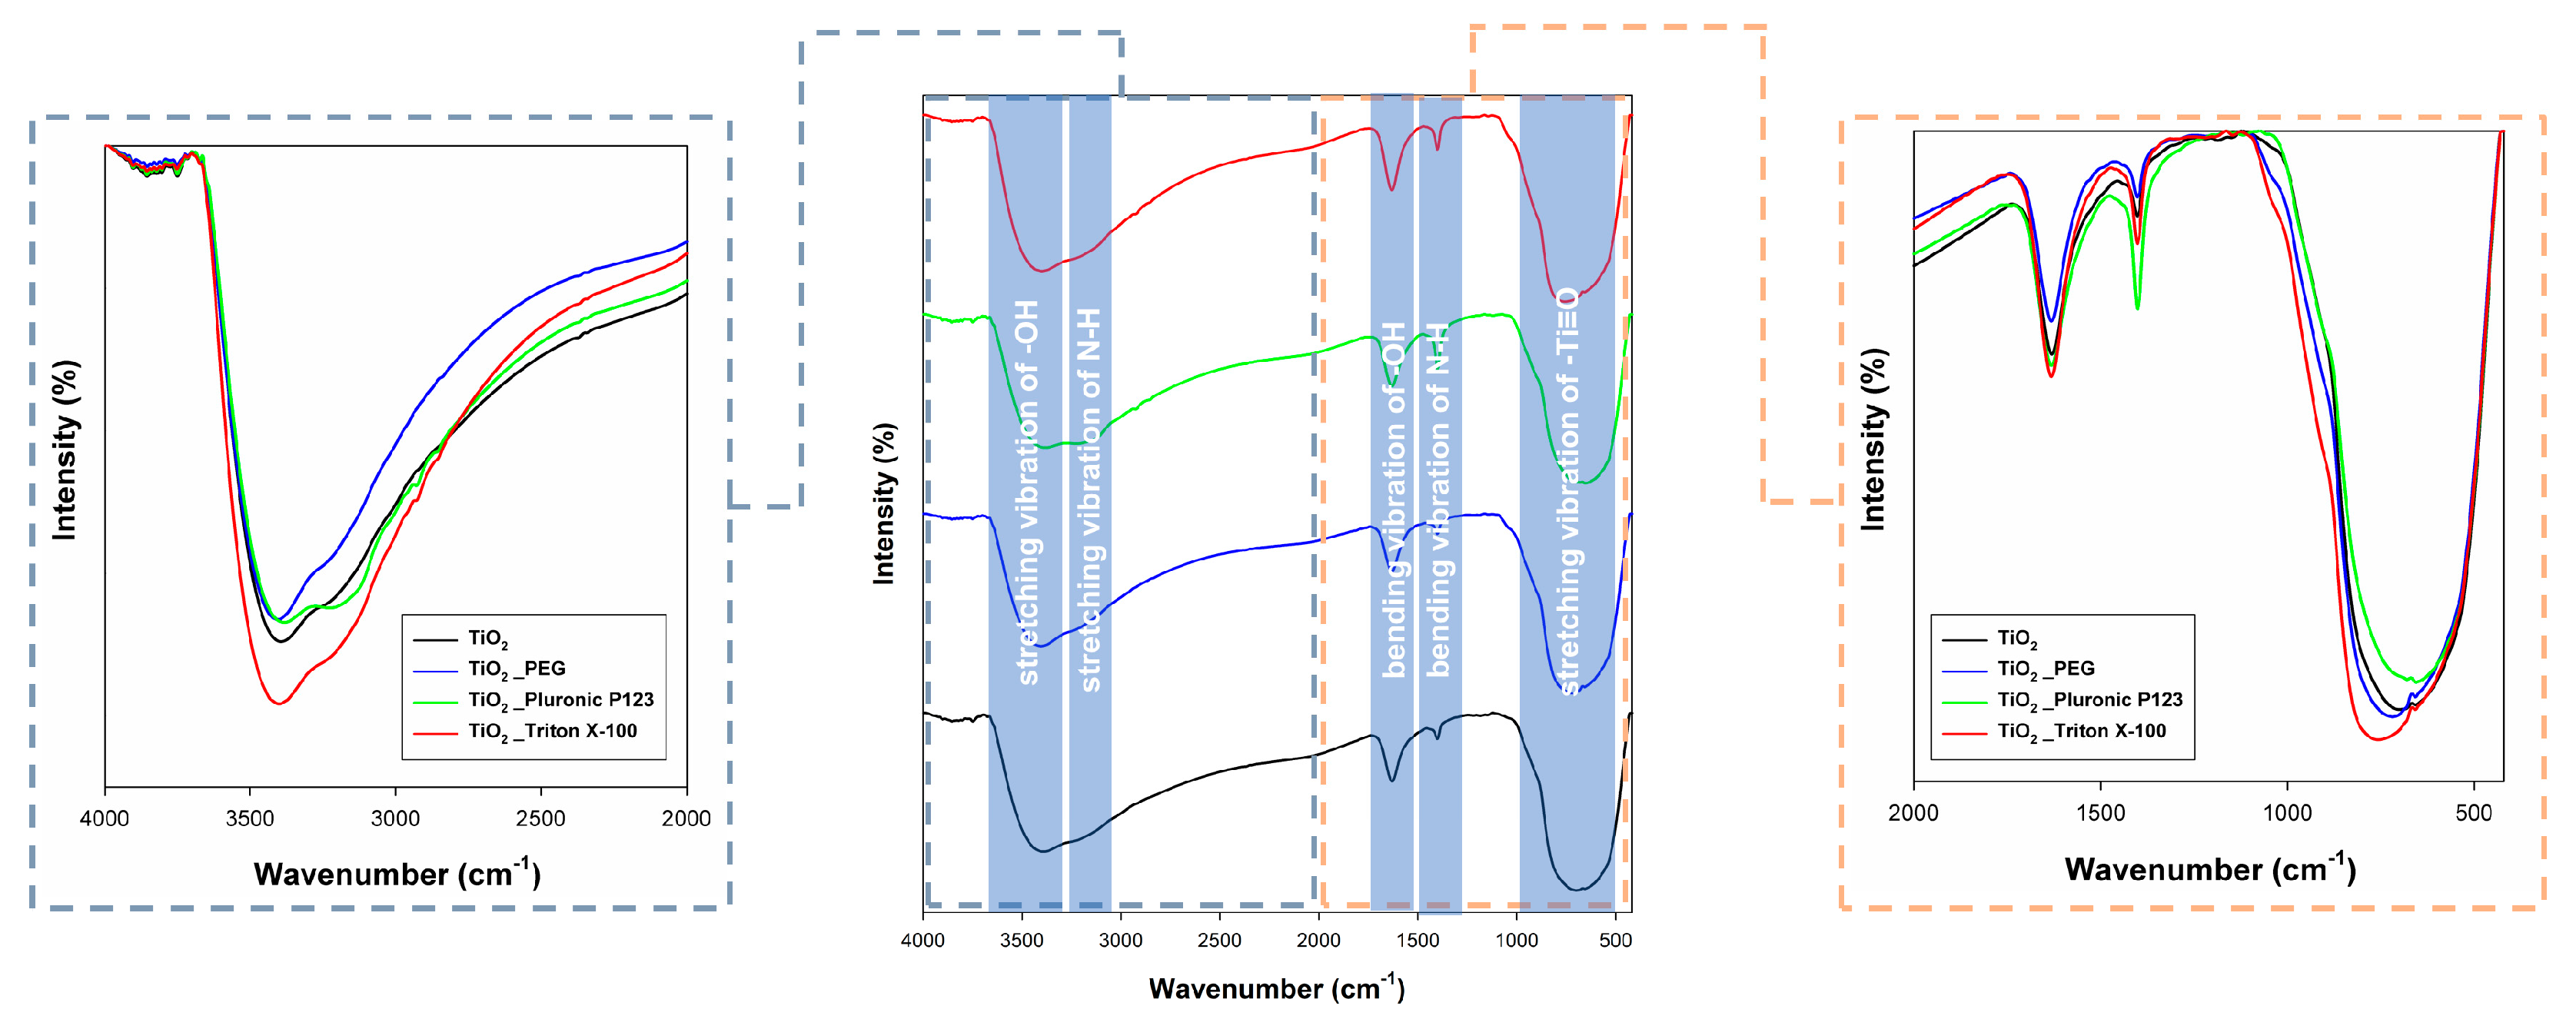
In order to determine the energy band gap, the diffuse reflectance spectroscopy (DRS) analysis was carried out. The obtained absorption spectra were presented in Figure 6.
The plot of the Kubelka–Munk function versus the photon energy gives indirect band gaps of 3.0 eV for the reference TiO2 and TiO2_PEG, while value equal to 2.97 eV and 2.95 eV were observed for samples modified with Pluronic P123 and Triton X−100, respectively. The energy band gaps of analyzed nanomaterials were similar to those reported for titania [41,55], which indicates that the surfactants-assisted microwave-synthesis does not influence the energy band gap.

2.5. FTIR Analysis

Fourier-transform infrared spectroscopy (FTIR) measurements were carried out in order to characterize the functional groups. The FTIR spectra of titania nanomaterials are shown in Figure 7.
The band characteristic for strong stretching vibration of the groups −Ti≡O (715 cm−1) was observed. Moreover, in the case of synthesized titania nanomaterials, the stretching vibrations (3150 cm−1) and bending vibrations (1400 cm−1) of the N-H groups were observed, which is associated with the use of the ammonia solution as a pH regulator during the synthesis of titania nanoparticles. Furthermore, it should be noted that all obtained materials were characterized by stretching vibrations (3450 cm−1) and bending vibrations (1600 cm−1) of the hydroxyl group (−OH). Based on the presented results, it has been established that the obtained FTIR spectra include bands characteristic for titanium dioxide. Moreover, it has been found that the change of surfactants does not influence the presence of the bands in the FTIR spectra. The surfactants-assisted synthesis only affects the change of the intensity of characteristic bands.

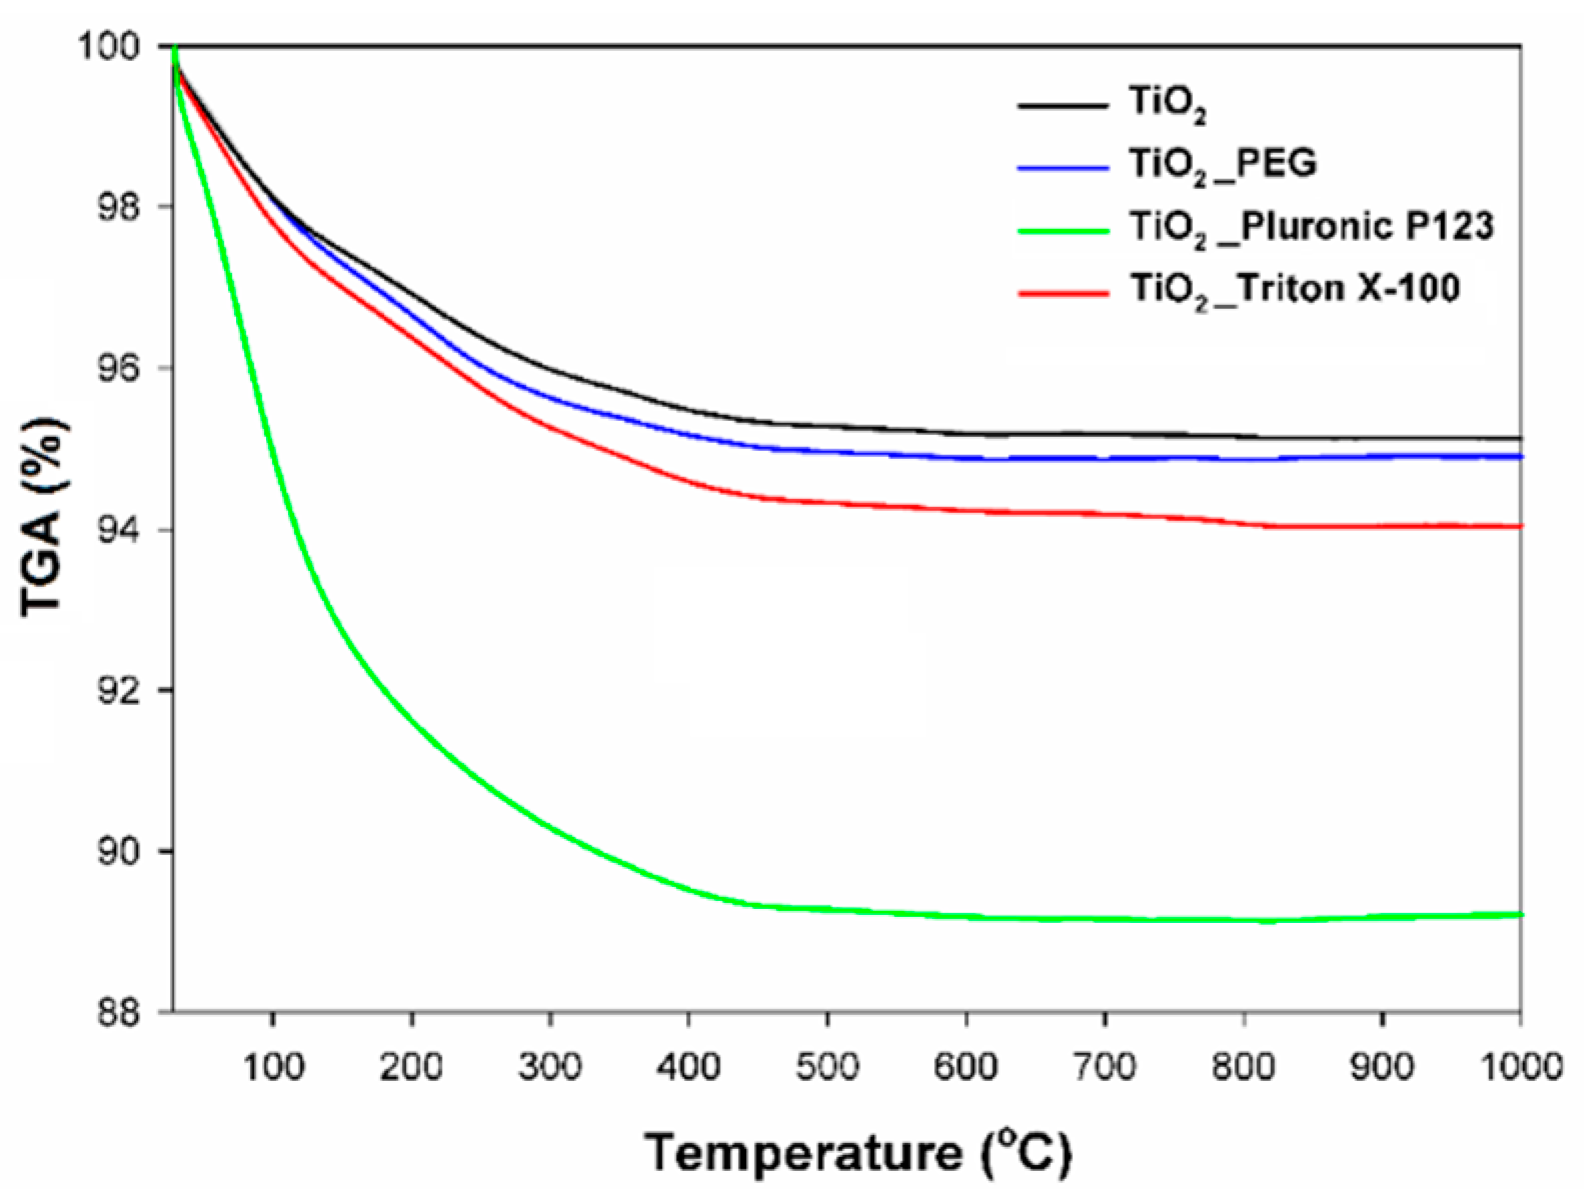
2.6. Thermogravimetric Analysis

Thermogravimetric analysis was carried out to determine a thermal stability of synthesized materials. The TGA curves for different titanium dioxide samples were presented in Figure 8.
Firstly, it was established that all analyzed titania materials exhibit good thermal stability. Furthermore, it should be noted that for both titanium dioxide modified with surfactants and reference sample, only a single decrease of mass associated with the elimination of surface bound water (in the temperature range of 0–400 °C) was reported. The observed loss of mass was equal to 4.53% (TiO2), 5.01% (TiO2_PEG), 5.57% (TiO2_Triton X−100) and 10.67% (TiO2_Pluronic P123).
Based on the TGA results, the content of –OH [56] in the analyzed TiO2 samples was determined. The total hydroxyl group content was calculated based on the entire mass loss in the temperature range 20–400 °C, after the complete removal of physisorbed water from the structure, and all values were shown in Table 3.
The presented content of hydroxyl groups indicates that in case of the reference sample it was equal to 0.49 mmol/g TiO2. It should be noted that the application of the surfactant-assisted synthesis influenced the content of −OH. The values of 0.58, 0.70 and 1.21 mmol/g TiO2 were reported for TiO2_PEG, TiO2_Tritox X−100 and TiO2_Pluronic P123 samples, respectively. Additionally, the content of hydroxyl groups in titania materials is widely described in the available scientific reports. In the work of Wu et al. [57], it was indicated that the content of –OH groups in P25 Degussa was equal to 0.49 mmol/g TiO2. It should be emphasized that this value is the same as for the reference sample in this work. The content of −OH groups in titanium dioxide materials presented in the publications [58] was similar to those obtained in our work.

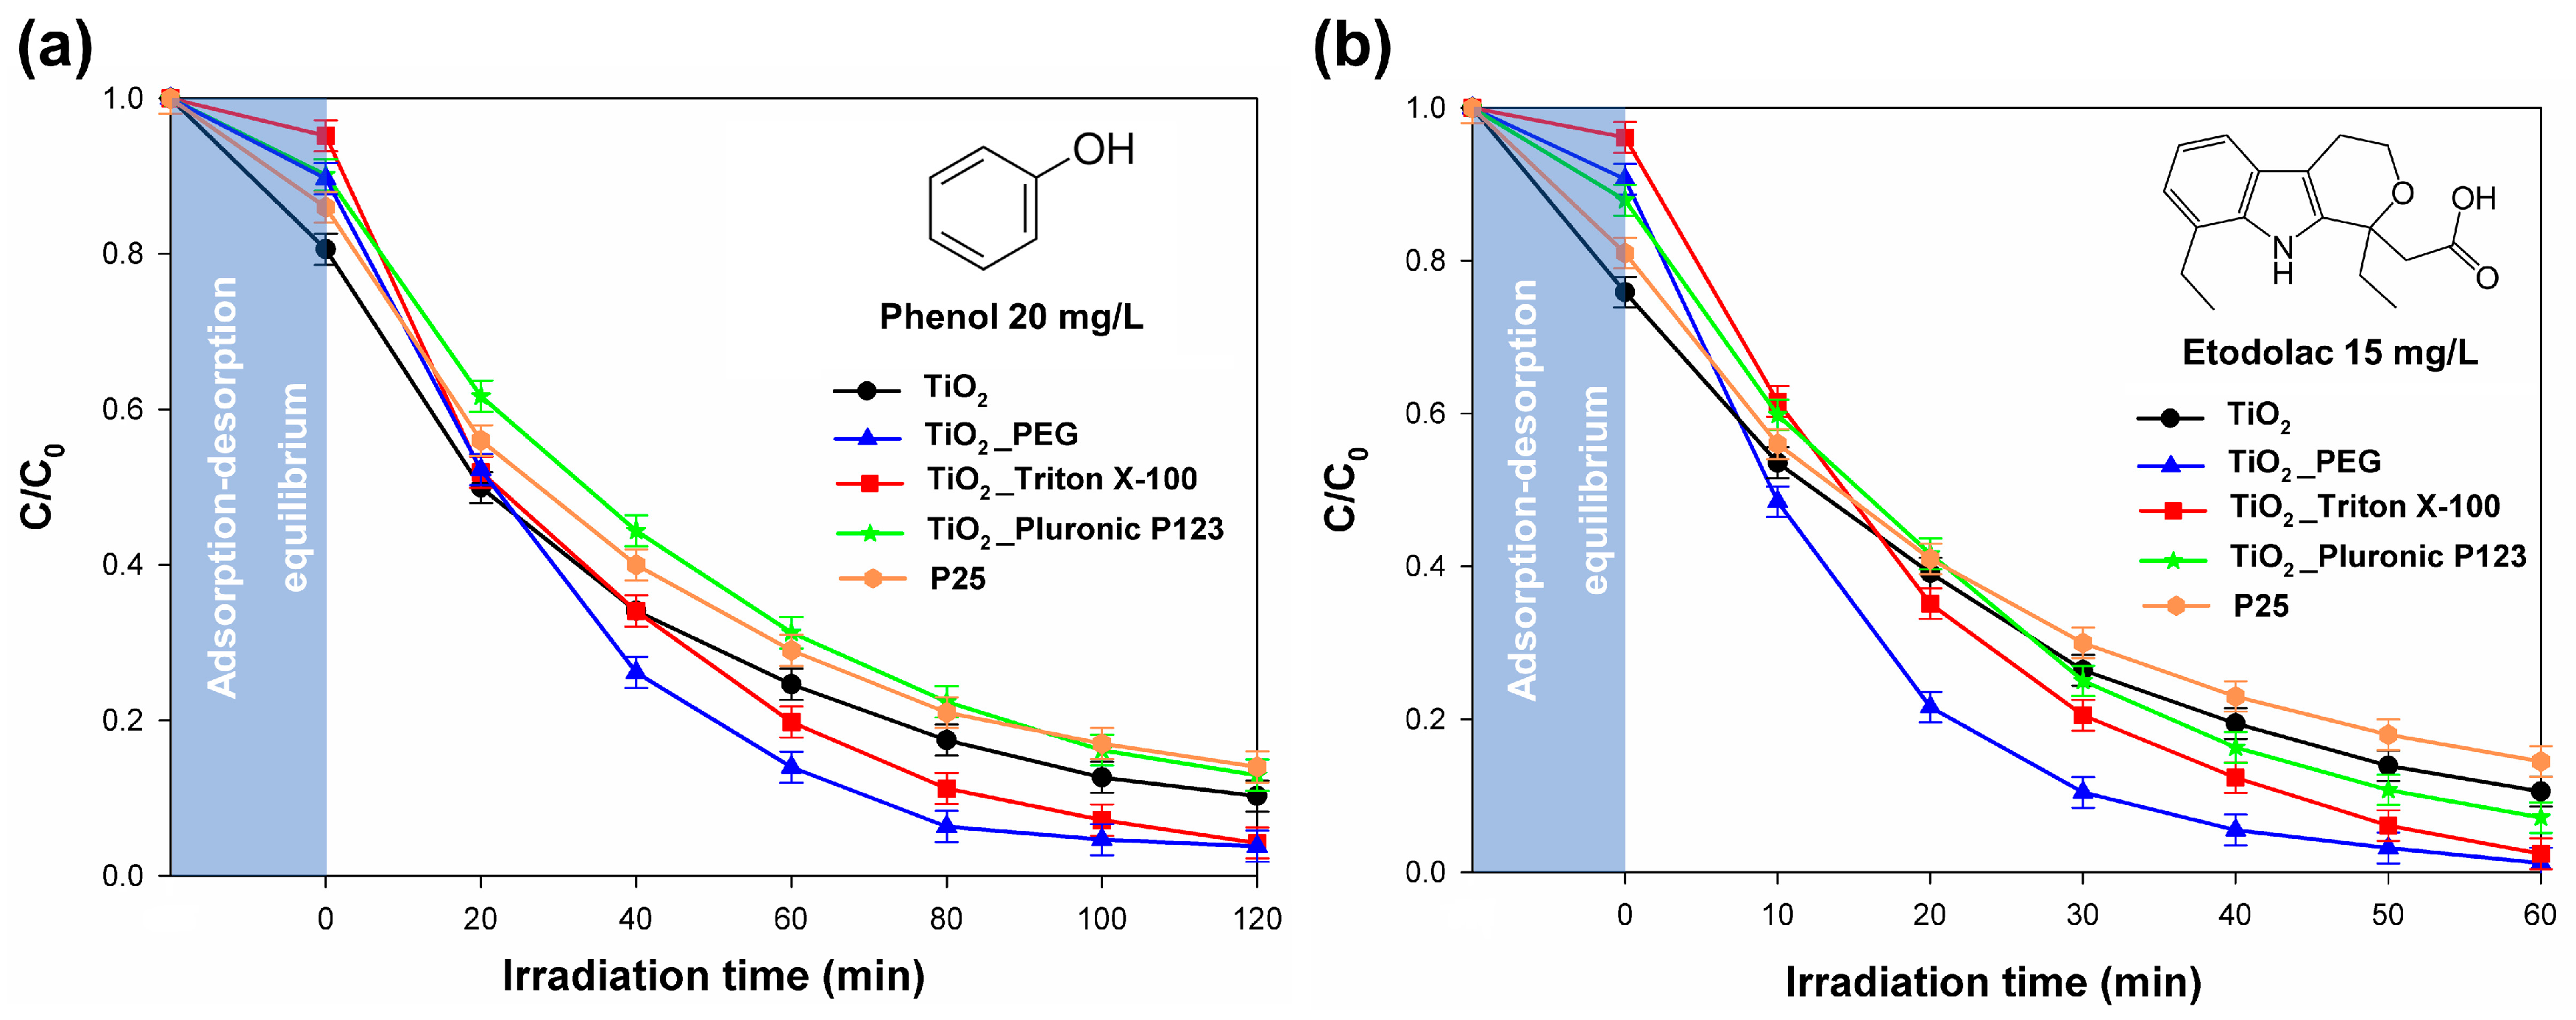
2.7. Photocatalytic Activity

The photocatalytic activity of the obtained titania nanomaterials was evaluated based on the degradation of phenol (20 mg/L) and etodolac (15 mg/L). The results of photodegradation are presented in Figure 9.
Currently, phenol and its derivatives, such as 4-nitrophenol or bis-phenols, are recognized by World Health Organization (WHO) as one of the major environmental problems due to their toxicity to aquatic organisms [59]. Therefore, there is a need to intensity the research on the degradation of phenols in water environment exists.
The reference TiO2 sample was characterized by a photodegradation efficiency of 90%. Additionally, this material exhibited the high efficiency of adsorption equal 20%. Subsequently, the photocatalytic activity tests for titanium dioxide modified with surfactants were performed. In the case of TiO2 modified with Pluronic P123, a deterioration of photocatalytic activity compared to the reference sample was observed. In case of the above-mentioned material, the photodegradation yield was equal to 86%. In the case of TiO2_PEG and TiO2_Triton X−100 samples, similar results of photodegradation were reported, the efficiency of phenol degradation was equal to 95% for both materials. However, for titania modified with polyethylene glycol, 93% yield was observed already after 80 min. It is worth adding that a comparison of the obtained results with the commercial photocatalyst P25 indicated the higher photodegradation efficiency of phenol for titanium dioxide synthesized with microwave irradiation.
Based on the analysis the obtained results of photocatalytic degradation of phenol, it should be noted that the surfactants-assisted microwave synthesis in the case of polyethylene glycol and Triton X−100 improved the photocatalytic activity compared to the reference TiO2 sample. Whereas a deterioration of the photocatalytic properties was observed for titania modified with Pluronic P123. The scientific knowledge indicates that the content of hydroxyl groups affects the improvement of photocatalytic process [60], however this correlation is not true for analyzed materials. Similar observation was described by Di Paola et al. [61], who indicated the anti-correlation between oxidant power and selectivity. The authors reported that the higher rate of 4-nitrophenol degradation was achieved for crystalline sample, whereas the highest selectivity of p-anisaldehyde synthesis occurred for the least crystalline and most hydroxylated TiO2 sample. Furthermore, Liu et al. [62] described that the photodegradation of phenol depends on the morphology of nanostructured titanium dioxide. It should be noted that the TiO2_PEG and TiO2_Triton X−100 materials are characterized by the higher crystallite size—16.9 and 17.4 nm, respectively. Additionally, a cubic-like particle shape was observed for above-mentioned samples. On this basis, it was found that the crystalline structure, morphology as well as textural properties have a crucial impact on the photodegradation efficiency of phenol.
Etodolac (1,8-diethyl−1,3,4,9-tetrahydro pyran-[3,4-b]indole−1-acetic acid) is used as an anti-inflammatory, analgesic as well as antipyretic drug [63]. This drug, such as others pharmaceuticals is excreted unchanged from the human body, therefore it is frequently detected in the sewage [64]. It has been stated [65] that etodolac has a negative effect on aquatic organisms, causes disorders in normal development and even inhibits the reproduction of aquatic individuals. For this reason, it is dangerous for aqueous environment, e.g., rivers or lakes.
In case of the titania sample obtained without surfactants, the efficiency of etodolac photodegradation was equal to 90% after 60 min. In addition, the highest adsorption yield (25%) was also achieved for the above-mentioned material. In contrast to the results of photocatalytic test of phenol degradation, the TiO2_Pluronic P123 oxide material exhibited better photodegradation efficiency (93%) compared to the reference sample. Whereas similar dependencies to phenol photodegradation were observed for the titanium dioxide modified by Triton X−100 and polyethylene glycol. In the case of both materials, high etodolac degradation efficiency of approximately 100% was observed. However, for the TiO2_PEG sample, the high photodegradation efficiency of 95% was reported after 40 min. Furthermore, it should be noted that the materials obtained via the microwave method are characterized by better photocatalytic activity than the commercially available titanium dioxide, such as P25.
Based on the analyzed results of etodolac photodegradation tests, it was found that, the crystallinity of the synthesized materials did not directly impact the photodegradation efficiency, unlike in case of phenol degradation. This issue can be observed for the TiO2_Pluronic P123 sample which is characterized by the smallest crystallite sizes among all obtained oxide materials, however it exhibits better photodegradation efficiency than the reference sample. Morphology as well as particle shape are the crucial parameters which influence the efficiency of etodolac photodegradation. In the case of titanium dioxide prepared with surfactants-assisted microwave method, this material was characterized not only by different particle shape, such as octahedral and cubic-like (only for TiO2_PEG and TiO2_Triton X−100), but also a crystallographic spacing characteristic for plane (004) was observed. Li et al. [66] found that the hierarchical TiO2 nanospheres with controlled surface morphologies are characterized by the improvement of the photocatalytic activity. Moreover, Wu et al. [67] described that the coupling between crystal planes in the photocatalyst results in enhanced activity during the oxidation of pollutants such as methylene blue (in water) and nitric oxide (in air). Additionally, based on the TGA curves as well as the content of hydroxyl groups, it was found that in the case of etodolac photodegradation the increased nOH content improves the photocatalytic activity. In the work of Mrotek et al. [65], it was reported that *O2− and *OH were reactive oxygen species involved in etodolac photocatalytic degradation. Whereas Znaidi et al. [60] and Augugliaro et al. [68] described that the high content of hydroxyl groups increases the efficiency of photocatalytic reaction. However, in order to obtain the best results of the photocatalytic activity, the increase in the content of hydroxyl groups must be combined with the growth of crystallites. They based their conclusions on the results of etodolac photodegradation using titania modified with polyethylene glycol and Triton X−100.
In the review regarding technologies for the removal of phenol, Busca et al. [69] indicated that numerous technologies such as adsorption, membrane processes, biological degradation as well as photocatalysis are considered. However, in the case the adsorption process, a secondary pollution (spent adsorbent) is obtained, whereas the membrane and biological processes require narrow experimental conditions, e.g., temperature or pressure. Therefore, many research groups confirmed that the photocatalysis can be a promising method of phenol removal. Atitar et al. [70] used the mesoporous titania nanoparticles synthesized at different temperatures (400–800 °C) for the photodegradation of phenol. The Authors reported a photodegradation efficiency of approximately 85% after 60 min. Colón et al. [71] described that the sulphate-assisted sol-gel synthesis of TiO2 improved the conversion of phenol. It was found that the conversion was equal to 90% after 120 min. Ahmed et al. [72] and Hadj Salah et al. [73] showed that the photocatalytic efficiency for a solution of phenol at the concentration of 50 ppm using P25 was equal to 92% after 6 h. Moreover, it was indicated that 1 g/L was the optimal value of TiO2 concentration. The research group under the leadership of Neves [74] synthesized TiO2/Ag2S via the photosensitization process. The authors obtained a high efficiency (90%) of phenol degradation after 90 min.
In the case of etodolac degradation, there is only a single article in the available literature regarding the photocatalytic degradation. Mrotek et al. [65] considered the ZnFe2O4/SiO2/TiO2 as a magnetic photocatalyst. They showed that after 20 min of irradiation, approximately 100% of etodolac was degraded. Because the scientific knowledge regarding the degradation of etodolac is narrow, it is necessary to conduct research focused on the removal of etodolac and to improve the understanding of the photodegradation mechanism.
Based on the comparison with the available scientific literature, it should be noted that the proposed surfactants-assisted microwave synthesis allows us to obtain the photocatalysts with a high photodegradation efficiency of phenol and etodolac. In the case of the phenol degradation, it was observed that the synthesized TiO2 samples exhibit a similar or better photocatalytic efficiency than the materials described in the above-mentioned literature review. Additionally, conventional methods such as sol-gel as well as calcination-assisted process, which is very energy intensive, were used in many research works. Therefore, the following advantages of the proposed microwave method can be distinguished: low temperature of synthesis, short process time as well as no toxic waste generation, which makes this method environmentally friendly.

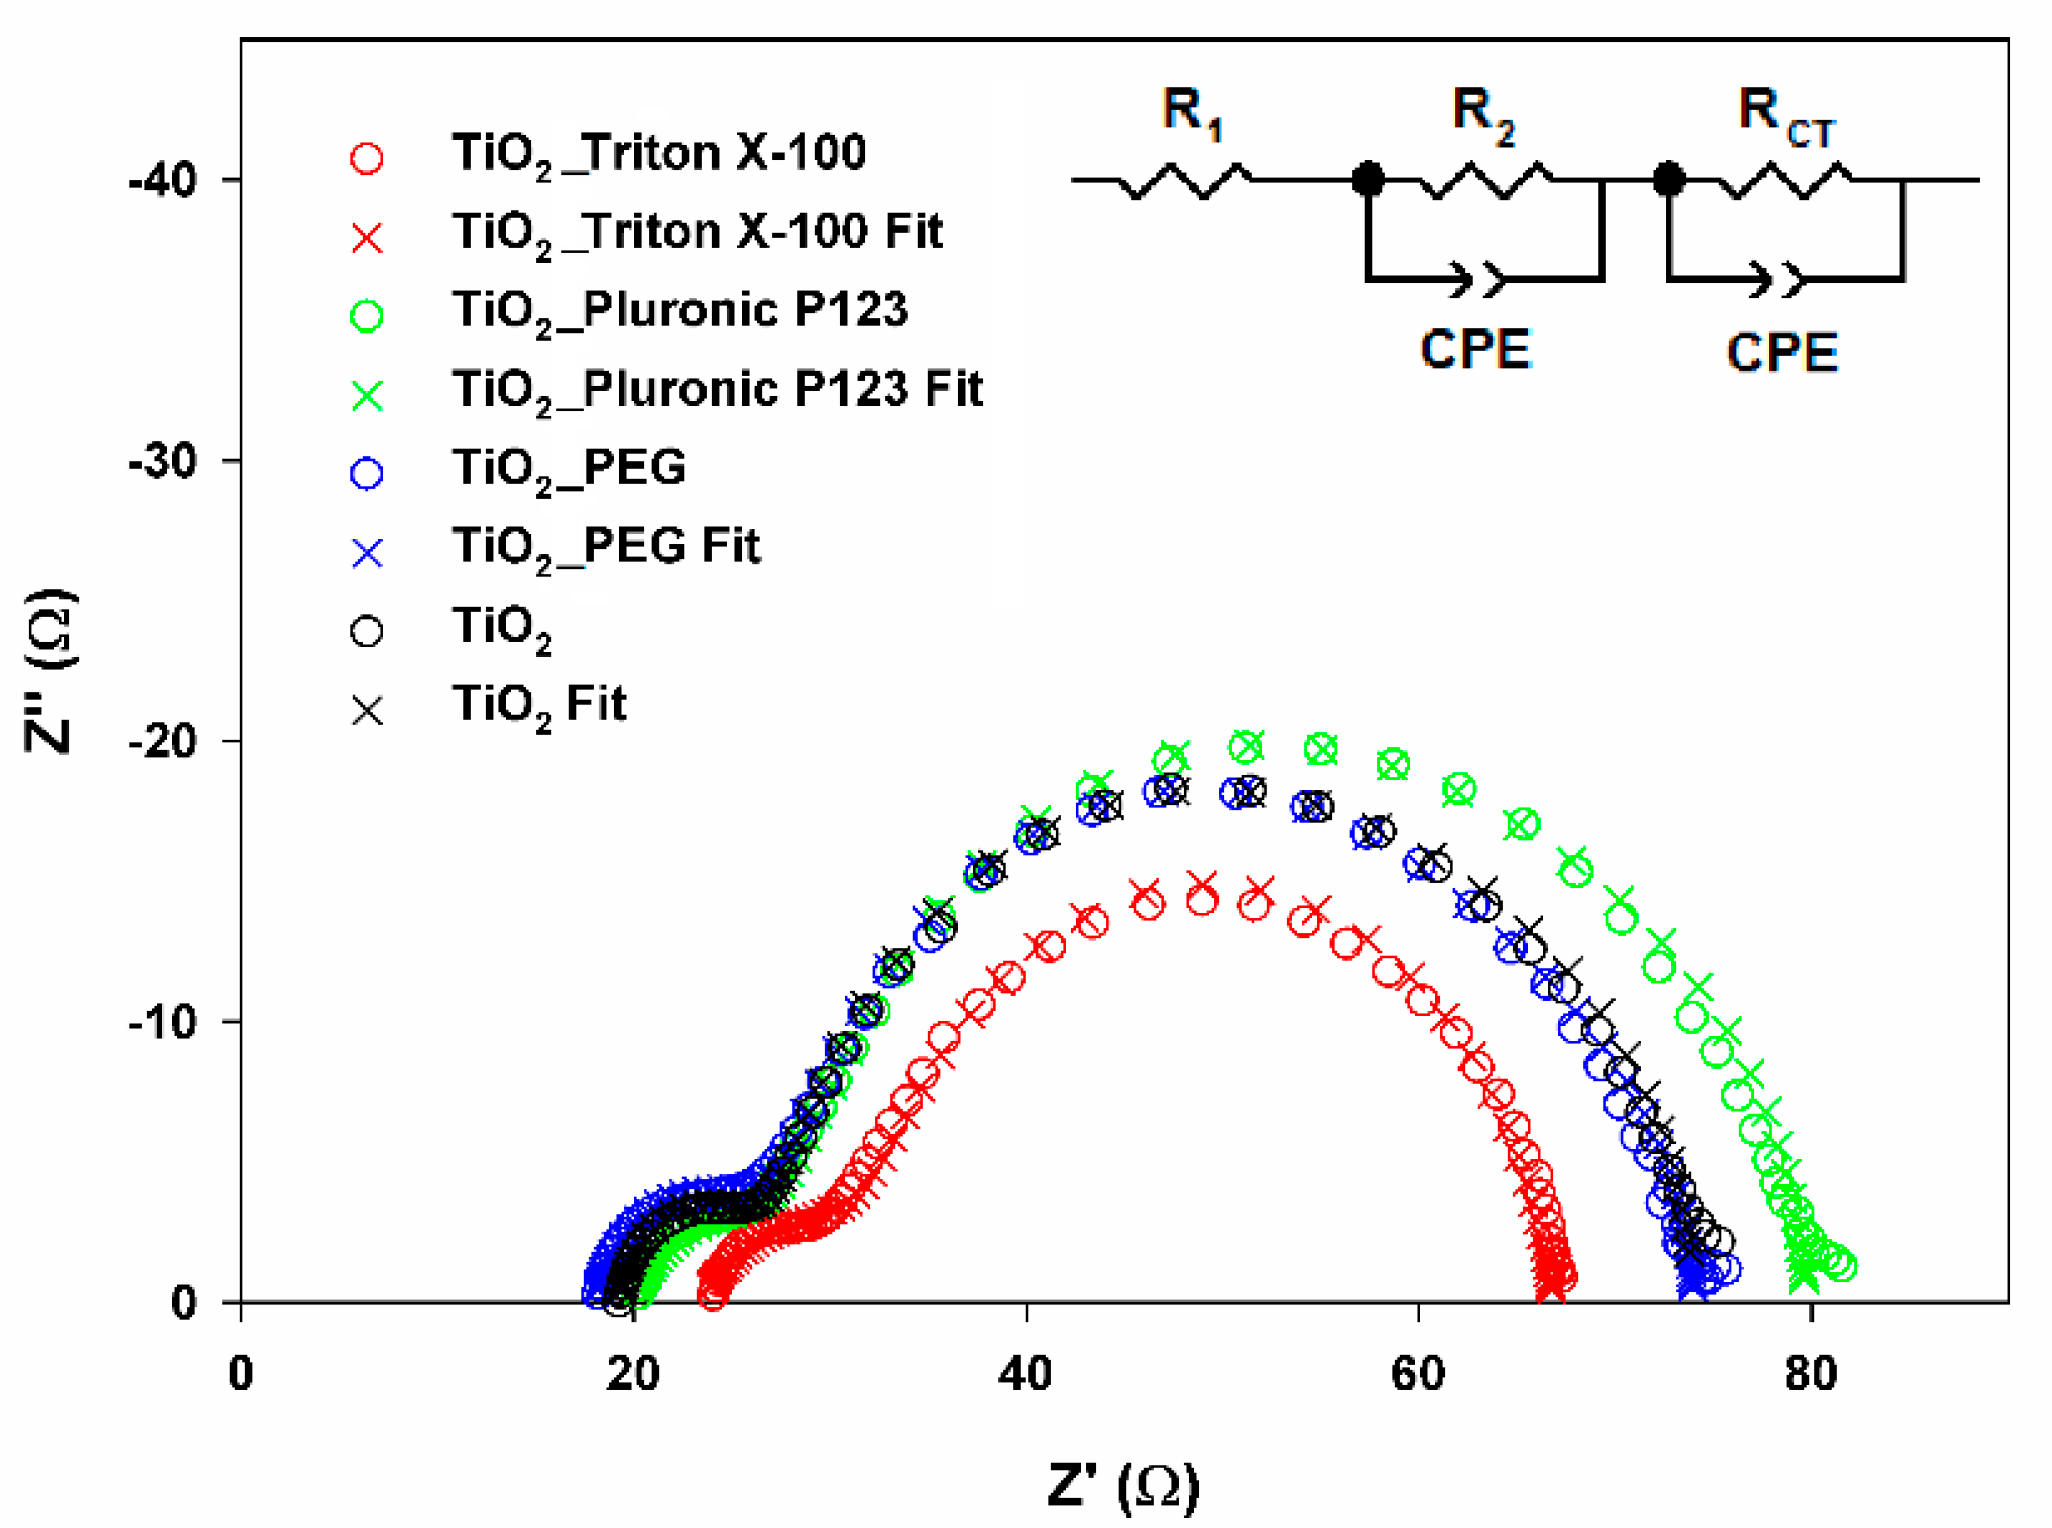
2.8. Photovoltaic Properties

In order to investigate more extensive application possibilities and achieve a more comprehensive characterization of studied materials, a series of dye-sensitized solar cells have been prepared using the surfactant-assisted titania as a porous semiconducting layer of working electrodes. The photovoltaic parameters of the prepared devices have been tested under simulated solar light, and the I-V characteristics curves have been presented in Figure 10, while the main parameters were listed in Table 4. The open-circuit photovoltage (VOC) varied in the range between 710 and 734 mV for TiO2_PEG and TiO2_Triton X−100 devices, respectively, and this was not a significant variation which most likely had a minor influence on the performance of investigated cells. As the VOC parameters correspond to the Fermi level of the semiconductor and the Nernst potential of the redox couple in the electrolyte [75], the observed variation is plausibly caused by the changes in the electronic structure of the particular materials, which is supported by the observations made in DRS experiments described above. The Fermi level shift may be one of the probable reasons for the bandgap changes and, in consequence, for the variation of the observed VOC values. The fill factors (FF), which are the result of energy loss related to the inherent resistance of the cells, are also varied slightly between the investigated devices. The FF values are reasonable for the DSSCs and indicate no internal short circuits or electric breakdowns in the cells. More interesting differences may be observed in short circuit photocurrent density (JSC) values, which ranged from 10.3 to 13.5 mA/cm2 for TiO2_Pluronic P123 and TiO2_Triton X−100, respectively. The amount of dye adsorbed on the electrode surface (Ndye) [75] is one of the factors that influencing JSC, as with increasing the number of dye molecules adsorbed on the electrode, more excited electrons may be generated, and higher photocurrent may be observed. In the studied case, the Ndye values strongly correspond with the JSC values, and the lowest photocurrent has been observed for the TiO2_Pluronic P123 device in case of which also the lowest Ndye value has been found. Moreover, the highest Ndye value has been found for the TiO2_Triton X−100 device, in the case of which the highest JSC was also registered. However, the influence of another phenomenon regarding the JSC was observed in case of the two other materials, i.e., TiO2_PEG and TiO2. As the Ndye value for the former was slightly higher, the JSC is significantly lower than for the latter. This can be most likely explained by the internal recombination of the photoexcited electrons, which is more efficient in the case of the TiO2_PEG device. As the N3 dye includes –COOH anchors, the dye loading depends mainly on the number of accessible surface hydroxyl groups on the electrode material [76]. The TGA results, presented in Table 3, clearly show the differences in the concentration of surface −OH groups between the investigated materials. Surprisingly, the material with the highest −OH groups concentration is characterized by the lowest Ndye values and, in consequence, the lowest JSC. This observation can be explained, when the porosimetry (see Table 2) and XRD (see Table 1) results are compared together with −OH groups concentration. After analysis of those three groups of parameters, it can be observed that the TiO2_Pluronic P123 material exhibits the smallest crystallite sizes, which supports the more complex mesoporous structure giving the highest surface area that should support the dye loading. However, the observed pore volumes and diameters are the smallest, and therefore the surface may not be accessible for the bulky N3 dye molecules. This effect strongly affects the dye adsorption ability, which decreases independently at the highest concentration of surface −OH groups, resulting in poor performance of TiO2_Pluronic P123 photovoltaic devices [77]. The final JSC performances should be considered as a sum of both phenomena described above. The overall photon to current efficiency (η), which is the result of the photovoltaic parameters described above, represents the most variable parameter, i.e., JSC, and is in a range from 5.32 to 6.84% for TiO2_Pluronic P123 and TiO2_Triton X−100, respectively.
The electrochemical impedance spectroscopy (EIS) experiments have been performed to elucidate the properties of the investigated materials in photovoltaic applications, and the results in the form of Nyquist plots have been shown in Figure 11, while the essential parameters have been collected in Table 5. The ohmic serial resistance (R1), which is the representation of the fluorine doped tin oxide (FTO) substrate and experimental set resistance (observed as a gap between 0 and the first registered point on the Nyquist plot) [78], was similar for all the investigated devices as it should be when EIS experiment is correctly designed. Similarly, the resistance of the counter electrode (R2) values (represented as a smaller semicircle in the high-frequency region of the Nyquist plot) [78] showed only minor variations, which were expected because the counter electrodes were prepared under the same conditions for all investigated cells. The slight differences in the R2 may be explained by the fluctuation in Pt film thickness and/or existence of insignificant discontinuities in the Pt layer deposited on the counter electrode [79,80]. Considering the scope of the presented investigations, the charge transfer resistance at the TiO2/dye/electrolyte interface (RCT) (represented as a bigger semicircle in the low-frequency region on the Nyquist plot) [78] is more interesting. The RCT values corresponded very well with the JSC values described above and strongly support the above-described observations regarding the influence of internal electrons recombination process on the JSC drop of investigated cells. It is a well-known effect that the increase of RCT supports the recombination of the photoexcited electrons [81]. This typical effect is becoming more interesting when an estimated excited electron lifetime (τ) will also be taken into consideration. In this study, the lifetimes estimated for all investigated devices are equal to 12.8 ms, and no changes may be observed. This observation is supported by only minor variations of the VOC values, which strongly depend on the excited electron lifetime [82]. Such a situation suggests that the photoexcited electrons are trapped in all presented semiconducting materials with the same efficiency, and only the internal resistance influences the final performance of the photovoltaic device. It may be concluded that the electrons, after the injection from the dye into the semiconductors’ conduction band, are characterized by the same stability independently of the electrode material. However, the way of its utility (further steps of the DSSC working mechanism or recombination) is controlled only by the semiconducting layer resistance, and the higher the resistance, the higher the probability of the electron recombination.

3. Materials and Methods

3.1. Materials

Titanium(IV) chloride (97%, TiCl4; Sigma-Aldrich, St. Louis, MO, USA), polyethylene glycol (pure, PEG; Mn~400; Sigma-Aldrich, St. Louis, MO, USA), Pluronic P123 (p.a., PEG-PPG-PEG; Mn~5800, Sigma-Aldrich, St. Louis, MO, USA), Triton X−100 (pure, polyethylene glycol tert-octylphenyl ether, Sigma-Aldrich, St. Louis, MO, USA), phenol (99%, Sigma-Aldrich, St. Louis, MO, USA), etodolac (p.a., Sigma-Aldrich, St. Louis, MO, USA), ethylcellulose (p.a., Sigma-Aldrich St. Louis, MO, USA), α-terpineol (96%, Sigma-Aldrich, St. Louis, MO, USA), 1-propyl-3-methyl-imidazole iodide (97%, Sigma-Aldrich, St. Louis, MO, USA), 4-tert-butylpiridine (98%, Sigma-Aldrich, St. Louis, MO, USA), acetonitrile (LC-MS ultra-pure, Honeywell, New Jersey, USA), acetic acid (p.a., POCh, Gliwice, Poland), ammonia 25% solution (p.a., POCh, Gliwice Poland), anhydrous ethanol (99.8%, POCh, Gliwice Poland), iodine (pure, POCh, Gliwice, Poland), N3 dye (pure, Ruthenizer 535, Solaronix, Aubonne, Switzerland), H2PtCl6 (99.9% Merck, Darmstadt, Germany), guanidine thiocyanate (97%, Fluka, Buchs, Switzerland), ionomeric foil Meltonix (Solaronix, Aubonne, Switzerland), acetonitrile (p.a., Sigma-Aldrich, St. Louis, MO, USA) and potassium dihydrogen phosphate (p.a., Sigma-Aldrich, St. Louis, MO, USA) were used. All reagents were of analytical grade and used without any further purification. The water used in all experiments was deionized.

3.2. Synthesis of Titania Nanoparticles

In the typical synthesis of titania nanomaterials, 100 mL of 5% solution of TiCl4 were added to a reactor equipped with a Eurostar Digital high-speed stirrer (Ika Werke, Staufen, Germany). Next, 1 g of the surfactants was added to the titanium(IV) chloride solution. The resulting mixture was stirred at 500 rpm. Afterwards, the ammonia solution was added to the suspension to achieve pH 9. The resulting mixture was then transferred to the microwave reactor SPD 80 (CEM, Matthews, USA) and subjected to microwave treatment at 200 °C for 10 min and with power 300 W. The reactor was cooled at room temperature, the obtained materials were filtered and washed three times with deionized water and ethanol. Finally, the resulting nanomaterials were dried at 60 °C for 6 h. Samples of obtained TiO2 nanomaterials were designated TiO2 (without surfactants), TiO2_PEG, TiO2_Pluronic P123, and TiO2_Trition X−100 corresponding to the type of used surfactant.

3.3. Analysis of Materials

The surface microstructure and morphology of the titania materials were examined on the basis of SEM images recorded using a MIRA3 scanning electron microscope (TESCAN, Brno, Czech Republic).
Transmission electron microscopy (TEM) images as well as high resolution (HRTEM) were recorded by means of Hitachi HT7700 microscope (Hitachi, Tokyo, Japan) operating at an accelerating voltage of 120 kV. In order to prepare specimens, particular materials were dispersed in alcohol and then a few drops of such solutions were placed on copper grids coated with carbon.
To determine the crystalline structure of the synthesized oxide materials, the X-ray diffraction method was carried out. The analyzer Rigaku Miniflex 600 (Rigaku, Tokyo, Japan) operating with Cu Kα radiation (α = 1.5418 Å) was applied. The patterns were obtained over an angular range of 20°–80°. Parameters of crystalline structure of the samples were calculated using PDXL: Integrated X-Ray Powder Diffraction Software (Rigaku, Tokyo, Japan). The analysis was based on the International Centre for Diffraction Data (ICDD) database. For all analyzed TiO2 samples comparison to database no 9009086 was performed. The crystallite size of the titania nanomaterials in the direction vertical to the corresponding lattice plane was determined using Scherrer’s equation [40] (Equation (1)). The subtraction of the Full With at Half Maximum (FWHM) of the standard was employed as a correction method.
D = K λ β c o s θ
where: D is the size of crystallinity; K is a shape factor (0.9); λ is the X-ray wavelength (1.5418 Å); β is the line broadening at half the maximum intensity (FWHM); θ is the Bragg angle.
The parameters of the porous structure based on the low-temperature sorption of nitrogen were determined. For this purpose, a physisorption analyzer (ASAP 2020, Micromeritics Instrument Co., Norcross, USA) was used. Before measurement, all materials were degassed at 120 °C for 4 h. The surface area was determined by the multipoint BET method using adsorption data in a relative pressure (p/p0) range of 0.05–0.30. The desorption isotherm was used to determine the pore size distribution based on the Barrett, Joyner, Halenda (BJH) model.
To evaluate the light-absorption properties of titania nanomaterials, the diffuse reflectance spectra (DRS) were recorded, and the data were converted to obtain the absorption spectra. The measurements were carried out using a Thermo Scientific Evolution 220 (Thermo Scientific, Waltham, USA) spectrophotometer equipped with a PIN-757 integrating sphere. The bandgap energies of the obtained TiO2 materials were calculated based on the corresponding Kubelka–Munk function:
F ( R ) = ( 1 R ) 2 2 R
where R is reflectance, which is proportional to the absorption of radiation, by plotting:
F ( R ) 0.5 E p h 0.5
where Eph is photon energy.
Characteristic functional groups present on the surface of the TiO2 nanomaterials were identified using Fourier transform infrared spectroscopy (FTIR). The measurements were performed using a Vertex 70 spectrometer (Bruker, Bremen, Germany). The FTIR spectra were obtained in the transmission mode between 4000 cm−1 and 420 cm−1.
Thermogravimetric analysis was performed using the Jupiter STA 449 F3 apparatus (Netzsch GmbH, Selb, Germany). Measurements were performed under flowing nitrogen at a heating rate of 10 °C/min and in a temperature range of 30–1000 °C.

3.4. Photocatalytic Activity

The photoactivity of the obtained materials was tested in the oxidation reaction system using UV-Vis irradiation. The catalyst (1 g/L) was suspended in 25 ml of 20 mg/L phenol solution or 15 mg/L etodolac solution. The obtained suspension was kept in darkness for 30 min to set the adsorption/desorption equilibrium and then irradiated for 120 min (phenol) and 60 min (etodolac) using a 300 W Xenon lamp (LSH302, LOT-Quantum Design, Darmstadt, Germany). Irradiation intensity was equal to 40 mW/cm2, while the constant temperature was kept at 20 °C using a water bath. Every 10 min, 1 mL of the photocatalytic suspension was collected and filtered through a syringe filter for photocatalyst removal. The concentration of phenol, etodolac and formed intermediates was estimated using the HPLC system, equipped with the C18 chromatography column (model 00F-4435-E0, Phenomenex, USA) and a UV-Vis detector with a DAD photodiodes array (model SPD-M20A, Shimadzu, Japan). Conditions of carried tests were as presented:
Phenol, 45 °C, flow 0.3 mL/min, mobile phase composition: 70% acetonitrile, 29.5% water, 0.5% orthophosphoric acid (v/v).
Etodolac, 45 °C, flow 1.0 mL/min, mobile phase composition: 50% acetonitrile, 50% 0.1 M KH2PO4 solution (v/v).

3.5. Photovoltaic Properties

3.5.1. Preparation of DSSC

A TiO2 paste was prepared using an already described method [83], according to the following procedure: 1.2 g of the material (TiO2_TritonX−100, TiO2_Pluronic P123, TiO2_PEG or reference TiO2) was mixed with 0.21 mL of acetic acid and 8.35 mL of ethanol, and kept in an ultrasonic bath for 3 h. A solution containing 625 mg of ethylcellulose and 4.17 g of α-terpineol in 5.625 g of ethanol was prepared and then added to the former suspension. The mixture was sonicated for 1 h and then magnetically stirred overnight. Ethanol was slowly removed using a rotary evaporator and the obtained paste was ready-to-use. TiO2 films were deposited by the doctor blade technique on FTO (3D-nano, Poland) substrate using a scotch tape mask of 62.5 µm thickness. Finally, the electrodes were calcined in an oven at 450 °C for 2 h. After cooling down, the working electrodes were immersed in 40 mM TiCl4 aqueous solution and kept at 70 °C for 1 h followed by washing with deionized water and ethanol, dried in a hot air stream and calcined in the oven at 450 °C for 30 min. After cooling down, the electrodes were immersed in a 10−4 M solution of N3 dye in anhydrous ethanol and kept in the dark at room temperature overnight. After dye adsorption, the electrodes were washed with absolute ethanol and dried in a hot air stream. Platinum-coated FTO (an ethanolic solution of H2PtCl6 containing 23 g/L Pt was spread on the FTO substrate using cellulose tissue, dried and calcined in the oven at 450 °C for 30 min) was used as a counter electrode [84]. A typical cell was assembled using a 25 μm thick, hot melted ionomeric foil Meltonix as a sealant and a spacer between the electrodes. The electrolyte contained 0.6 M of 1-propyl-3-methyl-imidazolium iodide, 0.03 M of iodine, 0.1 M of guanidine thiocyanate and 0.5 M of 4-tert-butylpiridine in acetonitrile. The electrolyte was injected within two holes, predrilled in the counter electrode. The final sealing was realized with the use of a hot melted sealant and a microscope cover slide. The typical active area of the obtained DSSC was equal to approximately 0.125 cm2. Five cells representing each type were prepared, and the results obtained for those with the best performance, according to the η value, are presented in the paper, and full results for all series of the cells are collected in Table A1 and Table A2 in Appendix A.

3.5.2. Dye Loading Determination

To estimate the amount of adsorbed dye on the working electrodes (TiO2_Triton X−100, TiO2_Pluronic P123, TiO2_PEG or reference TiO2) surface, the TiO2-coated (approximately surface area of TiO2 layer was 1.5 cm2) FTO glass substrates were immersed in 10−4 M N3 dye solution, in anhydrous ethanol and left overnight in the dark at room temperature. Afterwards, the FTO substrates were washed with absolute ethanol and dried in air. The particular TiO2-coated substrates were immersed in 5 mL of 1.5 M ammonia solution in ethanol for 30 min. Subsequently, UV-Vis spectra of the solution of the desorbed dyes were recorded. The absorbances of desorbed dye were compared with the calibration curve obtained for a different concentration of N3 dye.

3.5.3. Characteristics of Obtained DSSC’s

The photovoltaic properties of the cells were measured under irradiation using a Sun 2000 class A solar simulator (ABET Technologies, Milford, USA) equipped with an AM 1.5G filter, with the light intensity adjusted to 100 mW/cm2 using a silicon reference cell equipped with a KG5 filter (ReRa Systems, Netherlands). J-V curves were recorded using a Gamry Interface 1000 Potentiostat/Galvanostat/ZRA (Gamry Instruments, Warminster, USA).
Electrochemical impedance spectra were recorded under standard AM 1.5G simulated solar irradiation, using the Sun 2000 class A solar simulator (ABET, Milford, Technologies, USA). The frequency was measured using a Gamry Interface 1000 Potentiostat/Galvanostat/ZRA (Gamry Instruments, Warminster, USA), in the range from 0.1 Hz to 100 kHz, under VOC forward bias conditions, and with VAC=10 mV.

4. Conclusions

First of all, the primary goal of this research was to apply the surfactants-assisted microwave synthesis to obtain titanium dioxide. For this purpose, nonionic surfactants such as polyethylene glycol, Triton X−100 and Pluronic P123 have been selected. It has been shown that the well-formed anatase phase was formed for all synthesized TiO2 samples. Furthermore, an important observation is that the addition of surfactant impacts the average crystallite size. In the case of polyethylene glycol and Triton X−100, an improvement of crystallinity was observed, whereas modification of titania with Pluronic P123 causes the deterioration of crystallinity. Another important issue is the influence of the proposed synthesis method on the shape of resultant particles. The presence of the cubic and octahedral-like particles has been confirmed by electron microscopy. Furthermore, it should be noted that the physicochemical properties, such as parameters of the porous structure or thermal stability as well as content of hydroxyl groups of the TiO2 materials, are strongly influenced by the surfactants used for their preparation.
The key point of the conducted research was to analyze the photocatalytic properties of synthesized nanomaterials. The photodegradation experiments (in the UV light range) were carried out in the presence of phenol and etodolac as model organic pollutants. The high crystallinity and the cubic shape of particles (considering the use of surfactants such as PEG and Triton X−100 in the synthesis) play an important role in the improvement of photocatalytic activity in comparison to commercially available titania (P25). The presented materials have also exhibited satisfactory properties when used as semiconducting layers in DSSCs. The best photovoltaic parameters have been found in the case of the TiO2_Triton X−100 material, which was characterized by the optimal ratio between the surface –OH groups concentration, crystallite size, and mesoporous parameters. The combination of the features mentioned above leads to optimal dye loading on the electrode surface, which supports the high photocurrent density. This, in combination with the lowest internal resistance observed, results in the best photovoltaic performance. In summary, the results show that the synthesized titanium dioxide materials are promising materials for both photocatalytic and photovoltaic applications.

Author Contributions

A.K., research concept, characterization of materials; Z.B. and A.Z.-J., determination of photocatalytic activity; A.B. and M.Z., determination of photovoltaic properties and interpretation of results; E.G., HR-TEM analysis; A.P., SEM analysis; M.J., interpretation of results of photocatalytic activity; K.S.-C., BET analysis; K.S.-C. and T.J., critical revision and supervision of all aspects of the research. All authors have read and agreed to the published version of the manuscript.

Funding

This research was funded by Ministry of Science and Higher Education Poland as subsidy to Poznan University of Technology (grant no. 0912/SBAD/2006).

Acknowledgments

A.B., during this work, was supported by grant no. POWR.03.02.00-00-I023/17 co-financed by the European Union through the European Social Fund under the Operational Program Knowledge Education Development.

Conflicts of Interest

The authors declare no conflict of interest.

Appendix A

Table A1. Photovoltaic parameters of all series of investigated solar cells. Highlighted results have also been presented in the main text (see Table 4).
SampleJSC (mA/cm2)VOC (mV)FF (%)η (%)
TiO2_110.373472.25.45
TiO2_211.473670.55.93
TiO2_312.072970.36.16
TiO2_411.475071.36.11
TiO2_512.371171.46.15
TiO2_PEG_110.971070.55.46
TiO2_PEG_210.172672.35.30
TiO2_PEG_39.969072.04.88
TiO2_PEG_410.073972.15.35
TiO2_PEG_510.072971.25.20
TiO2_Pluronic P123_110.372671.35.32
TiO2_Pluronic P123_29.873271.05.10
TiO2_Pluronic P123_39.972969.92.76
TiO2_Pluronic P123_49.570970.14.71
TiO2_Pluronic P123_59.071871.94.65
TiO2_Triton X−100_113.573469.16.84
TiO2_Triton X−100_212.970468.16.71
TiO2_Triton X−100_312.968067.06.20
TiO2_Triton X−100_412.769868.66.64
TiO2_Triton X−100_512.971468.66.78
Table A2. Electrochemical impedance parameters and electron lifetimes of all series of investigated cells. Highlighted results have also been presented in the main text (see Table 5).
SampleR1 (Ω)R2 (Ω)RCT (Ω)τ (ms)
TiO2_117.311.743.212.8
TiO2_220.28.942.812.8
TiO2_319.27.336.812.8
TiO2_422.58.940.012.8
TiO2_516.68.640.312.8
TiO2_PEG_118.09.139.012.8
TiO2_PEG_218.010.544.812.8
TiO2_PEG_317.910.432.910.2
TiO2_PEG_417.89.534.712.8
TiO2_PEG_518.08.236.410.2
TiO2_Pluronic P123_119.97.840.012.8
TiO2_Pluronic P123_222.26.642.516.0
TiO2_Pluronic P123_323.65.767.612.8
TiO2_Pluronic P123_432.07.144.212.8
TiO2_Pluronic P123_520.16.647.312.8
TiO2_Triton X−100_123.49.633.812.8
TiO2_Triton X−100_217.69.827.612.8
TiO2_Triton X−100_324.97.227.412.8
TiO2_Triton X−100_418.28.427.412.8
TiO2_Triton X−100_519.07.624.916.0

References

  1. Rockström, J.; Steffen, W.; Noone, K.; Persson, A.; Chapin, F.S.; Lambin, E.F.; Lenton, T.M.; Scheffer, M.; Folke, C.; Schellnhuber, H.J.; et al. A safe operation space for humanity. Nature 2009, 461, 472–475. [Google Scholar] [CrossRef] [PubMed]
  2. Gust, D.; Moore, T.A.; Moore, A.L. Solar fuels via artificial photosynthesis. Acc. Chem. Res. 2009, 42, 1890–1898. [Google Scholar] [CrossRef] [PubMed]
  3. Canadell, J.G.; Le Quéré, C.; Raupach, M.R.; Field, C.B.; Buitenhuis, E.T.; Ciais, P.; Conway, T.J.; Gillett, N.P.; Houghton, R.A.; Marland, G. Contributions to accelerating atmospheric CO2 growth from economic activity, carbon intensity, and efficiency of natural sinks. Proc. Natl. Acad. Sci. USA 2007, 104, 18866–18870. [Google Scholar] [CrossRef] [PubMed] [Green Version]
  4. Tan, Z.K.; Moghaddam, R.S.; Lai, M.L.; Docampo, P.; Higler, R.; Deschler, F.; Price, M.; Sadhanala, A.; Pazos, L.M.; Credgington, D.; et al. Bright light-emitting diodes based on organometal halide perovskite. Nat. Nanotechnol. 2014, 9, 687–692. [Google Scholar] [CrossRef]
  5. Chen, X.; Liu, L.; Yu, P.Y.; Mao, S.S. Increasing solar absorption for photocatalysis with black hydrogenated titanium dioxide nanocrystals. Science 2011, 331, 746–750. [Google Scholar] [CrossRef]
  6. Wadhwa, S.; Mathur, A.; Pendurthi, R.; Singhal, U.; Khanuja, M.; Roy, S.S. Titania-based porous nanocomposites for potential environmental applications. Bull. Mater. Sci. 2020, 43, 47. [Google Scholar] [CrossRef]
  7. Bai, F.Q.; Li, W.; Zhang, H.X. Theoretical studies of titanium dioxide for dye-sensitized solar cell and photocatalytic reaction. In Titananium Dioxide; Janus, M., Ed.; InterOpen: London, UK, 2017; pp. 229–248. [Google Scholar] [CrossRef] [Green Version]
  8. Ohtani, B. Photocatalysis A to Z-What we know and what we do not know in a scientific sense. J. Photochem. Photobiol. C Photochem. Rev. 2010, 11, 157–178. [Google Scholar] [CrossRef] [Green Version]
  9. Ohtani, B. Titania photocatalysis beyond recombination: A critical review. Catalysts 2013, 3, 942–953. [Google Scholar] [CrossRef] [Green Version]
  10. Ola, O.; Maroto-Valer, M.M. Review of material design and reactor engineering on TiO2 photocatalysis for CO2 reduction. J. Photochem. Photobiol. C Photochem. Rev. 2015, 24, 16–42. [Google Scholar] [CrossRef] [Green Version]
  11. Lodgejr, J. WHO regional publication, air quality guidelines for Europe. Environ. Sci. Pollut. Res. 1996, 23. [Google Scholar] [CrossRef]
  12. World Health Organization Regional Office for Europe Copenhagen. Air Quality Guidelines for Europe, 2nd ed.; WHO: Geneva, Switzerland, 2000; Volume 35, pp. 812–815. [Google Scholar]
  13. Fleischer, N.L.; Merialdi, M.; van Donkelaar, A.; Vadillo-Ortega, F.; Martin, R.V.; Betran, A.P.; Souza, J.P.; O’Neill, M.S. Outdoor air pollution, preterm birth, and low birth weight: Analysis of the world health organization global survey on maternal and perinatal health. Environ. Health Perspect. 2014, 122, 425–430. [Google Scholar] [CrossRef] [PubMed]
  14. Hüsken, G.; Hunger, M.; Brouwers, H.J.H. Experimental study of photocatalytic concrete products for air purification. Build. Environ. 2009, 44, 2463–2474. [Google Scholar] [CrossRef]
  15. Olmo, N.R.S.; Saldiva, P.H.N.; Braga, A.L.F.; Lin, C.A.; Santos, U.P.; Pereirai, L.A.A. A review of low-level air pollution and adverse effects on human health: Implications for epidemiological studies and public policy. Clinics 2011, 66, 681–690. [Google Scholar] [CrossRef] [PubMed] [Green Version]
  16. European Union. European council directive 1999/30/EC of 22 April 1999 relating to limit values for sulphur dioxide, nitrogen dioxide and oxides of nitrogen, particulate matter and lead in ambient air C directive. Off. J. Eur. Commun. 1999, 41–60. [Google Scholar]
  17. Olivier, J.G.J.; Peters, J.A.H.W. Trends in Global CO2 and Total Greenhouse Gas Emissions; 2019 Report; Netherlands Environmental Assessment Agency: Hague, The Netherlands, 2012; pp. 12–28. [Google Scholar]
  18. Gautam, D.; Bolia, N.B. Air pollution: Impact and interventions. Air Qual. Atmos. Health 2020, 13, 209–223. [Google Scholar] [CrossRef]
  19. Ni, M.; Leung, M.K.H.; Leung, D.Y.C.; Sumathy, K. A review and recent developments in photocatalytic water-splitting using TiO2 for hydrogen production. Renew. Sustain. Energy Rev. 2007, 11, 401–425. [Google Scholar] [CrossRef]
  20. Leong, S.; Razmjou, A.; Wang, K.; Hapgood, K.; Zhang, X.; Wang, H. TiO2 based photocatalytic membranes: A review. J. Memb. Sci. 2014, 472, 167–184. [Google Scholar] [CrossRef]
  21. Zhao, J.; Yang, X. Photocatalytic oxidation for indoor air purification: A literature review. Build. Environ. 2003, 38, 645–654. [Google Scholar] [CrossRef]
  22. Ohko, Y.; Utsumi, Y.; Niwa, C.; Tatsuma, T.; Kobayakawa, K.; Satoh, Y.; Kubota, Y.; Fujishima, A. Self-sterilizing and self-cleaning of silicone catheters coated with TiO2 photocatalyst thin films: A preclinical work. J. Biomed. Mater. Res. 2001, 58, 97–101. [Google Scholar] [CrossRef]
  23. Sarkar, J.; Bhattacharyya, S. Status and outlook of sensitizers/dyes used in dye sensitized solar cells (DSSC): A review. Int. J. Energy Res. 2012, 33, 23–40. [Google Scholar] [CrossRef]
  24. Shakeel, A.M.; Pandey, A.K.; Abd-Rahim, N. Advancements in the development of TiO2 photoanodes and its fabrication methods for dye sensitized solar cell (DSSC) applications. A review. Renew. Sustain. Energy Rev. 2017, 77, 89–108. [Google Scholar] [CrossRef]
  25. Green, M.A. Thin-film solar cells: Review of materials, technologies and commercial status. J. Mater. Sci. Mater. Electron. 2007, 18, 15–19. [Google Scholar] [CrossRef]
  26. Vittal, R.; Ho, K.C. Zinc oxide based dye-sensitized solar cells: A review. Renew. Sustain. Energy Rev. 2017, 70, 920–935. [Google Scholar] [CrossRef]
  27. Prabavathy, N.; Shalini, S.; Balasundaraprabhu, R.; Velauthapillai, D.; Prasanna, S.; Muthukumarasamy, N. Enhancement in the photostability of natural dyes for dye-sensitized solar cell (DSSC) applications: A review. Int. J. Energy Res. 2017, 41, 1372–1396. [Google Scholar] [CrossRef]
  28. Kumara, N.T.R.N.; Lim, A.; Lim, C.M.; Petra, M.I.; Ekanayake, P. Recent progress and utilization of natural pigments in dye sensitized solar cells: A review. Renew. Sustain. Energy Rev. 2017, 78, 301–317. [Google Scholar] [CrossRef]
  29. Zhang, Y.Q.; Ma, D.K.; Zhang, Y.G.; Chen, W.; Huang, S.M. N-doped carbon quantum dots for TiO2-based photocatalysts and dye-sensitized solar cells. Nano Energy 2013, 2, 545–552. [Google Scholar] [CrossRef]
  30. Xu, J.; Ao, Y.; Fu, D.; Yuan, C. Low-temperature preparation of F-doped TiO2 film and its photocatalytic activity under solar light. Appl. Surf. Sci. 2008, 254, 3033–3038. [Google Scholar] [CrossRef]
  31. Zhang, X.; Thavasi, V.; Mhaisalkar, S.G.; Ramakrishna, S. Novel hollow mesoporous 1D TiO2 nanofibers as photovoltaic and photocatalytic materials. Nanoscale 2012, 4, 1707–1716. [Google Scholar] [CrossRef]
  32. Yang, R.; Cai, J.; Lv, K.; Wu, X.; Wang, W.; Xu, Z.; Li, M.; Li, Q.; Xu, W. Fabrication of TiO2 hollow microspheres assembly from nanosheets (TiO2-HMSs-NSs) with enhanced photoelectric conversion efficiency in DSSCs and photocatalytic activity. Appl. Catal. B Environ. 2017, 210, 184–193. [Google Scholar] [CrossRef]
  33. Canevali, C.; Polizzi, S.; Testino, A.; Bellobono, I.R.; Buscaglia, V. Optimizing the photocatalytic properties of hydrothermal TiO2 by the control of phase composition and particle morphology. A systematic approach. J. Am. Chem. Soc. 2007, 129, 3564–3575. [Google Scholar] [CrossRef]
  34. Nam, W.S.; Han, G.Y. A photocatalytic performance of TiO2 photocatalyst prepared by the hydrothermal method. Korean J. Chem. Eng. 2003, 20, 180–184. [Google Scholar] [CrossRef]
  35. Kolahalam, L.A.; Kasi Viswanath, I.V.; Diwakar, B.S.; Govindh, B.; Reddy, V.; Murthy, Y.L.N. Review on nanomaterials: Synthesis and applications. Mater. Today Proc. 2019, 18, 2182–2190. [Google Scholar] [CrossRef]
  36. Yu, H.; Wang, J.; Yan, X.; Wang, J.; Cheng, P.; Xia, C.J. Effect of surfactants on the morphology and photocatocatalytic properties of ZnO nanostructures. Optik 2019, 185, 990–996. [Google Scholar] [CrossRef]
  37. Zielińska-Jurek, A.; Wei, Z.; Janczarek, M.; Wysocka, I.; Kowalska, E. Size-controlled synthesis of Pt particles on TiO2 surface: Physicochemical characteristic and photocatalytic activity. Catalysts 2019, 8, 940. [Google Scholar] [CrossRef] [Green Version]
  38. Janczarek, M.; Kowalska, E. On the origin of enhanced photocatalytic activity of copper-modified titania in the oxidative reaction systems. Catalysts 2017, 7, 317. [Google Scholar] [CrossRef] [Green Version]
  39. Hu, J.; Li, H.; Muhammad, S.; Wu, Q.; Zhao, Y.; Jiao, Q. Surfactant-assisted hydrothermal synthesis of TiO2/reduced graphene oxide nanocomposites and their photocatalytic performances. J. Solid State Chem. 2017, 253, 113–120. [Google Scholar] [CrossRef]
  40. Haider, A.J.; Jameel, Z.N.; Al-Hussaini, I.H.M. Review on: Titanium dioxide applications. Energy Proc. 2019, 157, 17–29. [Google Scholar] [CrossRef]
  41. Noman, M.T.; Ashraf, M.A.; Ali, A. Synthesis and applications of nano-TiO2: A review. Environ. Sci. Pollut. Res. 2019, 26, 3262–3291. [Google Scholar] [CrossRef]
  42. Wang, F.; Shi, Z.; Gong, F.; Jiu, J.; Adachi, M. Morphology control of anatase TiO2 by surfactant-assisted hydrothermal method. Chin. J. Chem. Eng. 2007, 15, 754–759. [Google Scholar] [CrossRef]
  43. Galkina, O.L.; Vinogradov, V.V.; Agafonov, A.V.; Vinogradov, A.V. Surfactant-assisted sol-gel synthesis of TiO2 with uniform particle size distribution. Int. J. Inorg. Chem. 2011, 2011, 1–8. [Google Scholar] [CrossRef] [Green Version]
  44. Chan, C.; Chang, C.; Hsu, W.; Wang, S.; Lin, J. Photocatalytic activities of Pd-loaded mesoporous TiO2 thin films. Chem. Eng. J. 2009, 152, 492–497. [Google Scholar] [CrossRef]
  45. Yuenyongsuwan, J.; Nithiyakorn, N.; Sabkird, P.; O’Rear, E.A.; Pongprayoon, T. Surfactant effect on phase-controlled synthesis and photocatalyst property of TiO2 nanoparticles. Mater. Chem. Phys. 2018, 214, 330–336. [Google Scholar] [CrossRef]
  46. Jun, Y.W.; Casula, M.F.; Sim, J.H.; Kim, S.Y.; Cheon, J.; Alivisatos, A.P. Surfactant-assisted elimination of a high energy facet as a means of controlling the shapes of TiO2 nanocrystals. J. Am. Chem. Soc. 2003, 125, 15981–15985. [Google Scholar] [CrossRef] [PubMed]
  47. Jang, I.; Leong, H.J.; Oh, S.G. Effects of surfactants on the preparation of TiO2 nanoparticles in microwave-assisted sol-gel process and their photocatalytic activity. Korean J. Chem. Eng. 2016, 33, 1647–1652. [Google Scholar] [CrossRef]
  48. Yener, H.B.; Şarkaya, S.; Helvacı, Ş.Ş. Nano-sized TiO2 synthesis in triton X-100 reverse micelles. In Trends in Colloid and Interface Science XXIII. Progress in Colloid and Polymer Science; Springer: Berlin, Germany, 2010; Volume 137. [Google Scholar] [CrossRef]
  49. Sing, K.S.W.; Everett, D.H.; Haul, R.A.W.; Moscou, L.; Pierotti, R.S.; Rouquerol, J.; Siemieniewska, T. Reporting physisorption data for gas/solid systems with special reference to the determination of surface area and porosity. Pure Appl. Chem. 1985, 57, 603–619. [Google Scholar] [CrossRef]
  50. Abdolahi-Sadatlu, M.A.; Mozaffari, N. Synthesis of mesoporous TiO2 structures through P123 copolymer as the structural directing agent and assessment of their performance in dye-sensitized solar cells. Sol. Energy 2016, 133, 24–34. [Google Scholar] [CrossRef]
  51. Liu, J.; An, T.; Li, G.; Bao, N.; Sheng, G.; Fu, J. Preparation and characterization of highly active mesoporous TiO2 photocatalysts by hydrothermal synthesis under weak acid conditions. Micropor. Mesopor. Mater. 2009, 124, 197–203. [Google Scholar] [CrossRef]
  52. Rathouský, J.; Slabová, M.; Macounová, K.; Zukal, A. Organized mesoporous titanium dioxide—A powerful photocatalyst for the removal of water pollutants. Stud. Surf. Sci. Catal. 2002, 141, 599–606. [Google Scholar] [CrossRef]
  53. Guo, W.; Li, H.; Ma, H.; Teng, W. Different surfactants-assisted hydrothermal fabrication and photocatalytic properties of Bi2MoO6 for methylene blue degradation under simulated sunlight irradiation. J. Chem. 2014, 2014, 2–7. [Google Scholar] [CrossRef] [Green Version]
  54. Suthakaran, S.; Dhanapandian, S.; Krishnakumar, N.; Ponpandian, N. Surfactants assisted SnO2 nanoparticles synthesized by a hydrothermal approach and potential applications in water purification and energy conversion. J. Mater. Sci. Mater. Electron. 2019, 30, 13174–13190. [Google Scholar] [CrossRef]
  55. Chen, X.; Mao, S.S. Titanium dioxide nanomaterials: Synthesis, properties, modifications and applications. Chem. Rev. 2007, 107, 2891–2959. [Google Scholar] [CrossRef] [PubMed]
  56. Pigłowska, M.; Kurc, B.; Rymaniak, Ł.; Lijewski, P.; Fuć, P. Kinetics and thermodynamics of thermal degradation of different starches and estimation the OH group and H2O content on the surface by TG/DTG-DTA. Polymers 2020, 12, 357. [Google Scholar] [CrossRef] [PubMed] [Green Version]
  57. Wu, C.Y.; Tu, K.J.; Deng, J.P.; Lo, Y.S.; Wu, C.H. Markedly enhanced surface hydroxyl groups of TiO2 nanoparticles with superior water-dispersibility for photocatalysis. Materials 2017, 10, 566. [Google Scholar] [CrossRef] [PubMed]
  58. Yu, J.; Zhao, X.; Zhao, Q.; Wang, G. Preparation and characterization of super-hydrophilic porous TiO2 coating films. Mater. Chem. Phys. 2001, 68, 253–259. [Google Scholar] [CrossRef]
  59. World Health Organization; International Labour Organization; United Nations Environment Programme. Phenol Health and Safety Guide; WHO Environmental Health Criteria: Geneva, Switzerland, 1994; Volume 161, pp. 151–185. [Google Scholar]
  60. Znaidi, L.; Séraphimova, R.; Bocquet, J.F.; Colbeau-Justin, C.; Pommier, C. A semi-continuous process for the synthesis of nanosize TiO2 powders and their use as photocatalysts. Mater. Res. Bull. 2001, 36, 811–825. [Google Scholar] [CrossRef]
  61. Di Paola, A.; Bellardita, M.; Palmisano, L.; Barbieriková, Z.; Brezová, V. Influence of crystallinity and OH surface density on the photocatalytic activity of TiO2 powders. J. Photochem. Photobiol. A Chem. 2014, 273, 59–67. [Google Scholar] [CrossRef]
  62. Liu, L.; Liu, H.; Zhao, Y.P.; Wang, Y.; Duan, Y.; Gao, G.; Ge, M.; Chen, W. Directed synthesis of hierarchical nanostructured TiO2 catalysts and their morphology-dependent photocatalysis for phenol degradation. Environ. Sci. Technol. 2008, 42, 2342–2348. [Google Scholar] [CrossRef]
  63. Gadade, D.D.; Pekamwar, S.S.; Lahoti, S.R.; Patni, S.D.; Sarode, M.C. Cocrystallization of etodolac: Prediction of cocrystallization, synthesis, solid state characterization and in vitro drug release. Marmara Pharm. J. 2016, 21, 78–88. [Google Scholar] [CrossRef] [Green Version]
  64. Saxena, D.; Damale, S.; Datar, A. Investigation of forced degradation products of etodolac by LC and LC-MS/MS. Int. J. Pharm. Pharm. Sci. 2016, 8, 127–135. [Google Scholar]
  65. Mrotek, E.; Dudziak, S.; Malinowska, I.; Pelczarski, D.; Ryżyńska, Z.; Zielińska-Jurek, A. Improved degradation of etodolac in the presence of core-shell ZnFe2O4/SiO2/TiO2 magnetic photocatalyst. Sci. Total Environ. 2020, 724, 138167. [Google Scholar] [CrossRef]
  66. Li, H.; Zeng, Y.; Huang, T.; Piao, L.; Yan, Z.; Liu, M. Hierarchical TiO2 nanospheres with dominant {001} facets: Facile synthesis, growth mechanism, and photocatalytic activity. Chem. Eur. J. 2012, 18, 7525–7532. [Google Scholar] [CrossRef] [PubMed]
  67. Wu, L.; Yu, J.C.; Fu, X. Characterization and photocatalytic mechanism of nanosized CdS coupled TiO2 nanocrystals under visible light irradiation. J. Mol. Catal. Chem. 2006, 244, 25–32. [Google Scholar] [CrossRef]
  68. Augugliaro, V.; Coluccia, S.; Loddo, V.; Marchese, L.; Martra, G.; Palmisano, L.; Schiavello, M. Photocatalytic oxidation of gaseous toluene on anatase TiO2 catalyst: Mechanistic aspects and FT-IR investigation. Appl. Catal. B Environ. 1999, 20, 15–27. [Google Scholar] [CrossRef]
  69. Busca, G.; Berardinelli, S.; Resini, C.; Arrighi, L. Technologies for the removal of phenol from fluid streams: A short review of recent developments. J. Hazard. Mater. 2008, 160, 265–288. [Google Scholar] [CrossRef] [PubMed]
  70. Atitar, M.F.; Ismail, A.A.; Dillert, R.; Bahnemann, D.W. Photodegradation of herbicide imazapyr and phenol over mesoporous bicrystalline phases TiO2: A kinetic study. Catalysts 2019, 9, 640. [Google Scholar] [CrossRef] [Green Version]
  71. Colón, G.; Hidalgo, M.C.; Navío, J.A. Photocatalytic behaviour of sulphated TiO2 for phenol degradation. Appl. Catal. B Environ. 2003, 45, 39–50. [Google Scholar] [CrossRef]
  72. Ahmed, S.; Rasul, M.G.; Martens, W.N.; Brown, R.; Hashib, M.A. Heterogeneous photocatalytic degradation of phenols in wastewater: A review on current status and developments. Desalination 2010, 261, 3–18. [Google Scholar] [CrossRef] [Green Version]
  73. Hadj-Salah, N.; Bouhelassa, M.; Bekkouche, S.; Boultif, A. Study of photocatalytic degradation of phenol. Desalination 2004, 166, 347–354. [Google Scholar] [CrossRef]
  74. Neves, M.C.; Nogueira, J.M.F.; Trindade, T.; Mendonça, M.H.; Pereira, M.I.; Monteiro, O.C. Photosensitization of TiO2 by Ag2S and its catalytic activity on phenol photodegradation. J. Photochem. Photobiol. A Chem. 2009, 204, 168–173. [Google Scholar] [CrossRef]
  75. Hagfeldt, A.; Boschloo, G.; Sun, L.; Kloo, L.; Pettersson, H. Dye-sensitized solar cells. Chem. Rev. 2010, 110, 6595–6663. [Google Scholar] [CrossRef]
  76. Subramanian, A.; Wang, H.W. Effect of hydroxyl group attachment on TiO2 films for dye-sensitized solar cells. Appl. Surf. Sci. 2012, 258, 7833–7838. [Google Scholar] [CrossRef]
  77. Jalali, M.; Moakhar, R.S.; Kushwaha, A.; Goh, G.K.L.; Sadrnezhaad, S.K.; Riahi-Noori, N. TiO2 surface nanostructuring for improved dye loading and light scattering in double-layered screen-printed dye-sensitized solar cells. J. Appl. Electrochem. 2015, 45, 831–838. [Google Scholar] [CrossRef]
  78. Sarker, S.; Ahammad, A.J.S.; Seo, H.W.; Kim, D.M. Electrochemical impedance spectra of dye-sensitized solar cells: Fundamentals and spreadsheet calculation. Int. J. Photoenergy 2014, 2014. [Google Scholar] [CrossRef] [Green Version]
  79. Adachi, M.; Sakamoto, M.; Jiu, J.; Ogata, Y.; Isoda, S. Determination of parameters of electron transport in dye-sensitized solar cells using electrochemical impedance spectroscopy. J. Phys. Chem. B 2006, 110, 13872–13880. [Google Scholar] [CrossRef] [PubMed]
  80. Jiang, W.; Yin, L.; Liu, H.; Ding, Y. Nanograss-structured counter electrode for dye-sensitized solar cells. J. Power Sources 2012, 218, 405–411. [Google Scholar] [CrossRef]
  81. Fakharuddin, A.; Ahmed, I.; Khalidin, Z.; Yusoff, M.M.; Jose, R. Charge transport through split photoelectrodes in dye-sensitized solar cells. J. Appl. Phys. 2014, 115, 164509. [Google Scholar] [CrossRef]
  82. Mozer, A.J.; Wagner, P.; Officer, D.L.; Wallace, G.G.; Campbell, W.M.; Miyashita, M.; Sunahara, K.; Mori, S. The origin of open circuit voltage of porphyrin-sensitised TiO2 solar cells. Chem. Commun. 2008, 4741–4743. [Google Scholar] [CrossRef] [PubMed]
  83. Randazzo, B.; Chemello, G.; Tortarolo, I.; Chiarello, G.L.; Zalas, M.; Santini, A.; Liberatore, M.; Liberatore, M.; Selli, E.; Olivotto, I. A novel photocatalytic purification system for fish culture. Zebrafish 2017, 14, 411–421. [Google Scholar] [CrossRef]
  84. Zalas, M.; Jelak, K. Optimization of platinum precursor concentration for new, fast and simple fabrication method of counter electrode for DSSC application. Optik 2020, 206, 164314. [Google Scholar] [CrossRef]
Figure 1. The number of scientific articles in the Scopus database for the keywords: photocatalysis, photovoltaics, and environmental protection.
Catalysts 10 00586 g001
Figure 2. The SEM images of: (a) TiO2; (b) TiO2_PEG; (c) TiO2_Pluronic P123 and (d) TiO2_Triton X−100.
Catalysts 10 00586 g002
Figure 3. The TEM and HRTEM results of: (a) TiO2; (b) TiO2_PEG; (c) TiO2_Pluronic P123 and (d) TiO2_Triton X−100.
Catalysts 10 00586 g003
Figure 4. The results of XRD analysis for synthesized titania nanomaterials.
Catalysts 10 00586 g004
Figure 5. The N2 adsorption/desorption isotherms of obtained nanomaterials.
Catalysts 10 00586 g005
Figure 6. The diffuse reflectance spectra of the analyzed titanium dioxide nanomaterials.
Catalysts 10 00586 g006
Figure 7. The results of FTIR analysis for synthesized titania nanomaterials.
Catalysts 10 00586 g007
Figure 8. The TGA curves for obtained TiO2 materials.
Catalysts 10 00586 g008
Figure 9. The efficiency of photocatalytic degradation of (a) phenol and (b) etodolac.
Catalysts 10 00586 g009
Figure 10. I-V characteristics of the investigated dye-sensitized solar cells (DSSC) devices.
Catalysts 10 00586 g010
Figure 11. Nyquist plots of impedance spectra of DSSC devices based on investigated materials.
Catalysts 10 00586 g011
Table 1. The average crystallite size and anatase crystalline phase for TiO2 and modified titanium dioxide nanoparticles.
SampleCrystallite Size (nm)Crystalline Phase of Anatase (%)
TiO215.2 (±0.1)100
TiO2_PEG16.9 (±0.3)
TiO2_Pluronic P1239.8 (±0.1)
TiO2_Triton X−10017.4 (±0.2)
Table 2. The parameters of the porous structure for obtained TiO2 nanomaterials.
SampleABET (m2/g)Vp (cm3/g)Sp (nm)
TiO21180.358.6
TiO2_PEG1280.318.7
TiO2_Pluronic P1232000.215.1
TiO2_Triton X−1001380.287.9
Table 3. The results of TGA and hydroxyl group content for TiO2 samples.
SampleTGA (%)nOH (mmol/g TiO2)
TiO24.530.49
TiO2_PEG5.010.58
TiO2_Pluronic P12310.671.21
TiO2_Triton X−1005.570.70
Table 4. Photovoltaic parameters of investigated solar cells and the amounts of dye adsorbed on the working electrodes.
SampleJsc (mA/cm2)Voc (mV)FF (%)η (%)Ndye (10−8 mol/cm2)
TiO212.072970.36.163.31
TiO2_PEG10.971070.55.463.34
TiO2_Pluronic P12310.372671.35.322.39
TiO2_Triton X−10013.573469.16.843.41
Table 5. Electrochemical impedance parameters and electron lifetimes of investigated cells.
SampleR1 (Ω)R2 (Ω)RCT (Ω)τ (ms)
TiO219.27.336.812.8
TiO2_PEG18.09.139.012.8
TiO2_Pluronic P12319.97.840.012.8
TiO2_Triton_X−10023.49.633.812.8

