Article

Interaction of SO2 with the Platinum (001), (011), and (111) Surfaces: A DFT Study

by
Marietjie J. Ungerer
1,2,
David Santos-Carballal
2,3,
Abdelaziz Cadi-Essadek
2,
Cornelia G. C. E. van Sittert
1,* and
Nora H. de Leeuw
2,3,4,*
1
Laboratory for Applied Molecular Modelling, Research Focus Area: Chemical Resource Beneficiation, North-West University, Private Bag X6001, Potchefstroom 2520, South Africa
2
School of Chemistry, Cardiff University, Main Building, Park Place, Cardiff CF10 3AT, UK
3
School of Chemistry, University of Leeds, Woodhouse Lane, Leeds LS2 9JT, UK
4
Department of Earth Sciences, Utrecht University, Princetonplein 8A, 3584 CD Utrecht, The Netherlands
*
Authors to whom correspondence should be addressed.
Catalysts 2020, 10(5), 558; https://doi.org/10.3390/catal10050558
Submission received: 5 March 2020 / Revised: 13 April 2020 / Accepted: 18 April 2020 / Published: 18 May 2020
(This article belongs to the Special Issue Surface Chemistry in Catalysis)

Abstract

:
Given the importance of SO2 as a pollutant species in the environment and its role in the hybrid sulphur (HyS) cycle for hydrogen production, we carried out a density functional theory study of its interaction with the Pt (001), (011), and (111) surfaces. First, we investigated the adsorption of a single SO2 molecule on the three Pt surfaces. On both the (001) and (111) surfaces, the SO2 had a S,O-bonded geometry, while on the (011) surface, it had a co-pyramidal and bridge geometry. The largest adsorption energy was obtained on the (001) surface (Eads = −2.47 eV), followed by the (011) surface (Eads = −2.39 and −2.28 eV for co-pyramidal and bridge geometries, respectively) and the (111) surface (Eads = −1.85 eV). When the surface coverage was increased up to a monolayer, we noted an increase of Eads/SO2 for all the surfaces, but the (001) surface remained the most favourable overall for SO2 adsorption. On the (111) surface, we found that when the surface coverage was θ > 0.78, two neighbouring SO2 molecules reacted to form SO and SO3. Considering the experimental conditions, we observed that the highest coverage in terms of the number of SO2 molecules per metal surface area was (111) > (001) > (011). As expected, when the temperature increased, the surface coverage decreased on all the surfaces, and gradual desorption of SO2 would occur above 500 K. Total desorption occurred at temperatures higher than 700 K for the (011) and (111) surfaces. It was seen that at 0 and 800 K, only the (001) and (111) surfaces were expressed in the morphology, but at 298 and 400 K, the (011) surface was present as well. Taking into account these data and those from a previous paper on water adsorption on Pt, it was evident that at temperatures between 400 and 450 K, where the HyS cycle operates, most of the water would desorb from the surface, thereby increasing the SO2 concentration, which in turn may lead to sulphur poisoning of the catalyst.

Graphical Abstract

1. Introduction

The current global energy demand is met primarily by fossil fuels, including natural gas and coal. However, with increased legislation imposed for environmental and sustainability reasons, as well as continuing depletion of the world’s fossil fuel resources, the focus is shifting towards energy production that is clean and renewable. Among other possible energy systems, hydrogen (H2) as an energy carrier is considered a potentially viable solution to address sustainable energy production, when coupled with renewable sources and adequate technology [1,2,3,4].
H2 gas is an ideal energy carrier for a number of applications [5,6,7]; it can be produced using a range of technologies [8,9,10,11], and of those, the non-carbon based hybrid sulphur (HyS) cycle is a potential large-scale H2 production process [12,13]. In this cycle, sulphuric acid (H2SO4) is thermally (>800 °C) decomposed into water (H2O), oxygen (O2), and sulphur dioxide (SO2). In the second step, SO2 reacts with H2O to form H2SO4 and H2 at temperatures between 80 and 120 °C. The net reaction of this cycle as a whole, without detrimental by-products, is the splitting of H2O into O2 and H2.
The current catalyst of choice in the HyS cycle is platinum (Pt), a very expensive and rare noble metal. While various other metals have been investigated [13], Pt is still the best performing catalyst in terms of activity and stability [14,15,16]. In previous optimisation experiments [17], it was found that an ideal catalyst should (i) not favour the reduction of SO2 to elemental sulphur, to prevent poisoning of the catalyst, and (ii) be able to activate H2O. It is therefore essential to understand the behaviour of SO2 on the Pt surface in order to suggest less costly alternatives. Insights into the binding and reactivity of SO2 on various transition metal surfaces, including Cu [18,19,20,21], Ni [22,23,24], Ag [25,26], Rh [27,28], Pd [20,28,29,30,31,32], and Pt [20,27,33,34,35,36], have accumulated through experimental and theoretical work over the past two decades. However, major difficulties have been experienced in experiments, in part due to the existence of various co-adsorbed surface sulphur species, even when pure sulphur oxides, such as SO2, are introduced from the gas phase onto the metal catalytic surfaces. Moreover, very little work has been performed on evaluating the energetics or thermodynamics of the adsorption of sulphur oxides or their surface reactions. Most experimental and theoretical work has considered the active Pt (111) surface, but it was shown in a water environment and with increasing temperatures that the Pt (001) and (011) surfaces were also important [37]. In a previous paper, we showed that in the presence of H2O under various temperatures and pressures, the (001), (011), and (111) surfaces were expressed to varying degrees in the particle morphology [38]. Thus, it was important for the sake of completeness and comparison that the effects of SO2 adsorption, concentration, and environmental temperature be considered for all three Pt surfaces.
In this paper, we used density functional theory (DFT) calculations to predict the behaviour of SO2 on the Pt (001), (011), and (111) surfaces. We examined the electronic properties of the system, i.e., the work function and charge densities. Surface phase diagrams are also generated by taking into consideration the surface free energies and the chemical potential of SO2, to determine the effects of temperature and pressure on the surface coverage and the morphology of nanoparticles. In general, it was our aim to develop a comprehensive understanding of SO2 surface chemistry, including the most stable adsorption sites, adsorption modes, and possible desorption of species that may occur on the major electro-catalytic surfaces of Pt.

2. Results and Discussion
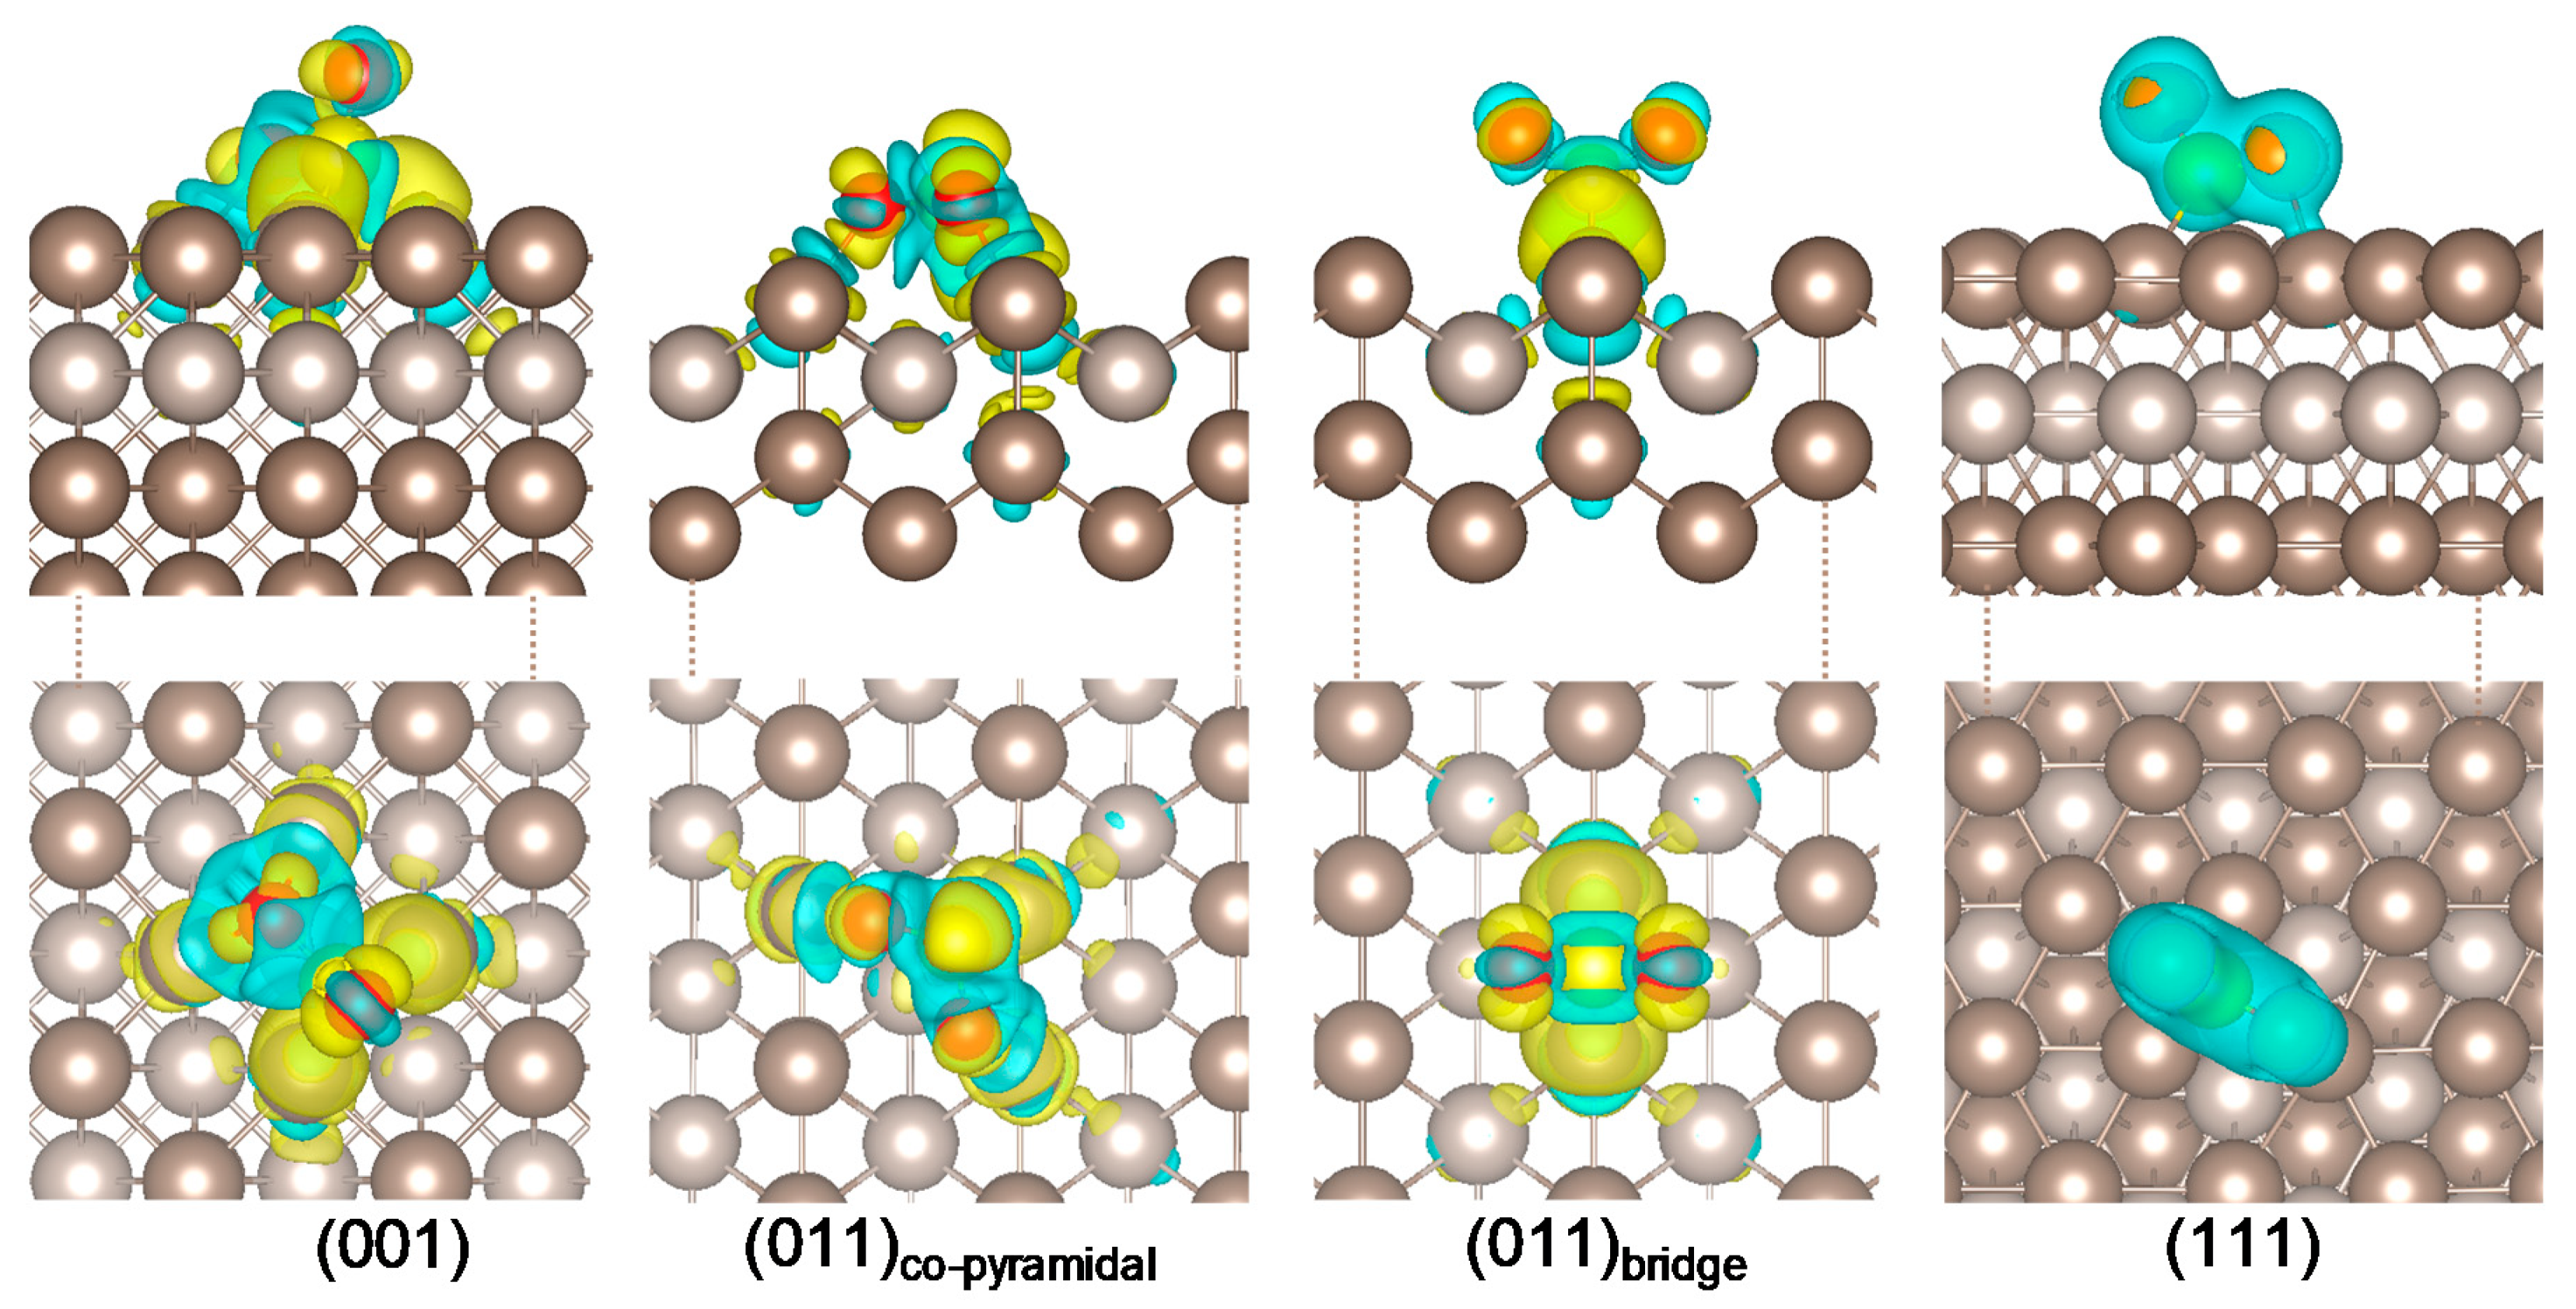
2.1. SO2 Adsorption

To calculate the adsorption behaviour of SO2 on a Pt surface, the most common and widely used surfaces Pt (001), (011), and (111) were investigated, shown in Figure 1 as top and side views. All three surfaces were planar, bulk-terminated structures, with four atomic layers and 15 Å vacuum space in the simulation cell. Pt (001) was a flat surface, while Pt (011) was atomically rough owing to the channels on the surface, whereas Pt (111) was again flat with a face-centred cubic arrangement. In a previous study [38], we used different long-range dispersion approximations, including the DFT-D3 method with Becke–Johnson damping [39], and calculated the lattice parameter of 3.926 Å, which correlated with the experimental value of 3.925 Å [40,41]. With regard to the surface energy, the most favourable was Pt (111) with the lowest surface energy at 2.046 J/m2, followed by the (001) and (011) surfaces at 2.462 and 2.615 J/m2, respectively, which correlated with experimental [42] and modelled values [43]. For benchmarking, we also investigated the effect of increasing the number of layers in the Pt slab to six and eight, again keeping the bottom two layers fixed and relaxing the four and six remaining layers, respectively. The data from the thicker slabs correlated well with the four layer Pt surfaces, showing a difference in surface energies of less than 0.1 eV, which fell within the margin of error. The calculated work functions were 5.89, 5.49, and 5.64 eV, which correlated with the literature values [44] of 5.66, 5.26, and 5.69 eV for Pt (001), (011), and (111), respectively.
Figure 1 shows the Pt surfaces with possible adsorption sites for each surface. To distinguish between the top layer and subsequent layer atoms, the colour of the second layer atoms in each of the surfaces was changed to lighter gold. The adsorption sites indicated in Figure 1 for the Pt (001) and (011) surfaces are atop (A), bridge (B), and four-fold hollow (4F), while the Pt (111) surface has atop (A), bridge (B), face-cubic centred (fcc), and hexagonal close packed (hcp) sites.
Five modes of SO2 adsorption on a metallic surface have been suggested [45], parallel, co-planar, bridging, O-bonded, and S,O-bonded. All five modes were investigated in the various adsorption sites shown in Figure 1. The most stable structures found for the adsorption of SO2 onto the Pt surface are shown in Figure 2. The bond distances and angles of the adsorbed SO2 with respect to the Pt surfaces are shown in Table 1.
SO2 adsorption on the (001) surface had a S,O-bonded geometry in the 4F binding site, where one S-O bond was in the plane of the surface and the other oxygen was directed away from the surface. The two S-O bond lengths in this case were different due to the position of nearby Pt atoms, i.e., for the upright oxygen (Oup), it was 1.451 Å, and for the oxygen nearer the surface (Oplane), it was elongated to 1.619 Å. Similarly, in an experimental study [29] of SO2 adsorption on the Pd (100) surface, SO2 had a S,O-bonded geometry with S-O and S-Pd bond lengths of 1.48 and 2.24 Å, respectively. For the Pt (001) surface, S-O-Pt1 was 105.62°, which was smaller than the experimental value of the free molecule of 120°, and thus was an indication that the molecule was chemisorbed. This stable adsorption mode was also obtained on the six and eight layer (001) Pt surface slabs, with corresponding adsorption energies of −2.40 and −2.47 eV, respectively.
Two stable adsorption configurations were observed on the (011) surface. The first one was a co-pyramidal configuration, where SO2 was parallel to the Pt surface with the two oxygens bound to two Pt atoms on the (011) ridge, forming an O-O-bridge with Pt. The second was a bridge configuration, where the sulphur formed a bridge between two Pt atoms on the ridge of the surface, with the oxygens directed away from the surface. In the (011)co−pyramidal configuration, the O-S-O bond angle was smaller than 120°, possibly due to the shorter bond lengths between S, O, and Pt, whereas in the (011)bridge configuration, the O-S-O angle was ~119°. This stable adsorption mode was also obtained on the six and eight layer (011) Pt surface slabs, with corresponding adsorption energies of −2.55 and −2.55 eV for the co-pyramidal configuration and −2.35 and −2.31 eV for the bridge configuration, respectively.
Similar to the adsorption on Pt (001), SO2 on the (111) surface had a S,O-bonded geometry on the fcc binding site, where one S-O bond lied in the plane of the surface and the other’s oxygen was directed away from the surface. SO2 can act as both a σ-donor and π-acceptor [49]; when the σ-bonding dominated, the molecule adsorbed with its molecular plane perpendicular to the surface, which could lead to the modes of adsorption seen on the (001), (011)bridge, and (111) surface sites. In contrast, if the π-acceptor aspect dominated, π bonds were formed between the SO2 and metal, and thus, the molecule lied flat on the surface, which could be the reason for the formation of the (011)co−pyramidal structure. This stable adsorption mode was also obtained on the six and eight layer (111) Pt surfaces, with corresponding adsorption energies of −1.94 and −1.96 eV, respectively.
As part of the benchmarking, the most stable adsorption configurations were also investigated on the (001), (011) and (111) surfaces with six and eight layers. The adsorption energies correlated well with the four layer slab, showing a difference of less than 0.11 eV. Therefore, it was decided to use the four layer slab for all remaining calculations of the Pt (001), (011), and (111) surfaces. Overall, the adsorption energy for N S O 2 = 1 was calculated to be most favourable on the (001) surface, followed by the (011) and (111) surfaces, which was the same trend as was found for H2O adsorption [38].
Table 1 shows the simulated wavenumbers of the fundamental vibrational modes of the adsorbed SO2 molecule on the (001), (011), and (111) surfaces, i.e., the asymmetric stretching ( ν a s y m ), symmetric stretching ( ν s y m ), and bending ( δ ) vibrational modes. Comparing the vibrational modes of SO2 on the (001), (011)bridge, and (111) surfaces, the values correlated well with the experimentally observed values [48]. However, for (011)co−pyramidal, the values were smaller, due to the constraint in the SO2 molecule where the O atoms were bound to the Pt ridge atoms.
From the charge analysis in Table 1, the negative values of Δ q indicated charge transfer from the surface to the adsorbate, where the most charge was transferred to the (011)co−pyramidal configuration, followed by (001), (111), and (011)bridge. Figure 3 shows the iso-surfaces of the electron density difference between SO2 and the Pt surface, which were calculated by subtracting the electron density of a clean Pt surface and that of a single SO2 molecule from the total electron density of the modelled system. Yellow and teal represent positive (electron gained) and negative (electron depleted) electron densities, respectively. In all four systems, the O atoms gained electron density (Δq = approximately −1.10 e) from the surrounding Pt atoms, and S lost electron density (Δq = 1.65 – 2.15 e) in the (011)co−pyramidal < (001) < (111) < (011)bridge systems.

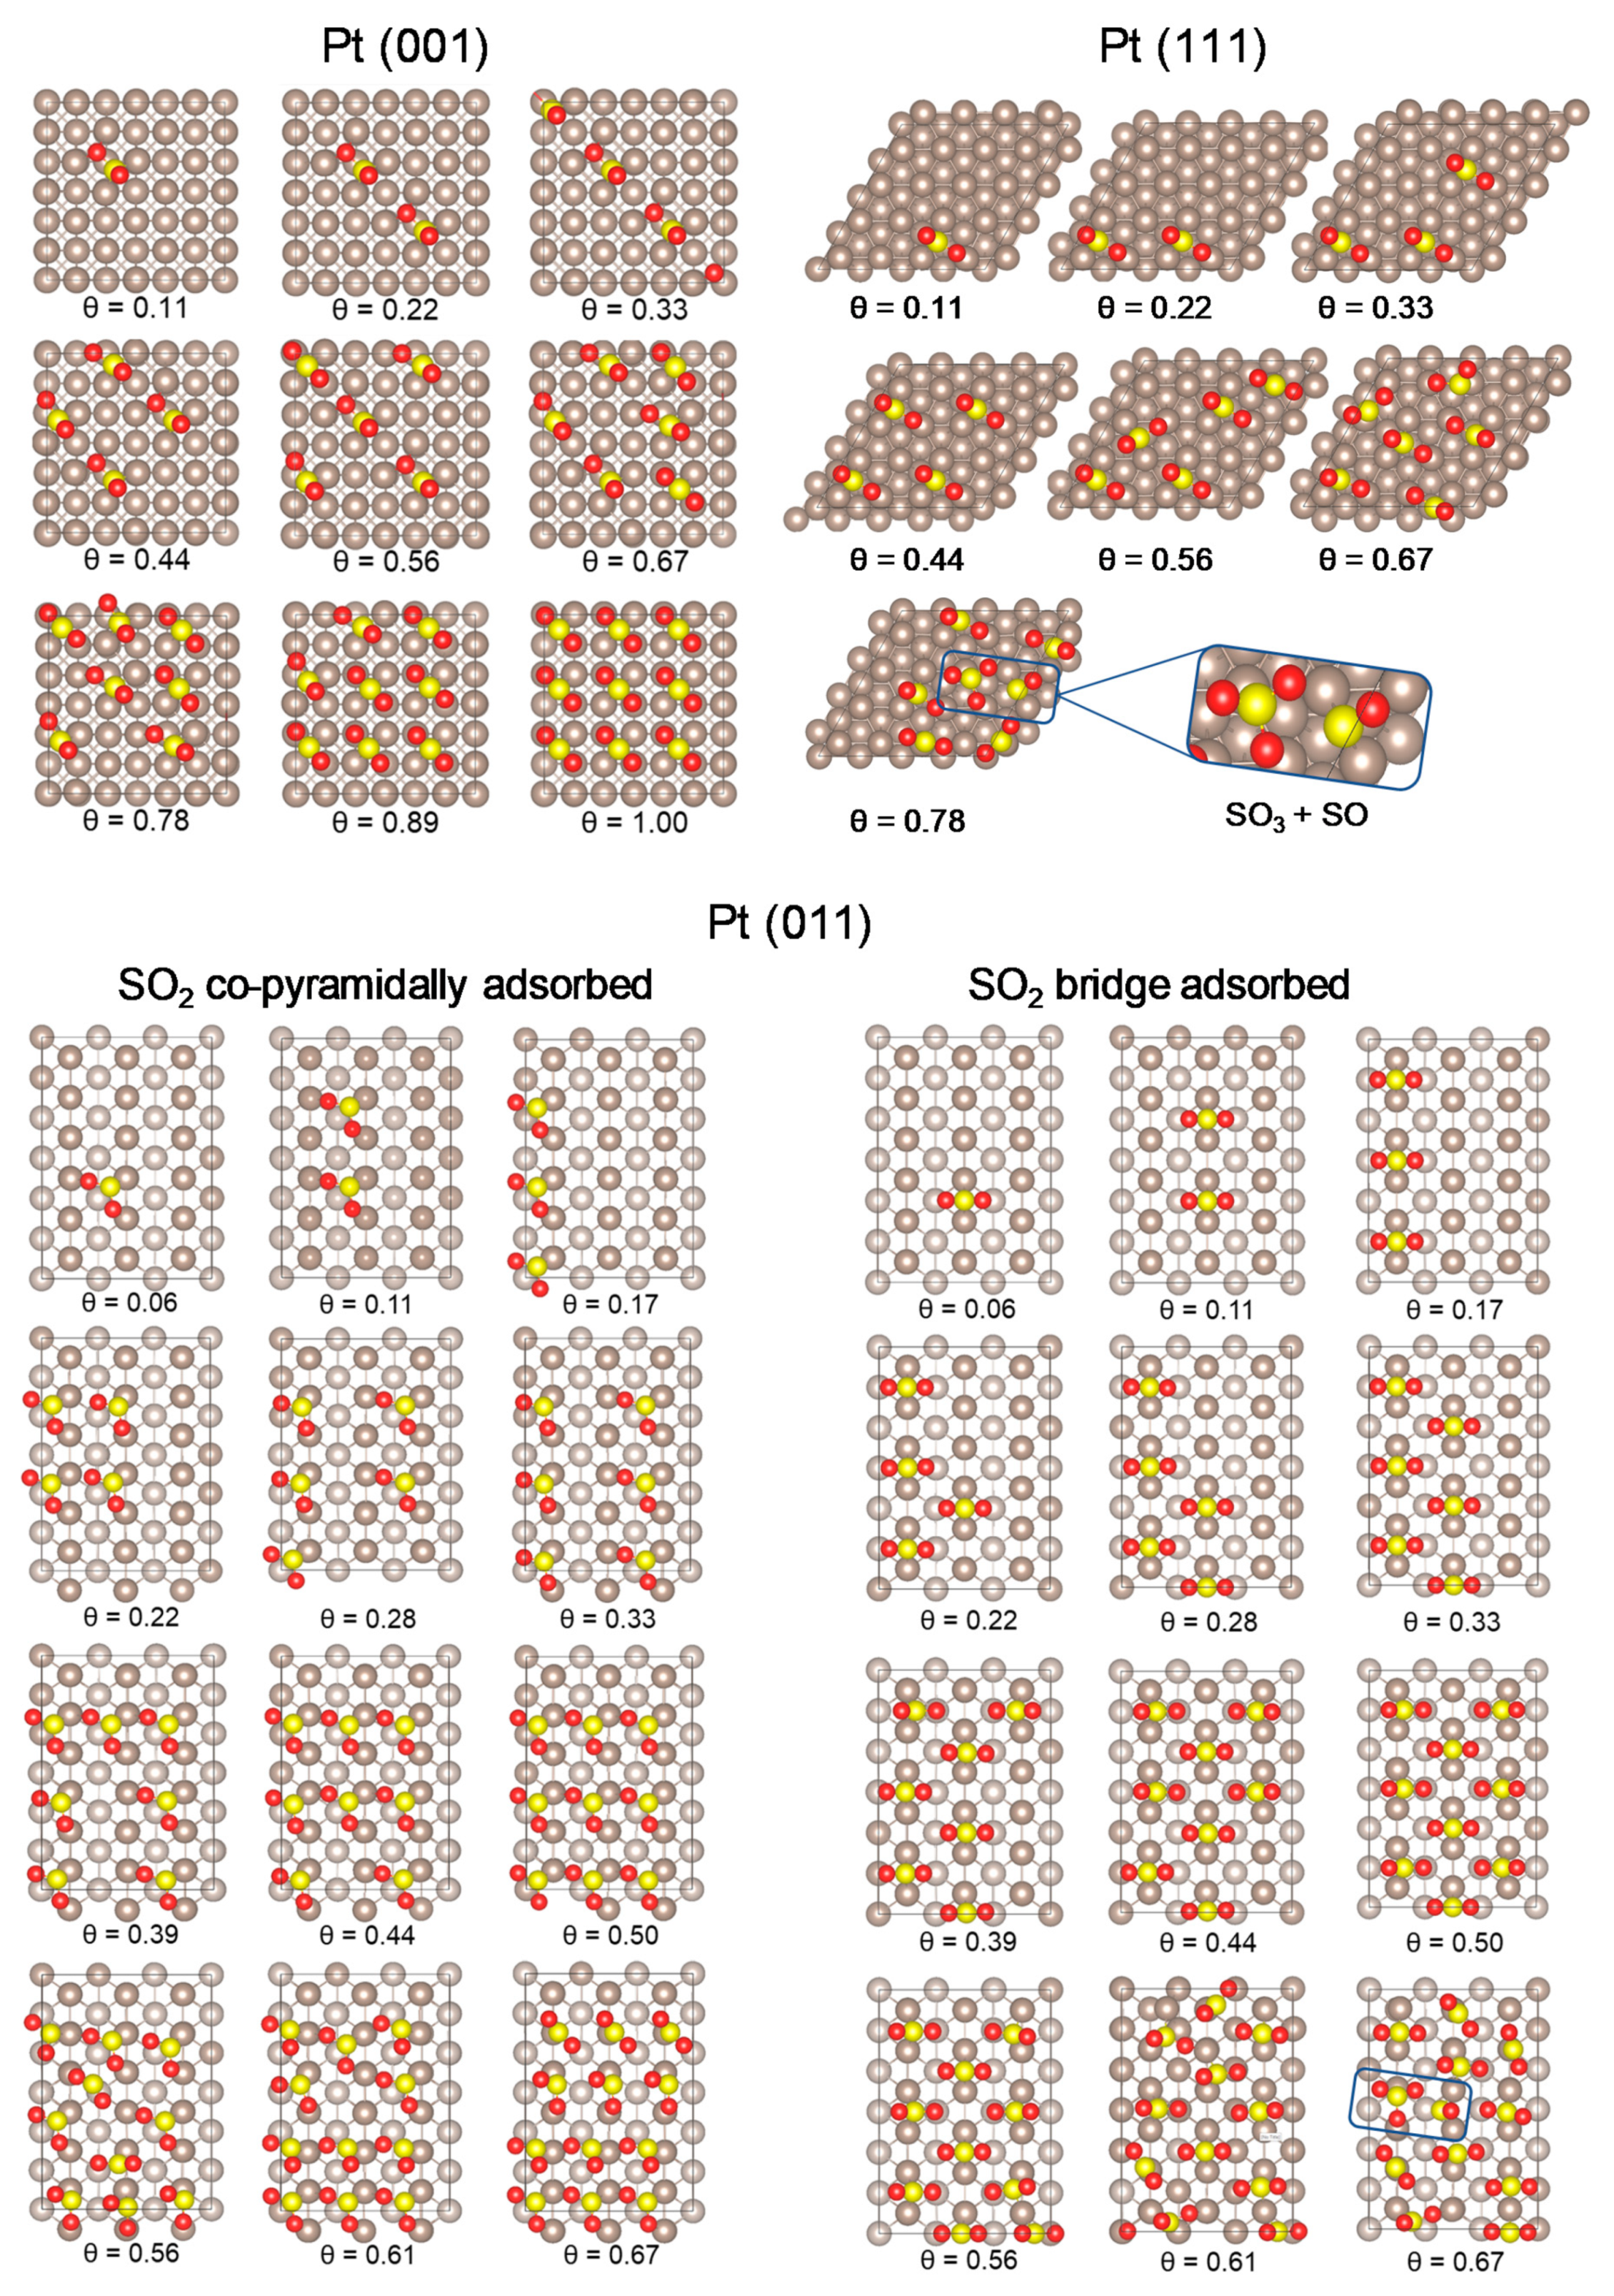
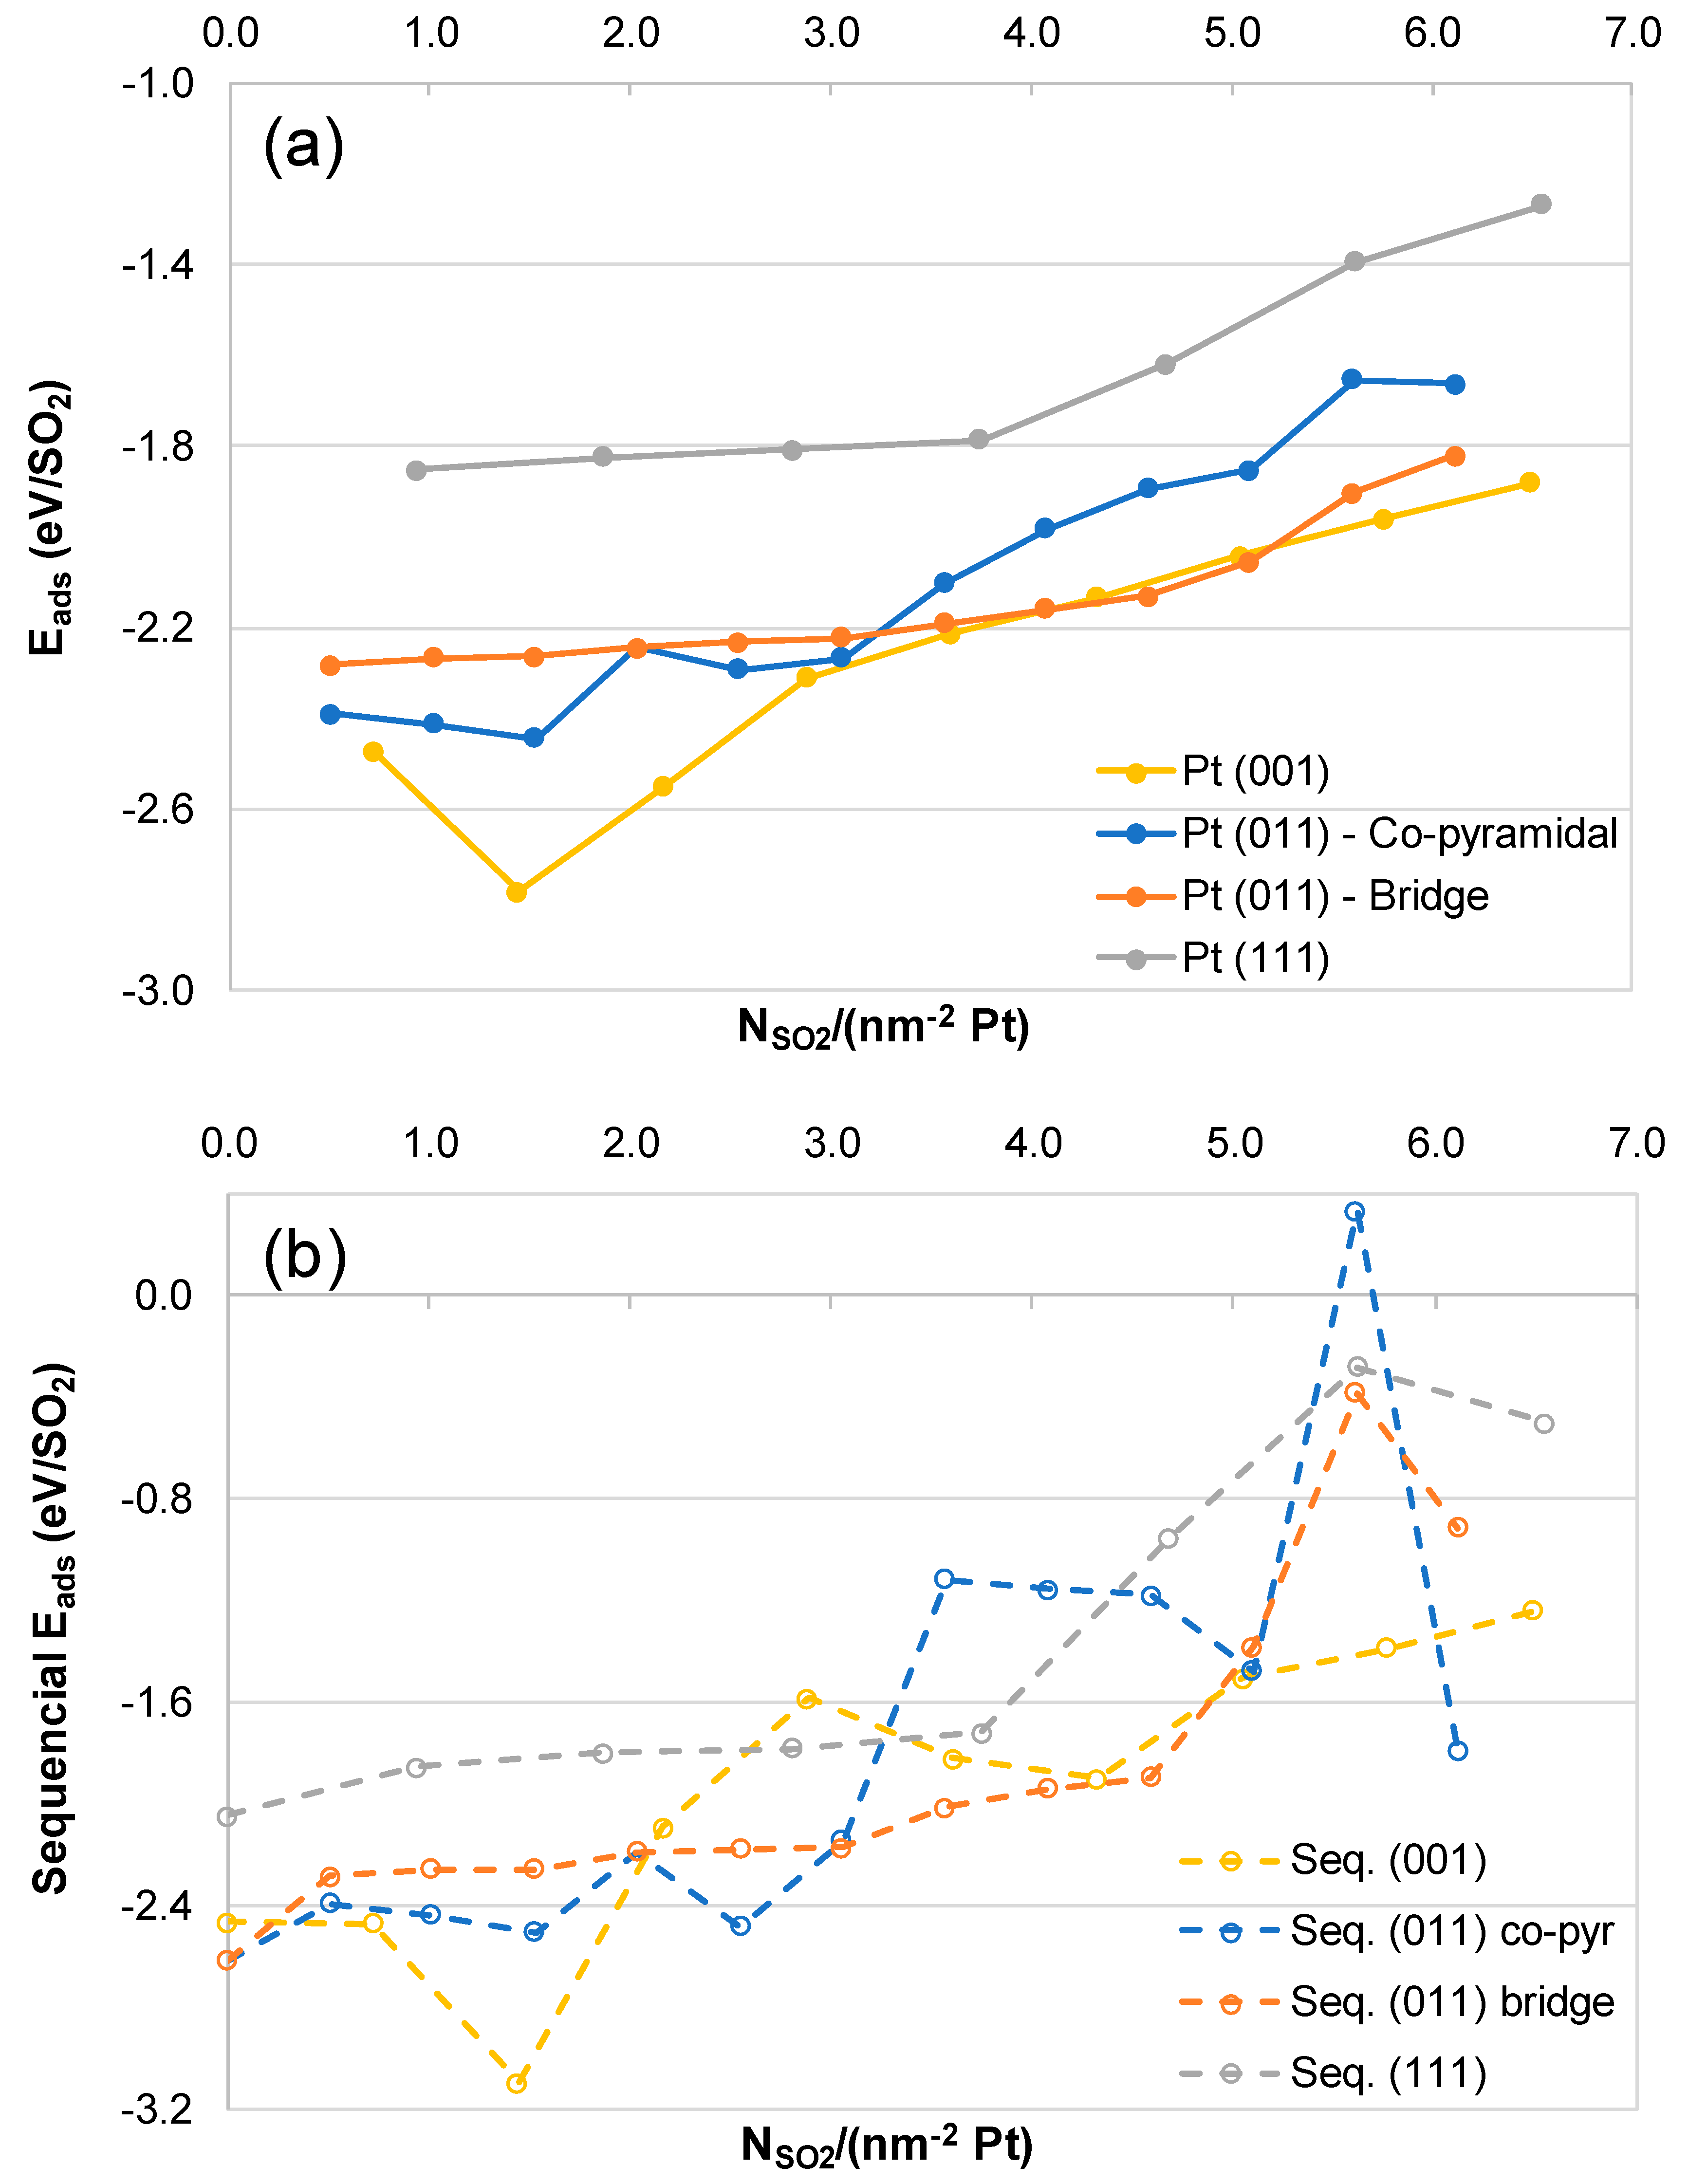
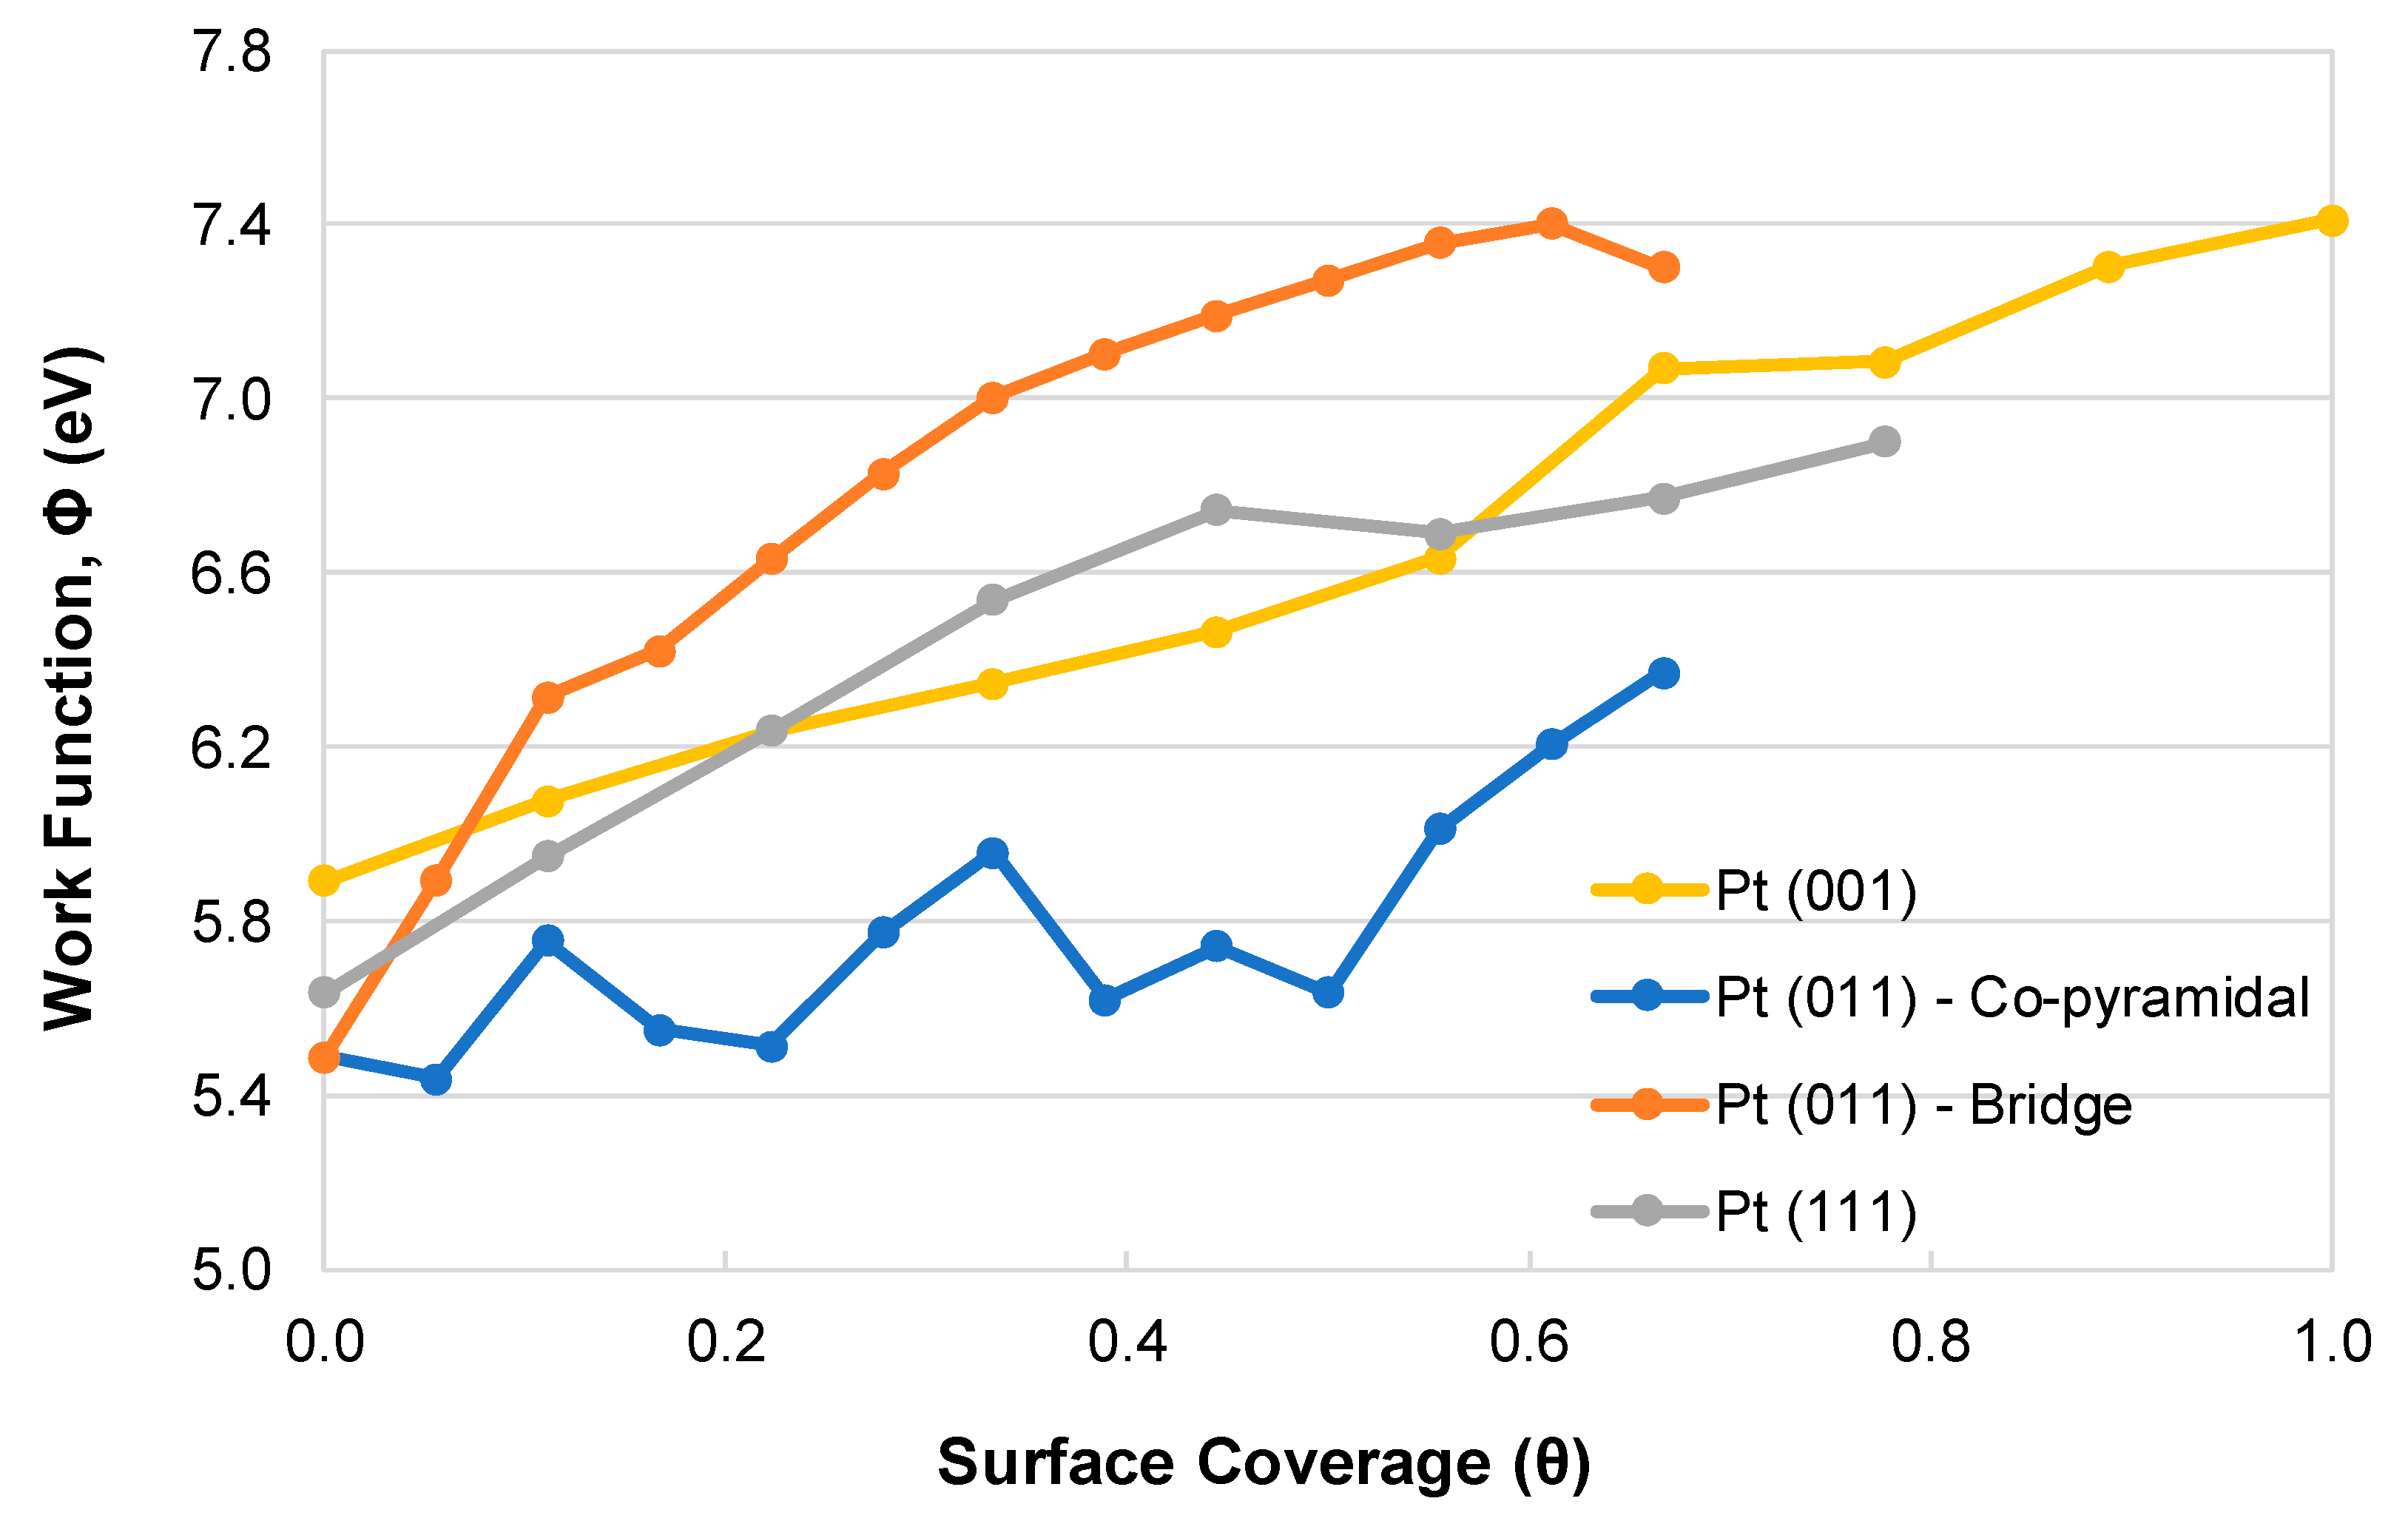
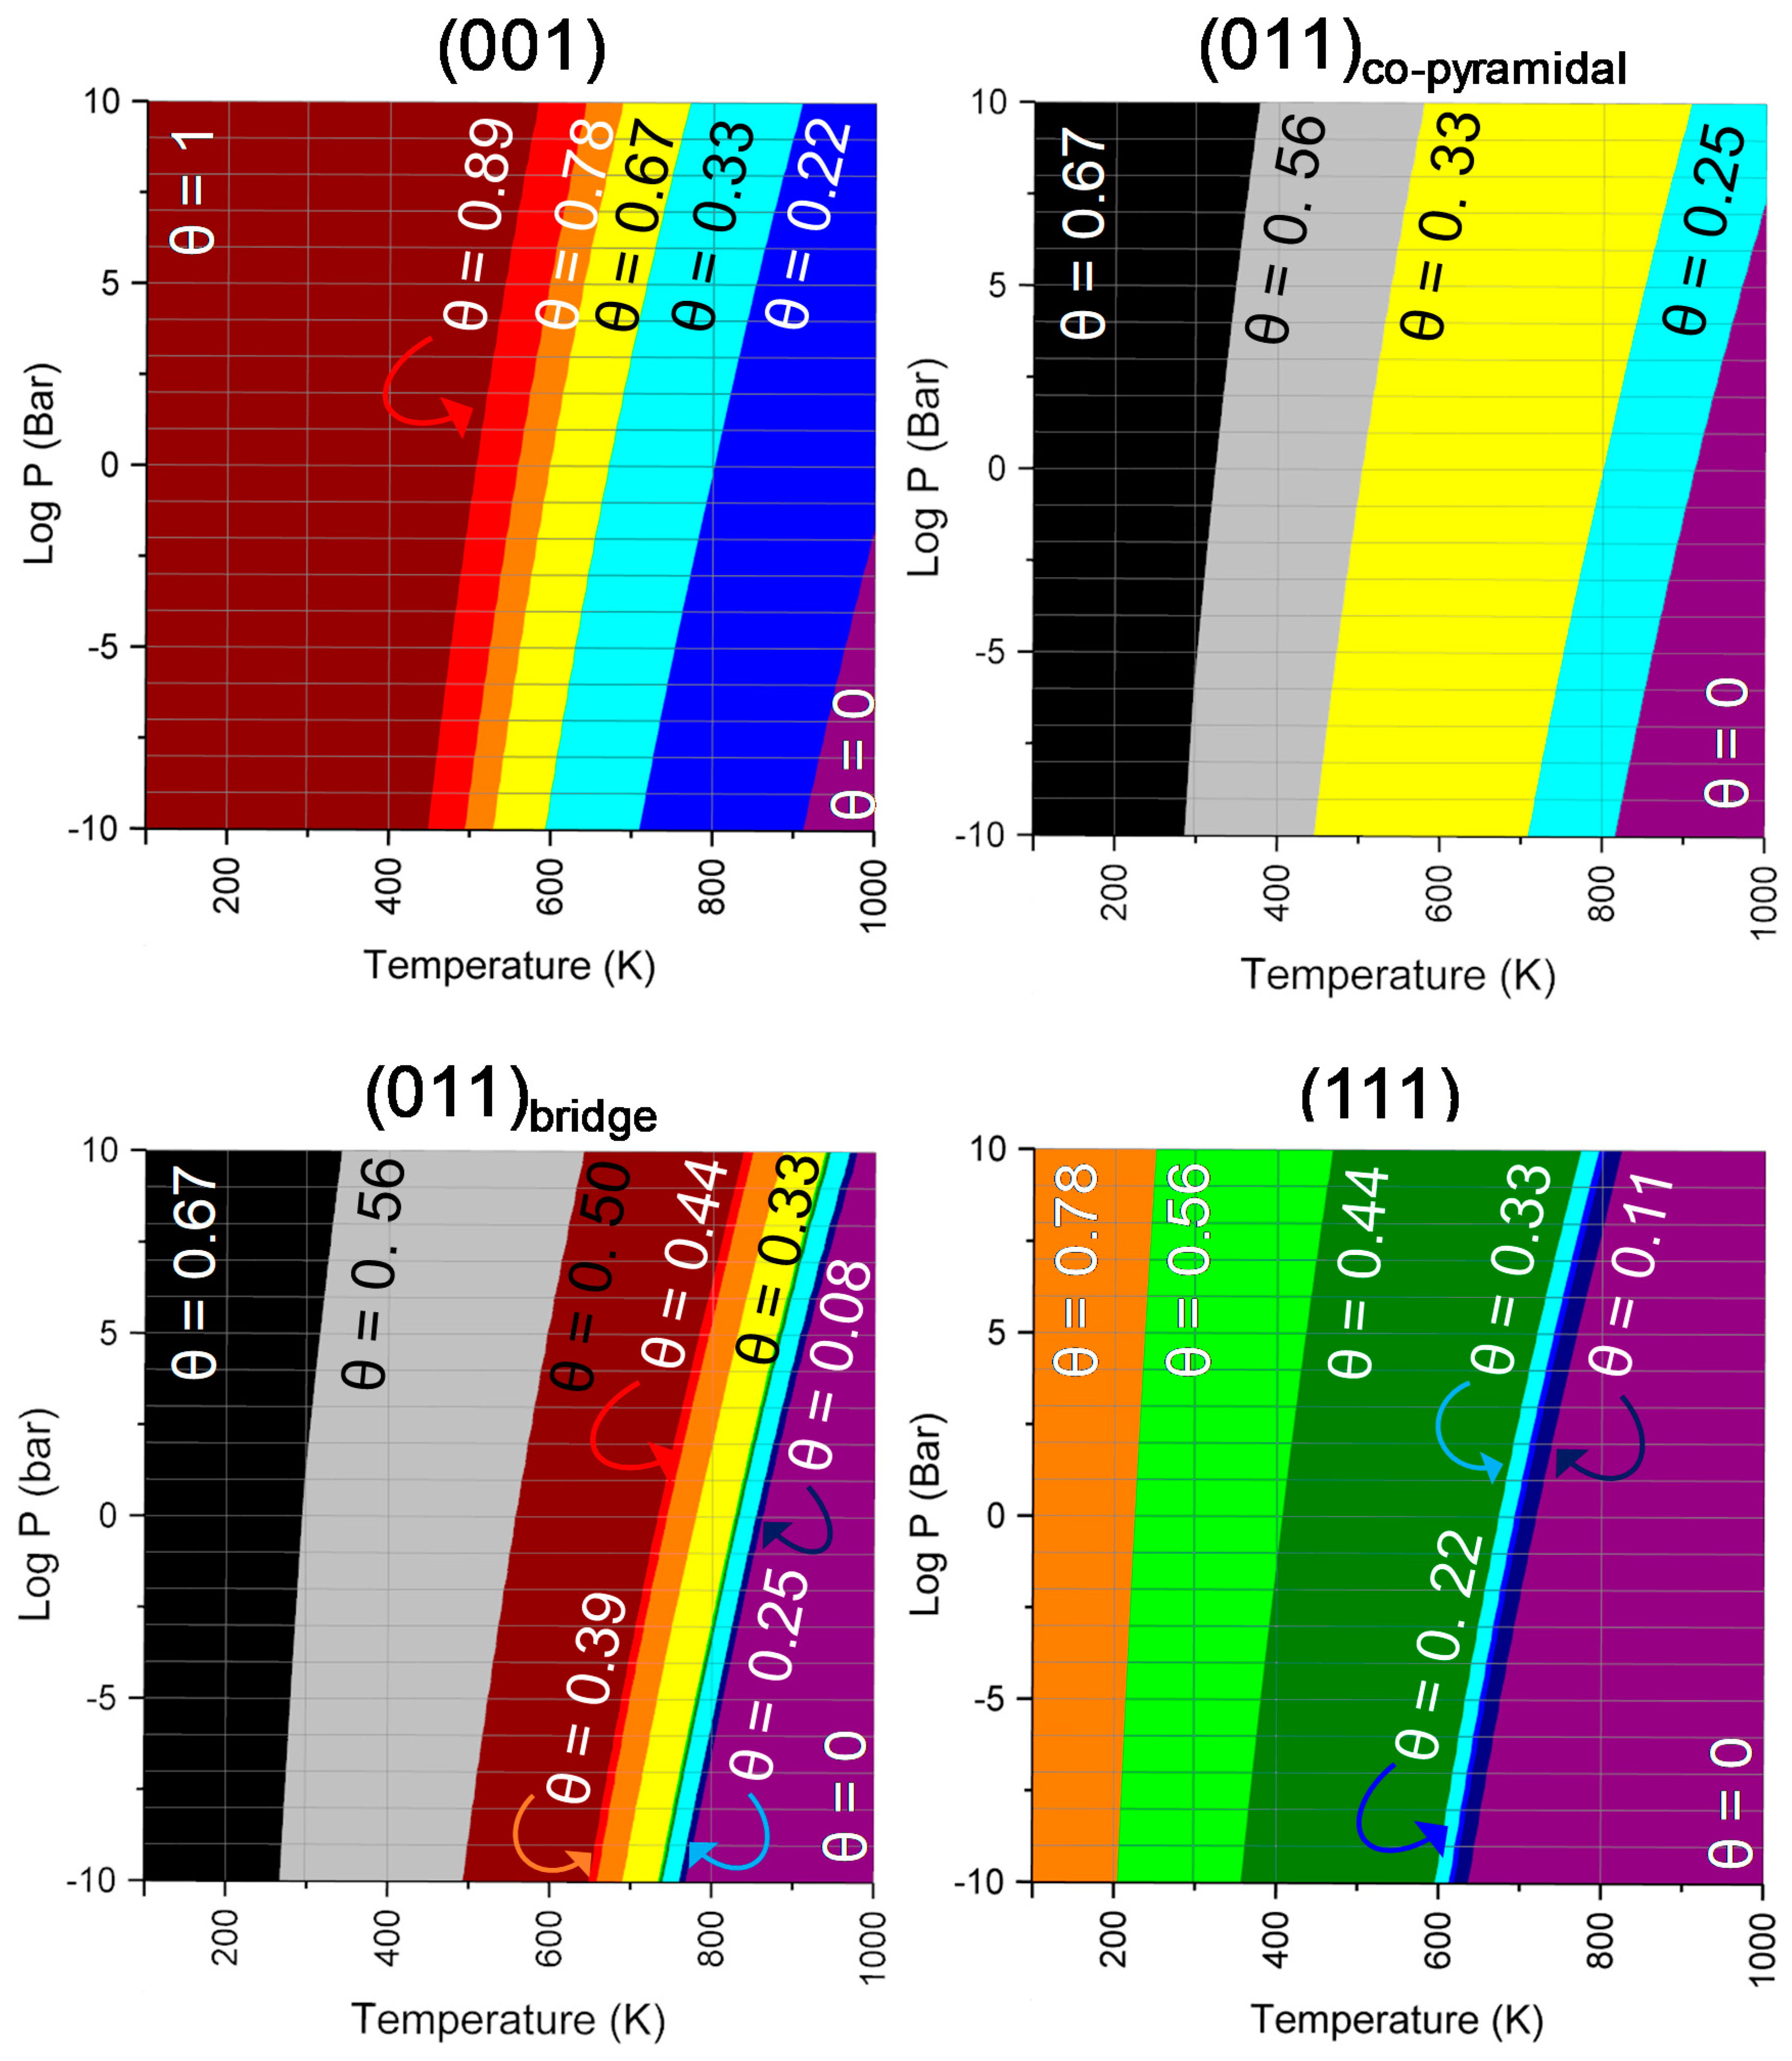
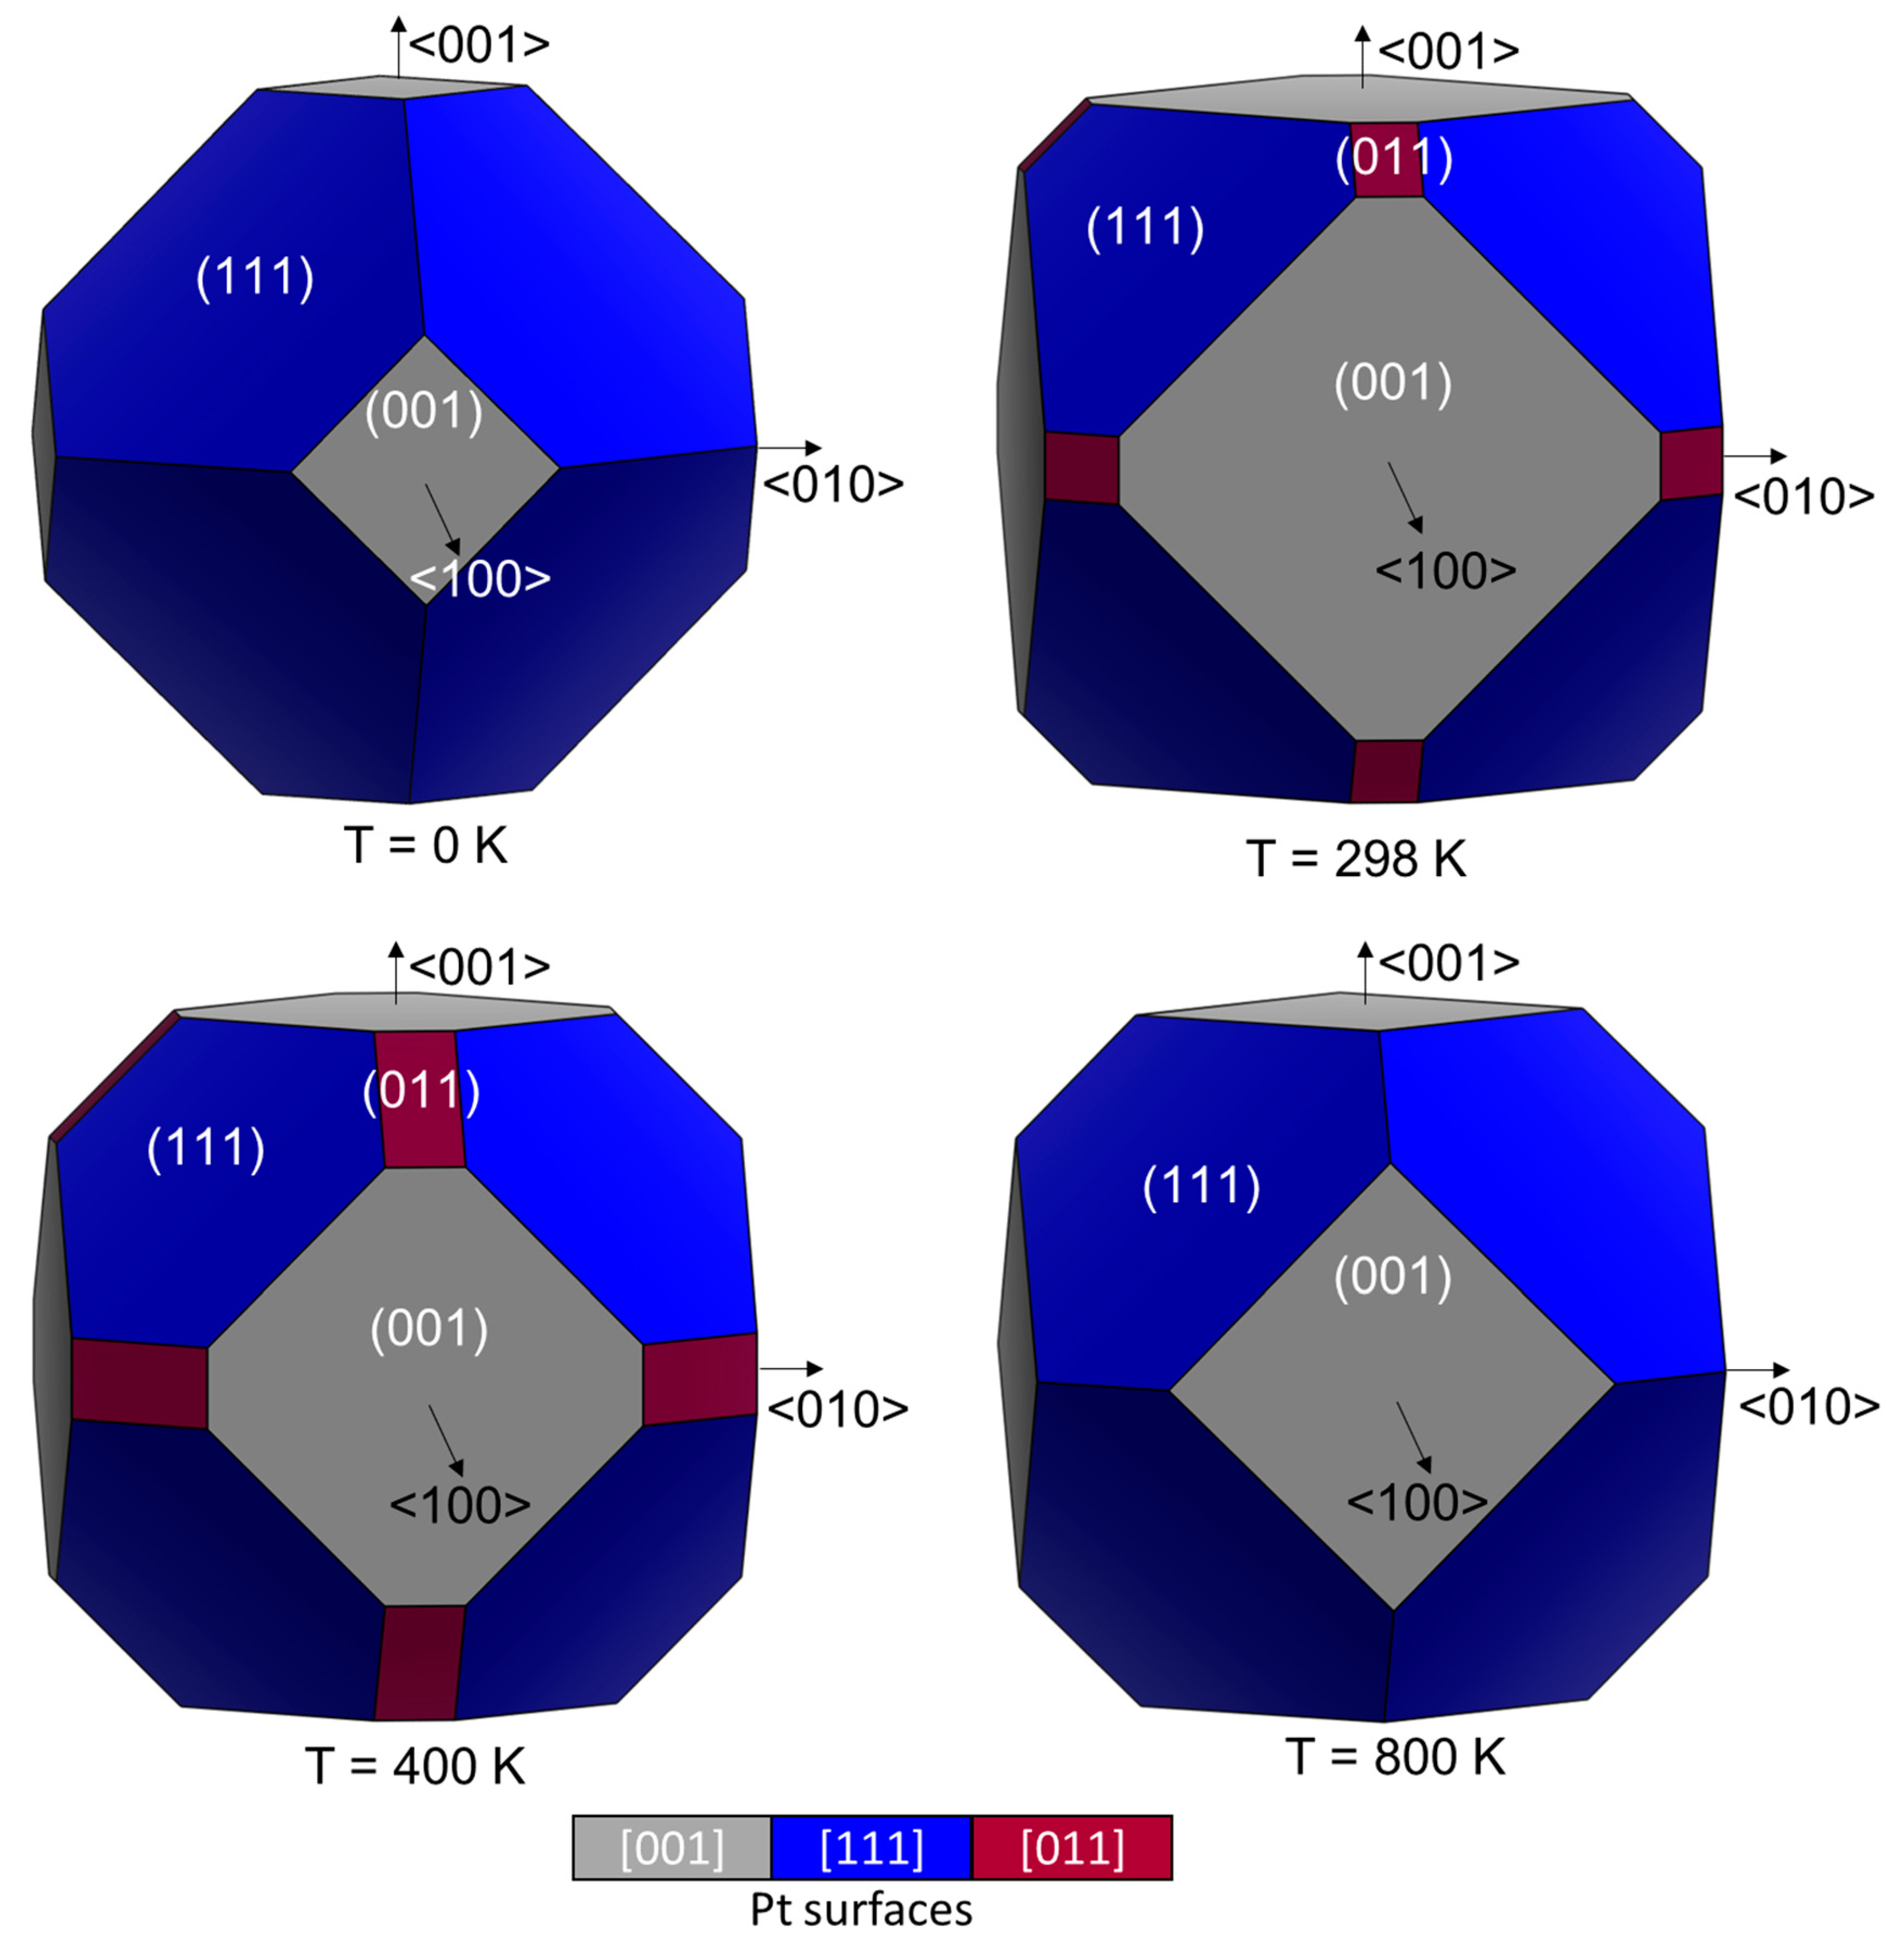
2.2. SO2 Surface Coverage

To determine the effect of an increased concentration of SO2 on the adsorption energy, configuration, work function, and morphology, the number of adsorbed SO2 molecules ( N S O 2 ) was increased on each of the Pt surfaces, until a monolayer was obtained. The lowest energy configurations for single SO2 adsorptions (Section 3.1) were used as the initial guess geometries for the systematic surface coverage increase. To obtain the lowest energy configurations, shown in Figure 4, more than 30 adsorption configurations were considered for each surface with the different coverages. Similar to the adsorption of H2O on all the Pt surfaces [38], it was seen that if the subsequent SO2 molecules were more than one adsorption site away from each other, the adsorption geometry remained the same as for the single adsorption, suggesting that they behave as isolated adsorbates.
On the (001) surface, as the surface coverage increased up to θ = 1, the mode of adsorption remained the same; no dissociation or recombination occurred during the geometry optimisations. This was also seen on the (011) surface, but when adsorption increased above θ > 0.61, the co-pyramidal adsorption changed to a mixed configuration with bridge adsorptions. The highest surface coverage was θ = 0.67 for both Pt (011)co−pyramidal and Pt (011)bridge adsorption modes. In the Pt (011)bridge coverage of θ = 0.67, two SO2 molecules reacted to form SO and SO3. On the Pt (111) surface, again, the adsorption mode remained the same with increasing coverage up to θ = 0.67. Similar to Pt (011)bridge, on the Pt (111) at the highest coverage of θ = 0.78, two neighbouring SO2 molecules reacted to form SO and SO3.
Figure 5a shows the computed average adsorption energies as a function of the surface coverage of SO2, which were calculated by dividing the maximum number of binding sites, e.g., nine for the (001) surface, by the Pt surface area (1.387 nm2). Overall, it can be seen for all three surfaces that the adsorption energy decreased monotonically as the surface coverage of SO2 increased. On the (001) surface, however, increasing the coverage from θ = 0.11 (0.72 SO2/nm2 Pt) to 0.22 (1.44 SO2/nm2 Pt) increased Eads, thus creating a more stable system. Overall, the (001) surface was most favourable for SO2 adsorption, and in most cases, it would have at least a coverage of θ = 0.22 (1.44 SO2/nm2 Pt). The maximum coverage where θ = 1 was obtained for 6.49 SO2/nm2 Pt.
The (011) surface had a maximum of 18 SO2 adsorption sites per 1.962 nm2 Pt. It can be seen that up to θ = 0.33 (3.06 SO2/nm2 Pt), the co-pyramidal configuration was the more stable adsorption, with a gradual decrease in Eads as the surface coverage increased. However, beyond this coverage, the bridge configuration became more stable, due to the surface area required for each SO2 on the surface. For example, in the co-pyramidal configuration, both O atoms were bound to a Pt atom, whereas in the bridge configuration, only the S atom was bound to a Pt atom, and the two O atoms were directed away from the surface. In fact, at the highest coverage, the dominant configuration of (011)co−pyramidal changed to a mixture of co-pyramidal and bridge adsorptions to allow the increased number of adsorbed SO2 molecules. A higher coverage than θ = 67 (6.12 SO2/nm2 Pt) could not be achieved as a secondary SO2 layer began to form. Similarly, the highest coverage for (011)bridge was also θ = 67 (6.12 SO2/nm2 Pt), but here, it was seen that two neighbouring SO2 molecules reacted to form SO and SO3.
The (111) surface was the least favourable of the three surfaces in terms of SO2 adsorption. Similar to the (001) surface, a maximum of nine binding sites were available on a Pt surface area of 1.068 nm2. Eads changed very little between θ = 0.11 (0.94 SO2/nm2 Pt) and 0.44 (3.75 SO2/nm2 Pt) as the adsorption geometry of the SO2 molecules did not change. From θ > 0.44 onwards, the surface became “crowded”, causing the geometries to change, with one of the SO2 molecules in a bridging adsorption mode in a bridge adsorption site. At θ = 0.78 (6.56 SO2/nm2 Pt), two neighbouring SO2 molecules changed geometries in such a way that one had a co-planar adsorption mode in an atop adsorption site, and the second still had its S,O-bonded geometry, but reacted to form SO and SO3. When θ > 0.78, two SO2 molecules still reacted, but a second layer of SO2 also started to form.
In Figure 5b, we also plot the energies obtained by increasing sequentially the number of SO2 molecules per Pt surface area until full coverage of the surface was obtained. The trend for SO2 coverage in terms of the N S O 2   nm 2   Pt was (011) < (001) < (111) at 6.12, 6.49, and 6.56 molecules nm 2   Pt , respectively. On the (001) surface, it can be seen that the absolute value of Eads increased with the addition of two SO2 molecules, after which Eads decreased sequentially. As for the average Eads (Figure 5a), up to θ = 0.33 (3.06 SO2/nm2 Pt), the co-pyramidal configuration was the more stable adsorption, with a gradual decrease in Eads as the surface coverage increased. However, beyond this coverage, the bridge configuration became more stable, but only up to θ = 0.56 (5.10 SO2/nm2 Pt). Both the co-pyramidal and bridge geometries showed a sharp Eads decrease at θ = 0.61 (5.61 SO2/nm2 Pt) due to crowding on the surface. It was at this point that two neighbouring SO2 molecules reacted to form SO and SO3, which then resulted in lowering the Eads at θ = 0.67 (6.12 SO2/nm2 Pt) to −1.79 and −0.91 eV for co-pyramidal and bridge geometries, respectively. A similar trend can be observed on the (111) surface, where Eads decreased slightly as SO2 was adsorbed sequentially up to θ = 0.44 (3.75 SO2/nm2 Pt), beyond which Eads reached a minimum value of −0.28 eV at θ = 0.67 (5.62 SO2/nm2 Pt) to increase to −0.5 eV at the highest coverage of θ = 0.78 (6.56 SO2/nm2 Pt) after the formation of SO and SO3.
We calculated the reaction energy of 2SO2 → SO + SO3 in a vacuum as +1.61 eV, but for the formation of these species on the surfaces as −3.55, −1.47, and −1.39 eV on the Pt (001), (011), and (111) surfaces, respectively. Although it was seen that the reaction energy of SO and SO3 in theory was more favourable on the (001) surface, only (011) and (111) showed spontaneous reactions. As the mechanistic study of SO2 reactions was beyond the scope of this work, it will need further investigation to identify the conditions that will favour the formation of SO and SO3 in both thermodynamic and kinetic terms.
Figure 6 shows the effect of SO2 coverage on the surface work function, which increased as the SO2 concentration increased. As more SO2 was adsorbed, more electrons were transferred from the surface to the adsorbate, leading to a lesser ability of the surface to release electrons into the vacuum. This finding was similar to previous work on SO2 coverage on Cu (111) [50] and Cu (110) [51], where the work function increased as the coverage increased. A high SO2 coverage led to an increased work function, which in turn would hinder the adsorption of additional SO2 molecules. This negative feedback effect was favourable as an increased adsorption rate led to the formation of the secondary products SO and SO3, which in turn caused sulphur poisoning of the surface.
Figure 7 shows the effects of pressure and temperature on the surface coverage of SO2, from which surface phase diagrams could be constructed. These phase diagrams could be used to predict likely processes during, for example the HyS cycle, which was operated at 1 atm (1.103 bar) and 350 to 400 K. Overall, it can be seen that, compared to pressure, temperature had a bigger effect on surface coverage with SO2. On the (001) surface, full surface coverage occurred in the experimental region, and gradual desorption of SO2 would occur at temperatures over 500 K.
At low temperatures, the (011) surface had a coverage of θ = 0.67, which gradually decreased as the temperature increased. In the experimental region, coverage for both the co-pyramidal and bridge geometries would be θ = 0.56. In contrast to the other surfaces, the (111) surface showed decreasing surface coverage from temperatures as low as 200 K. Similar to the (011) surface, coverage in the experimental region for the (111) surface was θ = 0.56, with complete SO2 desorption occurring at around 1 atm and 700 K.
Since the 1950s, multiple authors [52,53,54,55,56] have reported sulphur poisoning of the catalyst during these types of reactions. Further study is therefore needed to investigate the effect of the by-products of SO2 on the Pt surfaces. During the investigation of H2O adsorption on the Pt surface [38], it was found that if the temperature during an experiment increased above 450 K for (011) and (111) and 800 K for (001), all the H2O molecules would desorb from the surface. This could cause an increase in the SO2 concentration and may lead to the formation of more by-products of SO2, which in turn would impact the efficiency of the HyS cycle.
Next, we used the surface energies to calculate nanoparticle morphologies using the Wulff construction scheme [57], taking both the temperature and pressure of the adsorbed SO2 into account. Four temperatures (0, 298, 400, and 800 K) at pSO2 = 1 atm were chosen to explore the effect of temperature on the changes in the Pt morphology, visualised in Figure 8. The morphology at 0 K showed eight truncated triangular (111) faces and six square (001) faces. As the temperature was increased, 12 square faces of the (011) surface became expressed as well, which truncated the six square (001) faces. However, at 800 K, the (011) surfaces disappeared again to present a similar morphology as at 0 K, except that the (001) had a larger relative surface area.
Similar morphologies have been reported by Shi and Sun [58] during the adsorption of hydrogen on Pt at 0 K, where the nanoparticle expressed 14% and 86% of the (110) and (111) surface, respectively. They also showed that the Pt morphology changed with an increase in temperature, resulting in the expression of the (011) surface in the nanoparticle at both 475 and 600 K.

3. Computational Methods

3.1. Calculation Methods

Similar to the method used for H2O adsorption [38], the Vienna Ab Initio Simulation Package (VASP) [59,60,61,62] Version 5.4.1 was used to simulate the Pt surfaces and their interaction with SO2. To describe the interaction between the valence and core electrons, the projector augmented wave (PAW) [63,64] pseudopotential was used. The core electrons of the Pt, S, and O atoms were defined up to and including the 5p, 3p, and 1s orbitals, respectively. The Perdew–Burke–Ernzerhof (PBE) [65] functional within the generalised gradient approximation (GGA) was employed for the exchange-correlation approximation. The long-range dispersion interactions [66,67,68,69] were considered with the D3-BJ method by Grimme with Becke–Johnson damping [70]. Plane-waves were included to a cut-off of 400 eV. To ensure an electronic entropy of less than 1 meV·atom1, a smearing of 0.05 eV with the Methfessel–Paxton scheme order 1 [71] was used to determine the partial occupancies during geometry optimisation. Furthermore, the tetrahedron method with Blöchl corrections [72] was used in the final static simulations to obtain accurate total energies, charges, and densities of states. The electronic and ionic optimisation criteria were set at 105 eV and 102 eV·Å1, respectively. The conjugate gradient technique was adopted for all geometry optimisations.
A bulk Pt structure was simulated within a primitive face-centred cubic (fcc) cell, using the F m 3 ¯ m crystal structure [73] of Pt, with a Γ-centred 17 × 17 × 17 Monkhorst–Pack [74] k-point mesh. Our calculated fcc Pt lattice constant was 3.926 Å, in excellent agreement with the experimental value of 3.924 Å [40,41]. The Pt (001), (011), and (111) surfaces were constructed with the Minimum Energy Technique Applied to Dislocation, Interface and Surface Energies (METADISE) code [75], using the same method as in a previous study on H2O adsorption [38], creating periodic p(3 × 3), p(3 × 3) and p(4 × 4) supercells, respectively, constructed of four layers each. A Γ-centred 7 × 7 × 1 Monkhorst–Pack k-point grid was used for sampling the Brillouin zone in all the surfaces. The atoms in the two bottom layers of the supercells were fixed in the calculated bulk locations, and the atoms in the remaining two layers were allowed to relax. To ensure negligible interactions between neighbouring cells, a vacuum space of 15 Å was added perpendicularly to the surface. The surface areas of each of the super cells were 138.17, 196.18, and 106.79 Å2, respectively, for the (001), (011), and (111) surfaces.
To obtain the atomic charges, the Bader analysis [76,77,78,79] was used, where space was partitioned into non-spherical atomic regions enclosed by local minima in the charge density.
For the calculations of the adsorption energies and comparison of geometrical properties, the isolated SO2 molecule was modelled in a periodic box of 12 × 13 × 14 Å to ensure negligible interaction with neighbouring cells. The Gaussian smearing scheme [71] was used during geometry optimisation and energy calculations with a smearing of 0.05 eV. A Γ-centred 1 × 1 × 1 Monkhorst–Pack [74] k-point mesh was used, and the SO2 molecule was computed without symmetry constraints, but with added dipole corrections in all directions.
For the adsorption of SO2 on the Pt surfaces, the optimised isolated SO2 molecule was added to the surface in various configurations. A Γ-centred 7 × 7 × 1 Monkhorst–Pack k-point grid was used to sample the Brillouin zone in all the surfaces. The Gaussian smearing scheme [71] was used during geometry optimisation with a smearing of 0.05 eV, and the tetrahedron method with Blöchl corrections [72] was used in the final static simulations to obtain accurate total energies, charges, and densities of states. Perpendicular dipole corrections were added to account for the polarisation caused by the adsorption of the SO2 molecules onto the Pt surfaces.

3.2. Coverage-Dependent Surface Energies

To calculate the average adsorption energy ( E a d s ) per SO2 molecule adsorbed onto the Pt surface, the following Equation (1) was used [80]:
E a d s = 1 N S O 2 [ E P t , r N S O 2 0 ( E P t , r N S O 2 = 0 + N S O 2 E S O 2 ) ]
where N S O 2 is the number of adsorbed SO2 molecules, E P t N S O 2 0 is the energy of the Pt slab with adsorbed SO2 molecules, E P t N S O 2 = 0 is the energy of the clean Pt surface, and E S O 2 is the energy of the isolated SO2 molecule after relaxation.
To determine the effect of the thermodynamics on different SO2 coverages of the Pt (001), (011), and (111) surfaces, the surface energies (σ) were compared at different temperatures (T) and the SO2 chemical potential ( μ S O 2 ) [81]. The resulting change in surface energy from the SO2 adsorption was calculated as follows:
Δ σ ( T , p ) = 1 A s u r f a c e   [ E P t , r N S O 2 0 E P t , r N S O 2 = 0 N S O 2 · μ S O 2 ]
The chemical potential of SO2 in the gas phase can also be expressed as:
μ S O 2 ( T , p ) = E S O 2 + Δ G S O 2 ( T , p 0 ) + k B T l n p p 0
where E S O 2 is the DFT energy of the SO2 molecule and Δ G S O 2 ( T , p 0 ) is the Gibbs free energy difference per SO2 molecule between 0 K and T, at p 0 = 1 bar, which was extracted from the thermodynamic tables [82]. The last term ( k B T l n p p 0 ) denotes the free energy change of SO2 gas at constant temperature (T) when the partial pressure changes from p 0 to p . To determine the chemical potential, independent of the calculated quantities, Equation (3) was added to Equation (2) without the energy of SO2 ( E S O 2 ).
In this work, we defined surface coverage (θ) as the number of adsorbed SO2 molecules ( N S O 2 ) divided by the number or adsorption sites (N), as denoted by:
θ = N S O 2 N
If no adsorption took place, θ = 0, whereas for full coverage, i.e., when a monolayer formed on the surface, θ = 1.
The work function was defined as the minimum energy needed to remove an electron from the metal bulk structure through the surface to a point outside the solid. The work function (Φ) can be written as:
Φ = E v a c u u m E F
where Evacuum is the vacuum potential energy, which is a product of the electron charge and the electrostatic potential in the vacuum near the surface, and EF is the Fermi level (electrochemical potential of electrons) inside the surface. In our slab-supercell model, both the vacuum potential and the Fermi energy could be derived from the same calculation.
Wulff morphologies [57] were constructed using the GDIS program [83] to determine the effect of SO2 adsorption on the Pt (001), (011), and (111) surfaces on the shape of nanoparticles. The equilibrium Wulff crystal was constructed assuming that the distance of the crystal face ( d 001 ,   d 011 ,   d 111 ) to the centre of the nanoparticle was proportional to their surface free energies as:
d 001 σ 001 = d 011 σ 011 = d 111 σ 111

4. Conclusions

We employed density functional theory calculations to gain detailed insight into the behaviour of SO2 single molecules and higher coverages on the Pt (001), (011), and (111) surfaces. When an isolated SO2 molecule was adsorbed, the molecule preferred to adsorb in a S,O-bonded geometry on the (001) and (111) surfaces, whereas on the (011) surface, it formed co-pyramidal and bridge geometries. From the charge density analysis, we showed that between 0.2 and 0.35 e was transferred from the surface to the molecule.
Surface coverage was increased until a monolayer was obtained, where Eads/SO2 increased with coverage for all the surfaces. Under the conditions where the HyS reaction took place, the highest coverage was obtained on the (001) surface, followed by (011) and (111). On the (111) surface, it was found that, when the surface coverage was θ > 0.78, two neighbouring SO2 molecules reacted to form SO and SO3, which needs to be investigated mechanistically in future work. The most stable SO2 adsorption was on the (001) surface, but the most reactive was on the (111) surface. An increase of the temperature changed the percentage of the expressed faces in the morphology of Pt, where at 0 and 800 K, only the (001) and (111) faces were present, while at 298 and 400 K, all three faces ((001), (011), and (111)) were expressed.
Future work will include the consideration of mixing of SO2 and H2O on the various Pt surfaces, as well as the effect of the by-products of SO2 oxidation on the Pt surfaces.

Author Contributions

M.J.U. and C.G.C.E.v.S. conceived the presented idea. M.J.U. performed the computations. D.S.-C. and A.C.-E. verified the computational methods. M.J.U. took the lead in writing the initial manuscript with the support from D.S.-C. and A.C.-E. C.G.C.E.v.S. and N.H.d.L. supervised the project. All authors provided critical feedback and helped shape the research, analysis and contributed to the final manuscript. All authors have read and agreed to the published version of the manuscript.

Funding

This research was funded by the Engineering and Physical Sciences Research Council (EPSRC Grant Nos. EP/K016288/1 and EP/K009567/2) and the Economic and Social Research Council (ESRC Grant No. ES/N013867/1). National Research Foundation of South Africa (NRF Grant No. 116728).

Acknowledgments

We acknowledge the Engineering and Physical Sciences Research Council (EPSRC Grant Nos. EP/K016288/1 and EP/K009567/2), as well as the Economic and Social Research Council (ESRC Grant No. ES/N013867/1) and the National Research Foundation of South Africa for funding under the Newton Programme. This research was undertaken using resources of the Supercomputing Facilities at Cardiff University operated by Advanced Research Computing at Cardiff (ARCCA) on behalf of Supercomputing Wales (SCW) projects, which is partly funded by the European Regional Development Fund (ERDF) via the Welsh Government. We also acknowledge the use of facilities at the Centre for High Performance Computing (CHPC), South Africa. We wish to acknowledge the use of the EPSRC funded National Chemical Database Service hosted by the Royal Society of Chemistry. D.S.-C. is grateful to the Department of Science and Technology (DST) and the National Research Foundation (NRF) of South Africa for the provision of a Visiting Postdoctoral Fellowship. M.J.U. would like to acknowledge the National Research Foundation of South Africa for funding under the Post-Doctoral Fellowship (NRF Grant No. 116728) and the North-West University for their support and resources. All data created during this research are openly available from Cardiff University’s Research Portal at http://doi.org/10.17035/d.2020.0102392045.

Conflicts of Interest

The authors declare no conflict of interest.

References

  1. Cormos, C.-C. Hydrogen production from fossil fuels with carbon capture and storage based on chemical looping systems. Int. J. Hydrog. Energy 2011, 36, 5960–5971. [Google Scholar] [CrossRef]
  2. Ni, M.; Leung, D.Y.C.; Leung, M.K.H.; Sumathy, K. An overview of hydrogen production from biomass. Fuel Process. Technol. 2006, 87, 461–472. [Google Scholar] [CrossRef]
  3. Acar, C.; Dincer, I.; Naterer, G.F. Review of photocatalytic water-splitting methods for sustainable hydrogen production. Int. J. Energy Res. 2016, 40, 1449–1473. [Google Scholar] [CrossRef]
  4. Ursúa, A.; Gandía, L.M.; Sanchis, P. Hydrogen Production From Water Electrolysis: Current Status and Future Trends. Proc. IEEE 2012, 100, 410–426. [Google Scholar] [CrossRef]
  5. De Bruijn, F. The current status of fuel cell technology for mobile and stationary applications. Green Chem. 2005, 7, 132–150. [Google Scholar] [CrossRef]
  6. Baharudin, L.; James Watson, M. Hydrogen applications and research activities in its production routes through catalytic hydrocarbon conversion. Rev. Chem. Eng. 2017, 34, 43–72. [Google Scholar] [CrossRef]
  7. Schlapbach, L.; Züttel, A. Hydrogen-storage materials for mobile applications. In Materials for Sustainable Energy; Co-Published with Macmillan Publishers Ltd.: Basingstoke, UK, 2010; pp. 265–270. [Google Scholar]
  8. Holladay, J.D.; Hu, J.; King, D.L.; Wang, Y. An overview of hydrogen production technologies. Catal. Today 2009, 139, 244–260. [Google Scholar] [CrossRef]
  9. Turner, J.A. Sustainable Hydrogen Production. Science 2004, 305, 972–974. [Google Scholar] [CrossRef]
  10. Yildiz, B.; Kazimi, M. Efficiency of hydrogen production systems using alternative nuclear energy technologies. Int. J. Hydrog. Energy 2006, 31, 77–92. [Google Scholar] [CrossRef]
  11. Alves, H.J.; Bley Junior, C.; Niklevicz, R.R.; Frigo, E.P.; Frigo, M.S.; Coimbra-Araújo, C.H. Overview of hydrogen production technologies from biogas and the applications in fuel cells. Int. J. Hydrog. Energy 2013, 38, 5215–5225. [Google Scholar] [CrossRef]
  12. Xue, L.; Zhang, P.; Chen, S.; Wang, L. Pt-based bimetallic catalysts for SO2-depolarized electrolysis reaction in the hybrid sulfur process. Int. J. Hydrog. Energy 2014, 39, 14196–14203. [Google Scholar] [CrossRef]
  13. O’Brien, J.A.; Hinkley, J.T.; Donne, S.W.; Lindquist, S.E. The electrochemical oxidation of aqueous sulfur dioxide: A critical review of work with respect to the hybrid sulfur cycle. Electrochim. Acta 2010, 55, 573–591. [Google Scholar] [CrossRef]
  14. Colón-Mercado, H.R.; Hobbs, D.T. Catalyst evaluation for a sulfur dioxide-depolarized electrolyzer. Electrochem. Commun. 2007, 9, 2649–2653. [Google Scholar] [CrossRef] [Green Version]
  15. Lu, P.W.T.; Ammon, R.L. An Investigation of Electrode Materials for the Anodic Oxidation of Sulfur Dioxide in Concentrated Sulfuric Acid. J. Electrochem. Soc. 1980, 127, 2610. [Google Scholar] [CrossRef]
  16. Appleby, A.J.; Pinchon, B. Electrochemical aspects of the H2SO4SO2 thermoelectrochemical cycle for hydrogen production. Int. J. Hydrog. Energy 1980, 5, 253–267. [Google Scholar] [CrossRef]
  17. Falch, A.; Lates, V.; Kriek, R.J. Combinatorial Plasma Sputtering of PtxPdy Thin Film Electrocatalysts for Aqueous SO2 Electro-oxidation. Electrocatalysis 2015, 6, 322–330. [Google Scholar] [CrossRef]
  18. Polcik, M.; Wilde, L.; Haase, J.; Brena, B.; Cocco, D.; Comelli, G.; Paolucci, G. Adsorption and temperature-dependent decomposition of SO2 on Cu(100) and Cu(111): A fast and high-resolution core-level spectroscopy study. Phys. Rev. B 1996, 53, 13720–13724. [Google Scholar] [CrossRef]
  19. Polčik, M.; Wilde, L.; Haase, J. SO2-induced surface reconstruction of Cu(111): An x-ray-absorption fine-structure study. Phys. Rev. B 1998, 57, 1868–1874. [Google Scholar] [CrossRef]
  20. Wilburn, M.S.; Epling, W.S. SO2 adsorption and desorption characteristics of Pd and Pt catalysts: Precious metal crystallite size dependence. Appl. Catal. A Gen. 2017, 534, 85–93. [Google Scholar] [CrossRef]
  21. Rodriguez, J.A.; Ricart, J.M.; Clotet, A.; Illas, F. Density functional studies on the adsorption and decomposition of SO2 on Cu(100). J. Chem. Phys. 2001, 115, 454–465. [Google Scholar] [CrossRef]
  22. Yokoyama, T.; Terada, S.; Yagi, S.; Imanishi, A.; Takenaka, S.; Kitajima, Y.; Ohta, T. Surface structures and electronic properties of SO2 adsorbed on Ni(111) and Ni(100) studied by S K-edge X-ray absorption fine structure spectroscopy. Surf. Sci. 1995, 324, 25–34. [Google Scholar] [CrossRef]
  23. Terada, S.; Imanishi, A.; Yokoyama, T.; Takenaka, S.; Kitajima, Y.; Ohta, T. Surface structure of SO2 adsorbed on Ni(110) studied by S K-edge X-ray absorption fine structure spectroscopy. Surf. Sci. 1995, 336, 55–62. [Google Scholar] [CrossRef]
  24. Zebisch, P.; Weinelt, M.; Steinrück, H.-P. Sulphur dioxide adsorption on the Ni(110) surface. Surf. Sci. 1993, 295, 295–305. [Google Scholar] [CrossRef]
  25. Ahner, J.; Effendy, A.; Vajen, K.; Wassmuth, H.-W. Chemisorption and multilayer adsorption of SO2 on Ag(111) and Ag(110). Vacuum 1990, 41, 98–101. [Google Scholar] [CrossRef]
  26. Solomon, J.L.; Madix, R.J.; Wurth, W.; Stohr, J. NEXAFS and EELS study of the orientation of sulfur dioxide on silver(110). J. Phys. Chem. 1991, 95, 3687–3691. [Google Scholar] [CrossRef]
  27. Ku, R.C.; Wynblatt, P. SO2 adsorption on Rh(110) and Pt(110) surfaces. Appl. Surf. Sci. 1981, 8, 250–259. [Google Scholar] [CrossRef]
  28. Rodriguez, J.A.; Jirsak, T.; Chaturvedi, S. Reaction of S2 and SO2 with Pd/Rh(111) surfaces: Effects of metal–metal bonding on sulfur poisoning. J. Chem. Phys. 1999, 110, 3138–3147. [Google Scholar] [CrossRef]
  29. Terada, S.; Sakano, M.; Kitajima, Y.; Yokoyama, T.; Ohta, T. Adsorption of SO2 on Pd(100) Studied by S K-Edge XAFS. Le J. Phys. IV 1997, 7, C2-703–C2-704. [Google Scholar]
  30. Burke, M.L.; Madix, R.J. Hydrogen on Pd(100)-S: The effect of sulfur on precursor mediated adsorption and desorption. Surf. Sci. 1990, 237, 1–19. [Google Scholar] [CrossRef]
  31. Saleh, J.M. Interaction of sulphur compounds with palladium. Trans. Faraday Soc. 1970, 66, 242. [Google Scholar] [CrossRef]
  32. Burke, M.L.; Madix, R.J. SO2 structure and reactivity on clean and sulfur modified Pd(100). Surf. Sci. 1988, 194, 223–244. [Google Scholar] [CrossRef]
  33. Astegger, S.; Bechtold, E. Adsorption of sulfur dioxide and the interaction of coadsorbed oxygen and sulfur on Pt(111). Surf. Sci. 1982, 122, 491–504. [Google Scholar] [CrossRef]
  34. Köhler, U.; Wassmuth, H.-W. SO2 adsorption and desorption kinetics on Pt(111). Surf. Sci. 1983, 126, 448–454. [Google Scholar] [CrossRef]
  35. Sun, Y.-M.; Sloan, D.; Alberas, D.J.; Kovar, M.; Sun, Z.-J.; White, J.M. SO2 adsorption on Pt(111): HREELS, XPS and UPS study. Surf. Sci. 1994, 319, 34–44. [Google Scholar] [CrossRef]
  36. Polčik, M.; Wilde, L.; Haase, J.; Brena, B.; Comelli, G.; Paolucci, G. High-resolution XPS and NEXAFS study of SO2 adsorption on Pt(111): Two surface SO2 species. Surf. Sci. 1997, 381, L568–L572. [Google Scholar] [CrossRef]
  37. Zhu, B.; Xu, Z.; Wang, C.; Gao, Y. Shape Evolution of Metal Nanoparticles in Water Vapor Environment. Nano Lett. 2016, 16, 2628–2632. [Google Scholar] [CrossRef]
  38. Ungerer, M.J.; Santos-Carballal, D.; Cadi-Essadek, A.; van Sittert, C.G.C.E.; de Leeuw, N.H. Interaction of H2O with the Platinum Pt (001), (011) and (111) Surfaces: A Density Functional Theory Study with Long-Range Dispersion Corrections. J. Phys. Chem. C 2019, 123, 27465–27476. [Google Scholar] [CrossRef] [Green Version]
  39. Grimme, S.; Ehrlich, S.; Goerigk, L. Effect of the damping function in dispersion corrected density functional theory. J. Comput. Chem. 2011, 32, 1456–1465. [Google Scholar] [CrossRef]
  40. Arblaster, J.W. Crystallographic properties of platinum. Platin. Met. Rev. 1997, 41, 12–21. [Google Scholar] [CrossRef]
  41. Arblaster, J.W. Crystallographic properties of platinum (Errata). Platin. Met. Rev. 2006, 50, 118–119. [Google Scholar] [CrossRef]
  42. Tyson, W.R.; Miller, W.A. Surface free energies of solid metals: Estimation from liquid surface tension measurements. Surf. Sci. 1977, 62, 267–276. [Google Scholar] [CrossRef]
  43. Zhang, J.-M.; Ma, F.; Xu, K.-W. Calculation of the surface energy of fcc metals with modified embedded-atom method. Chin. Phys. 2004, 13, 1082–1090. [Google Scholar] [CrossRef]
  44. Singh-Miller, N.E.; Marzari, N. Surface energies, work functions, and surface relaxations of low-index metallic surfaces from first principles. Phys. Rev. B Condens. Matter Mater. Phys. 2009, 80, 235407. [Google Scholar] [CrossRef] [Green Version]
  45. Kubas, G.J. Diagnostic Features of Transition-Metal-S02 Coordination Geometries. Inorg. Chem. 1979, 18, 182. [Google Scholar] [CrossRef]
  46. Happel, M.; Luckas, N.; Viñes, F.; Sobota, M.; Laurin, M.; Libuda, J. SO2 Adsorption on Pt(111) and Oxygen Precovered Pt(111): A Combined Infrared Reflection Absorption Spectroscopy and Density Functional Study. J. Phys. Chem. C 2011, 115, 479–491. [Google Scholar] [CrossRef]
  47. Lin, X.; Hass, K.C.; Schneider, W.F.; Trout, B.L. Chemistry of Sulfur Oxides on Transition Metals I: Configurations, Energetics, Orbital Analyses, and Surface Coverage Effects of SO2 on Pt(111). J. Phys. Chem. B 2002, 106, 12575–12583. [Google Scholar] [CrossRef]
  48. Briggs, A.G. Vibrational frequencies of sulfur dioxide. Determination and application. J. Chem. Educ. 1970, 47, 391–393. [Google Scholar] [CrossRef]
  49. Ryan, R.R.; Kubas, G.J.; Moody, D.C.; Eller, P.G. Structure and bonding of transition metal-sulfur dioxide complexes. In Structural Bonding; Springer: Berlin/Heidelberg, Germany, 1981; Volume 46, pp. 47–100. [Google Scholar]
  50. Ahner, J.; Wassmuth, H.-W. Molecular and dissociative chemisorption and condensation of SO2 on Cu(111). Surf. Sci. 1993, 287–288, 125–129. [Google Scholar] [CrossRef]
  51. Lanzani, G.; Laasonen, K. SO2 and its fragments on a Cu(110) surface. Surf. Sci. 2008, 602, 321–344. [Google Scholar] [CrossRef]
  52. Minachev, K.M.; Shuikin, N.I.; Rozhdestivenskaya, I.D. Poisoning of platinum catalysts with a low content of active metal on a carrier, under conditions of dehydrogenation catalysis. Bull. Acad. Sci. USSR Div. Chem. Sci. 1952, 1, 567–575. [Google Scholar] [CrossRef]
  53. Somorjai, G. On the mechanism of sulfur poisoning of platinum catalysts. J. Catal. 1972, 27, 453–456. [Google Scholar] [CrossRef] [Green Version]
  54. Lamy-Pitara, E.; Bencharif, L.; Barbier, J. Effect of sulphur on the properties of platinum catalysts as characterized by cyclic voltammetry. Appl. Catal. 1985, 18, 117–131. [Google Scholar] [CrossRef]
  55. Nasri, N.S.; Jones, J.M.; Dupont, V.A.; Williams, A. A Comparative Study of Sulfur Poisoning and Regeneration of Precious-Metal Catalysts. Energy Fuels 1998, 12, 1130–1134. [Google Scholar] [CrossRef]
  56. Oudar, J. Sulfur Adsorption and Poisoning of Metallic Catalysts. Catal. Rev. 1980, 22, 171–195. [Google Scholar] [CrossRef]
  57. Wulff, G. XXV. Zur Frage der Geschwindigkeit des Wachsthums und der Auflösung der Krystallflächen. Z. Krist. Cryst. Mater. 1901, 34, 449–530. [Google Scholar] [CrossRef]
  58. Shi, Q.; Sun, R. Adsorption manners of hydrogen on Pt(1 0 0), (1 1 0) and (1 1 1) surfaces at high coverage. Comput. Theor. Chem. 2017, 1106, 43–49. [Google Scholar] [CrossRef]
  59. Kresse, G.; Hafner, J. Ab initio molecular dynamics for liquid metals. Phys. Rev. B 1993, 47, 558–561. [Google Scholar] [CrossRef]
  60. Kresse, G.; Hafner, J. Ab initio molecular-dynamics simulation of the liquid-metalamorphous- semiconductor transition in germanium. Phys. Rev. B 1994, 49, 14251–14269. [Google Scholar] [CrossRef]
  61. Kresse, G.; Furthmüller, J. Efficient iterative schemes for ab initio total-energy calculations using a plane-wave basis set. Phys. Rev. B 1996, 54, 11169–11186. [Google Scholar] [CrossRef]
  62. Kresse, G.; Furthmüller, J. Efficiency of ab-initio total energy calculations for metals and semiconductors using a plane-wave basis set. Comput. Mater. Sci. 1996, 6, 15–50. [Google Scholar] [CrossRef]
  63. Blöchl, P.E. Projector augmented-wave method. Phys. Rev. B 1994, 50, 17953–17979. [Google Scholar] [CrossRef] [PubMed] [Green Version]
  64. Kresse, G.; Joubert, D. From ultrasoft pseudopotentials to the projector augmented-wave method. Phys. Rev. B 1999, 59, 1758–1775. [Google Scholar] [CrossRef]
  65. Perdew, J.P.; Burke, K.; Ernzerhof, M. Generalized Gradient Approximation Made Simple. Phys. Rev. Lett. 1996, 77, 3865–3868. [Google Scholar] [CrossRef] [PubMed] [Green Version]
  66. Posada-Pérez, S.; Santos-Carballal, D.; Terranova, U.; Roldan, A.; Illas, F.; de Leeuw, N.H. CO2 interaction with violarite (FeNi2S4) surfaces: A dispersion-corrected DFT study. Phys. Chem. Chem. Phys. 2018, 20, 20439–20446. [Google Scholar] [CrossRef] [Green Version]
  67. Tafreshi, S.S.; Roldan, A.; Dzade, N.Y.; de Leeuw, N.H. Adsorption of hydrazine on the perfect and defective copper (111) surface: A dispersion-corrected DFT study. Surf. Sci. 2014, 622, 1–8. [Google Scholar] [CrossRef] [Green Version]
  68. Dzade, N.Y.; Roldan, A.; de Leeuw, N.H. Activation and dissociation of CO2 on the (001), (011), and (111) surfaces of mackinawite (FeS): A dispersion-corrected DFT study. J. Chem. Phys. 2015, 143, 094703. [Google Scholar] [CrossRef] [Green Version]
  69. Mishra, A.K.; Roldan, A.; de Leeuw, N.H. CuO Surfaces and CO2 Activation: A Dispersion-Corrected DFT+ U Study. J. Phys. Chem. C 2016, 120, 2198–2214. [Google Scholar] [CrossRef]
  70. Grimme, S.; Antony, J.; Ehrlich, S.; Krieg, H. A consistent and accurate ab initio parametrization of density functional dispersion correction (DFT-D) for the 94 elements H-Pu. J. Chem. Phys. 2010, 132, 154104. [Google Scholar] [CrossRef] [Green Version]
  71. Methfessel, M.; Paxton, A.T. High-precision sampling for Brillouin-zone integration in metals. Phys. Rev. B 1989, 40, 3616–3621. [Google Scholar] [CrossRef] [Green Version]
  72. Blöchl, P.E.; Jepsen, O.; Andersen, O.K. Improved tetrahedron method for Brillouin-zone integrations. Phys. Rev. B 1994, 49, 16223–16233. [Google Scholar] [CrossRef]
  73. Corbel, G.; Topić, M.; Gibaud, A.; Lang, C.I. Selective dry oxidation of the ordered Pt-11.1 at.% v alloy surface evidenced by in situ temperature-controlled X-ray diffraction. J. Alloys Compd. 2011, 509, 6532–6538. [Google Scholar] [CrossRef]
  74. Monkhorst, H.J.; Pack, J.D. Special points for Brillouin-zon integrations. Phys. Rev. B 1976, 13, 5188–5192. [Google Scholar] [CrossRef]
  75. Watson, G.W.; Kelsey, E.T.; de Leeuw, N.H.; Harris, D.J.; Parker, S.C. Atomistic simulation of dislocations, surfaces and interfaces in MgO. J. Chem. Soc. Faraday Trans. 1996, 92, 433. [Google Scholar] [CrossRef]
  76. Henkelman, G.; Arnaldsson, A.; Jónsson, H. A fast and robust algorithm for Bader decomposition of charge density. Comput. Mater. Sci. 2006, 36, 354–360. [Google Scholar] [CrossRef]
  77. Sanville, E.; Kenny, S.D.; Smith, R.; Henkelman, G. Improved grid-based algorithm for Bader charge allocation. J. Comput. Chem. 2007, 28, 899–908. [Google Scholar] [CrossRef] [PubMed]
  78. Tang, W.; Sanville, E.; Henkelman, G. A grid-based Bader analysis algorithm without lattice bias. J. Phys. Condens. Matter 2009, 21, 084204. [Google Scholar] [CrossRef]
  79. Yu, M.; Trinkle, D.R. Accurate and efficient algorithm for Bader charge integration. J. Chem. Phys. 2011, 134, 1–8. [Google Scholar] [CrossRef] [Green Version]
  80. Santos-Carballal, D.; Roldan, A.; Grau-Crespo, R.; de Leeuw, N.H. A DFT study of the structures, stabilities and redox behaviour of the major surfaces of magnetite Fe3O4. Phys. Chem. Chem. Phys. 2014, 16, 21082–21097. [Google Scholar] [CrossRef] [Green Version]
  81. Postica, V.; Vahl, A.; Strobel, J.; Santos-Carballal, D.; Lupan, O.; Cadi-Essadek, A.; de Leeuw, N.H.; Schütt, F.; Polonskyi, O.; Strunskus, T.; et al. Tuning doping and surface functionalization of columnar oxide films for volatile organic compound sensing: Experiments and theory. J. Mater. Chem. A 2018, 6, 23669–23682. [Google Scholar] [CrossRef] [Green Version]
  82. Chase, M. NIST-JANAF Thermochemical Tables 4th ed. J. Phys. Chem. Ref. Data 1998, 1529–1564. [Google Scholar]
  83. Fleming, S.; Rohl, A. GDIS: A vizualization program for molecular and periodic systems. Z. Krist. 2005, 220, 580–584. [Google Scholar] [CrossRef]
Figure 1. Top and side views of the Pt (001), (011), and (111) surfaces, with the four-fold hollow (4F), bridge (B), atop (A), face-cubic centred (fcc), and hexagonal close packed (hcp) adsorption sites. The gold colour is used to depict Pt throughout the manuscript, with the second layer in a lighter colour to distinguish between the top layer and subsequent layer atoms.
Catalysts 10 00558 g001
Figure 2. Lowest energy absorption sites of SO2 on the Pt (001), (011), and (111) surfaces (Pt (011)co−pyramidal and Pt (011)bridge indicate the two adsorption modes of SO2 on the (011) surface, respectively). The atom colours red and yellow denote oxygen and sulphur atoms, respectively.
Catalysts 10 00558 g002
Figure 3. Iso-surfaces of the electron density difference between SO2 and Pt (001), (011), and (111). Yellow and teal represent positive (electron gained) and negative (electron depleted) charge density with ±0.0021, ±0.0020, ±0.0016, and ±0.0300 e/Å3 iso-surfaces, respectively.
Catalysts 10 00558 g003
Figure 4. Increased adsorption coverage of SO2 on the Pt (001), (011), and (111) surfaces.
Catalysts 10 00558 g004
Figure 5. Average (a) and sequential (b) adsorption energies (Eads) as a function of the SO2 surface coverage (nm−2 Pt) on the Pt (001), (011), and (111) surfaces.
Catalysts 10 00558 g005
Figure 6. Effect of increased SO2 concentration on the work function of the Pt (001), (011), and (111) surfaces.
Catalysts 10 00558 g006
Figure 7. Surface phase diagrams in terms of pressure and temperature for the Pt (001), (011), and (111) surfaces.
Catalysts 10 00558 g007
Figure 8. Wulff morphology of Pt nanoparticles at 0, 298, 400, and 800 K.
Catalysts 10 00558 g008
Table 1. Adsorption energies (Eads), bond distances (d), and angles (∠), as well as the simulated wavenumbers (cm−1) of the fundamental vibration modes of the adsorbed SO2 on the Pt (001), (011), and (111) surfaces. The presented vibrational modes are the asymmetric stretching ( ν a s y m ), symmetric stretching ( ν s y m ), and bending ( δ ) modes. Charge transfers (Δ q ) following SO2 adsorption on the different Pt surfaces are also given.
(001)(011)co-pyramidal(011)bridge(111)Literature
Eads (eV)−2.47−2.39−2.28−1.85−1.099 a,
−1.218 b
d (Å)O-Pt12.2542.1143.9323.475-
O-Pt23.2873.403 ± 0.0033.1483.254 (Oup)-
O-Pt33.2892.1203.9342.4192.30 b
O-Pt42.255-3.1443.102 (Oplane)-
S-O1.451 (Oup)
1.619 (Oplane)
1.543 (Pt1)
1.563 (Pt3)
1.4581.450 (Oup)
1.500 (Oplane)
1.47 (Oup) b
1.54 (Oplane) b
S-Pt32.2343.4223.6972.9182.31 b
S-Pt43.1102.2432.2632.274-
∠ (°)O-S-O110.05111.01118.88115.27155.5 b
S-O-Pt
(O-S-Pt *)
105.62 (Pt1/4)
124.98 ± 0.07 (Pt2/3)
129.16 (Pt1)
112.16 (Pt3)
113.57 ± 0.05 *93.22 (SOplane-Pt3)
120.21 * (Oplane-S-Pt2/4)
-
ν a s y m (cm1)1172.2832.91211.81177.71153 c
ν s y m (cm1)622.4745.21033.1875.91362 c
δ (cm1)452.1414.3495.8502.6508 c
Δ q (e)−0.349−0.432−0.198−0.240-
a DFT modelled data on Pt (111) [46]. b Ab initio quantum mechanical molecular dynamics data on Pt (111) [47]. c Experimental value of gaseous SO2 [48]. * Measurement of the O-S-Pt bond angle instead of the S-O-Pt bond angle.

