Article

In-Depth Structural and Optical Analysis of Ce-modified ZnO Nanopowders with Enhanced Photocatalytic Activity Prepared by Microwave-Assisted Hydrothermal Method

1
Department of Materials Science and Metallurgical Engineering and Inorganic Chemistry, University of Cadiz, 11003 Cadiz, Spain
2
Department of Physics, Abdelmalek Essaadi University Faculty of Science and Technology of Tangier FST, 93000 Tangier, Morocco
3
Department of Materials Physics, Complutense University of Madrid, 28040 Madrid, Spain
*
Author to whom correspondence should be addressed.
Catalysts 2020, 10(5), 551; https://doi.org/10.3390/catal10050551
Submission received: 29 March 2020 / Revised: 9 May 2020 / Accepted: 12 May 2020 / Published: 15 May 2020
(This article belongs to the Special Issue Heterogeneous Photocatalysis: A Solution for a Greener Earth)

Abstract

:
Pure and Ce-modified ZnO nanosheet-like polycrystalline samples were successfully synthesized by a simple and fast microwave-based process and tested as photocatalytic materials in environmental remediation processes. In an attempt to clarify the actual relationships between functionality and atomic scale structure, an in-depth characterization study of these materials using a battery of complementary techniques was performed. X-ray diffraction (XRD), field emission-scanning electron microscopy (FE-SEM), high-resolution transmission electron microscopy (HRTEM), high-angle annular dark field-scanning transmission electron microscopy (HAADF-STEM), energy-dispersive X-Ray spectroscopy-scanning transmission electron microscopy (STEM-XEDS), photoluminescence spectroscopy (PL) and UV–Visible absorption spectroscopy were used to evaluate the effect of Ce ions on the structural, morphological, optical and photocatalytic properties of the prepared ZnO nanostructures. The XRD results showed that the obtained photocatalysts were composed of hexagonal, wurtzite type crystallites in the 34–44 nm size range. The SEM and TEM showed nanosheet-shaped crystallites, a significant fraction of them in contact with bundles of randomly oriented and much smaller nanoparticles of a mixed cerium–zinc phase with a composition close to Ce0.68Zn0.32Ox. Importantly, in clear contrast to the prevailing proposals regarding this type of materials, the STEM-XEDS characterization of the photocatalyst samples revealed that Ce did not incorporate into the ZnO crystal lattice as a dopant but that a heterojunction formed between the ZnO nanosheets and the Ce–Zn mixed oxide phase nanoparticles instead. These two relevant compositional features could in fact be established thanks to the particular morphology obtained by the use of the microwave-assisted hydrothermal synthesis. The optical study revealed that in the ZnO:Ce samples optical band gap was found to decrease to 3.17 eV in the samples with the highest Ce content. It was also found that the ZnO:Ce (2 at.%) sample exhibited the highest photocatalytic activity for the degradation of methylene blue (MB), when compared to both the pure ZnO and commercial TiO2-P25 under simulated sunlight irradiation. The kinetics of MB photodegradation in the presence of the different photocatalysts could be properly described using a Langmuir–Hinshelwood (LH) model, for which the ZnO:Ce (2 at.%) sample exhibited the highest value of effective kinetic constant.

Graphical Abstract

1. Introduction

Nowadays, extensive efforts and various strategies have been developed to control the increasing amounts and variety of water pollutants linked to the disposal of industrial waste. In this context, semiconductor photocatalysis technology has attracted substantial interest as an effective approach for the degradation of different hazardous compounds present in polluted waters [1,2]. Among the various semiconductor photocatalysts, ZnO has drawn widespread interest owing to its exceptional features, as its wide optical band gap at room temperature (3.3 eV), large exciton binding energy (60 meV) and low cost coupled with its non-toxicity and availability [3,4,5,6,7]. Moreover, ZnO has proved its high potential to be exploited in a wide range of technological applications such as sensing [8], optoelectronic devices [9,10], transparent electronics [11] and in particular, as a photocatalyst to completely eliminate a variety of hazardous organic molecules under UV/solar irradiation [12].
However, regarding the photocatalytic applications, ZnO presents some drawbacks. These include the high recombination probability of the photogenerated electron–hole (e-/h+) pairs. This process inhibits the diffusion of the separated charge carriers to reach the surface of ZnO, thus deteriorating its photocatalytic efficiency [13]. Moreover, early studies have reported the activity deterioration of ZnO photocatalysts, ascribed to the photo-dissolution of ZnO. Neppolian et al. [14] noticed a decrease in the activity of ZnO photocatalysts and it was found to be due to photo-dissolution by self-oxidation. Kong et al. [15] investigated the photocatalytic performance of Ta-doped ZnO. Their finding revealed that the photocatalytic activity was negatively affected at a low pH which was due to the photo-dissolution of ZnO.
The use of rare earth as dopants (such as Ce, Tb, La, Nd and Eu) [16,17,18,19] has raised great interest as a route to enhance the electrical and luminescent properties of ZnO in order to overcome the mentioned drawbacks. In particular, Ce has attracted significant attention because of its proved capacity to trap the photoinduced charge carriers due to its unique 4f-electronic configuration and the defects introduced in the ZnO matrix as a consequence of the doping process [20,21,22]. For instance, Ismail et al. [23] reported the successful preparation of Ce-doped ZnO via a hydrothermal route and its high photocatalytic performance towards methylene blue (MB) oxidation under UV irradiation. Similarly, Shi et al. [24] reported the important role of Ce doping on improving the luminescence properties of Ce-doped ZnO obtained by a sol–gel process. On the other hand, Subash et al. [25] synthesized a Ce-doped Ag–ZnO material by a solvothermal route, which showed a photocatalytic activity in the degradation of Naphthol blue black dye under visible excitation, higher than that of the undoped and commercial ZnO, TiO2–P25 and Ag–ZnO. As in the previous works, Liang et al [26] attributed the enhanced visible light absorption ability of ZnO/Ce to the formation of defects which can act as photoelectron trap centers due to the incorporation of Ce into the ZnO lattice. In all of these studies the photocatalytic performance of ZnO/Ce was found to be ameliorated but a detailed study about the presence of Ce as a dopant into the ZnO host structure was not provided. In this respect, Cerrato et al. [27] reported on a visible light active CeO2–ZnO photocatalyst prepared via precipitation, where it was shown that Ce did not enter as dopant in ZnO but rather formed isolated CeO2 nanoparticles deposited on the surface of the zinc oxide crystallites. Moreover, a specific approach was applied by Cerrato et al. to monitor and quantify the charge separation of the Ce–ZnO materials. However, neither detailed optical studies nor photocatalysis tests were performed in that contribution. An analytical study of the Ce-containing phase deposited onto the surface of ZnO was not performed either. In fact, the identification of the CeO2 phase was done based on measurements of lattice spacing values on high-resolution transmission electron microscopy (HRTEM) images. In a more recent paper [28], the formation of nanosized CeO2/ZnO heterojunctions have also been proposed to rationalize the optical and photocatalytic performance of Ce-modified ZnO materials with Ce contents below 10 at.%. In this case, the composition of the Ce-containing phase decorating the surface of the ZnO aggregates was investigated by means of energy-dispersive X-Ray spectroscopy-scanning transmission electron microscopy (STEM-XEDS). Nevertheless, the complex structure of the material, formed by the assembly of a large number of ZnO sheets into micron-sized spheres decorated on the surface by Ce-containing nanosized crystallites, made it impossible to isolate the energy-dispersive X-Ray spectroscopy (XEDS) signal coming from the ZnO support from that of the supported Ce phase. Once again, in this paper the assignment of the Ce-containing phase was done on the basis of d-spacing measurements on HRTEM images.
Summarizing the previously reported data, there is still some controversy about the incorporation of Ce into the host lattice of ZnO. Likewise, the actual chemical nature of the Ce-containing phase, which some authors detect as giving rise to a heterojunction type system, is to date not fully clear.
To clarify these two major questions, an in-depth characterization by both structural and analytical techniques at the sub-nanometer and atomic scale is compulsory. It is anyhow clear that the synthesis procedures may have a quite important effect on the final structure of these Ce-modified nanomaterials. Concerning the synthesis techniques, several routes have been tested to enhance the properties of pure and rare earth (RE)-doped ZnO-based materials with various morphologies, such as pyrolysis [29], hydrothermal synthesis [30], magnetron co-sputtering deposition [16], sonochemical synthesis [31] or pulsed laser deposition [32]. In fact, most published surveys involve expensive, time consuming procedures which usually require high-temperature conditions. However, as far as we know, the preparation of the Ce-modified ZnO photocatalysts via a microwave-assisted hydrothermal process and the characterization of their photocatalytic performance under simulated sunlight irradiation have to date not been reported, despite the very interesting features which characterize this route, such as low cost, short synthesis times and mild temperature conditions. Therefore, in this work we used this approach in the synthesis of Ce/ZnO photocatalysts. In addition, a detailed study, by means of scanning and conventional transmission electron microscopy techniques, was carried out to exactly determine the actual distribution of the lanthanide within the materials prepared by this alternative route.
In particular, we focused on the optimization of the synthesis conditions of Ce-modified ZnO photocatalysts. The structural characterization of the obtained products, by X-ray diffraction (XRD), scanning electron microscopy (SEM) and by scanning transmission electron microscopy, (S)TEM, as well as by optical techniques, like photoluminescence spectroscopy (PL) at room temperature, were also carried out. Additionally, the photocatalytic performances of TiO2–P25, ZnO and the microwave-assisted hydrothermal Ce-modified ZnO photocatalysts under simulated sunlight irradiation were compared.

2. Results and Discussion

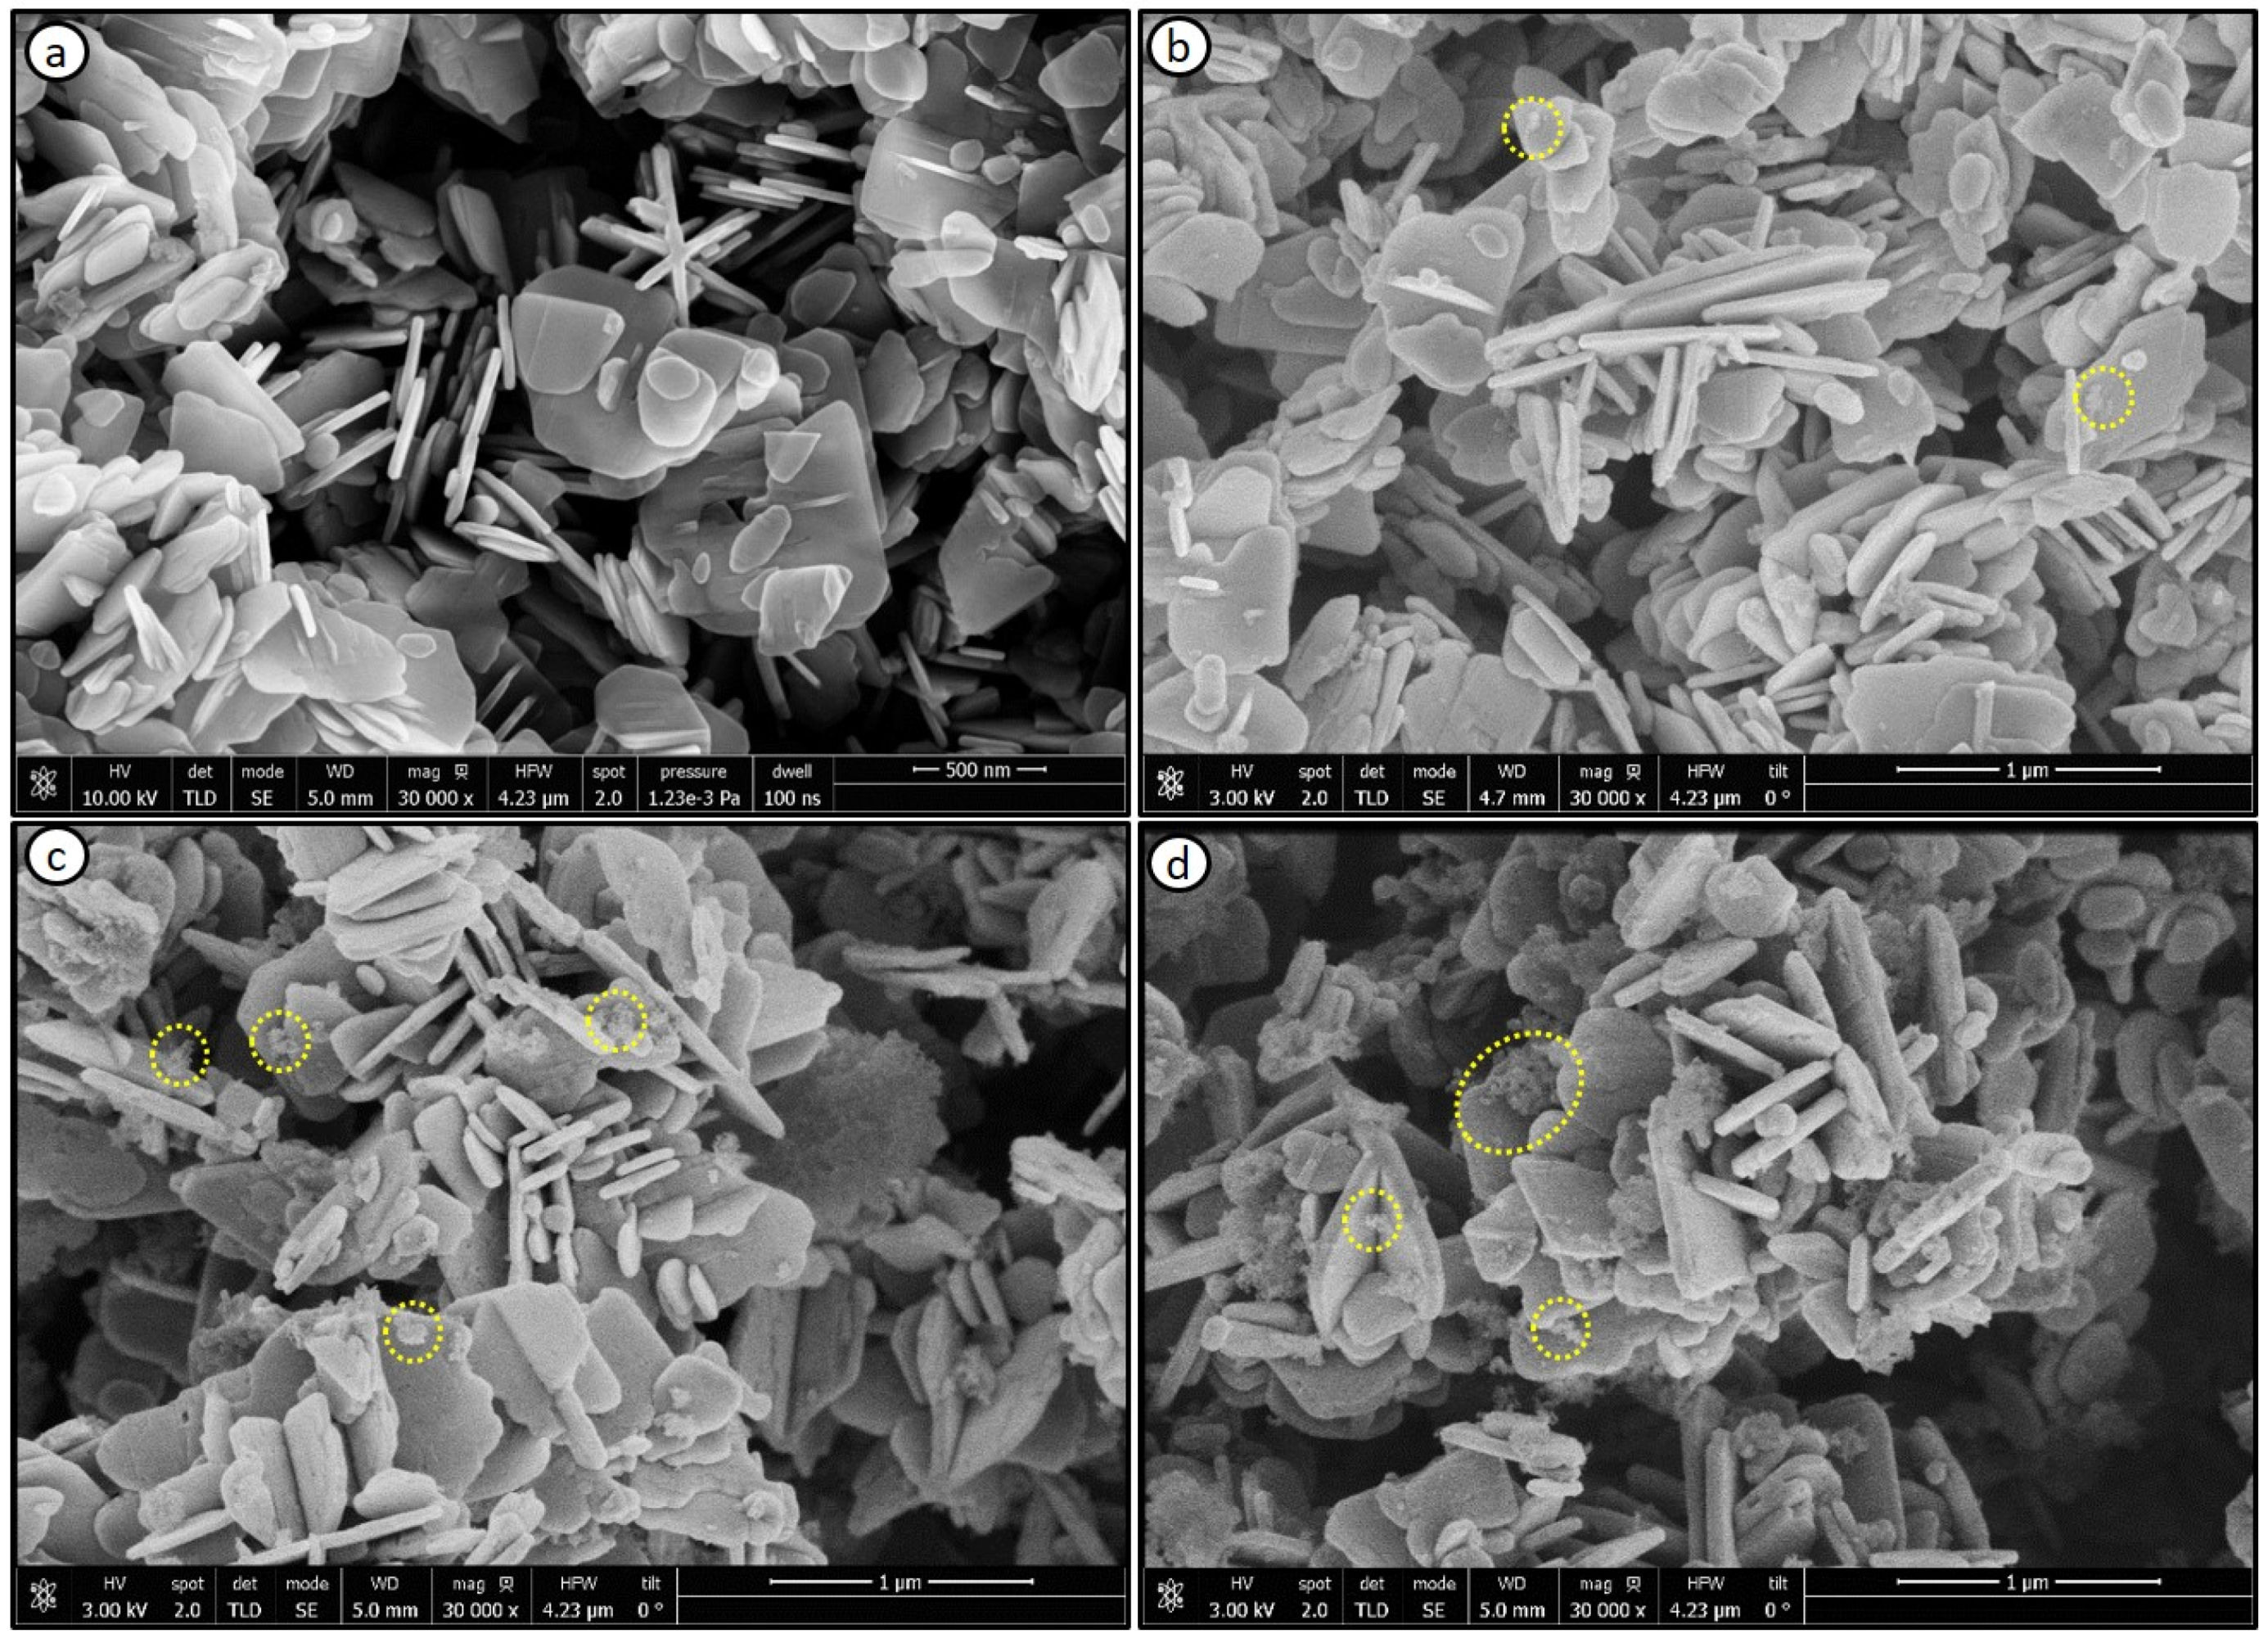
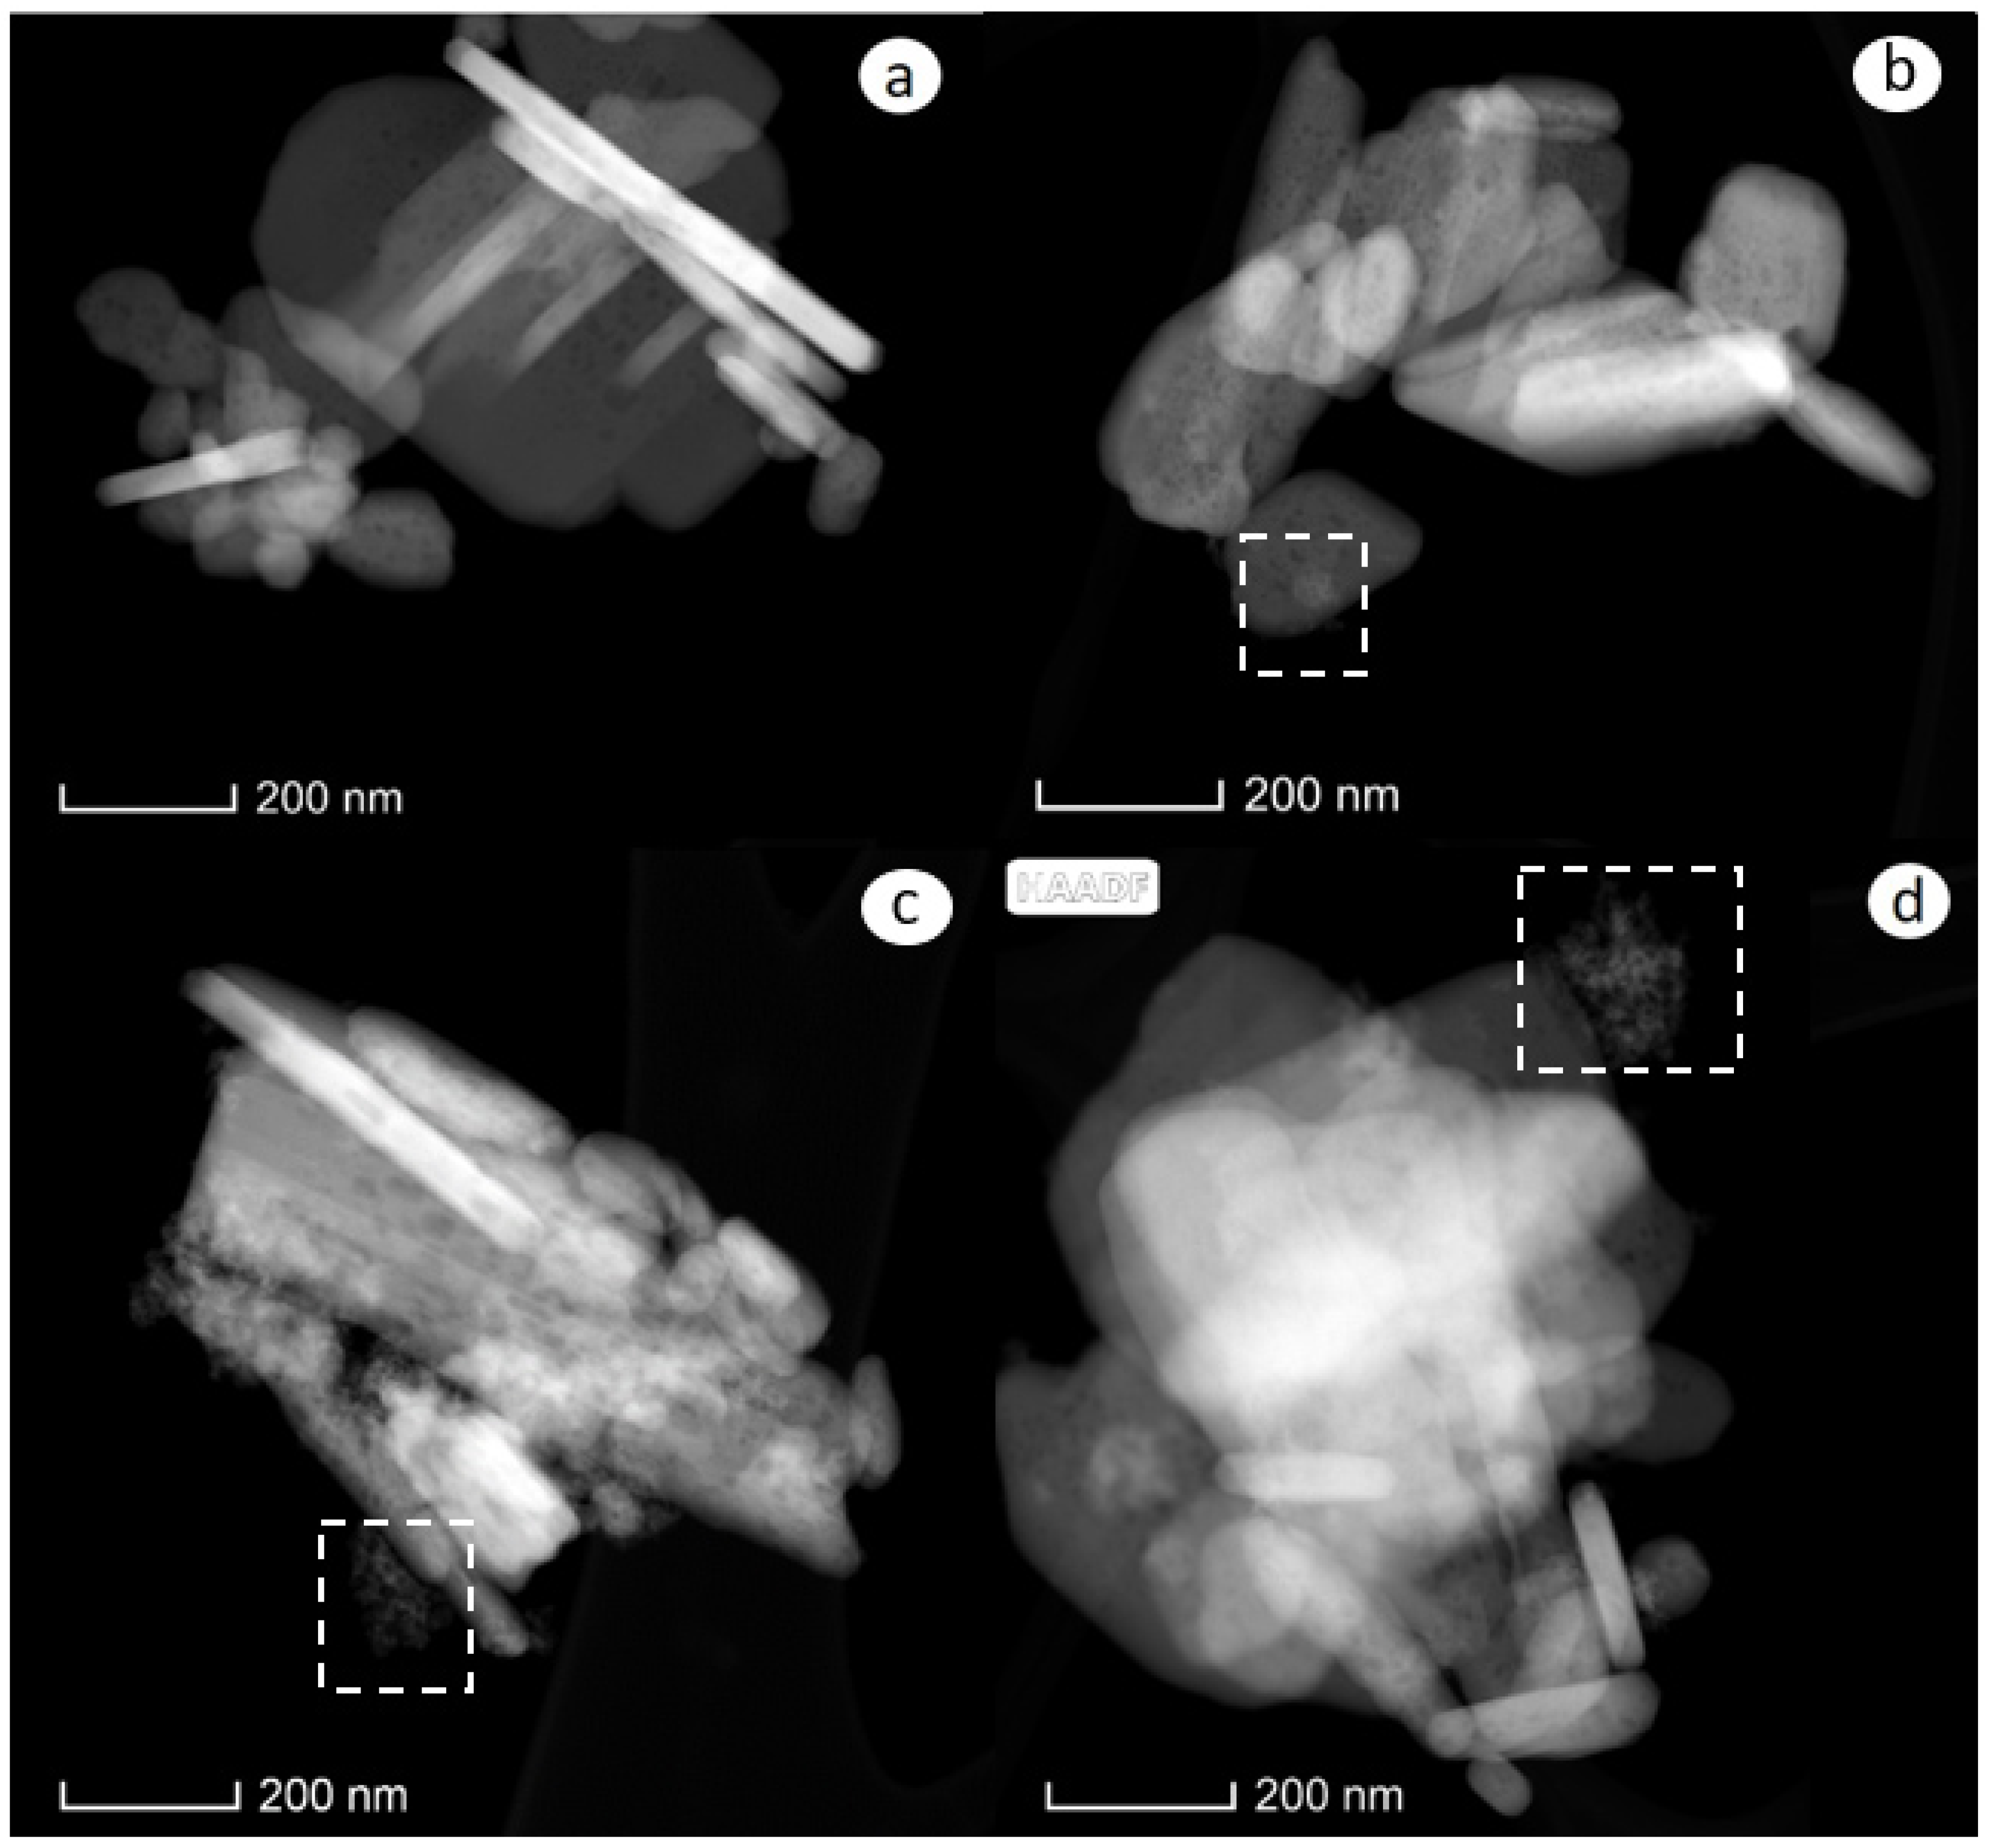
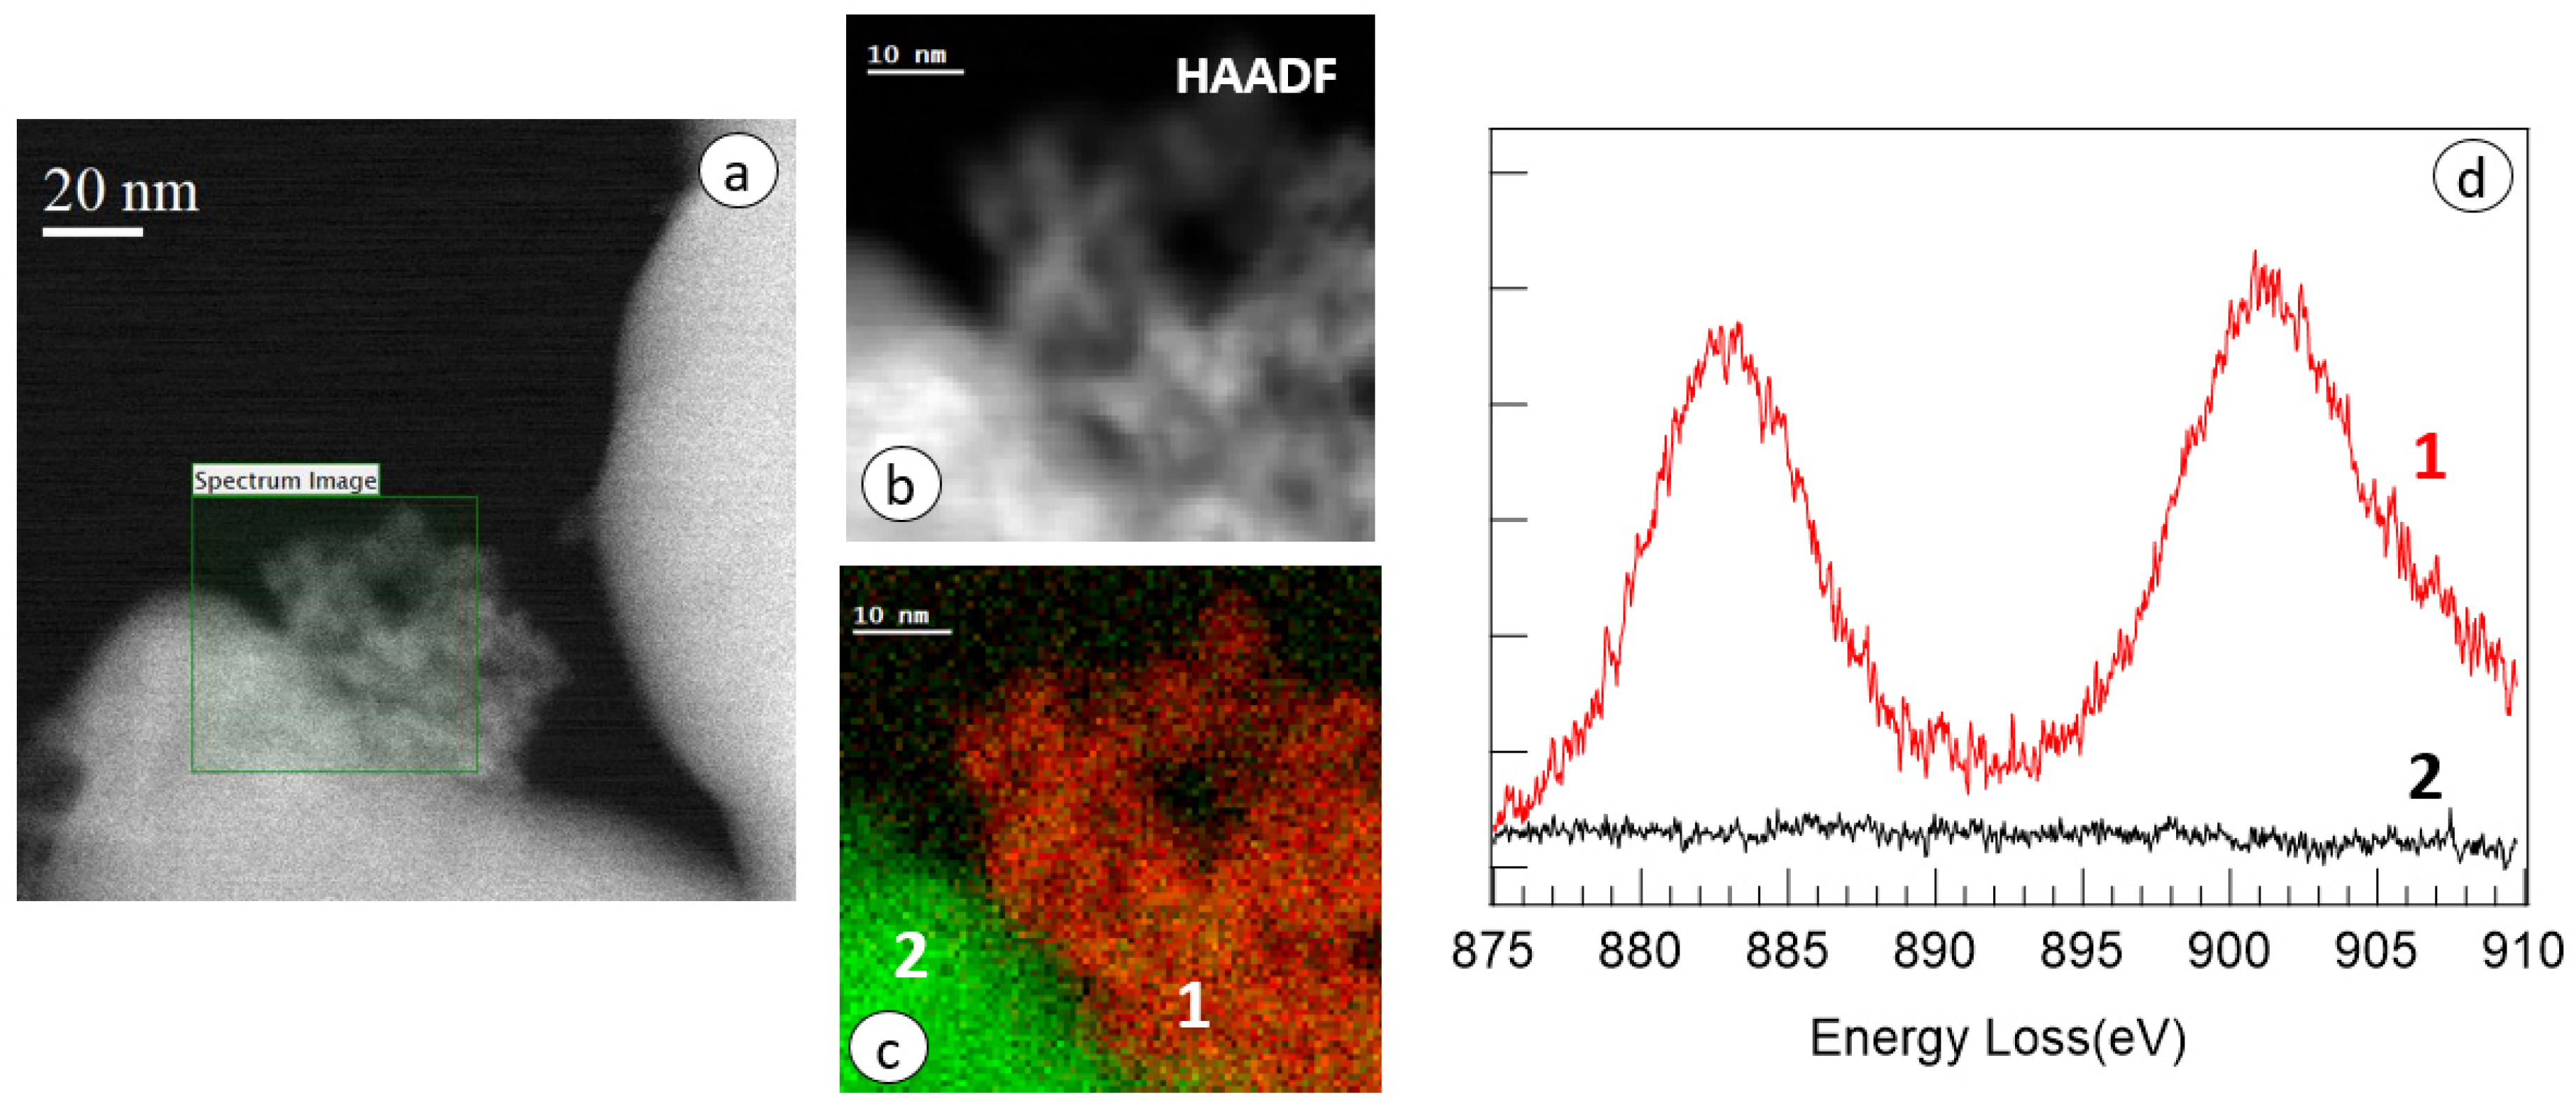
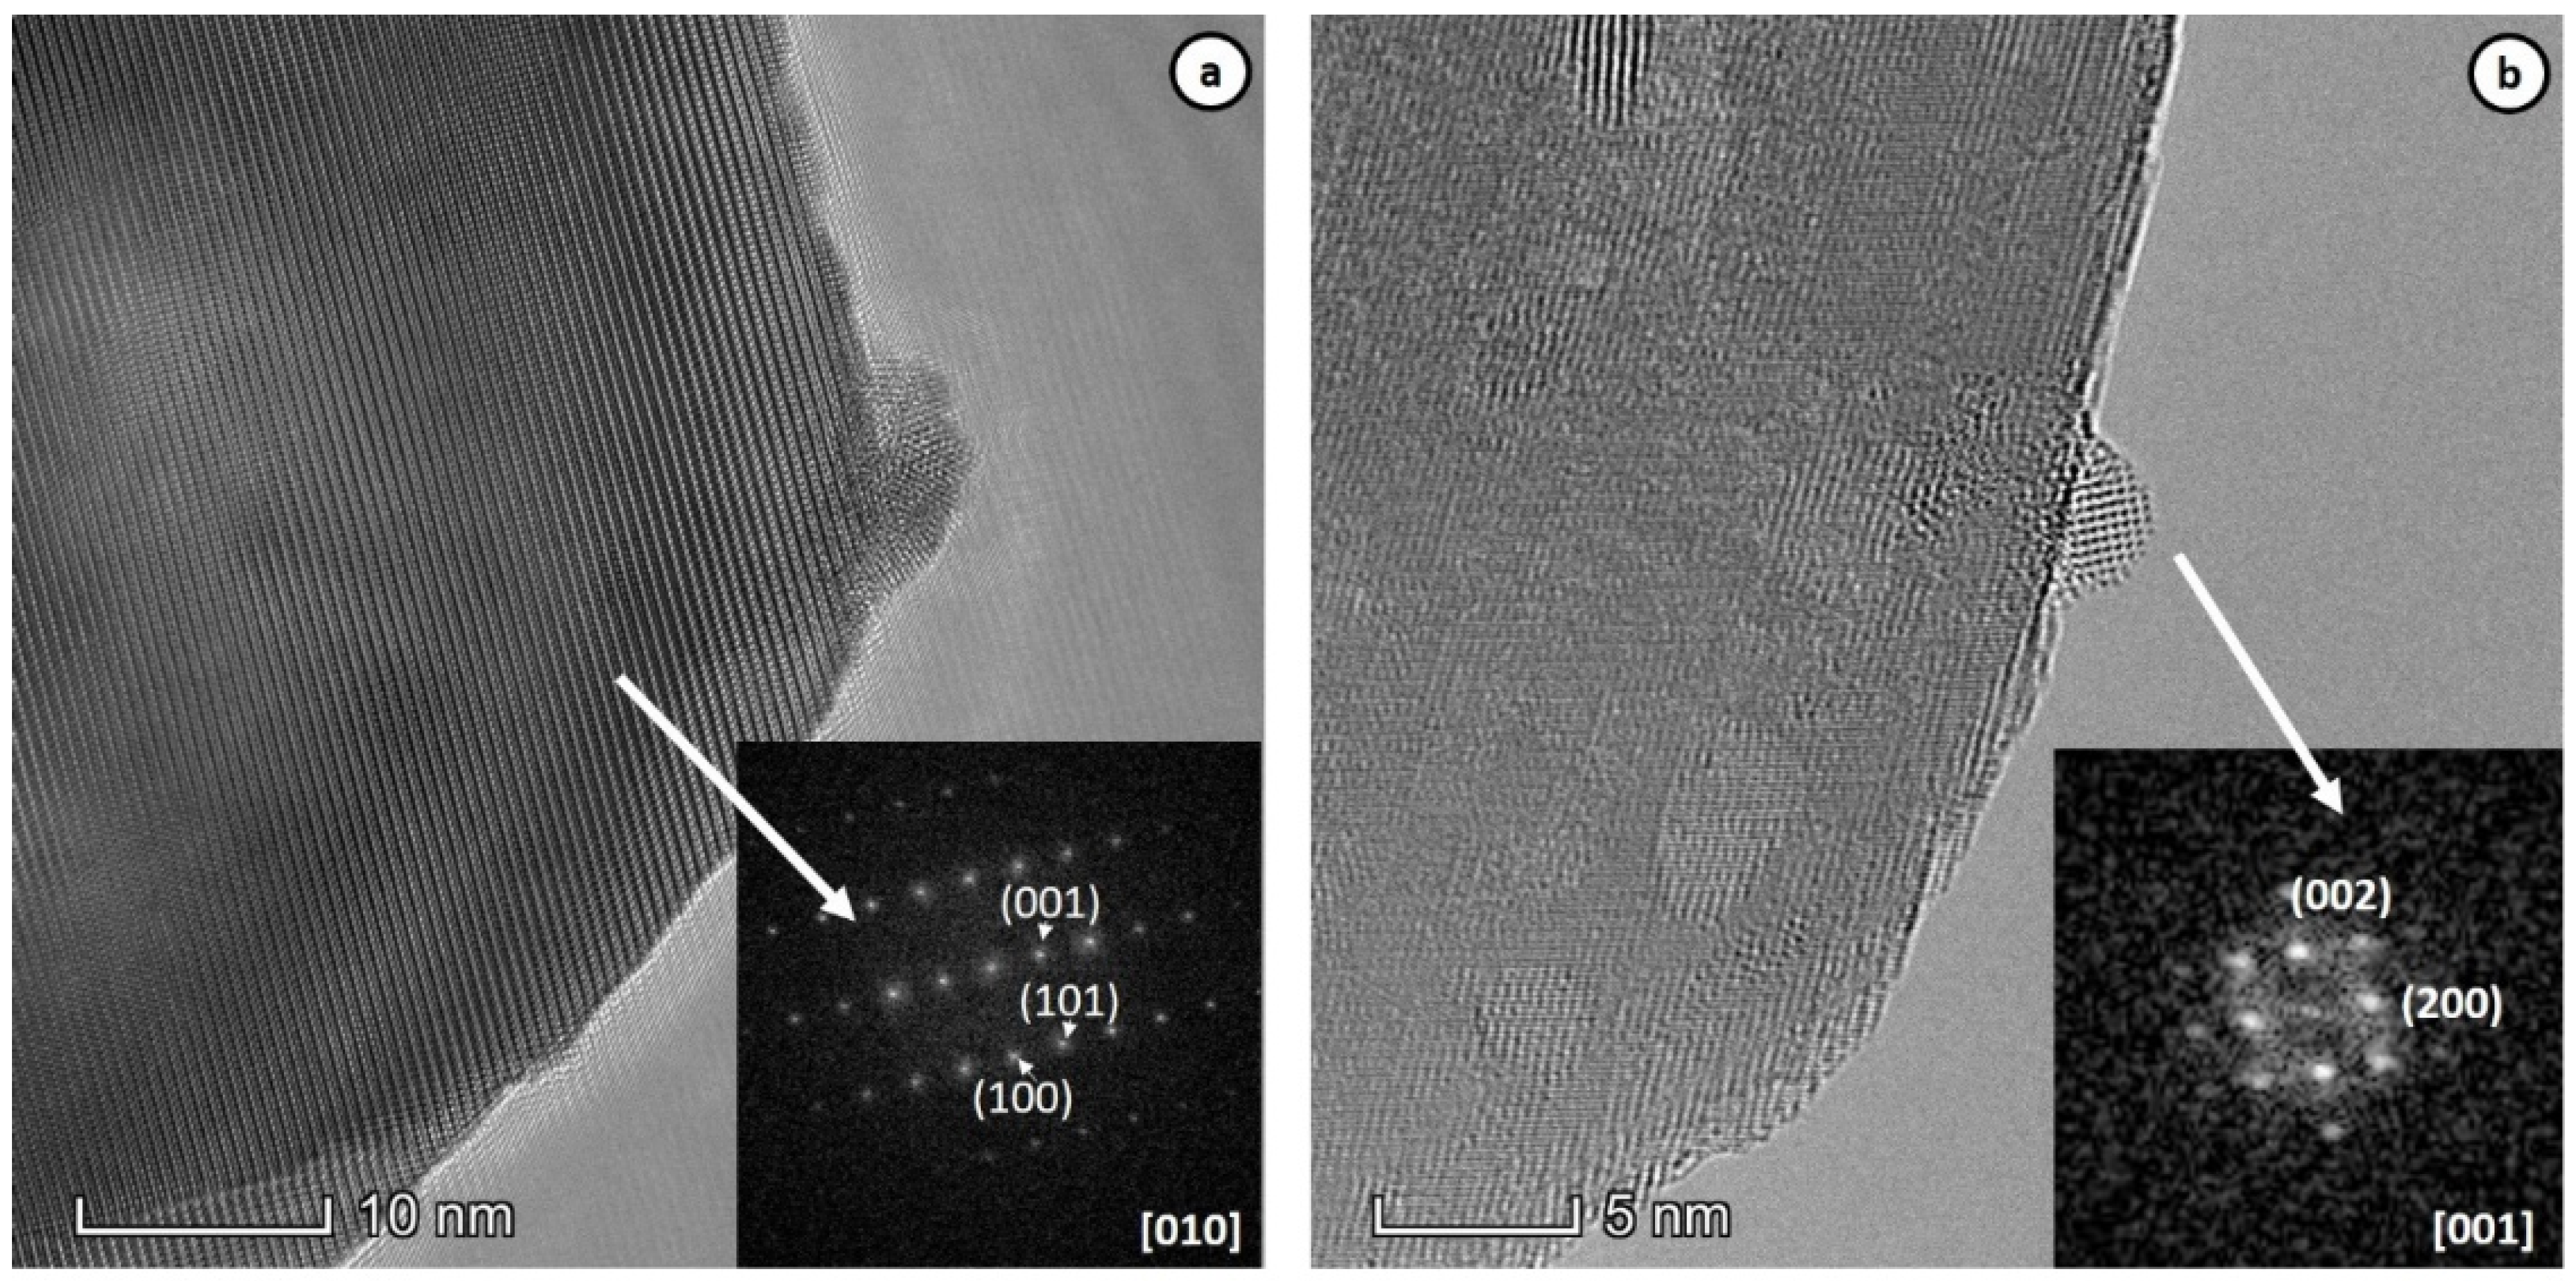
2.1. Structural Properties

Figure 1a shows the XRD patterns of the pure and Ce-modified ZnO photocatalysts. All the identified peaks in the different samples correspond to the hexagonal wurtzite lattice structure of ZnO (JCPDS No. 36-1451). In samples with low cerium concentration (1% and 2%), no diffraction maxima corresponding to the phases related to cerium are observed. This fact does not rule out the possibility that this type of phases was present, since they could have formed at a concentration and size too low to be detectable in the X-ray diffraction experiment. In the case of ZnO:Ce 3%, a weak peak was detected at 2θ = 28.81° (see Figure 1b) corresponding to the (111) plane of the cubic fluorite CeO2 structure [33], indicating that at least part of the cerium content was not incorporated into the structure of ZnO.
In general, the samples show intense wurtzite structure diffraction maxima, indicating a crystalline nature in all the samples. A slight broadening of the XRD peaks was noticed in the modified samples suggesting the formation of crystals with smaller sizes with respect to the pure ZnO. The Scherrer formula was applied to the XRD patterns to quantify the influence of Ce on the ZnO crystallite size.
The crystallite size of the different samples was calcluated through a complete analysis of the XRD diagram by refining using PowderCell. The following crystalline domain (Table 1) size values were obtained including in the analysis the whole set of diffraction peaks:
The morphology of the ZnO and Ce-modified ZnO photocatalysts was investigated by FE-SEM and the obtained results are displayed in Figure 2a–d. The SEM images clearly reveal the growth of smooth, randomly distributed nanosheets in the 500 nm–1 µm size range with thicknesses around 50 nm. The incorporation of different amounts of Ce leads to the appearance of small agglomerates of a porous structure on the smooth ZnO nanosheets (Ce-containing aggregates are highlighted within Figure 2).
In order to determine the nature of these new structures and their interaction with the ZnO sheets, it is essential to perform a study by means of transmission electron microscopy to obtain both the structural information using the HRTEM and the compositional information using the STEM-XEDS. The observations via STEM are fully consistent with the SEM analysis in terms of morphology and the dimensionality of the different components of the samples. Thus, it is clear from the STEM images that the pure ZnO photocatalyst presents a nanosheet morphology, as shown in Figure 3a, whereas in the case of the Ce-modified ZnO photocatalysts, shown in Figure 3b–d, very small heterogeneously-distributed aggregates are observed on the surface of the ZnO nanosheets with regions showing a high concentration of these nanoparticulated aggregates. White dashed rectangles have been added in Figure 3b–d to show some of these aggregates, which are mostly in contact with the ZnO sheets, although there is also a minority of them isolated.
In order to characterize the composition of the samples, STEM-XEDS maps were acquired at the different sample locations in each catalyst. In the ZnO sample, as expected, when a compositional map was recorded, like that of the area shown in Figure 4a, the only cation that appears is Zn, both in the image, shown in Figure 4b, and in the spectrum, shown in Figure 4c. In the latter, the only additional signals are those due to oxygen and copper from the grid. The structural characterization of these ZnO oxide sheets by HRTEM is complicated due to their large thickness, unless they are correctly oriented. Figure 4d shows a high-resolution image of the ZnO sample where the typical spacing of the (002) wurtzite plane can be measured.
The analysis of the cerium-modified samples by STEM-XEDS shows analogous results for the specimens with 1%, 2% and 3% cerium so that they are described together for simplicity. When acquiring a map of an area in which both sheets and nanoparticulate aggregates are observed in the high-angle annular dark field-scanning transmission electron microscopy (HAADF-STEM) image, such as those shown in Figure 5a, Figure 6a and Figure 7a, the corresponding maps show that the sheets are rich in Zn (displayed in green on the maps) and the nanoparticulate aggregates are rich in cerium (displayed in red on the maps). Figure 5b–d, Figure 6b–d and Figure 7b–d show the maps of Ce, Zn and the combination of both elements for the samples with 1%, 2% and 3% cerium, respectively. Once the maps were acquired it was possible to extract the sum spectrum of all the spectra acquired in each of the pixels contained in a selected area and thus determine and quantify which elements were present in that area. In the three samples containing cerium, when an area was chosen where there was apparently only Zn, i.e., an area where green predominated, such as the areas selected with a yellow square in Figure 5d, Figure 6d and Figure 7d—the spectra show only the presence of O, Zn and Cu, as shown in Figure 5e, Figure 6e and Figure 7e for the ZnO:Ce 1%, 2% and 3% samples, respectively. When these spectra are quantified, small amounts of cerium appear, always below 0.1 at.%. Therefore, although this may at first sight suggest that a tiny amount of cerium (<0.1%) has entered the structure of zinc oxide as a dopant, the absence of peaks corresponding to cerium in the XEDS spectra seems to indicate that these amounts of cerium correspond in all cases to the background of the XEDS spectrum. In fact, the quantification of the amount of cerium present in the sample that contained only ZnO, resulted in similar lanthanide amounts (lower than 0.1%), which confirmed that these signals corresponded to the background of the XEDS spectrum. The results of these analyses, as well as those performed on some of the spectra showing the absence of peaks corresponding to cerium, are shown in Figure 2 of the supporting information (Figure S2). Accordingly, STEM-XEDS indicates that the wurtzite phase was made up of pure ZnO.
However, the most interesting part of the XEDS maps relates to the analysis of the cerium-rich areas, displayed in red on the images. The quantification of the areas marked with blue squares and their corresponding spectra, shown in Figure 5f, Figure 6f and Figure 7f for the ZnO:Ce 1%, 2% and 3% samples, respectively, reveals in all cases that these areas contained both cerium and zinc. Figure 3 of the supporting information shows that the analysis of 25 of these areas belonging to the three samples with different cerium contents provides an average Zn:Ce ratio of 0.47, i.e., very close to 1:2, corresponding to an oxide with the composition Ce0.68Zn0.32Ox. Therefore, in the preparations described in the present article when the precursors of zinc and cerium were added simultaneously into the microwave-assisted hydrothermal synthesis, the nanoparticles of a mixed phase of cerium and zinc with a Zn:Ce atomic ratio of 1:2 formed in parallel with the growth of pure ZnO nanosheets. The former was heterogeneously distributed on the surface of the ZnO crystallite, giving rise to a network of ZnO–Ce0.68Zn0.32Ox contacts or nano-heterojunctions. A sample with the composition Ce0.68Zn0.32Ox was prepared under similar conditions. The obtained sample was analyzed by electron microscopy in HRTEM, HAADF-STEM and STEM-XEDS modes. It was observed that the sample was made up of the small crystals (3–5 nm) of a mixed oxide phase (see Figure S7), with a composition of approximately Ce0.85Zn0.15Ox, and nanoflakes containing only ZnO and the ZnO nanoflakes being a minority in this sample. In addition, the XEDS maps of one of the areas with mixed cerium–zinc oxide nanoparticles are shown (see Figure S8). It can therefore be seen that the synthesis method and conditions used did not lead to a single-phase product comprising only the Ce/Zn mixed oxide.
It is important to recall at this point that the synthesis of Zn–Ce mixed oxides has been described in the literature [34], showing a solubility limit for Zn in CeO2 between 20 and 30 mol % in particles of about 5 nm in diameter. In the samples prepared in this work, the size of the nanoparticles of the Ce–Zn phase was even smaller, around 3 nm, as can be clearly seen in Figure 9b, which may have modified the solubility limit of Zn to slightly higher values, around 32 mol %. The formation of nanocomposites in which small crystals of a CeO2 rich phase are deposited on ZnO larger size crystals has been reported in the literature after a one-pot hydrothermal synthesis [35], though in this case a compositional analysis of the cerium-rich phase was not performed, so the exact composition of these nanoparticles was not determined but was assumed to correspond to pure CeO2. Additional XEDS maps of the three samples with different cerium loads were included in the supporting information.
An additional study was carried out using electron energy loss spectroscopy (EELS) to verify, with a more sensitive technique capable of detecting even single atoms, the absence of cerium in zinc oxide nanosheets. The EELS experiment was performed working in the spectrum imaging (SI) mode [36], which allows the correlation of the analytical and structural information on selected regions of the material under study. In particular, an area of 56.5 × 54.4 nm was analysed simultaneously acquiring the HAADF (Figure 8b) and EELS signal every 0.6 nm while the electron beam was scanned across the selected area of the sample (green square, Figure 8a). In the case of EELS-SI, the experiment was acquired in DUAL mode, acquiring the zero loss peak and the Ce-M4,5 signal simultaneously using an energy dispersion of 0.025 eV. Figure 8c displays a chemical map, the area in red being where Ce is present. The EELS spectra extracted from area 1 and 2 are displayed in Figure 8d, where the absence of a Ce signal in the green region of Figure 8c is evident, as previously suggested by the XEDS measurements.
In order to determine, in addition to the composition, the structure of the different phases present in the nanocomposite, a HRTEM analysis of the samples was carried out. Figure 9 shows the images corresponding to the sample with an intermediate Ce content, ZnO:Ce 2%. The analysis of the other two specimens provided similar results. Figure 9 shows two areas of the ZnO:Ce 2% sample in which both ZnO sheets and small particles of the mixed Ce–Zn phase appear. In the digital diffraction patterns (DDP) from the larger particle, inset in Figure 9a, the spacing and angle values of the ZnO wurtzite structure can be identified, in this particular case corresponding to a crystallite of this phase along the [010] zone axis. The analysis of the particle placed on the surface of the ZnO crystallite in Figure 9b shows that the spacing values and angles correspond to a crystal with a fluorite structure, just as that of pure CeO2 does, oriented along the [001] zone axis, as indicated in the DDP, shown as inset. The incorporation of Zn into the fluorite-type structure of cerium oxide without distorting the lattice parameters can be possibly accounted for taking into consideration the size of the Zn2+ and Ce4+ cations. Thus, Zn2+ cations, with a radius of 0.74 Å, could incorporate into the positions of the Ce4+ ions, of 0.97 Å. Therefore, when the cerium and zinc precursors are brought into contact, part of the Zn2+ cations could substitute Ce4+ ions or, alternatively, locate at interstitial positions in the CeO2 lattice to form a Ce1-xZnxO2- solid solution. On the contrary, because of its larger size, it is possibly difficult for Ce4+ to enter into the smaller crystalline lattice of ZnO to substitute Zn2+.

2.2. Optical Absorption

UV–Visible absorption spectroscopy studies were performed to examine the influence of the Ce addition on the optical properties of ZnO. Pure and Ce-modified ZnO photocatalysts with increasing Ce contents were dispersed in absolute ethanol and the recorded spectra are shown in Figure 10a. A strong excitonic absorption peak ( λmax) was detected at 380 nm, corresponding to Eex = 3.26 eV, mainly due to the electron transition from O 2p to Zn 3d, corresponding to the band-to-band transition of the ZnO energy band-structure [37], and was calculated using the following formula Eex = hc/λmax, where h is Planck’s constant and c defines the speed of light. The obtained values are summarized in Table 2. The optical band gap was determined by the first derivative of the absorbance with respect to the photon energy model [38], Figure 10b–e. In this method, the optical bandgap value corresponds to the maximum in the derivative spectra at the lower energy sides.
Note that the optical bandgap decreased from 3.46 eV for ZnO to 3.17eV (see Figure 10b–e) for the maximum Ce content. Since the actual nanostructure of the different Ce-modified samples involves varying amounts of two different phases (ZnO and the Ce0.68Zn0.32Ox mixed oxide), the values determined for the band gap at the macroscopic level must be intermediate between the band-gap values of these two components. The value for the pure ZnO sample is 3.46 eV. Though we do not have a value for the pure Ce0.68Zn0.32Ox mixed oxide, as we previously commented it was not possible to prepare it under the same experimental conditions as the rest of the samples, we can take as a reference that of the CeO2 with the fluorite structure as the mixed oxide, which amounts to 3.19 eV. The values we are measuring are in fact in the 3.5–3.2 eV range, which is in good agreement with a mixture of the two components. Moreover, our data indicate a monotonous decrease in the band-gap of the Ce-modified samples with the lanthanide content, which is in good agreement with an increasing content of the Ce0.68Zn0.32Ox mixed oxide phase. This behavior has been already observed for other modified ZnO systems, and has been tentatively attributed to the competition between Moss–Burstein and band renormalization effects [39].

2.3. PL Spectroscopy

Figure 11 displays the PL emission spectra of the pure and Ce-modified ZnO photocatalysts at different Ce contents. The emission peak intensity of the Ce-modified photocatalysts was noticeably decreased when compared to the pure ZnO. This observation could very likely be attributed to the fact that Ce4+ ions may act as electron trapping centers, which could contribute, for example, to inhibit the recombination of free carriers on the surface of ZnO. It is important to recall at this respect the reducibility of Ce4+ ions in CeO2, a key property in most of the applications of this oxide. Likewise, it may also result as relevant the fact that the incorporation of aliovalent (+3 and +2) ions into the host fluorite structure resulted in a large increase in the reducibility of ceria-based mixed oxides with respect to the pure CeO2 [40]. Thus, ZnO:Ce 2 at.% exhibited the lowest emission peak intensity, which can be considered as an optimal Ce concentration for the lowest electron–hole recombination rate. This low PL emission could contribute to improve the photocatalytic performance, as described below.

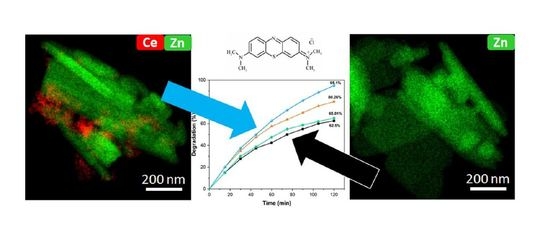
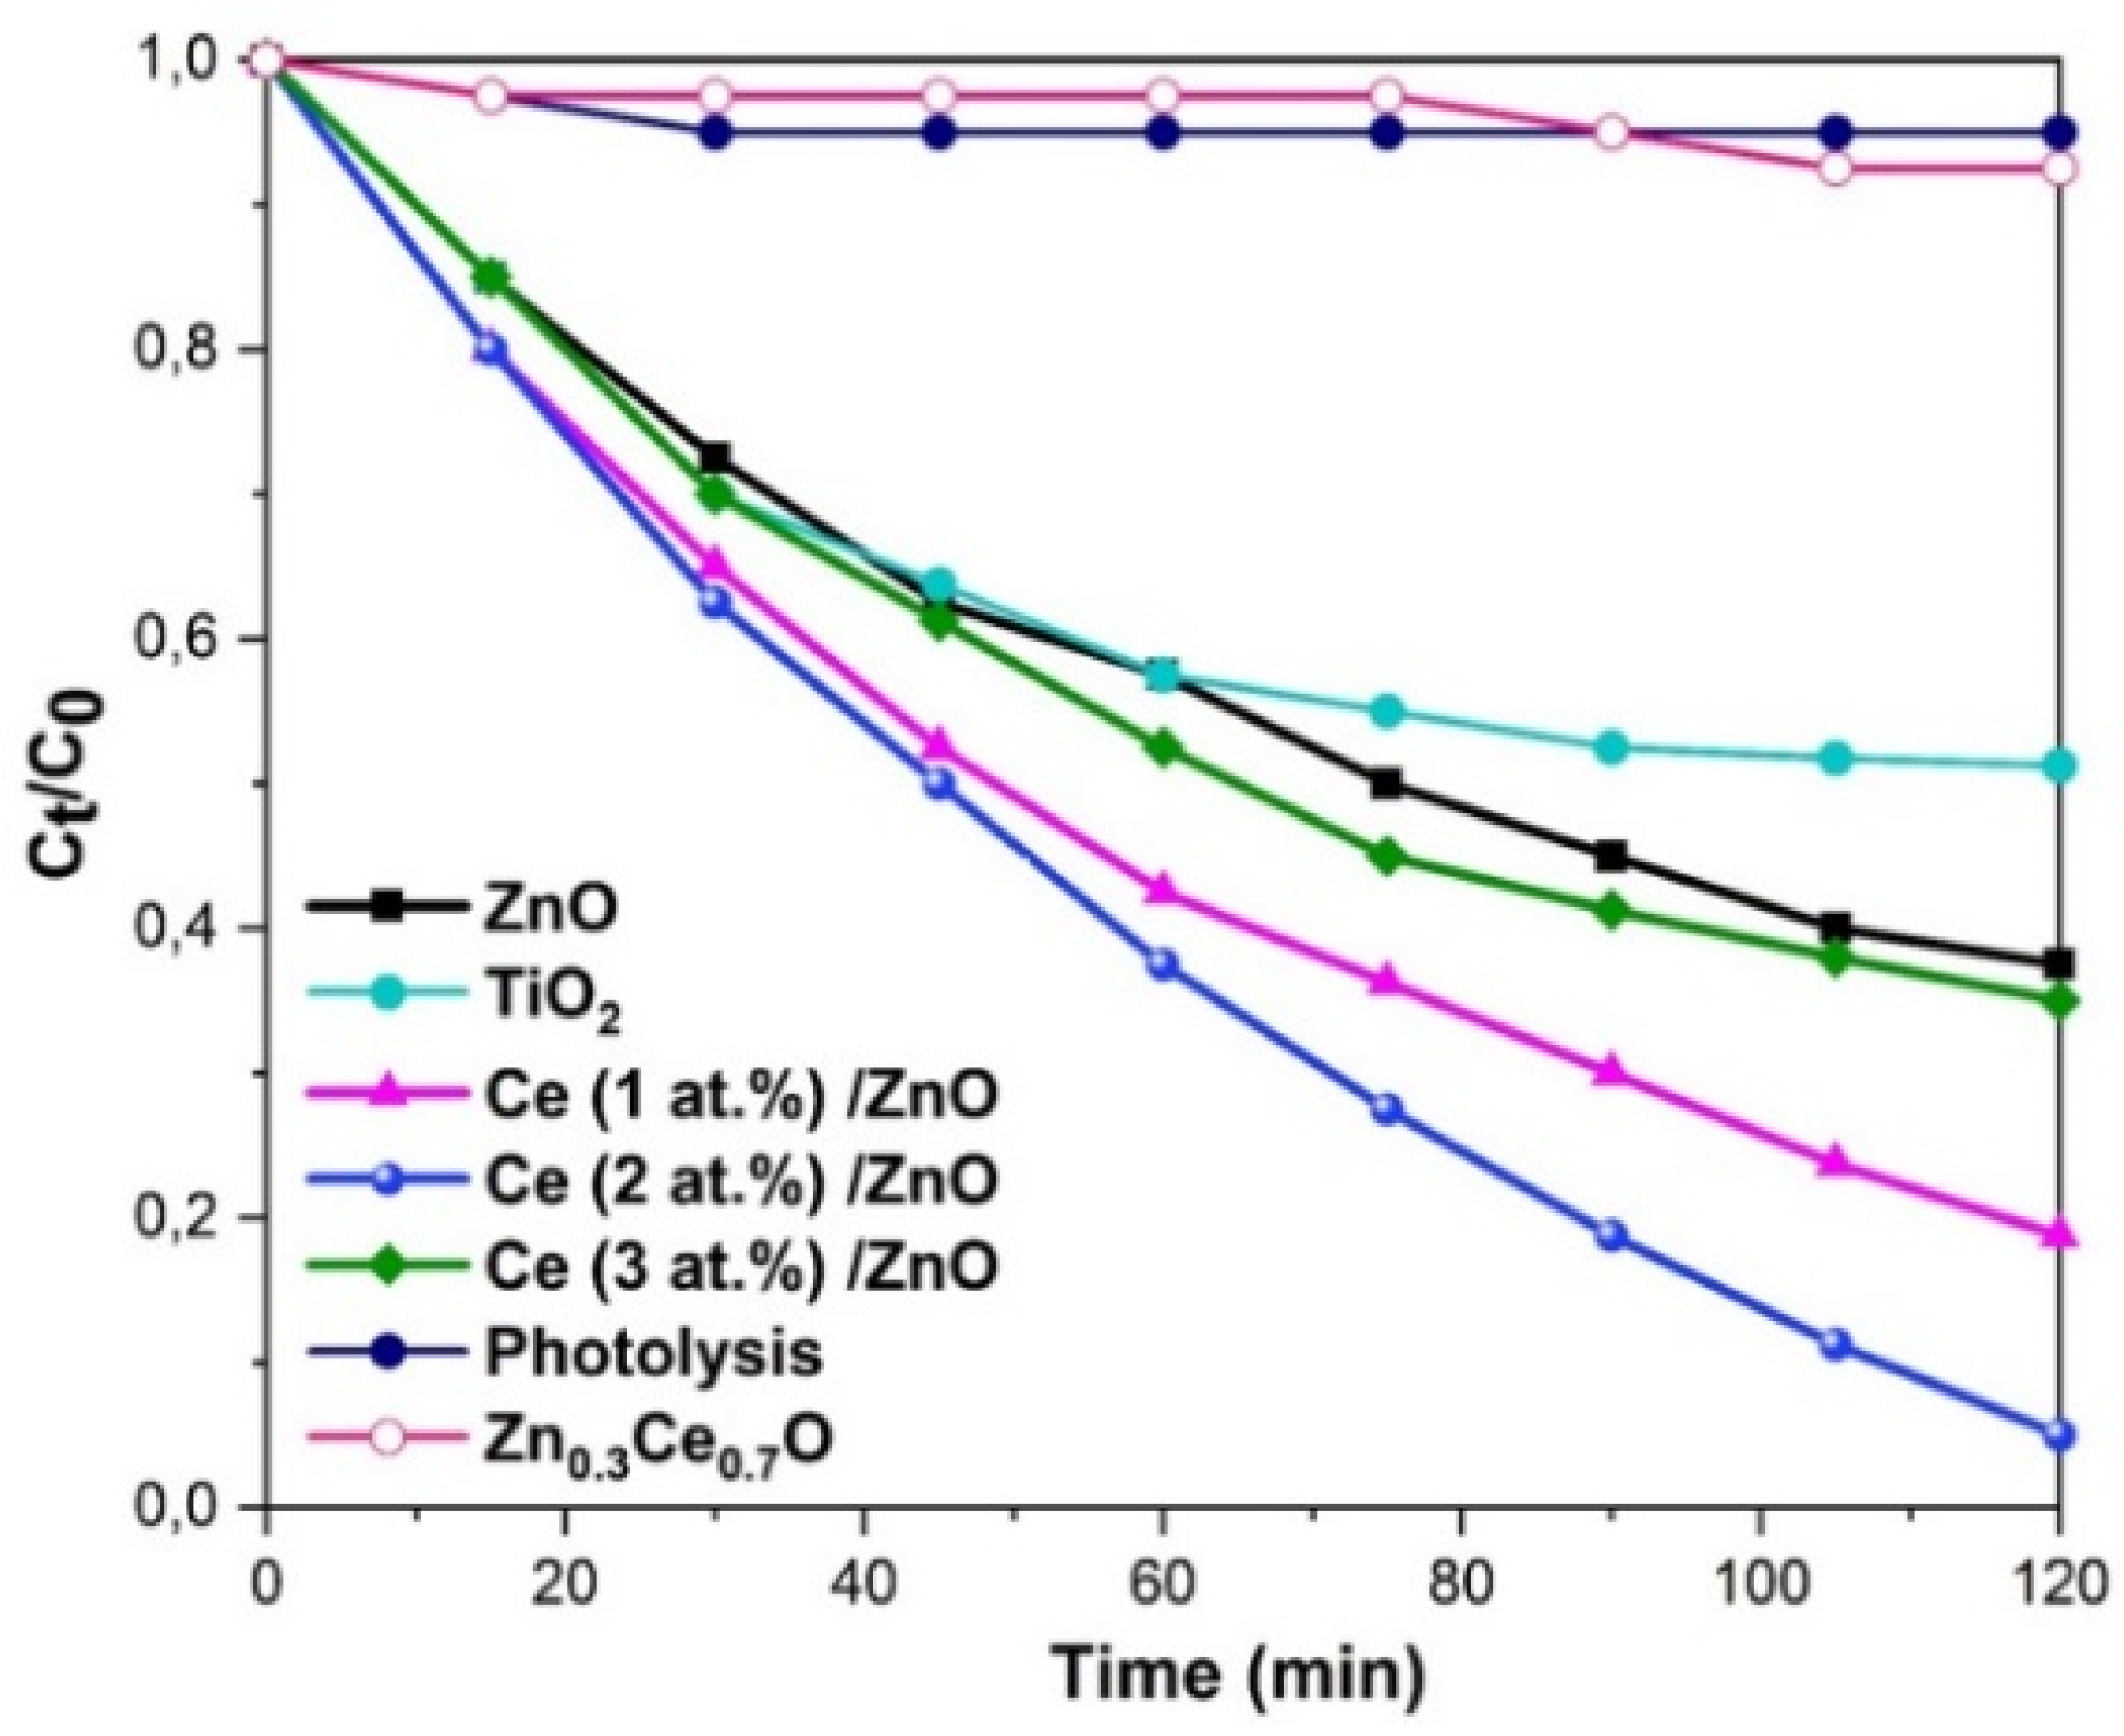
2.4. Photocatalytic Degradation of Methylene Blue by ZnO:Ce Photocatalysts

The photocatalytic activity of the different synthesized photocatalysts was tested for the decolorization of MB under simulated sunlight illumination and subsequently compared with that of the reference commercial TiO2 P-25 at 25 °C. Generally, the degradation of MB leads to the formation of water, sulfate, carbon dioxide and nitrate [41].
Figure S9 a depicts the variation with time of the main absorption band of the target (MB) in the presence of the ZnO:Ce 2 at.% photocatalyst under sunlight illumination. The results show that the intensity of the intense absorption band centered at λmax = 663 nm decreased noticeably during the irradiation process, confirming the potential of the material to decompose MB.
Figure 12 displays the degradation profile of MB in the presence of TiO2 (P25), pure ZnO, Ce-modified ZnO photocatalysts at different Ce contents and Ce0.68Zn0.32Ox under the same experimental conditions. In this plot, C0 and Ct are the concentrations at the adsorption–desorption equilibrium and at time t, respectively. It is clearly observed that all the Ce-modified ZnO photocatalysts exhibited a higher performance towards the decomposition of MB compared to the pure ZnO and TiO2 photocatalysts. The photodegradation percentages of the dye reached about 49%, 63%, 80%, 95% and 65%, for TiO2, ZnO, ZnO:Ce 1%, ZnO:Ce 2% and ZnO:Ce 3%, respectively, after 120 min of irradiation (see Figure S9b). The sample with stoichiometry Ce0.68Zn0.32Ox, but actually showing the Ce0.85Zn0.15Ox phase with some contacts between Ce0.85Zn0.15Ox and ZnO, shows the worst activity of all the samples studied, reaching a photodegradation percentage of 7% after 120 min of irradiation. Interestingly, the ZnO:Ce 2 at.% photocatalyst showed the best decolorization performance. In fact, a 2 at.%. Ce addition almost guarantees a complete removal of the MB concentrations essayed, in good agreement with the expectations posed by the PL results and being probably favored by the larger surface area of this sample compared to the rest. The negligible loss of MB under self-decolorization conditions, i.e., in the absence of any photocatalysts after 120 min irradiation is presented in Figure 12, which clearly shows that the decomposition of MB is due to the photo-activation by ZnO:Ce. Our results also evidence a superior performance of the materials prepared in this work compared to those of other previously reported reference materials [42,43,44].
The Langmuir–Hinshelwood (LH) model was successfully utilized to describe the kinetics of heterogeneous catalytic processes in which an intermediate adsorption of the reactants over the catalytically active phase was required prior to reaction, the latter being the rate-limiting step of the process. The overall reaction rate of the LH model can be expressed by the following equation [45]:
r = d C d t = k 1 K 2   C 1 + CK 2  
where r stands for the rate of reaction that changes with time; k1 and K2 represent the rate (kinetic) and adsorption (thermodynamic) constants, respectively. C is the concentration of the organic pollutant. The integration of the left-hand side of the Equation (1) from t = 0 to t = t and of the right-hand side from the starting concentration C0 to the final concentration C leads to the following equation:
ln ( C 0 / C ) ( C 0 C ) = k 1 K 2 ·   t ( C 0 C ) K 2  
A linear fit of the LH plots (ln(C0/C)/(C0-C) vs. t/(C0-C)) allows one to determine the value of both K2 and k1 from the intercept and slope. Figure S10 shows the LH plots for the MB photodegradation process by the TiO2, ZnO and ZnO:Ce photocatalysts. From the figure it is evident that all the photodegradation tests can be fitted to LH model. The values of the effective rate constant (i.e., the product k 1 · K 2 )   obtained after fitting are summarized in Table 3. From the table, the sample ZnO:Ce 2 at.% is the one that exhibits the highest value of this parameter. As seen from the photocatalytic activity tests, a further increase in Ce content (>2 at.%) leads to a deterioration of the photocatalytic performance of the samples. The results obtained from the fitting to the LH model are fully in line with the presence of a larger surface area (Table 4) and the absorption and photoluminescence findings. In fact, the minimum PL emission in the ZnO:Ce 2 at.% system matches perfectly well with the optimum photocatalytic activity observed for this sample.
With the available information is not possible to suggest a precise mechanism for the photocatalytic process, but from the present results the following, quite relevant facts, to date not clarified in the previously available literature, become clear: (1) the RE dopant does not incorporate into the host lattice of ZnO as reported in a high number of papers; (2) a secondary Ce0.68Zn0.32Ox phase is formed in which the two metals are mixed at the atomic scale but maintaining the fluorite structure of pure CeO2. The formation of this phase has not been detected in any previous study; (3) the Ce-modified materials are formed by agglomerates of the Ce0.68Zn0.32Ox fluorite phase in contact with the surfaces of the ZnO nanosheets, which give rise to Ce0.68Zn0.32Ox/ZnO nano-heterojunctions. Such structure, which has been facilitated by the particular morphology of the ZnO component in the form of isolated nanoplates, is of interest with regards to any further explanation based on DFT calculations or proposals about electronic transfer phenomena across the observed heterojunctions. The precise nature of these heterojunctions is of great importance, as is shown by the fact that the sample with a low number of contacts between Ce0.85Zn0.15Ox and ZnO showed almost negligible activity. The present results show that the improvements in the photocatalytic activities in the ZnO:Ce systems were not related to changes in the band structure of ZnO due to RE dopping or to an interaction between the band structures at the CeO2/ZnO hererojunctions. Similarly, previous DFT calculations to explain changes in band-gap or electron-transfer phenomena through CeO2/ZnO heterojunctions do not apply when rationalizing the observed photocatalytic changes after the modification of ZnO with Ce in our samples. New calculations should be performed that consider a composite ZnO/Ce0.68Zn0.32Ox system in which, at least partially, nanosized heterojunctions between these two phases are formed. This is part of the on-going research in our lab concerning these systems.
At a preliminary level, it could be tentatively hypothesized that the decrease in the band gap in ZnO would allow us to improve the absorption in the UV–Vis range and promote the formation of electron–hole pairs. The contact with the reducible Ce0.68Zn0.32Ox phase would allow us to decrease the recombination of the pairs, through e.g., the trapping of electron by promotion of Ce4+ to Ce3+ transitions, which are well known to be enhanced in mixed ceria-oxides. This separation of the charge carriers would explain the decrease in PL and would also allow the promotion of both the anodic process at the hole trapping sites and the cathodic process, which is very likely at sites neighbored by reduced Ce3+ species, since these can be easily reoxidised to Ce4+ and close the photocatalytic process.

3. Experimental

3.1. Materials

Zinc acetate dihydrate (Zn(O2CCH3)2(H2O)2), cerium nitrate (CeN3O9.6H2O), sodium hydroxide (NaOH), and hexamethylenetetramine (HMT) (C6H12N4) were purchased from Sigma-Aldrich (St.Louis, USA). Methylene blue (MB) was selected as a target organic pollutant and was purchased from Sigma-Aldrich (St.Louis, USA). Milli-Q water was used in all the preparations. All the reagents were used as received without further purification.

3.2. Preparation of Pure and Ce-Modified ZnO Photocatalysts

ZnO and Ce-modified ZnO photocatalysts were prepared via a microwave-assisted hydrothermal process. The preparation procedure of the pure ZnO was as follows: 6 g of zinc acetate and 4 g of HMT were dissolved in 100 mL of MQ water. Then, 50 mL of 0.3 M aq. NaOH solution was added dropwise into the above solution and stirred continuously for 1 h at room temperature. The uniform mixture was ultrasonicated for 1 h. The resultant milky mixture was transferred and sealed in two 100 mL Teflon-lined autoclave reactors and then heated to 180 °C in a microwave oven with a controlled power of 400 W for 18 min. The white precipitates formed were centrifuged and thoroughly washed by repeated centrifugation–redispersion with MQ water and then absolute ethanol. The white precipitates collected were dried in an air oven maintained at 110 °C for 12 h. A similar procedure was applied to prepare Ce-modified photocatalysts with a cationic percentage of cerium of 1%, 2% and 3%, the corresponding samples being designated ZnO:Ce 1%, ZnO:Ce 2% and ZnO:Ce 3%. In this case, the initial zinc acetate and HMT solution also contained the required amounts of the Ce(NO3)3 precursor.

3.3. Characterization

The photocatalysts were characterized by X-ray diffraction (XRD) using a Bruker D8 advance X-ray diffractometer (λ = 0.154056 nm) (Bruker, Billerica, MA, USA). The surface morphology was investigated via scanning electron microscopy (FE-SEM, Nova NanoSEM 450) (Thermo Fisher Scientific, Waltham, MA, USA). Transmission electron microscopy (TEM) was performed with a TEM/STEM FEI Talos F200X G2 microscope, equipped with 4 Super-X SDDs. HAADF-STEM images and XEDS maps were acquired using a high brightness electron probe in combination with a highly stable stage which minimized sample drift. Elemental maps were acquired with a beam current of 100 pA and a dwell time of 50 μs which resulted in a total acquisition time of approximately 12 min (Thermo Fisher Scientific, Waltham, MA, USA). Electron energy loss spectroscopy (EELS) experiments were performed using a double aberration-corrected FEI Titan3 Themis 60–300 microscope operated at 80Kv (Thermo Fisher Scientific, Waltham, MA, USA).
Optical absorption spectra of all the photocatalysts were obtained by dispersing the powders in absolute ethanol and then recorded using a Shimadzu UV-1603 spectrophotometer (Shimadzu corporation, Kyoto, Japan), with absolute ethanol as the reference medium. Photoluminescence (PL) spectra were recorded using a confocal Horiba Jobin Yvon LabRAM HR800 (Horiba, Kyoto, Japan) with a UV He-Cd laser operating at 325 nm as the excitation source. For the determination of the specific area of the different photocatalysts, the nitrogen adsorption–desorption isotherms at 77 K were recorded ( QuantaChrome-Anton Paar, Graz, Austria). The samples were degassed at 250 °C in vacuum prior to the measurements.

3.4. Photodegradation

The photocatalytic activity of the Ce/ZnO photocatalysts was tested by the decolorization of methylene blue (MB) dye under simulated sunlight irradiation. Typically, 25 mg of the photocatalyst was dispersed in 300 mL of a 10 mg/L MB solution. Before irradiation, and to attain the adsorption–desorption equilibrium between the surface of the photocatalyst and the MB, the resulting mixture was stirred for 60 min in the dark and aerated by a pump to provide oxygen and complete mixing of the solution. Subsequently, the solution was continuously irradiated with a Xenon lamp placed approximately 40 cm above the reaction solution (the lamp spectrum is included in Figure 1 of the supporting information section). Then, 5 mL of the suspension were extracted every 15 min and centrifuged at 5000 rpm for 10 min, which was repeated four times to remove the photocatalysts from the suspension. The residual concentration of the MB was evaluated using a UV–Vis spectrophotometer.
The photocatalytic efficiency was estimated through the following formula:
Degradation   ( % ) = C 0 C t C 0 × 100
where C0 corresponds to the initial concentration of the MB dye, and Ct represents the concentration of the MB at different times.

4. Conclusions

In summary, we succeeded in synthesizing a series of Ce-modified ZnO nanosheets which depicted a highly efficient photocatalytic activity using a simple and fast microwave-assisted hydrothermal route. The crystal phase, morphology, elemental composition, optical absorption, photoluminescence and photocatalytic activity of the prepared materials were investigated. The intense diffraction peaks evidenced that the obtained photocatalysts were highly crystalline. A red shift of the optical band gap was revealed by UV–Vis measurements. The PL data confirmed a high charge separation efficiency in these materials. The as-synthesized products exhibited excellent sunlight driven MB photodegradation activity, higher than those of both the ZnO and commercially available TiO2. This improved photocatalytic performance confirms that the ZnO:Ce system offers potential applications for environmental remediation.
The in-depth characterization performed by the STEM techniques revealed some new, structural features which have not been considered in previous works. The present study indicates the absence of ZnO doping by Ce, which forms a Ce0.68Zn0.32Ox mixed oxide phase instead. It is suggested that the unique redox properties of this mixed oxide phase together with the modification in the ZnO band gap and the presence of the ZnO/Ce0.68Zn0.32Ox nano-heterojunctions may explain the improvement in the photocatalytic performance. Finally, this work highlights the key role of advanced STEM techniques in the analysis of this type of photocatalysts, particularly to rationalize their behavior on the basis of structurally meaningful correct data.

Supplementary Materials

The following are available online at https://www.mdpi.com/2073-4344/10/5/551/s1, Figure S1: Emission spectrum of Xenon lamp utilized within the present study. Figure S2: (a)The graph shows the atomic percentages of cerium present in apparently cerium-free zones of samples ZnO, ZnO:Ce1%, ZnO:Ce2%, ZnO:Ce3%, and a sample prepared as a reference consisting in a physical mixture of CeO2 and ZnO (with 2% atomic loading of cerium). An analysis performed in a holey carbon area of the grids free of sample is also considered. All loads, including those acquired in an unmodified ZnO sample, are less than 0.1%. As can be seen in the expanded spectrum shown in image (b), acquired in an area of the ZnO:Ce 2% sample, which shows an atomic cerium content of 0.06%, there is only noise at the position at which the cerium peaks should appear. Figure S3: The graph shows 25 analyses of the atomic Zn/Ce ratio in cerium-rich areas of the three samples modified with different amounts of cerium. The dotted line corresponds to the mean value of 0.47, which corresponds to a composition of the mixed oxide Ce0.68Zn0.32Ox. Figure S4: Sample ZnO–Ce 1% (a) HAADF-STEM image and the XEDS elemental maps showing the spatial distribution of (b) Ce, (c) Zn and (d) both elements together corresponding to the area displayed in (a). Figure S5: Sample ZnO–Ce 2% (a) HAADF-STEM image and the XEDS elemental maps showing the spatial distribution of (b) Ce, (c) Zn and (d) both elements together corresponding to the area displayed in (a). Figure S6: Sample ZnO–Ce 3% (a) HAADF-STEM image and the XEDS elemental maps showing the spatial distribution of (b) Ce, (c) Zn and (d) both elements together corresponding to the area displayed in (a). Figure S7: HAADF-STEM images of the sample at low magnification showing the major polycrystalline aggregates together with the ZnO nanoflakes. Figure S8: Sample ZnO–Ce0.68Zn0.32Ox XEDS elemental maps showing the spatial distribution of (b) Ce, (c) Zn and (d) both elements together corresponding to the area displayed in (a). Figure S9: (a) Absorbance spectra of the MB aqueous solution in the presence of the ZnO:Ce 2% photocatalyst at increasing irradiation times. (b) Photodegradation vs. the irradiation time of different samples. Figure S10: LH plots of the MB degradation by the Ce/ZnO and P25 photocatalysts.

Author Contributions

Conceptualization, O.B., J.J.C. and A.B.H.; methodology, O.B.; investigation, O.B. and S.T.; resources, J.J.C. and A.B.H.; writing—original draft preparation, O.B.; writing—review and editing, A.U., S.T., J.P., P.F., M.A., J.J.C. and A.B.H.; supervision, A.U., P.F. and A.B.H.; project administration, J.J.C. and A.B.H.; All authors have read and agreed to the published version of the manuscript.

Funding

This work was supported by MINECO/FEDER (MAT 2016-81118-P, MAT 2017- 87579-R and RED2018-102609-T. O.B. thanks Aula del Estrecho fellowship.

Conflicts of Interest

The authors declare no conflict of interest.

References

  1. Kostedt IV, W.L.; Ismail, A.A.; Mazyc, D.W. Impact of heat treatment and composition of ZnO-TiO2 nanoparticles for photocatalytic oxidation of an azo dye. Ind. Eng. Chem. Res. 2008, 47, 1483–1487. [Google Scholar] [CrossRef]
  2. Abu Tariq, M.; Faisal, M.; Muneer, M. Semiconductor-mediated photocatalysed degradation of two selected azo dye derivatives, amaranth and bismarck brown in aqueous suspension. J. Hazard. Mater. 2005, 127, 172–179. [Google Scholar] [CrossRef]
  3. Faisal, M.; Khan, S.B.; Rahman, M.M.; Jamal, A.; Asiri, A.M.; Abdullah, M.M. Synthesis, characterizations, photocatalytic and sensing studies of ZnO nanocapsules. Appl. Surf. Sci. 2011, 258, 672–677. [Google Scholar] [CrossRef]
  4. Zhang, H.H.; Pan, X.H.; Li, Y.; Ye, Z.Z.; Lu, B.; Chen, W.; Huang, J.Y.; Ding, P.; Chen, S.S.; He, H.P.; et al. The role of band alignment in p-type conductivity of Na-doped ZnMgO: Polar versus non-polar. Appl. Phys. Lett. 2014, 104. [Google Scholar] [CrossRef]
  5. Masuda, Y.; Kato, K. Aqueous synthesis of ZnO rod arrays for molecular sensor. Cryst. Growth Des. 2009, 9, 3083–3088. [Google Scholar] [CrossRef]
  6. Ong, C.B.; Ng, L.Y.; Mohammad, A.W. A review of ZnO nanoparticles as solar photocatalysts: Synthesis, mechanisms and applications. Renew. Sustain. Energy Rev. 2018, 81, 536–551. [Google Scholar] [CrossRef]
  7. Bazta, O.; Urbieta, A.; Piqueras, J.; Fernández, P.; Addou, M.; Calvino, J.J.; Hungría, A.B. Enhanced UV emission of Li–Y co-doped ZnO thin films via spray pyrolysis. J. Alloy. Compd. 2019, 808, 151710. [Google Scholar] [CrossRef]
  8. Xing, X.; Chen, T.; Li, Y.; Deng, D.; Xiao, X.; Wang, Y. Flash synthesis of Al-doping macro-/nanoporous ZnO from self-sustained decomposition of Zn-based complex for superior gas-sensing application to n-butanol. Sens. Actuators B Chem. 2016, 237, 90–98. [Google Scholar] [CrossRef]
  9. Minami, T.; Miyata, T.; Ihara, K.; Minamino, Y.; Tsukada, S. Effect of ZnO film deposition methods on the photovoltaic properties of ZnO-Cu2O heterojunction devices. Thin Solid Film. 2006, 494, 47–52. [Google Scholar] [CrossRef]
  10. Bazta, O.; Urbieta, A.; Piqueras, J.; Fernández, P.; Addou, M.; Calvino, J.J.; Hungría, A.B. Influence of yttrium doping on the structural, morphological and optical properties of nanostructured ZnO thin films grown by spray pyrolysis. Ceram. Int. 2018. [Google Scholar] [CrossRef]
  11. Heo, Y.W.; Norton, D.P.; Tien, L.C.; Kwon, Y.; Kang, B.S.; Ren, F.; Pearton, S.J.; Laroche, J.R. ZnO nanowire growth and devices. Mater. Sci. Eng. R Rep. 2004, 47, 1–47. [Google Scholar] [CrossRef]
  12. Wahab, R.; Tripathy, S.K.; Shin, H.S.; Mohapatra, M.; Musarrat, J.; Al-Khedhairy, A.A.; Kumar Kaushik, N. Photocatalytic oxidation of acetaldehyde with ZnO-quantum dots. Chem. Eng. J. 2013, 226, 154–160. [Google Scholar] [CrossRef]
  13. Lu, Y.; Lin, Y.; Wang, D.; Wang, L.; Xie, T.; Jiang, T. A high performance cobalt-doped ZnO visible light photocatalyst and its photogenerated charge transfer properties. Nano Res. 2011, 4, 1144–1152. [Google Scholar] [CrossRef]
  14. Neppolian, B. Solar/UV-induced photocatalytic degradation of three commercial textile dyes. J. Hazard. Mater. 2002, 89, 303–317. [Google Scholar] [CrossRef]
  15. Kong, J.-Z.; Li, A.-D.; Li, X.-Y.; Zhai, H.-F.; Zhang, W.-Q.; Gong, Y.-P.; Li, H.; Wu, D. Photo-degradation of methylene blue using Ta-doped ZnO nanoparticle. J. Solid State Chem. 2010, 183, 1359–1364. [Google Scholar] [CrossRef]
  16. Teng, X.M.; Fan, H.T.; Pan, S.S.; Ye, C.; Li, G.H. Influence of annealing on the structural and optical properties of ZnO: Tb thin films. J. Appl. Phys. 2006, 100, 053507. [Google Scholar] [CrossRef]
  17. Zong, Y.; Li, Z.; Wang, X.; Ma, J.; Men, Y. Synthesis and high photocatalytic activity of Eu-doped ZnO nanoparticles. Ceram. Int. 2014, 40, 10375–10382. [Google Scholar] [CrossRef]
  18. Khatamian, M.; Khandar, A.A.; Divband, B.; Haghighi, M.; Ebrahimiasl, S. Heterogeneous photocatalytic degradation of 4-nitrophenol in aqueous suspension by Ln (La 3+, Nd 3+ or Sm 3+) doped ZnO nanoparticles. J. Mol. Catal. A Chem. 2012, 365, 120–127. [Google Scholar] [CrossRef]
  19. Sin, J.C.; Lam, S.M.; Lee, K.T.; Mohamed, A.R. Preparation and photocatalytic properties of visible light-driven samarium-doped ZnO nanorods. Ceram. Int. 2013, 39, 5833–5843. [Google Scholar] [CrossRef]
  20. Chouchene, B.; Chaabane, T.B.; Balan, L.; Girot, E.; Mozet, K.; Medjahdi, G.; Schneider, R. High performance Ce-doped ZnO nanorods for sunlight-driven photocatalysis. Beilstein J. Nanotechnol. 2016, 7, 1338–1349. [Google Scholar] [CrossRef] [Green Version]
  21. Tan, W.K.; Abdul Razak, K.; Lockman, Z.; Kawamura, G.; Muto, H.; Matsuda, A. Photoluminescence properties of rod-like Ce-doped ZnO nanostructured films formed by hot-water treatment of sol-gel derived coating. Opt. Mater. 2013, 35, 1902–1907. [Google Scholar] [CrossRef]
  22. Ahmad, M.; Ahmed, E.; Zafar, F.; Khalid, N.R.; Niaz, N.A.; Hafeez, A.; Ikram, M.; Khan, M.A.; Hong, Z. Enhanced photocatalytic activity of Ce-doped ZnO nanopowders synthesized by combustion method. J. Rare Earths 2015, 33, 255–262. [Google Scholar] [CrossRef]
  23. Faisal, M.; Ismail, A.A.; Ibrahim, A.A.; Bouzid, H.; Al-Sayari, S.A. Highly efficient photocatalyst based on Ce doped ZnO nanorods: Controllable synthesis and enhanced photocatalytic activity. Chem. Eng. J. 2013, 229, 225–233. [Google Scholar] [CrossRef]
  24. Shi, Q.; Wang, C.; Li, S.; Wang, Q.; Zhang, B.; Wang, W.; Zhang, J.; Zhu, H. Enhancing blue luminescence from Ce-doped ZnO nanophosphor by Li doping. Nanoscale Res. Lett. 2014, 9, 1–7. [Google Scholar] [CrossRef] [PubMed] [Green Version]
  25. Subash, B.; Krishnakumar, B.; Velmurugan, R.; Swaminathan, M.; Shanthi, M. Synthesis of Ce co-doped Ag-ZnO photocatalyst with excellent performance for NBB dye degradation under natural sunlight illumination. Catal. Sci. Technol. 2012, 2, 2319–2326. [Google Scholar] [CrossRef]
  26. Liang, Y.; Guo, N.; Li, L.; Li, R.; Ji, G.; Gan, S. Preparation of porous 3D Ce-doped ZnO microflowers with enhanced photocatalytic performance. RSC Adv. 2015, 5, 59887–59894. [Google Scholar] [CrossRef]
  27. Cerrato, E.; Gionco, C.; Paganini, M.C.; Giamello, E.; Albanese, E.; Pacchioni, G. Origin of Visible Light Photoactivity of the CeO 2 /ZnO Heterojunction. ACS Appl. Energy Mater. 2018, 1, 4247–4260. [Google Scholar] [CrossRef]
  28. Zhu, L.; Li, H.; Xia, P.; Liu, Z.; Xiong, D. Hierarchical ZnO Decorated with CeO2 Nanoparticles as the Direct Z-Scheme Heterojunction for Enhanced Photocatalytic Activity. ACS Appl. Mater. Interfaces 2018, 10, 39679–39687. [Google Scholar] [CrossRef]
  29. St John, J.; Coffer, J.L.; Chen, Y.; Pinizzotto, R.F. Synthesis and characterization of discrete luminescent erbium-doped silicon nanocrystals. J. Am. Chem. Soc. 1999, 121, 1888–1892. [Google Scholar] [CrossRef]
  30. Sarro, M.; Gule, N.P.; Laurenti, E.; Gamberini, R.; Paganini, M.C.; Mallon, P.E.; Calza, P. ZnO-based materials and enzymes hybrid systems as highly efficient catalysts for recalcitrant pollutants abatement. Chem. Eng. J. 2018, 334, 2530–2538. [Google Scholar] [CrossRef]
  31. Karunakaran, C.; Gomathisankar, P.; Manikandan, G. Preparation and characterization of antimicrobial Ce-doped ZnO nanoparticles for photocatalytic detoxification of cyanide. Mater. Chem. Phys. 2010, 123, 585–594. [Google Scholar] [CrossRef]
  32. Duclľre, J.R.; Doggett, B.; Henry, M.O.; McGlynn, E.; Rajendra Kumar, R.T.; Mosnier, J.P.; Perrin, A.; Guilloux-Viry, M. (20–23) ZnO thin films grown by pulsed laser deposition on Ce O2 -buffered r -sapphire substrate. J. Appl. Phys. 2007, 101. [Google Scholar] [CrossRef]
  33. Yousefi, M.; Amiri, M.; Azimirad, R.; Moshfegh, A.Z. Enhanced photoelectrochemical activity of Ce doped ZnO nanocomposite thin films under visible light. J. Electroanal. Chem. 2011, 661, 106–112. [Google Scholar] [CrossRef]
  34. Kellici, S.; Gong, K.; Lin, T.; Brown, S.; Clark, R.J.H.; Vickers, M.; Cockcroft, J.K.; Middelkoop, V.; Barnes, P.; Perkins, J.M.; et al. High-throughput continuous hydrothermal flow synthesis of Zn-Ce oxides: Unprecedented solubility of Zn in the nanoparticle fluorite lattice. Philos. Trans. R. Soc. A Math. Phys. Eng. Sci. 2010, 368, 4331–4349. [Google Scholar] [CrossRef] [PubMed] [Green Version]
  35. He, G.; Fan, H.; Wang, Z. Enhanced optical properties of heterostructured ZnO/CeO2 nanocomposite fabricated by one-pot hydrothermal method: Fluorescence and ultraviolet absorption and visible light transparency. Opt. Mater. 2014, 38, 145–153. [Google Scholar] [CrossRef]
  36. Jeanguillaume, C.; Colliex, C. Spectrum-image: The next step in EELS digital acquisition and processing. Ultramicroscopy 1989, 28, 252–257. [Google Scholar] [CrossRef]
  37. Qin, H.; Li, W.; Xia, Y.; He, T. Photocatalytic activity of heterostructures based on ZnO and N-doped ZnO. ACS Appl. Mater. Interfaces 2011, 3, 3152–3156. [Google Scholar] [CrossRef]
  38. Othman, A.A.; Ali, M.A.; Ibrahim, E.M.M.; Osman, M.A. Influence of Cu doping on structural, morphological, photoluminescence, and electrical properties of ZnO nanostructures synthesized by ice-bath assisted sonochemical method. J. Alloy. Compd. 2016, 683, 399–411. [Google Scholar] [CrossRef]
  39. Kaneva, N.; Bojinova, A.; Papazova, K.; Dimitrov, D. Photocatalytic purification of dye contaminated sea water by lanthanide (La 3+, Ce 3+, Eu 3+) modified ZnO. Catal. Today 2015, 252, 113–119. [Google Scholar] [CrossRef]
  40. Hiley, C.I.; Fisher, J.M.; Thompsett, D.; Kashtiban, R.J.; Sloan, J.; Walton, R.I. Incorporation of square-planar Pd2+ in fluorite CeO2: Hydrothermal preparation, local structure, redox properties and stability. J. Mater. Chem. A 2015, 3, 13072–13079. [Google Scholar] [CrossRef] [Green Version]
  41. Houas, A.; Lachheb, H.; Ksibi, M.; Elaloui, E.; Guillard, C.; Herrmann, J.-M. Photocatalytic degradation pathway of methylene blue in water. Appl. Catal. B Environ. 2001, 31, 145–157. [Google Scholar] [CrossRef]
  42. Sin, J.C.; Lam, S.M.; Lee, K.T.; Mohamed, A.R. Preparation of cerium-doped ZnO hierarchical micro/nanospheres with enhanced photocatalytic performance for phenol degradation under visible light. J. Mol. Catal. A Chem. 2015, 409, 1–10. [Google Scholar] [CrossRef]
  43. Yayapao, O.; Thongtem, S.; Phuruangrat, A.; Thongtem, T. Sonochemical synthesis, photocatalysis and photonic properties of 3% Ce-doped ZnO nanoneedles. Ceram. Int. 2013, 39, 563–568. [Google Scholar] [CrossRef]
  44. Lang, J.; Wang, J.; Zhang, Q.; Li, X.; Han, Q.; Wei, M.; Sui, Y.; Wang, D.; Yang, J. Chemical precipitation synthesis and significant enhancement in photocatalytic activity of Ce-doped ZnO nanoparticles. Ceram. Int. 2016, 42, 14175–14181. [Google Scholar] [CrossRef]
  45. Kumar, K.V. Langmuir—Hinshelwood kinetics—A theoretical study. Catal. Commun. 2008, 9, 82–84. [Google Scholar] [CrossRef]
Figure 1. (a) XRD patterns of the ZnO and Ce/ZnO photocatalysts at different Ce concentrations. (b) Zoom on the region in the XRD illustrating the presence of the (111) peak of the cubic fluorite CeO2 structure.
Catalysts 10 00551 g001
Figure 2. SEM images of (a) ZnO, (b) ZnO:Ce 1%, (c) ZnO:Ce 2% and (d) ZnO:Ce 3%.
Catalysts 10 00551 g002
Figure 3. High-angle annular dark field-scanning transmission electron microscopy (HAADF-STEM) images of (a) ZnO, (b) ZnO:Ce 1%, (c) ZnO:Ce 2% and (d) ZnO:Ce 3%.
Catalysts 10 00551 g003
Figure 4. (a) Sample ZnO HAADF-STEM image. (b) energy-dispersive X-Ray spectroscopy (XEDS) elemental map showing the spatial distribution of Zn corresponding to the area displayed in a. (c) energy-dispersive X-ray (XED) spectra of the area marked in b. (d) HRTEM image.
Catalysts 10 00551 g004
Figure 5. Sample ZnO:Ce 1%. (a) HAADF-STEM image and the XEDS elemental maps showing the spatial distribution of (b) Ce, (c) Zn and (d) both elements together corresponding to the area displayed in (a), (e,f) and the XED spectra of the areas marked in (d).
Catalysts 10 00551 g005
Figure 6. Sample ZnO–Ce 2% (a) HAADF-STEM image and the XEDS elemental maps showing the spatial distribution of (b) Ce, (c) Zn and (d) both elements together corresponding to the area displayed in (a), (e,f) and the XED spectra of the areas marked in (d).
Catalysts 10 00551 g006
Figure 7. Sample ZnO:Ce 3% (a) HAADF-STEM image and the XEDS elemental maps showing the spatial distribution of (b) Ce, (c) Zn and (d) both elements together corresponding to the area displayed in (a), (e,f) and the XED spectra of the areas marked in (d).
Catalysts 10 00551 g007
Figure 8. (a) High-angle annular dark field (HAADF) image of the ZnO:Ce 2% sample showing the spectrum imaging (SI) area. (b) HAADF image simultaneously recorded to the electron energy loss spectroscopy (EELS) acquisition. (c) Chemical map, the area in red being where Ce is present. (d) EELS spectra extracted from area 1 and 2.
Catalysts 10 00551 g008
Figure 9. HRTEM images and the corresponding digital diffraction patterns (DDP) of the ZnO:Ce 2% sample where the wurtzite structure of ZnO (a) and the fluorite structure present in a supported CexZn1-xOy nanoparticle (b) can be identified.
Catalysts 10 00551 g009
Figure 10. (a) UV–Vis absorption spectra of the ZnO and ZnO:Ce photocatalysts. (be) Plots of the first derivative of the optical absorbance with respect to the photon energy of the Ce-modified ZnO photocatalysts.
Catalysts 10 00551 g010
Figure 11. Photoluminescence spectroscopy (PL) spectra of the pure and Ce-modified ZnO photocatalysts.
Catalysts 10 00551 g011
Figure 12. Photodegradation of methylene blue (MB) in the presence of the different ZnO:Ce photocatalysts, TiO2, Ce0.7Zn0.3Ox and without any photocatalyst.
Catalysts 10 00551 g012
Table 1. The dependence of the crystallite size on the Ce content.
Sample d (nm)–ZnO
ZnO65
ZnO-1%Ce47
ZnO-2%Ce40
ZnO-3%Ce69
Table 2. The dependence of the band gap and exciton energy on the Ce content.
Sample Eg (eV)Eex (eV)
ZnO 3.463.26
ZnO:Ce 1 at.%3.403.28
ZnO:Ce 2 at.%3.263.28
ZnO:Ce 3 at.%3.173.29
Table 3. Numerical values of the effective rate constant estimated using the LH model.
Samplek (M. min−1)
ZnO5.2 × 10−3
P251.6 × 10−3
ZnO:Ce 1 at.%1.3 × 10⁻²
ZnO:Ce 2 at.%3.9 × 10⁻²
ZnO:Ce 3 at.%5.8 × 10⁻³
Table 4. Numerical values of the effective rate constant estimated using the LH model.
SampleSurface Area m2.g−1)
ZnO10
ZnO:Ce 1 at.%10
ZnO:Ce 2 at.%22
ZnO:Ce 3 at.%15

