Activation Treatments and SiO2/Pd Modification of Sol–Gel TiO2 Photocatalysts for Enhanced Photoactivity under UV Radiation

 ,
, 
 and
and 
Abstract
:1. Introduction
2. Results and Discussion
2.1. Colors and Compositions of Photocatalytic Samples
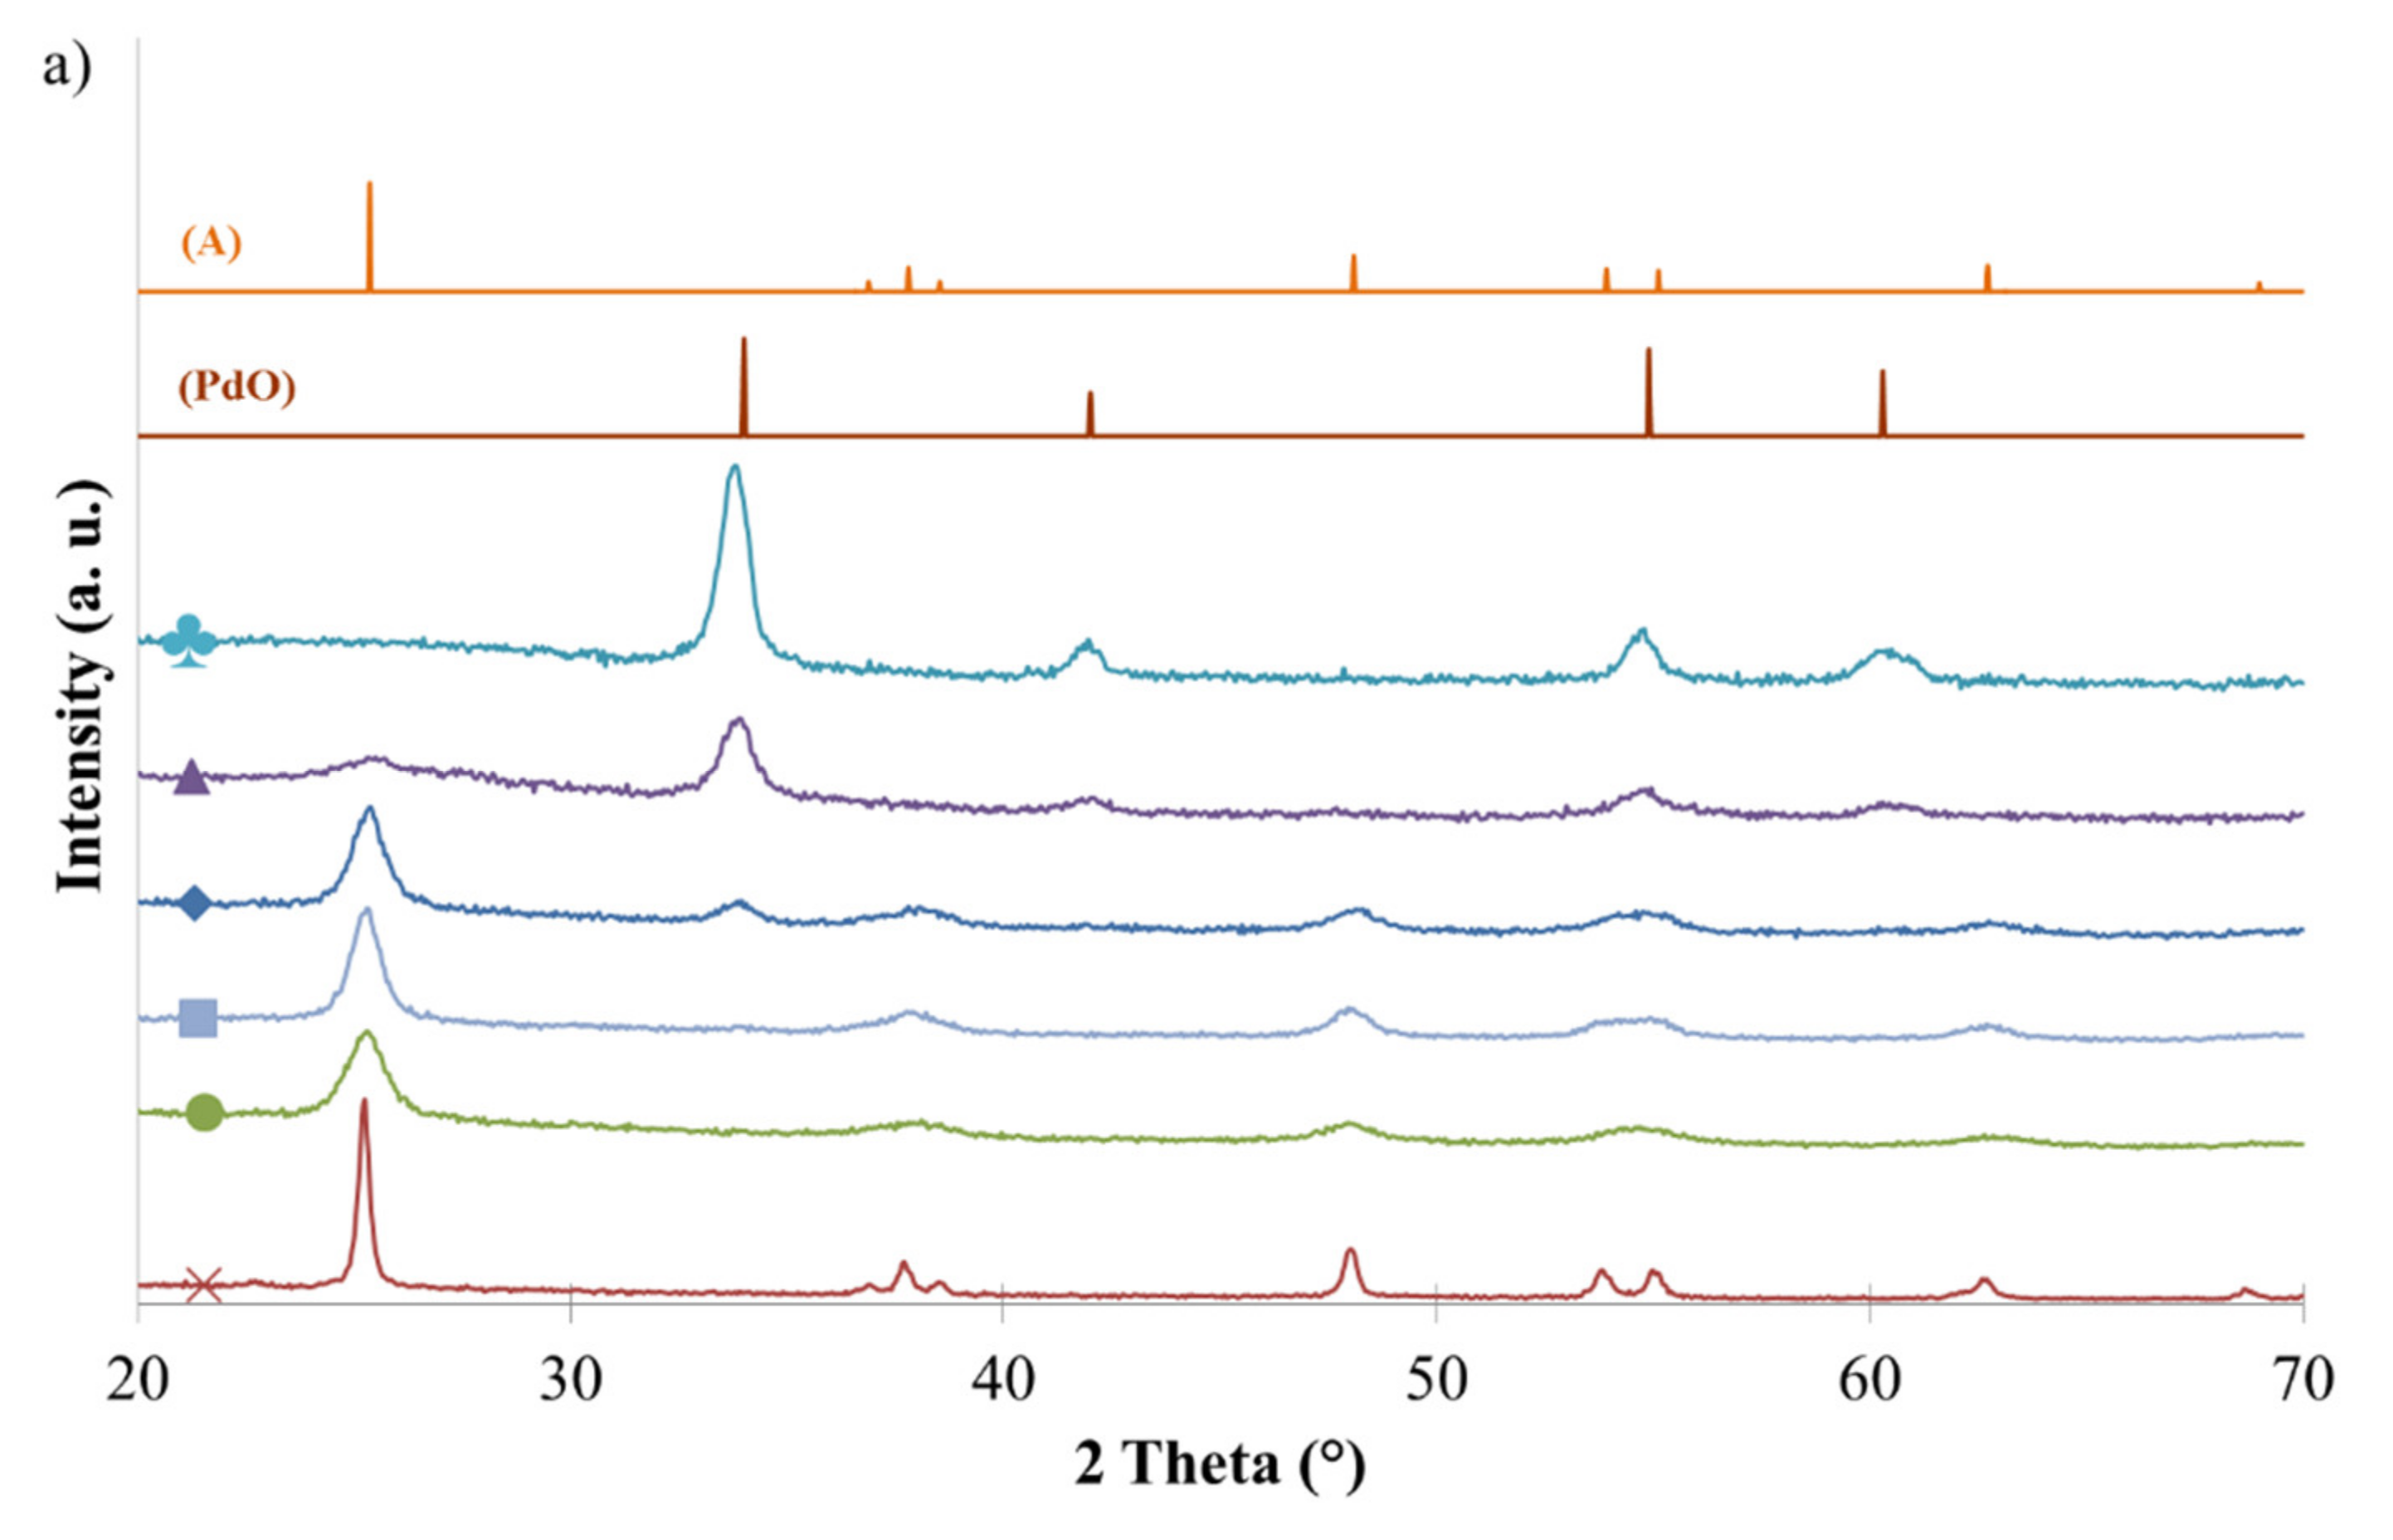
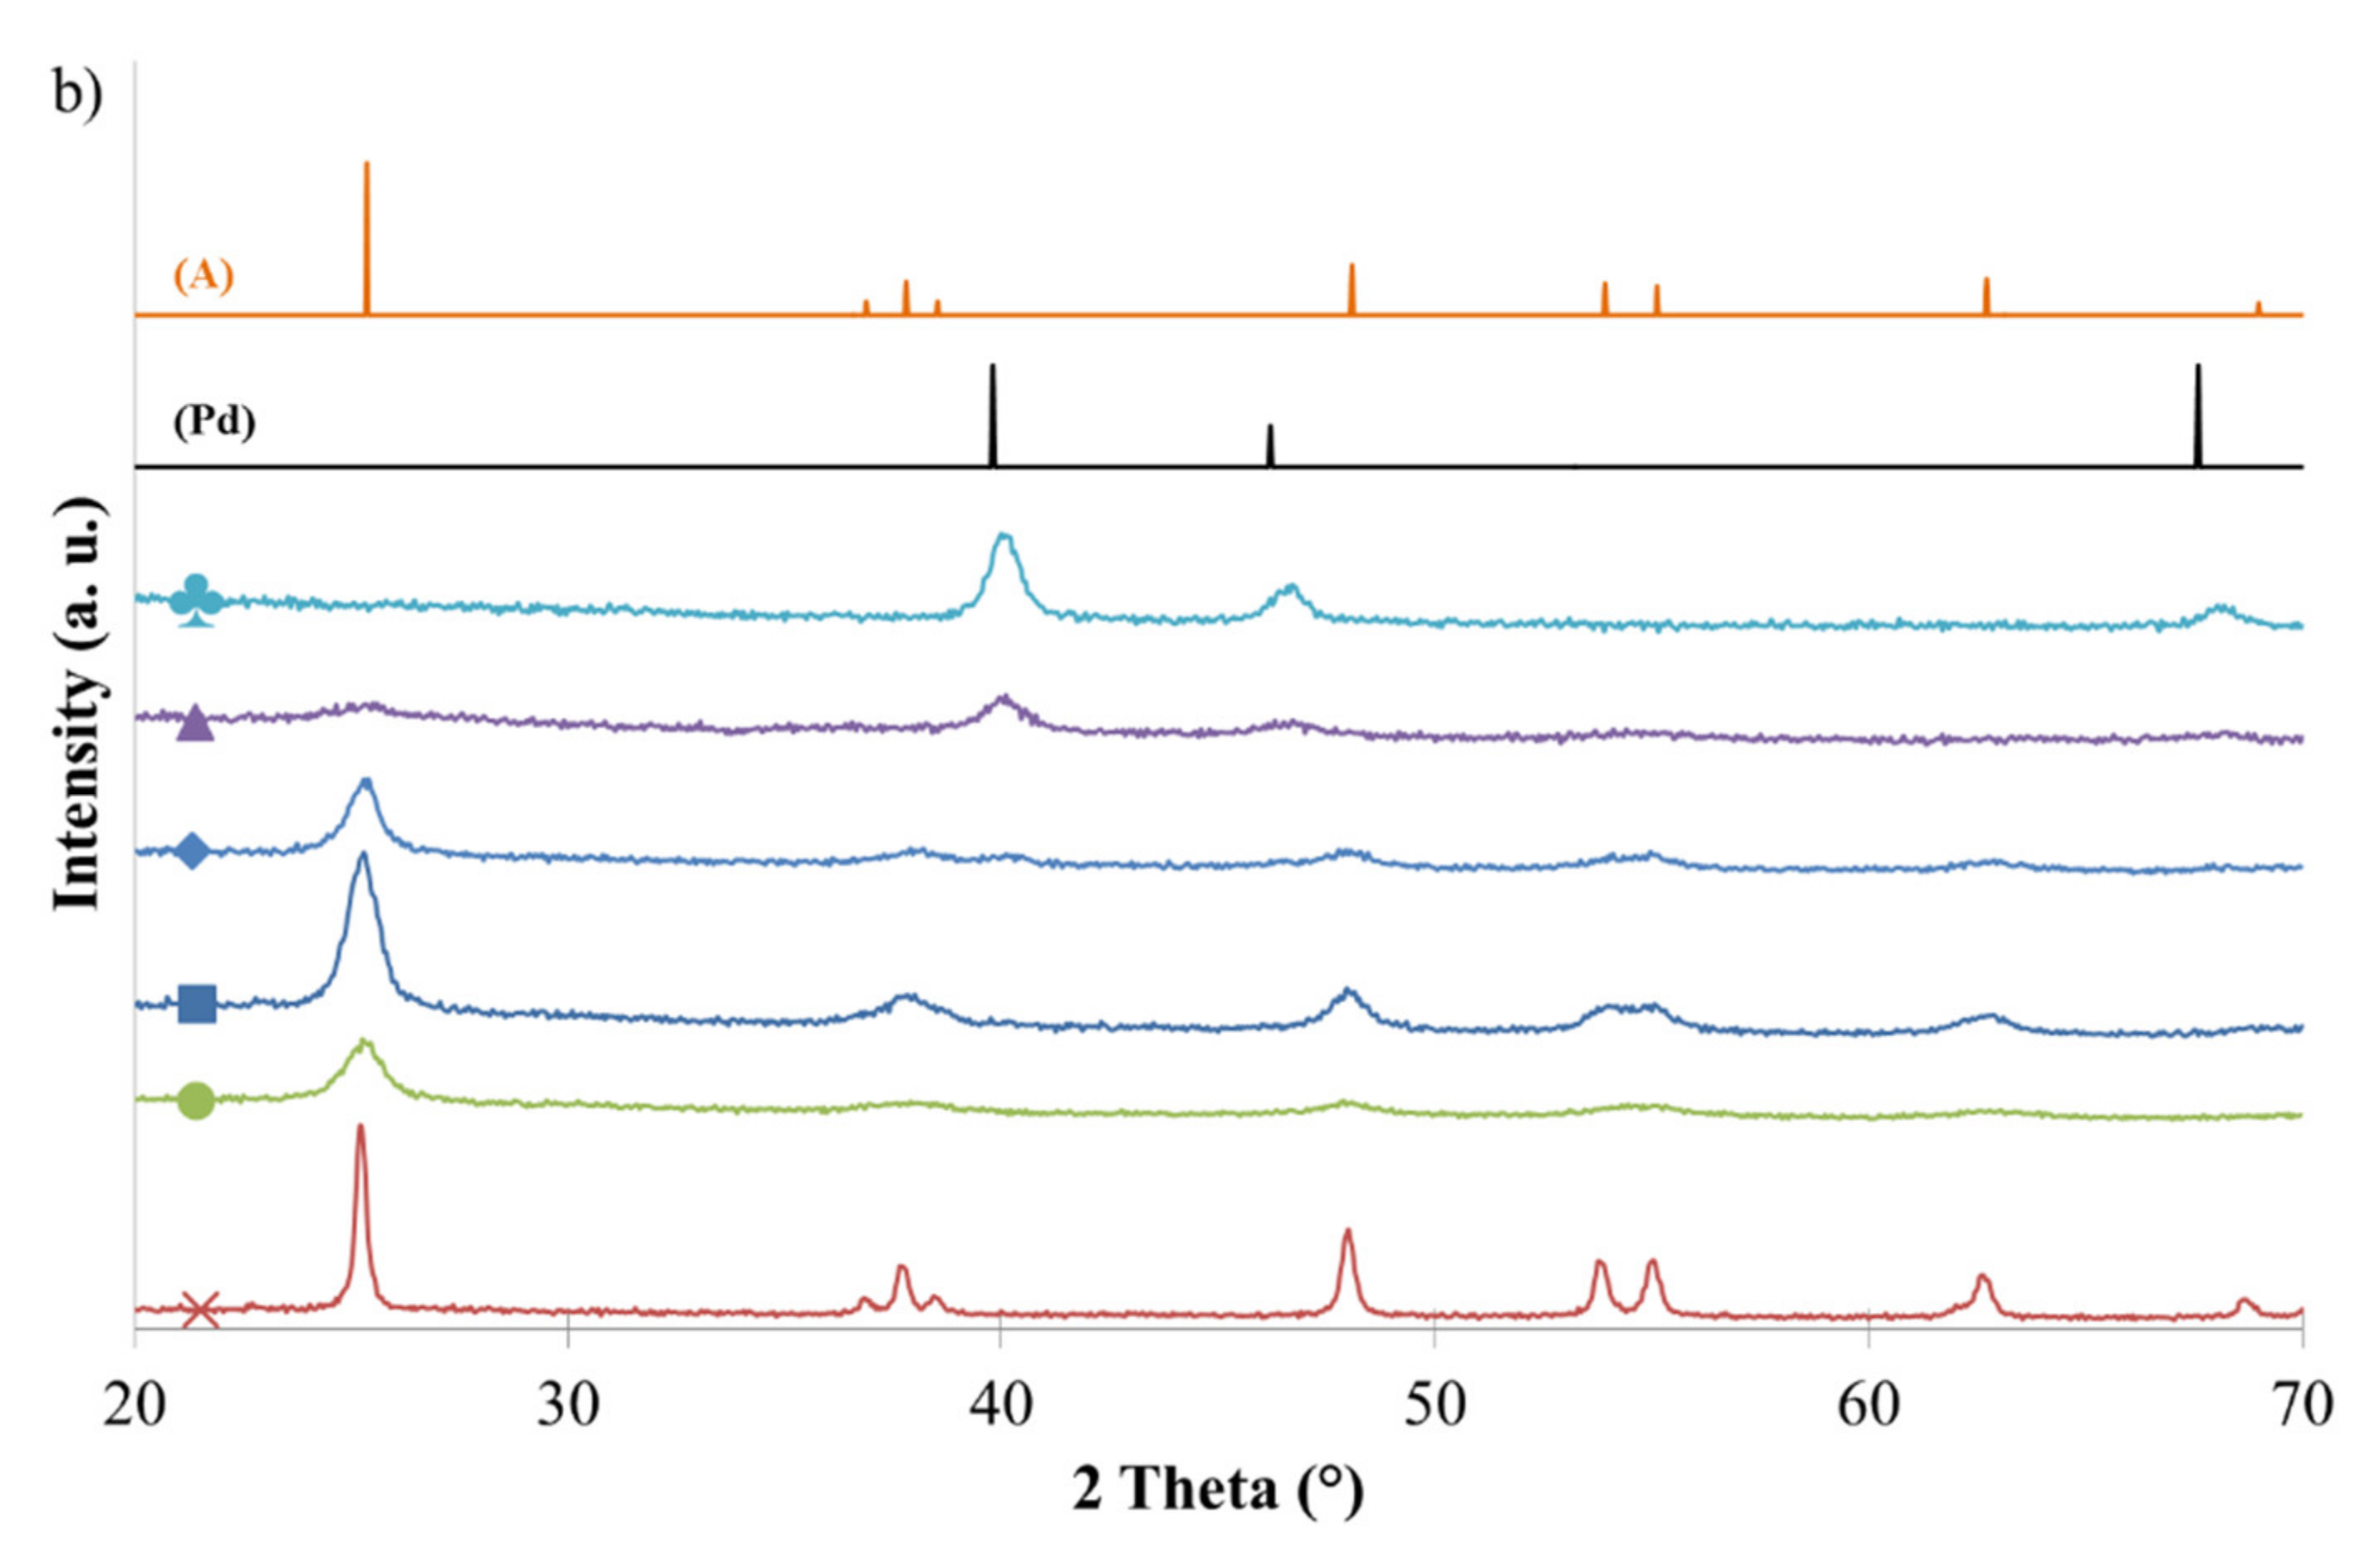
2.2. Crystallinity
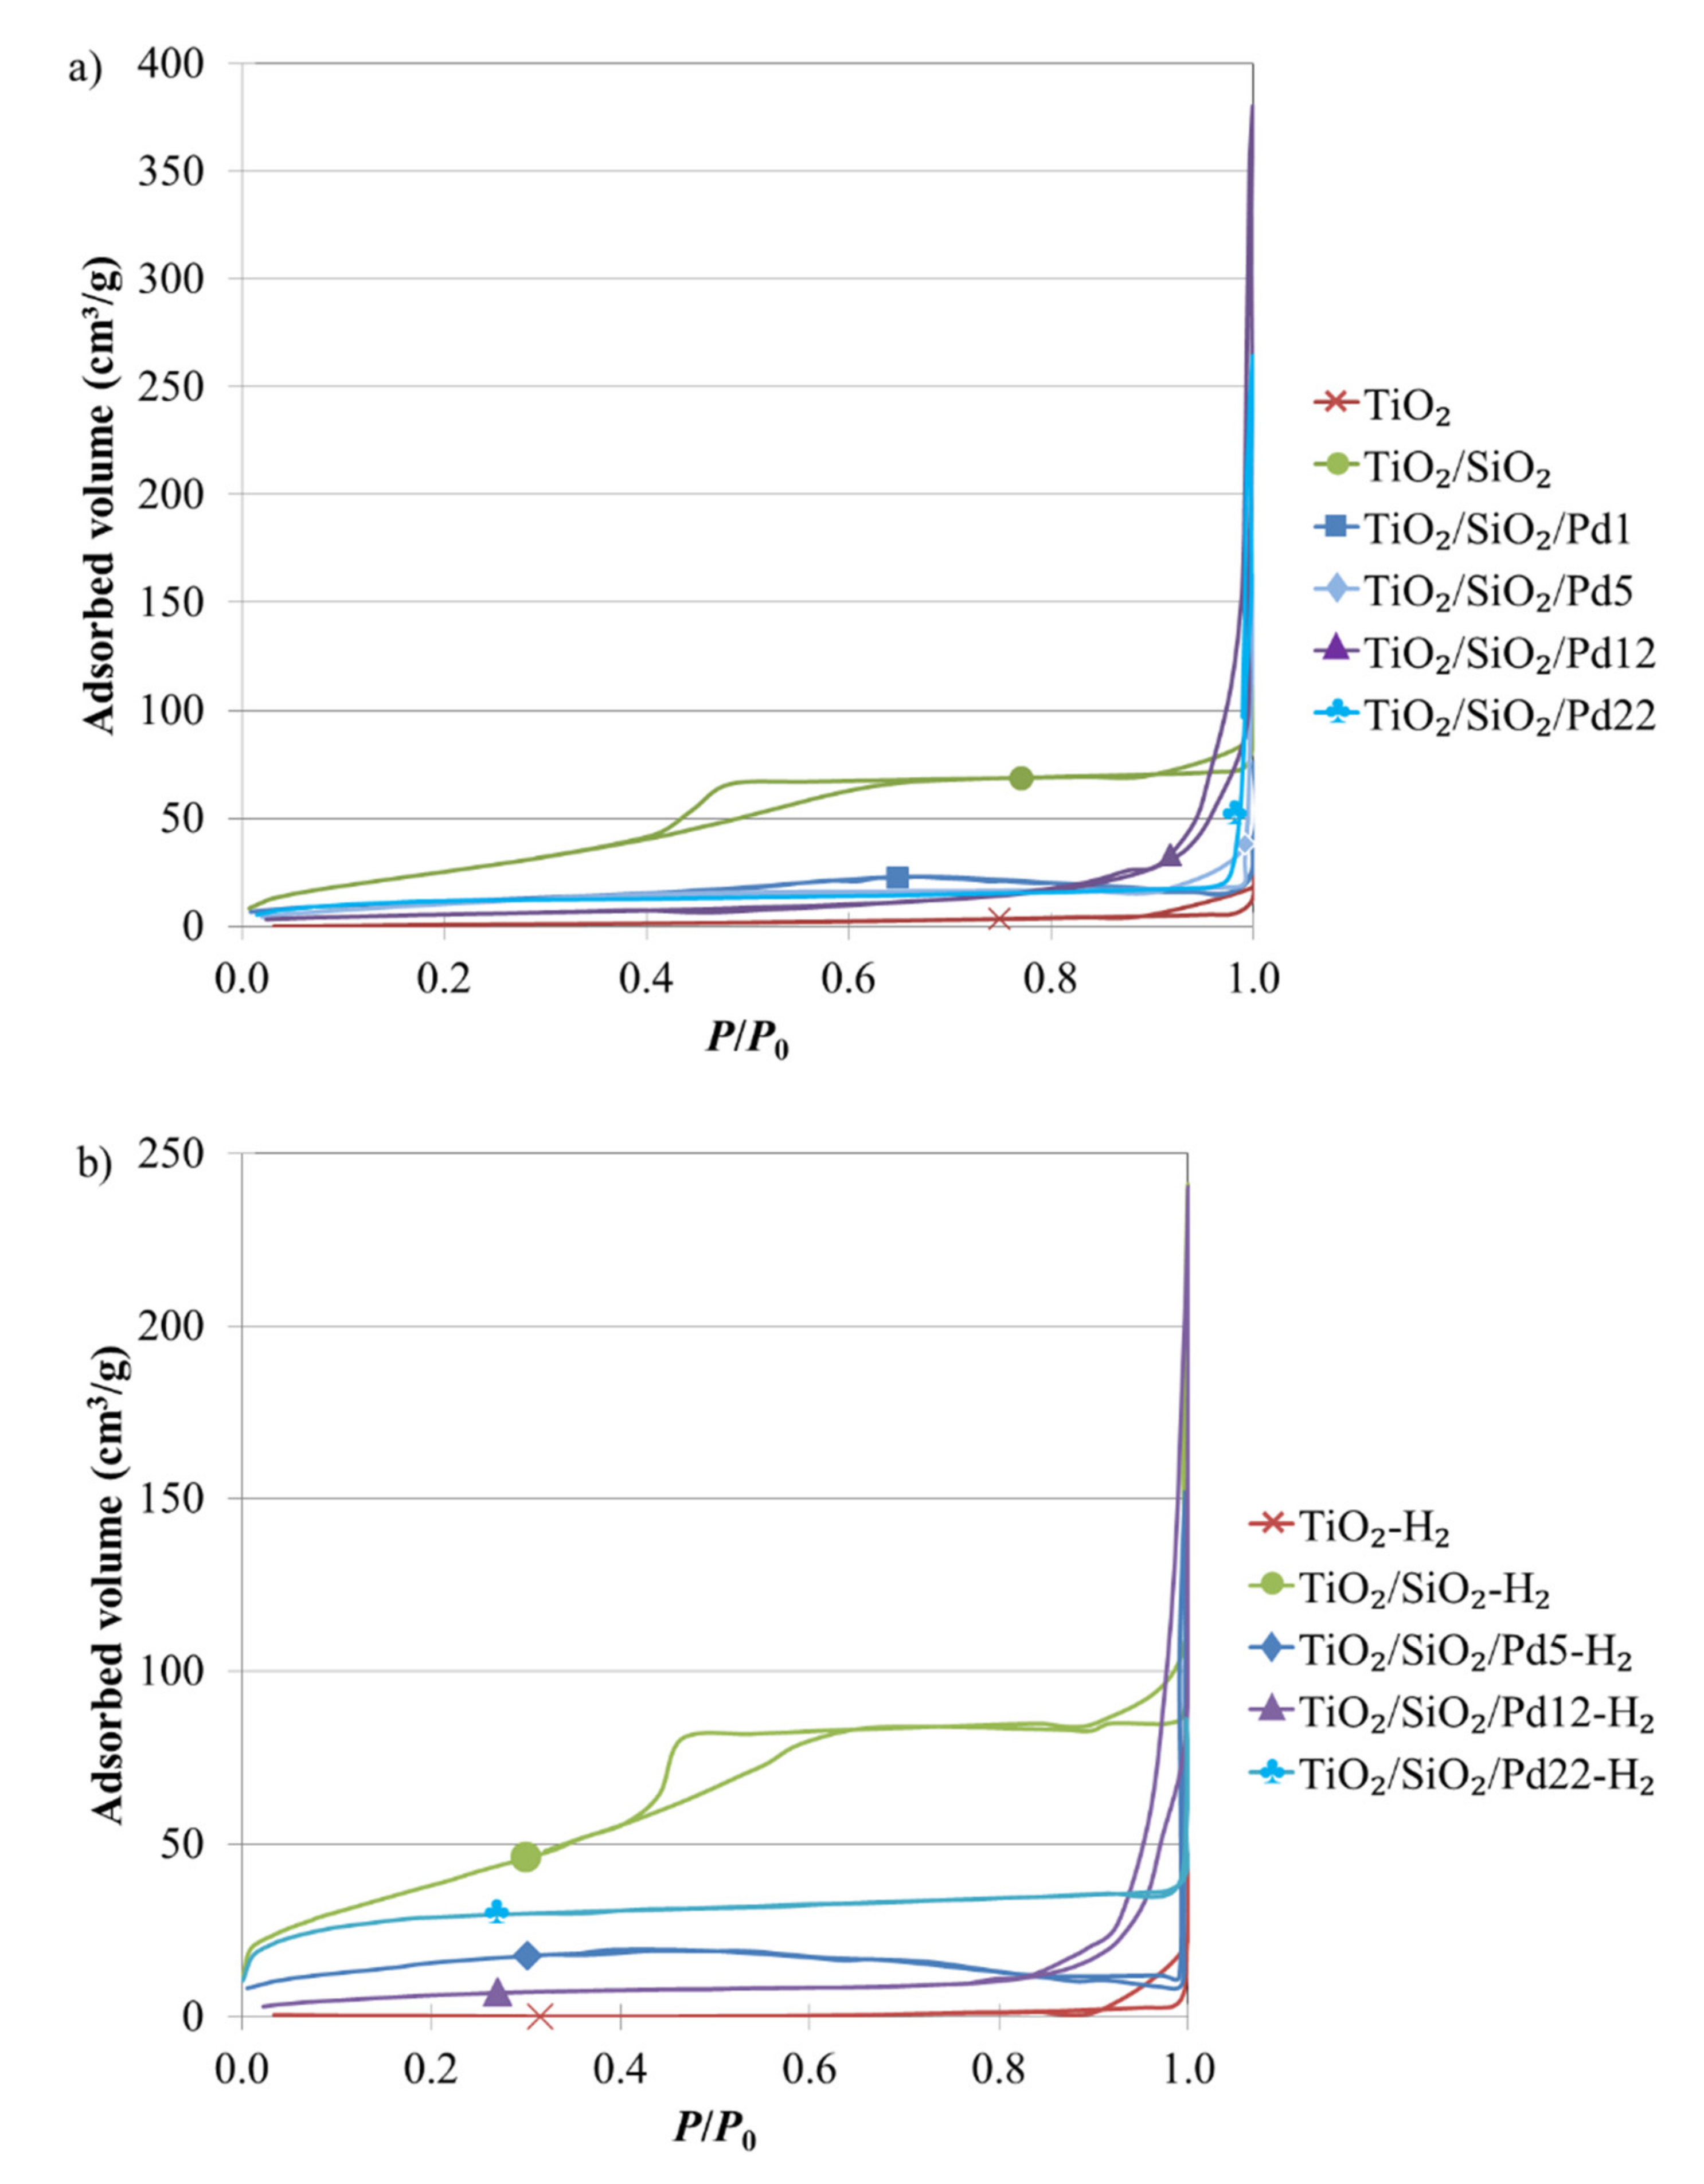
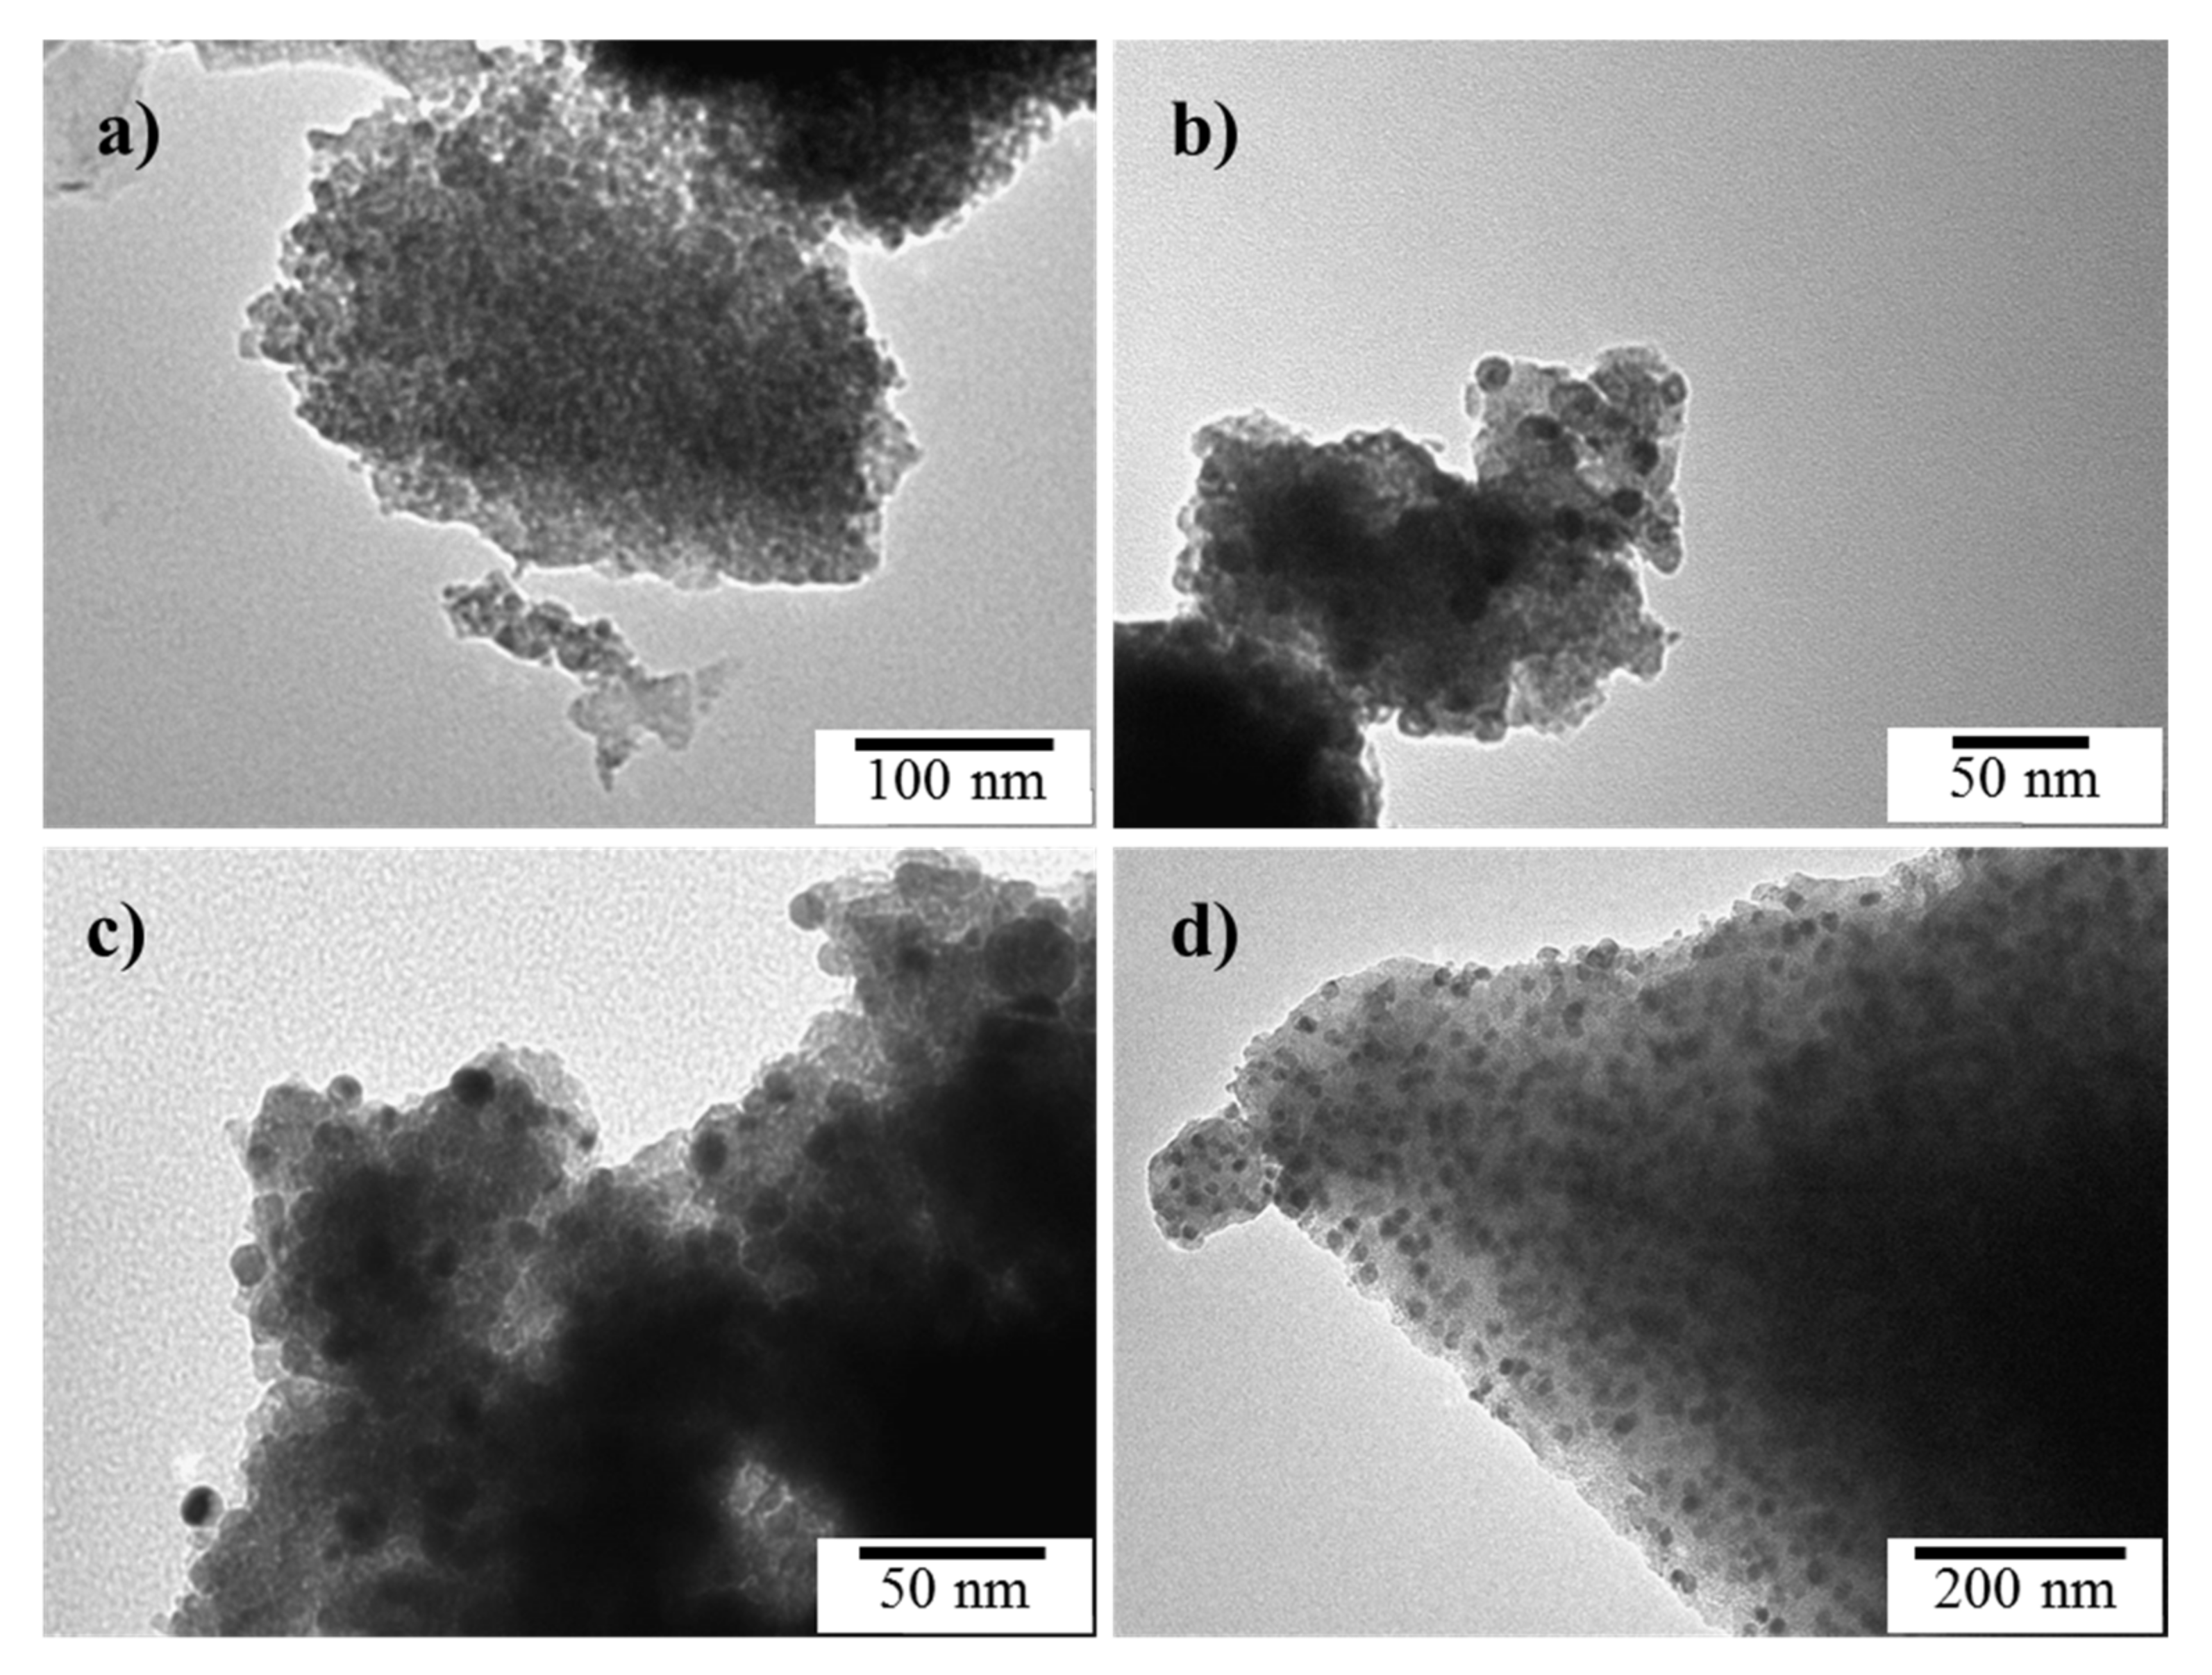
2.3. Morphology
2.4. Optical Properties
2.5. Photocatalytic Activity
3. Materials and Methods
3.1. Photocatalyst Synthesis
3.2. Activation Treatments
3.3. Characterizations
3.4. Photocatalytic Activity on Methylene Blue Degradation
4. Conclusions
Supplementary Materials
Author Contributions
Funding
Acknowledgments
Conflicts of Interest
References
- Pignatello, J.J.; Oliveros, E.; MacKay, A. Advanced oxidation processes for organic contaminant destruction based on the fenton reaction and related chemistry. Crit. Rev. Environ. Sci. Technol. 2006, 36, 1–84. [Google Scholar] [CrossRef]
- Kuyukina, M.S.; Ivshina, I.B. Application of Rhodococcus in Bioremediation of Contaminated Environments. In Biology of Rhodococcus; Alvarez, H., Ed.; Springer: Berlin/Heidelberg, Germany, 2010; pp. 231–262. ISBN 9783642129377. [Google Scholar]
- Linsebigler, A.L.; Lu, G.; Yates, J.T. Photocatalysis on TiO2 Surfaces: Principles, Mechanisms, and Selected Results. Chem. Rev. 1995, 95, 735–758. [Google Scholar] [CrossRef]
- Pelaez, M.; Nolan, N.T.; Pillai, S.C.; Seery, M.K.; Falaras, P.; Kontos, A.G.; Dunlop, P.S.M.; Hamilton, J.W.J.; Byrne, J.A.; O’Shea, K.; et al. A review on the visible light active titanium dioxide photocatalysts for environmental applications. Appl. Catal. B Environ. 2012, 125, 331–349. [Google Scholar] [CrossRef] [Green Version]
- Oseghe, E.O.; Ofomaja, A.E. Study on light emission diode/carbon modified TiO2 system for tetracycline hydrochloride degradation. J. Photochem. Photobiol. A Chem. 2018, 360, 242–248. [Google Scholar] [CrossRef]
- Mahy, J.G.; Paez, C.A.; Carcel, C.; Bied, C.; Tatton, A.S.; Damblon, C.; Heinrichs, B.; Wong Chi Man, M.; Lambert, S.D. Porphyrin-based hybrid silica-titania as a visible-light photocatalyst. J. Photochem. Photobiol. A Chem. 2019, 373, 66–76. [Google Scholar] [CrossRef]
- Banerjee, S.; Dionysiou, D.D.; Pillai, S.C. Self-cleaning applications of TiO2 by photo-induced hydrophilicity and photocatalysis. Appl. Catal. B Environ. 2015, 176, 396–428. [Google Scholar] [CrossRef] [Green Version]
- Espino-Estévez, M.R.; Fernández-Rodríguez, C.; González-Díaz, O.M. Effect of TiO2—Pd and TiO2—Ag on the photocatalytic oxidation of diclofenac, isoproturon and phenol. Chem. Eng. J. 2016, 298, 82–95. [Google Scholar] [CrossRef]
- Léonard, G.L.-M.; Malengreaux, C.M.; Mélotte, Q.; Lambert, S.D.; Bruneel, E.; Van Driessche, I.; Heinrichs, B. Doped sol-gel films vs. powders TiO2: On the positive effect induced by the presence of a substrate. J. Environ. Chem. Eng. 2016, 4, 449–459. [Google Scholar] [CrossRef]
- Tunc, I. The effect of the presence of Ag nanoparticles on the photocatalytic degradation of oxalic acid adsorbed on TiO2 nanoparticles monitored by ATR-FTIR. Mater. Chem. Phys. 2014, 144, 444–450. [Google Scholar] [CrossRef]
- Bodson, C.J.; Heinrichs, B.; Tasseroul, L.; Bied, C.; Mahy, J.G.; Wong Chi Man, M.; Lambert, S.D. Efficient P- and Ag-doped titania for the photocatalytic degradation of waste water organic pollutants. J. Alloy. Compd. 2016, 682, 144–153. [Google Scholar] [CrossRef]
- Vaiano, V.; Iervolino, G.; Sannino, D.; Murcia, J.J.; Hidalgo, M.C.; Ciambelli, P.; Navío, J.A. Photocatalytic removal of patent blue V dye on Au—TiO2 and Pt—TiO2 catalysts. Appl. Catal. B Environ. 2016, 188, 134–146. [Google Scholar] [CrossRef]
- Borzyszkowska, A.F.; Stepnowski, P.; Ofiarska, A.; Pieczynska, A.; Siedlecka, E.M. Pt—TiO2-assisted photocatalytic degradation of the cytostatic drugs ifosfamide and cyclophosphamide under artificial sunlight. Chem. Eng. J. 2016, 285, 417–427. [Google Scholar]
- Abdelaal, M.Y.; Mohamed, R.M. Novel Pd/TiO2 nanocomposite prepared by modified sol-gel method for photocatalytic degradation of methylene blue dye under visible light irradiation. J. Alloy. Compd. 2013, 576, 201–207. [Google Scholar] [CrossRef]
- Léonard, G.L.-M.; Pàez, C.A.; Ramírez, A.E.; Mahy, J.G.; Heinrichs, B. Interactions between Zn2+ or ZnO with TiO2 to produce an efficient photocatalytic, superhydrophilic and aesthetic glass. J. Photochem. Photobiol. A Chem. 2018, 350, 32–43. [Google Scholar] [CrossRef]
- Mahy, J.G.; Lambert, S.D.; Tilkin, R.G.; Poelman, D.; Wolfs, C.; Devred, F.; Gaigneaux, E.M.; Douven, S. Ambient temperature ZrO2-doped TiO2 crystalline photocatalysts: Highly efficient powders and films for water depollution. Mater. Today Energy 2019, 13, 312–322. [Google Scholar] [CrossRef]
- Chen, Q.; Shi, W.; Xu, Y.; Wu, D.; Sun, Y.; Si, A. Visible-light-responsive Ag—Si codoped anatase TiO2 photocatalyst with enhanced thermal stability. Mater. Chem. Phys. 2011, 125, 825–832. [Google Scholar] [CrossRef]
- Pirard, S.L.; Mahy, J.G.; Pirard, J.-P.; Heinrichs, B.; Raskinet, L.; Lambert, S.D. Development by the sol-gel process of highly dispersed Ni—Cu/SiO2 xerogel catalysts for selective 1,2-dichloroethane hydrodechlorination into ethylene. Microporous Mesoporous Mater. 2015, 209, 197–207. [Google Scholar] [CrossRef]
- Belet, A.; Wolfs, C.; Mahy, J.G.; Poelman, D.; Vreuls, C. Sol-Gel Syntheses of Photocatalysts for the Removal of Pharmaceutical Products in Water. Nanomaterials 2019, 9, 126. [Google Scholar] [CrossRef] [Green Version]
- Yang, J.; Xu, X.; Liu, Y.; Gao, Y.; Chen, H.; Li, H. Preparation of SiO2@TiO2 composite nanosheets and their application in photocatalytic degradation of malachite green at emulsion interface. Colloids Surf. A Physicochem. Eng. Asp. 2019, 582, 123858. [Google Scholar] [CrossRef]
- Braconnier, B.; Páez, C.A.; Lambert, S.; Alié, C.; Henrist, C.; Poelman, D.; Pirard, J.P.; Cloots, R.; Heinrichs, B. Ag- and SiO2-doped porous TiO2 with enhanced thermal stability. Microporous Mesoporous Mater. 2009, 122, 247–254. [Google Scholar] [CrossRef]
- Bodson, C.J.; Lambert, S.D.; Alié, C.; Cattoën, X.; Pirard, J.; Bied, C.; Wong Chi Man, M.; Heinrichs, B. Effects of additives and solvents on the gel formation rate and on the texture of P- and Si-doped TiO2 materials. Microporous Mesoporous Mater. 2010, 134, 157–164. [Google Scholar] [CrossRef]
- Lecloux, A.J. Texture of Catalysts. In Catalysis: Science and Technology; Anderson, J.R., Boudart, M., Eds.; Springer: Berlin/Heidelberg, Germany, 1981; Volume 2, pp. 171–230. [Google Scholar]
- Mahy, J.G.; Claude, V.; Sacco, L.; Lambert, S.D. Ethylene polymerization and hydrodechlorination of 1,2-dichloroethane mediated by nickel(II) covalently anchored to silica xerogels. J. Sol-Gel Sci. Technol. 2017, 81, 59–68. [Google Scholar] [CrossRef]
- Lambert, S.; Cellier, C.; Grange, P.; Pirard, J.P.; Heinrichs, B. Synthesis of Pd/SiO2, Ag/SiO2, and Cu/SiO2 cogelled xerogel catalysts: Study of metal dispersion and catalytic activity. J. Catal. 2004, 221, 335–346. [Google Scholar] [CrossRef]
- Khaki, M.R.D.; Shafeeyan, M.S.; Raman, A.A.A.; Daud, W.M.A.W. Application of doped photocatalysts for organic pollutant degradation—A review. J. Environ. Manag. 2017, 198, 78–94. [Google Scholar] [CrossRef]
- Yukselen, Y.; Kaya, A. Suitability of the methylene blue test for surface area, cation exchange capacity and swell potential determination of clayey soils. Eng. Geol. 2008, 102, 38–45. [Google Scholar] [CrossRef]
- Calleja, G.; Serrano, D.P.; Sanz, R.; Pizarro, P. Mesostructured SiO2-doped TiO2 with enhanced thermal stability prepared by a soft-templating sol-gel route. Microporous Mesoporous Mater. 2008, 111, 429–440. [Google Scholar] [CrossRef]
- Zhang, Z.; Long, J.; Xie, X.; Zhuang, H.; Zhou, Y.; Lin, H.; Yuan, R.; Dai, W.; Ding, Z.; Wang, X.; et al. Controlling the synergistic effect of oxygen vacancies and N dopants to enhance photocatalytic activity of N-doped TiO2 by H2 reduction. Appl. Catal. A Gen. 2012, 425–426, 117–124. [Google Scholar] [CrossRef]
- Páez, C.A.; Lambert, S.D.; Poelman, D.; Pirard, J.P.; Heinrichs, B. Improvement in the methylene blue adsorption capacity and photocatalytic activity of H2-reduced rutile-TiO2caused by Ni(II)porphyrin preadsorption. Appl. Catal. B Environ. 2011, 106, 220–227. [Google Scholar]
- Liu, H.; Ma, H.T.; Li, X.Z.; Li, W.Z.; Wu, M.; Bao, X.H. The enhancement of TiO2 photocatalytic activity by hydrogen thermal treatment. Chemosphere 2003, 50, 39–46. [Google Scholar] [CrossRef] [Green Version]
- Tong, H.-X.; Chen, Q.-Y.; Yin, Z.-L.; Hu, H.-P.; Wu, D.-X.; Yang, Y.-H. Preparation, characterization and photo-catalytic behavior of WO3-TiO2 catalysts with oxygen vacancies. Trans. Nonferrous Met. Soc. China 2009, 19, 1483–1488. [Google Scholar] [CrossRef]
- Pirard, S.L.; Malengreaux, C.M.; Toye, D.; Heinrichs, B. How to correctly determine the kinetics of a photocatalytic degradation reaction? Chem. Eng. J. 2014, 249, 1–5. [Google Scholar] [CrossRef]
- Arabatzis, I.M.; Stergiopoulos, T.; Andreeva, D.; Kitova, S.; Neophytides, S.G.; Falaras, P. Characterization and photocatalytic activity of Au/TiO2 thin films for azo-dye degradation. J. Catal. 2003, 220, 127–135. [Google Scholar] [CrossRef]
- Fisher, M.B.; Keane, D.A.; Fernández-Ibáñez, P.; Colreavy, J.; Hinder, S.J.; McGuigan, K.G.; Pillai, S.C. Nitrogen and copper doped solar light active TiO2 photocatalysts for water decontamination. Appl. Catal. B Environ. 2013, 130–131, 8–13. [Google Scholar] [CrossRef] [Green Version]
- Patterson, A.L. The Scherrer Formula for X-Ray Particle Size Determination. Phys. Rev. 1939, 56, 978–982. [Google Scholar] [CrossRef]
- Malengreaux, C.M.; Douven, S.; Poelman, D.; Heinrichs, B.; Bartlett, J.R. An ambient temperature aqueous sol–gel processing of efficient nanocrystalline doped TiO2-based photocatalysts for the degradation of organic pollutants. J. Sol-Gel Sci. Technol. 2014, 71, 557–570. [Google Scholar] [CrossRef]
- Kubelka, P. Ein Beitrag zur Optik der Farban striche. Z Tech. Phys. 1931, 12, 593–601. [Google Scholar]
- Kubelka, P. New contributions to the optics of intensely light-scattering materials. J. Opt. Soc. Am. 1948, 38, 448–457. [Google Scholar] [CrossRef]
- Mahy, J.G.; Lambert, S.D.; Léonard, G.L.-M.; Zubiaur, A.; Olu, P.-Y.; Mahmoud, A.; Boschini, F.; Heinrichs, B. Towards a large scale aqueous sol-gel synthesis of doped TiO2: Study of various metallic dopings for the photocatalytic degradation of p-nitrophenol. J. Photochem. Photobiol. A Chem. 2016, 329, 189–202. [Google Scholar] [CrossRef]
- Mahy, J.G.; Cerfontaine, V.; Poelman, D.; Devred, F.; Gaigneaux, E.M.; Heinrichs, B.; Lambert, S.D. Highly efficient low-temperature N-doped TiO2 catalysts for visible light photocatalytic applications. Materials 2018, 11, 584. [Google Scholar] [CrossRef] [Green Version]
- Malengreaux, C.M.; Pirard, S.L.; Léonard, G.; Mahy, J.G.; Herlitschke, M.; Klobes, B.; Hermann, R.; Heinrichs, B.; Bartlett, J.R. Study of the photocatalytic activity of Fe3+, Cr3+, La3+ and Eu3+ single-doped and co-doped TiO2 catalysts produced by aqueous sol-gel processing. J. Alloy. Compd. 2017, 691, 726–738. [Google Scholar] [CrossRef] [Green Version]
- Tasseroul, L.; Pirard, S.L.; Lambert, S.D.; Páez, C.A.; Poelman, D.; Pirard, J.P.; Heinrichs, B. Kinetic study of p-nitrophenol photodegradation with modified TiO2 xerogels. Chem. Eng. J. 2012, 191, 441–450. [Google Scholar] [CrossRef]


| Sample | nSolvent (mmol) | nPd (mmol) | nEDAS (mmol) | nTIPT (mmol) | nWater (mmol) | Gelification Time (min) | Theoretical Loading SiO2/Pd (wt.%) | Actual Loading SiO2/Pd (wt.%) |
|---|---|---|---|---|---|---|---|---|
| Pure TiO2 | 1830 | - | - | 91.5 | 183 | 9 | - | - |
| TiO2/SiO2 | 1830 | - | 6.88 | 84.6 | 180 | 8 | 5.8/0 | 4.9/0 |
| TiO2/SiO2/Pd1 | 1830 | 0.69 | 1.38 | 90.1 | 182 | >60 | 0.98/1 | 1.2/1.1 |
| TiO2/SiO2/Pd5 | 1830 | 3.44 | 6.88 | 84.6 | 180 | 40 | 4.9/5 | 4.7/4.2 |
| TiO2/SiO2/Pd12 | 1830 | 8.60 | 17.20 | 74.3 | 174 | >60 | 11.76/12 | 12.9/12.2 |
| TiO2/SiO2/Pd22 | 1830 | 17.4 | 34.90 | 56.6 | 166 | >60 | 21.56/22 | 24.6/21.8 |
| Sample | dXRDTi (nm) ±1 | dXRDPdO (nm) ±1 | dXRDPd (nm) ±1 | SBET (m2 g−1) ±5 | VDR (cm3 g−1) ±0.01 | VP (cm3 g−1) ±0.1 | dTEMTi (nm) ±5 | dTEMPdO (nm) ±4 | dTEMPd (nm) ±4 | Eg (eV) ±0.01 |
|---|---|---|---|---|---|---|---|---|---|---|
| Pure TiO2 | 34 | -b | -b | <5 | - | 0.04 | 25 | -b | -b | 3.17 |
| Pure TiO2-H2 | 34 | -b | -b | <5 | - | 0.04 | -a | -b | -b | 3.16 |
| Pure TiO2-UV | 34 | -b | -b | <5 | - | 0.04 | 25 | -b | -b | 3.25 |
| TiO2/SiO2 | 8 | -b | -b | 100 | 0.04 | 0.2 | 10 | -b | -b | 3.25 |
| TiO2/SiO2-H2 | 10 | -b | -b | 145 | 0.06 | 0.4 | -a | -b | -b | 3.23 |
| TiO2/SiO2-UV | 8 | -b | -b | 100 | 0.04 | 0.2 | 10 | -b | -b | 3.27 |
| TiO2/SiO2/Pd1 | 19 | -c | -b | 40 | 0.02 | 0.1 | 18 | -c | -b | -d |
| TiO2/SiO2/Pd1-H2 | 25 | -b | -c | 60 | 0.02 | 0.2 | -a | -b | -c | -d |
| TiO2/SiO2/Pd1-UV | 19 | -c | -b | 40 | 0.02 | 0.1 | 18 | -c | -b | -d |
| TiO2/SiO2/Pd5 | 11 | 8 | -b | 45 | 0.02 | 0.2 | 12 | 8 | -b | -d |
| TiO2/SiO2/Pd5-H2 | 11 | -b | 17 | 60 | 0.02 | 0.2 | -a | -b | 10 | -d |
| TiO2/SiO2/Pd5-UV | 10 | 8 | -b | 45 | 0.02 | 0.2 | 12 | 9 | -b | -d |
| TiO2/SiO2/Pd12 | 7 | 17 | -b | 20 | 0.01 | 0.6 | 10 | 12 | -b | -d |
| TiO2/SiO2/Pd12-H2 | 6 | -b | 9 | 25 | 0.01 | 0.4 | -a | -b | 11 | -d |
| TiO2/SiO2/Pd12-UV | 7 | 17 | -b | 20 | 0.01 | 0.6 | 10 | 12 | -b | -d |
| TiO2/SiO2/Pd22 | -b | 25 | -b | 45 | 0.02 | 0.4 | -b | 14 | -b | -d |
| TiO2/SiO2/Pd22-H2 | -b | -b | 12 | 100 | 0.05 | 0.1 | -b | -b | 11 | -d |
| TiO2/SiO2/Pd22-UV | -b | 25 | -b | 45 | 0.02 | 0.4 | -b | 14 | -b | -d |
| Sample | MB Adsorption after 6 h (Blank Test—%) ±5 | MB Conversion after 6 h (Blank Deduced—%) ±5 | Kinetic Constant k (h−1) |
|---|---|---|---|
| Pure TiO2 | 0 | 35 | 0.069 |
| Pure TiO2-H2 | 5 | 50 | 0.116 |
| Pure TiO2-UV | 0 | 45 | 0.092 |
| TiO2/SiO2 | 50 | 50 | 0.119 |
| TiO2/SiO2-H2 | 60 | 40 | 0.082 |
| TiO2/SiO2-UV | 15 | 85 | 0.333 |
| TiO2/SiO2/Pd1 | 0 | 60 | 0.147 |
| TiO2/SiO2/Pd1-H2 | 15 | 75 | 0.233 |
| TiO2/SiO2/Pd1-UV | 0 | 35 | 0.070 |
| TiO2/SiO2/Pd5 | 0 | 55 | 0.131 |
| TiO2/SiO2/Pd5-H2 | 5 | 60 | 0.147 |
| TiO2/SiO2/Pd5-UV | 0 | 35 | 0.069 |
| TiO2/SiO2/Pd12 | 20 | 25 | 0.039 |
| TiO2/SiO2/Pd12-H2 | 15 | 30 | 0.059 |
| TiO2/SiO2/Pd12-UV | 15 | 25 | 0.050 |
| TiO2/SiO2/Pd22 | 10 | 15 | 0.030 |
| TiO2/SiO2/Pd22-H2 | 10 | 0 | 0.005 |
| TiO2/SiO2/Pd22-UV | 10 | 0 | 0.000 |
Publisher’s Note: MDPI stays neutral with regard to jurisdictional claims in published maps and institutional affiliations. |
© 2020 by the authors. Licensee MDPI, Basel, Switzerland. This article is an open access article distributed under the terms and conditions of the Creative Commons Attribution (CC BY) license (http://creativecommons.org/licenses/by/4.0/).
Share and Cite
Mahy, J.G.; Sotrez, V.; Tasseroul, L.; Hermans, S.; Lambert, S.D. Activation Treatments and SiO2/Pd Modification of Sol–Gel TiO2 Photocatalysts for Enhanced Photoactivity under UV Radiation. Catalysts 2020, 10, 1184. https://doi.org/10.3390/catal10101184
Mahy JG, Sotrez V, Tasseroul L, Hermans S, Lambert SD. Activation Treatments and SiO2/Pd Modification of Sol–Gel TiO2 Photocatalysts for Enhanced Photoactivity under UV Radiation. Catalysts. 2020; 10(10):1184. https://doi.org/10.3390/catal10101184
Chicago/Turabian StyleMahy, Julien G., Valériane Sotrez, Ludivine Tasseroul, Sophie Hermans, and Stéphanie D. Lambert. 2020. "Activation Treatments and SiO2/Pd Modification of Sol–Gel TiO2 Photocatalysts for Enhanced Photoactivity under UV Radiation" Catalysts 10, no. 10: 1184. https://doi.org/10.3390/catal10101184
APA StyleMahy, J. G., Sotrez, V., Tasseroul, L., Hermans, S., & Lambert, S. D. (2020). Activation Treatments and SiO2/Pd Modification of Sol–Gel TiO2 Photocatalysts for Enhanced Photoactivity under UV Radiation. Catalysts, 10(10), 1184. https://doi.org/10.3390/catal10101184