Article

Nano-Ru Supported on Ni Nanowires for Low-Temperature Carbon Dioxide Methanation

1
Faculty of Science and Technology, Institute of Chemistry, University of Silesia, Szkolna 9, 40-006 Katowice, Poland
2
Department of Chemistry, Silesian University of Technology, B. Krzywoustego 4, 44-100 Gliwice, Poland
3
Faculty of Science and Technology, Institute of Materials Engineering, University of Silesia, 75 Pułku Piechoty 1A, 41-500 Chorzów, Poland
4
Faculty of Science, Department of Physics, University of Hradec Králové, Rokitanského 62, 500 03 Hradec Králové, Czech Republic
5
Faculty of Science and Technology, August Chełkowski Institute of Physics, University of Silesia, 75 Pułku Piechoty 1A, 41-500 Chorzów, Poland
6
BIT-MED Sp. z o.o., Polna 23, 42-400 Zawiercie, Poland
7
Central Mining Institute, Plac Gwarkow 1, 40-166 Katowice, Poland
*
Authors to whom correspondence should be addressed.
Catalysts 2020, 10(5), 513; https://doi.org/10.3390/catal10050513
Submission received: 1 April 2020 / Revised: 29 April 2020 / Accepted: 30 April 2020 / Published: 7 May 2020

Abstract

:
In this study, we investigated the catalytic performance of Ru nanoparticles (NPs) supported on Ni-nanowires for the first time. This appears to be a highly efficient catalyst for low-temperature methanation, e.g., ca. 100% conversion and 100% of CH4 selectivity can be achieved at ca. 179 °C, while the turnover frequency (TOF) value was 2479.2 h−1. At the same time, the onset of a reaction was observed at a temperature as low as 130 °C. The comparison of nano-Pd and nano-Ru supported on Ni-nanowires enabled us to prove that oxidized surface metals are highly important for the high activity of the investigated nano-Ru@nanowired-Ni. Moreover, similar to the microscopic Sabatier rule, which indicates that some optimal reactivity level of a catalyst exists, we showed that Ni-nanowires (a higher specific surface area than a standard metal surface, e.g., in the form of a metal foam, but lower than nano-sized materials) significantly enhances the performance of the Ru-Ni catalytic system.

1. Introduction

Carbon is an essential element in human life. Its fragile environmental balance has recently seen increasing concerns about its high level of involvement in the anthropogenic impacts that affect climate change. On the one hand, the production of carbon dioxide endangers the security of the energy supply because of the potential need for a significant down-regulation of the energy flue gas emissions. On the other hand, however, the availability of CO2 is a chance for developing new environmentally benign, sustainable technologies that are based on this raw material [1]. Accordingly, CO2 is potentially a safe and cheap C1 building block for organic chemistry and fuel engineering. However, the high thermodynamic stability of this molecule is a clear disadvantage. Therefore, we need new technologies for efficient CO2 processing.
The methanation of CO2 is a fossil-free technology that produces a synthetic replacement for natural gas while simultaneously controlling CO2 emissions into the atmosphere and enabling the production of valuable fuels or chemicals [2,3,4]. In particular, methane in the form of natural gas is considered to be the most favorable among the different types of fuels from the environmental point of view [5,6]. Its combustion process is easy to control. Its efficient transport through pipelines, liquid gas terminals, and wide distribution networks are evident advantages. Therefore, synthetic or substitute natural gas (SNG) production from alternative or renewable materials is attracting increasing attention [7,8]. SNG production from carbon dioxide can be expressed by the formula below.
CO2 + 4H2 → CH4 + 2H2O, ΔH = −252.9 kJ mol−1
The methanation of carbon dioxide is thermodynamically favorable (ΔG298K = −130.8 kJ mol−1). However, the reduction of fully oxidized carbon to methane is a reaction with significant kinetic limitations requiring a catalyst to be used to achieve acceptable rates and selectivity [9]. Moreover, methanation is a complex multistep process. For example, a detailed study of Ni-catalyzed methanation [10] revealed as many as six steps for carbon formation and carbon methanation [11].
A variety of metals, e.g., Fe, Co, Ni, Ru, Rh, Pd, Ir, and Pt, which are usually active at the temperatures of 300–400 °C, have been determined to be usable catalysts for methanation [12,13,14,15,16,17,18,19,20]. In turn, the engineering of a variety of metal oxide catalysts as well as the mechanisms for their activity were reviewed in detail in Reference [21]. In particular, the importance of the defects in the oxide structures was detailed in this study.
One of the most important requirements for the efficient catalysis of methanation is a low temperature. First, methanation is an exothermic reaction whose thermodynamics becomes more and more favorable as the temperature decreases. The thermodynamic K constant significantly increases at low temperatures. Second, the sintering processes that destroy active species are less important at a lower temperature. In the current practice, catalysts are designed to operate below 320 °C because, at higher temperatures, the reverse water-gas shift (RWGS) reaction starts to play a role [22]. At the same time, the uniform distribution of active species on a support, a high porosity, and a large surface area of the support material appeared to be the decisive issues that determine the successful construction of low-temperature catalysts. For example, the surface area of the metal-organic framework that has recently been tested as a potential support for Ni is 2961 m2g−1. The conversion rate of this system reached ca. 75% at 300 °C with a CH4 selectivity of 100% at 200–300 °C [23]. In turn, the Ru nanoparticles (NPs) that were supported on TiO2 using the sophisticated barrel-sputtering technology likely had the lowest operating temperature of 160 °C. Moreover, a similar Ru/TiO2 system prepared using the wet method was efficient at about a 100 °C higher reaction temperature of ca. 260 °C [24]. In turn, the oxide-passivated Ni-supported Ru nanoparticles in silica can be an efficient catalyst for methanation at an onset reaction temperature as low as ca. 150 °C [25].
In this report, we present a novel catalytic system for the low-temperature carbon dioxide methanation. The Sabatier rule provides the most general hint for catalyst engineering. According to this rule, the catalyst should enhance the reactivity, but some optimal catalyst activity exists. This enables efficient reagent adsorption and reaction but, at the same time, the products can be desorbed from the catalyst surface. The volcano type plot illustrates the fact that, above an optimal activity, the overall catalyst efficiency decreases. The Sabatier rule describes a microscopic law. However, the same rule can apply to the macroscopic catalyst structure, which should be engineered into a form suitable for the catalyst bed. In particular, for nano-catalysts, an important issue is a construction of the catalyst-support system. For example, we observed that, if catalytic systems were targeted for a high activity by a specific surface expansion of the carrier, then the overall activity decreased because unspecific processes such as cocking or product polymerization blocked the catalyst surface [25]. Therefore, macroscopically, some optimal surface is also required. In particular, in this study, we show that nanowire structured Ni can be an efficient support for Ru nanoparticles. To the best of our knowledge, this is the first example of a catalyst that appears to be a novel, highly efficient catalytic system for low-temperature carbon dioxide methanation. The onset of the reaction occurs at 130 °C and a 100% conversion into methane was observed at 179 °C and the reaction proceeds with a high TOF value of 2479.2 h−1. Pd and Ru are often investigated as alternative catalysts. A number of investigations reported the location of these metals on the volcano curve. Foams are attractive catalyst carriers because of their low-flow resistance, which results from the significant free volume (approximately 90%). However, the Ni foams that have been tested as alternative carriers or Pd NPs as potential Ru NP replacements appeared to be much less effective.

2. Results and Discussion

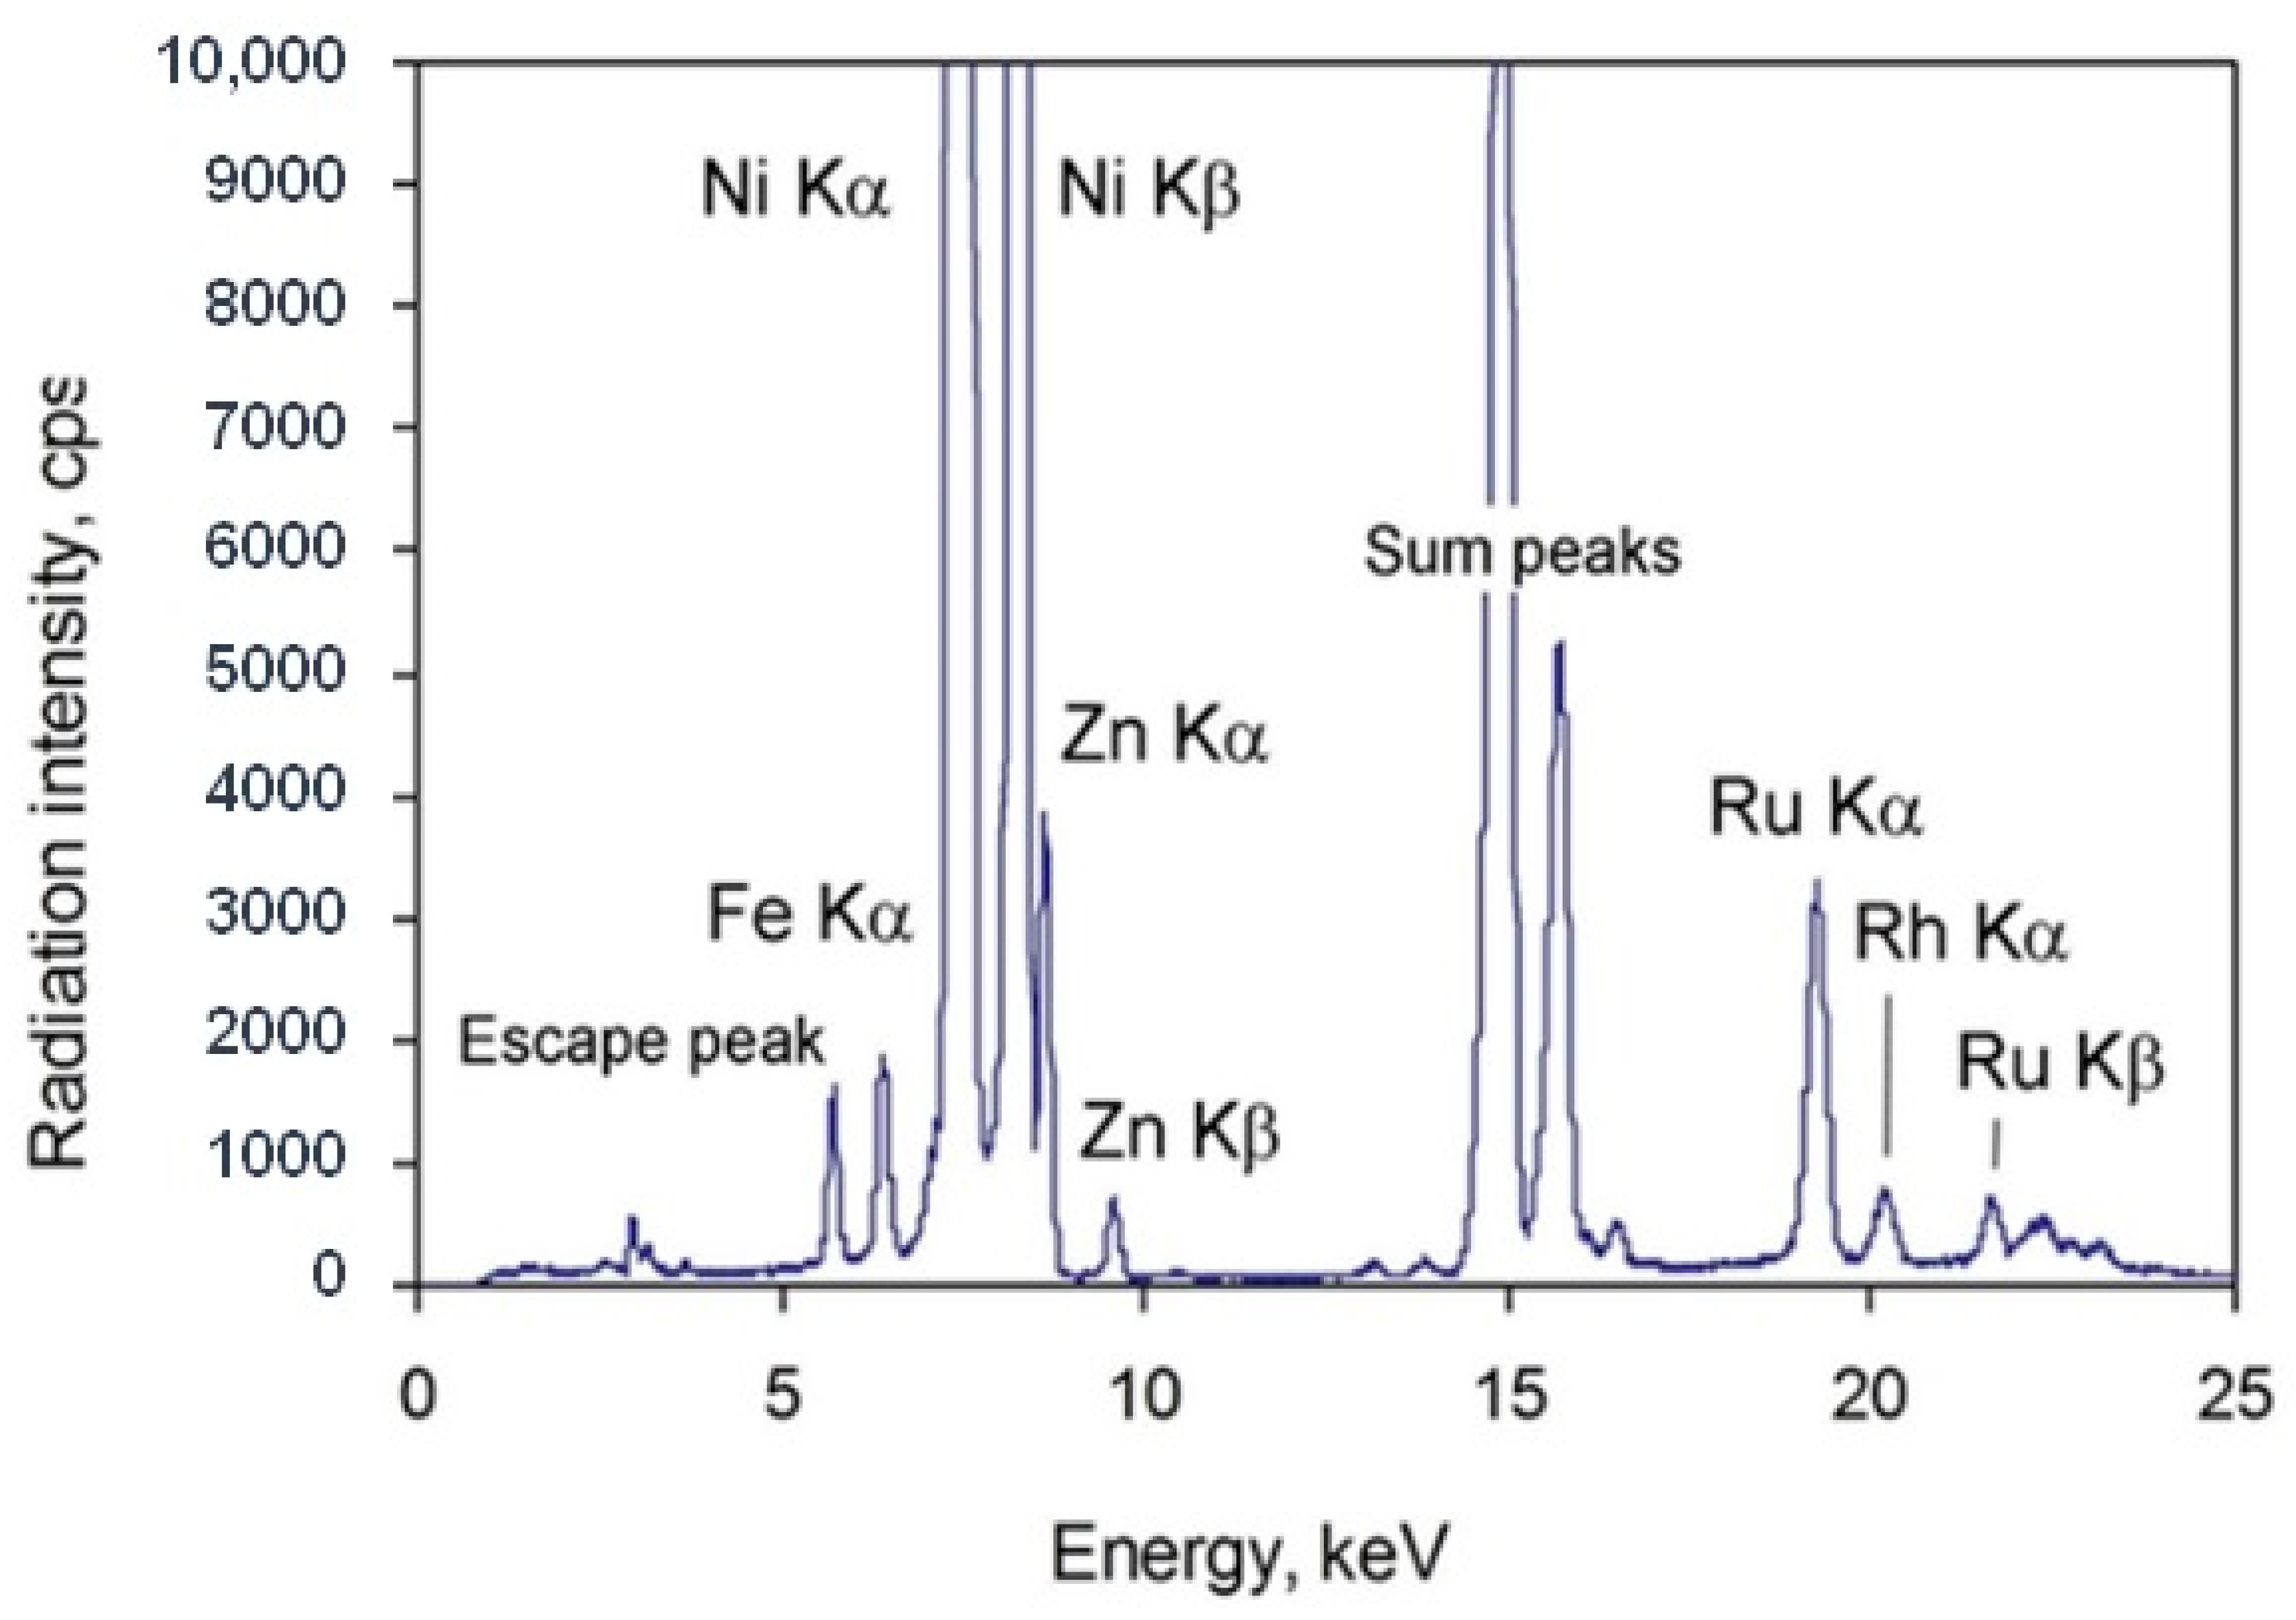
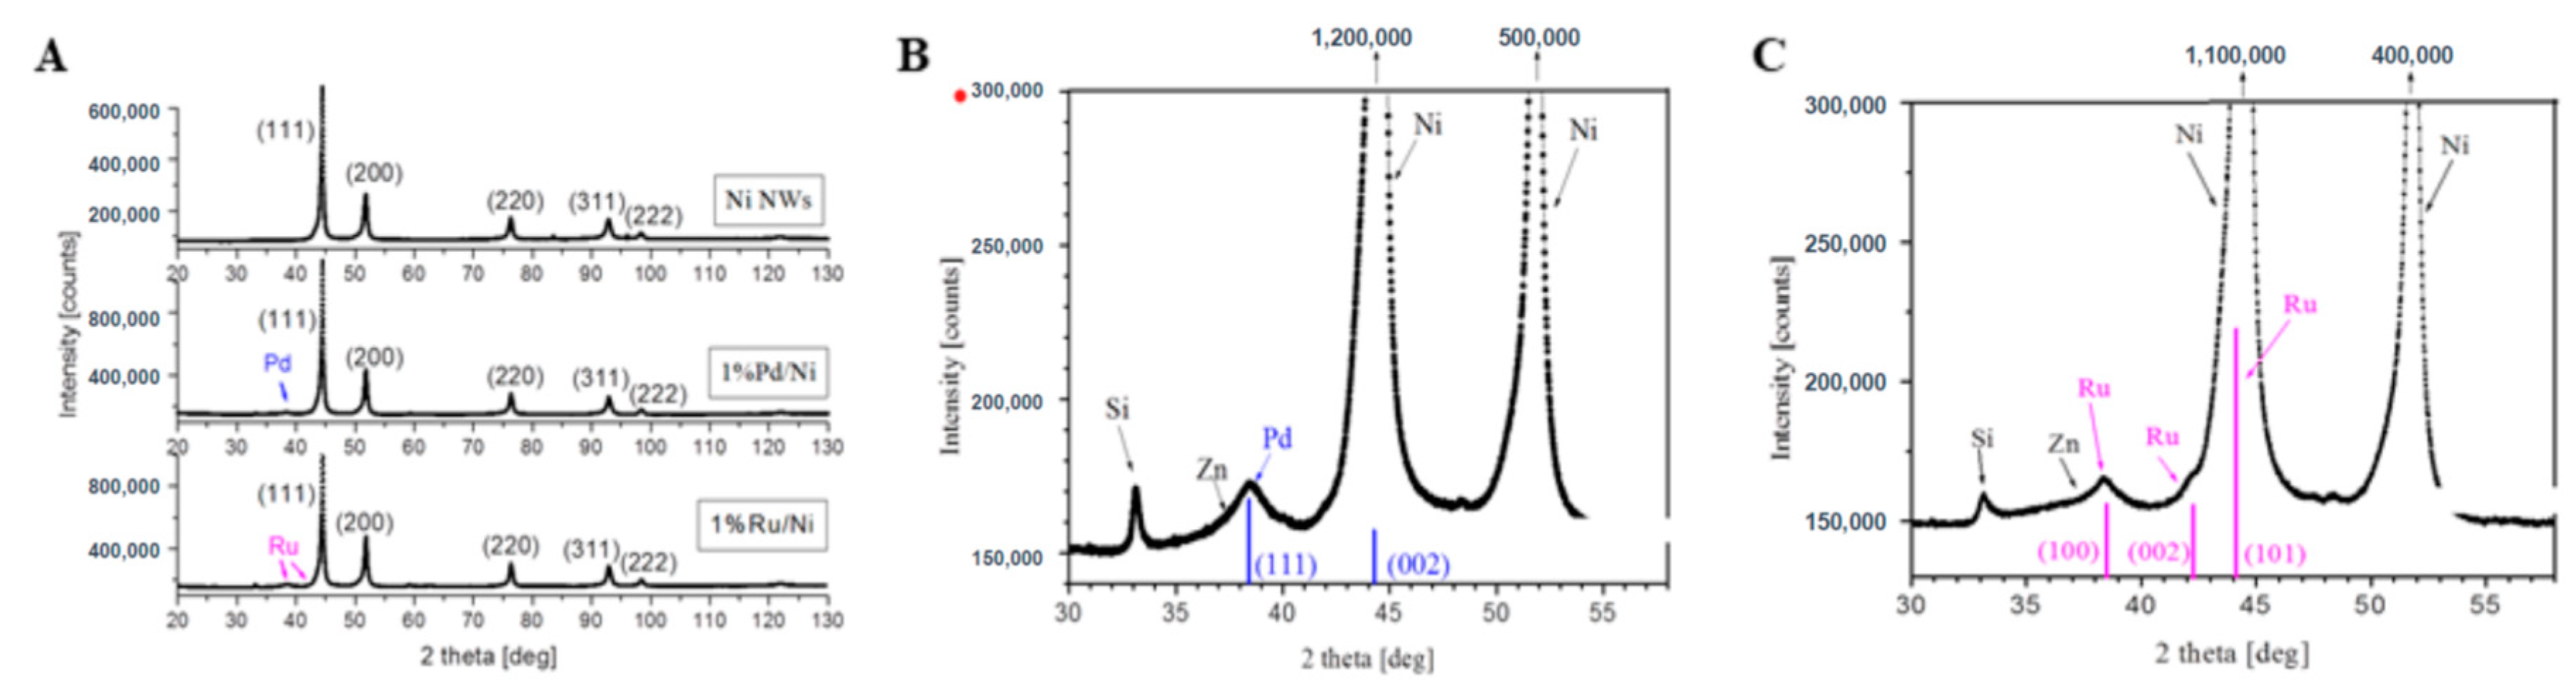
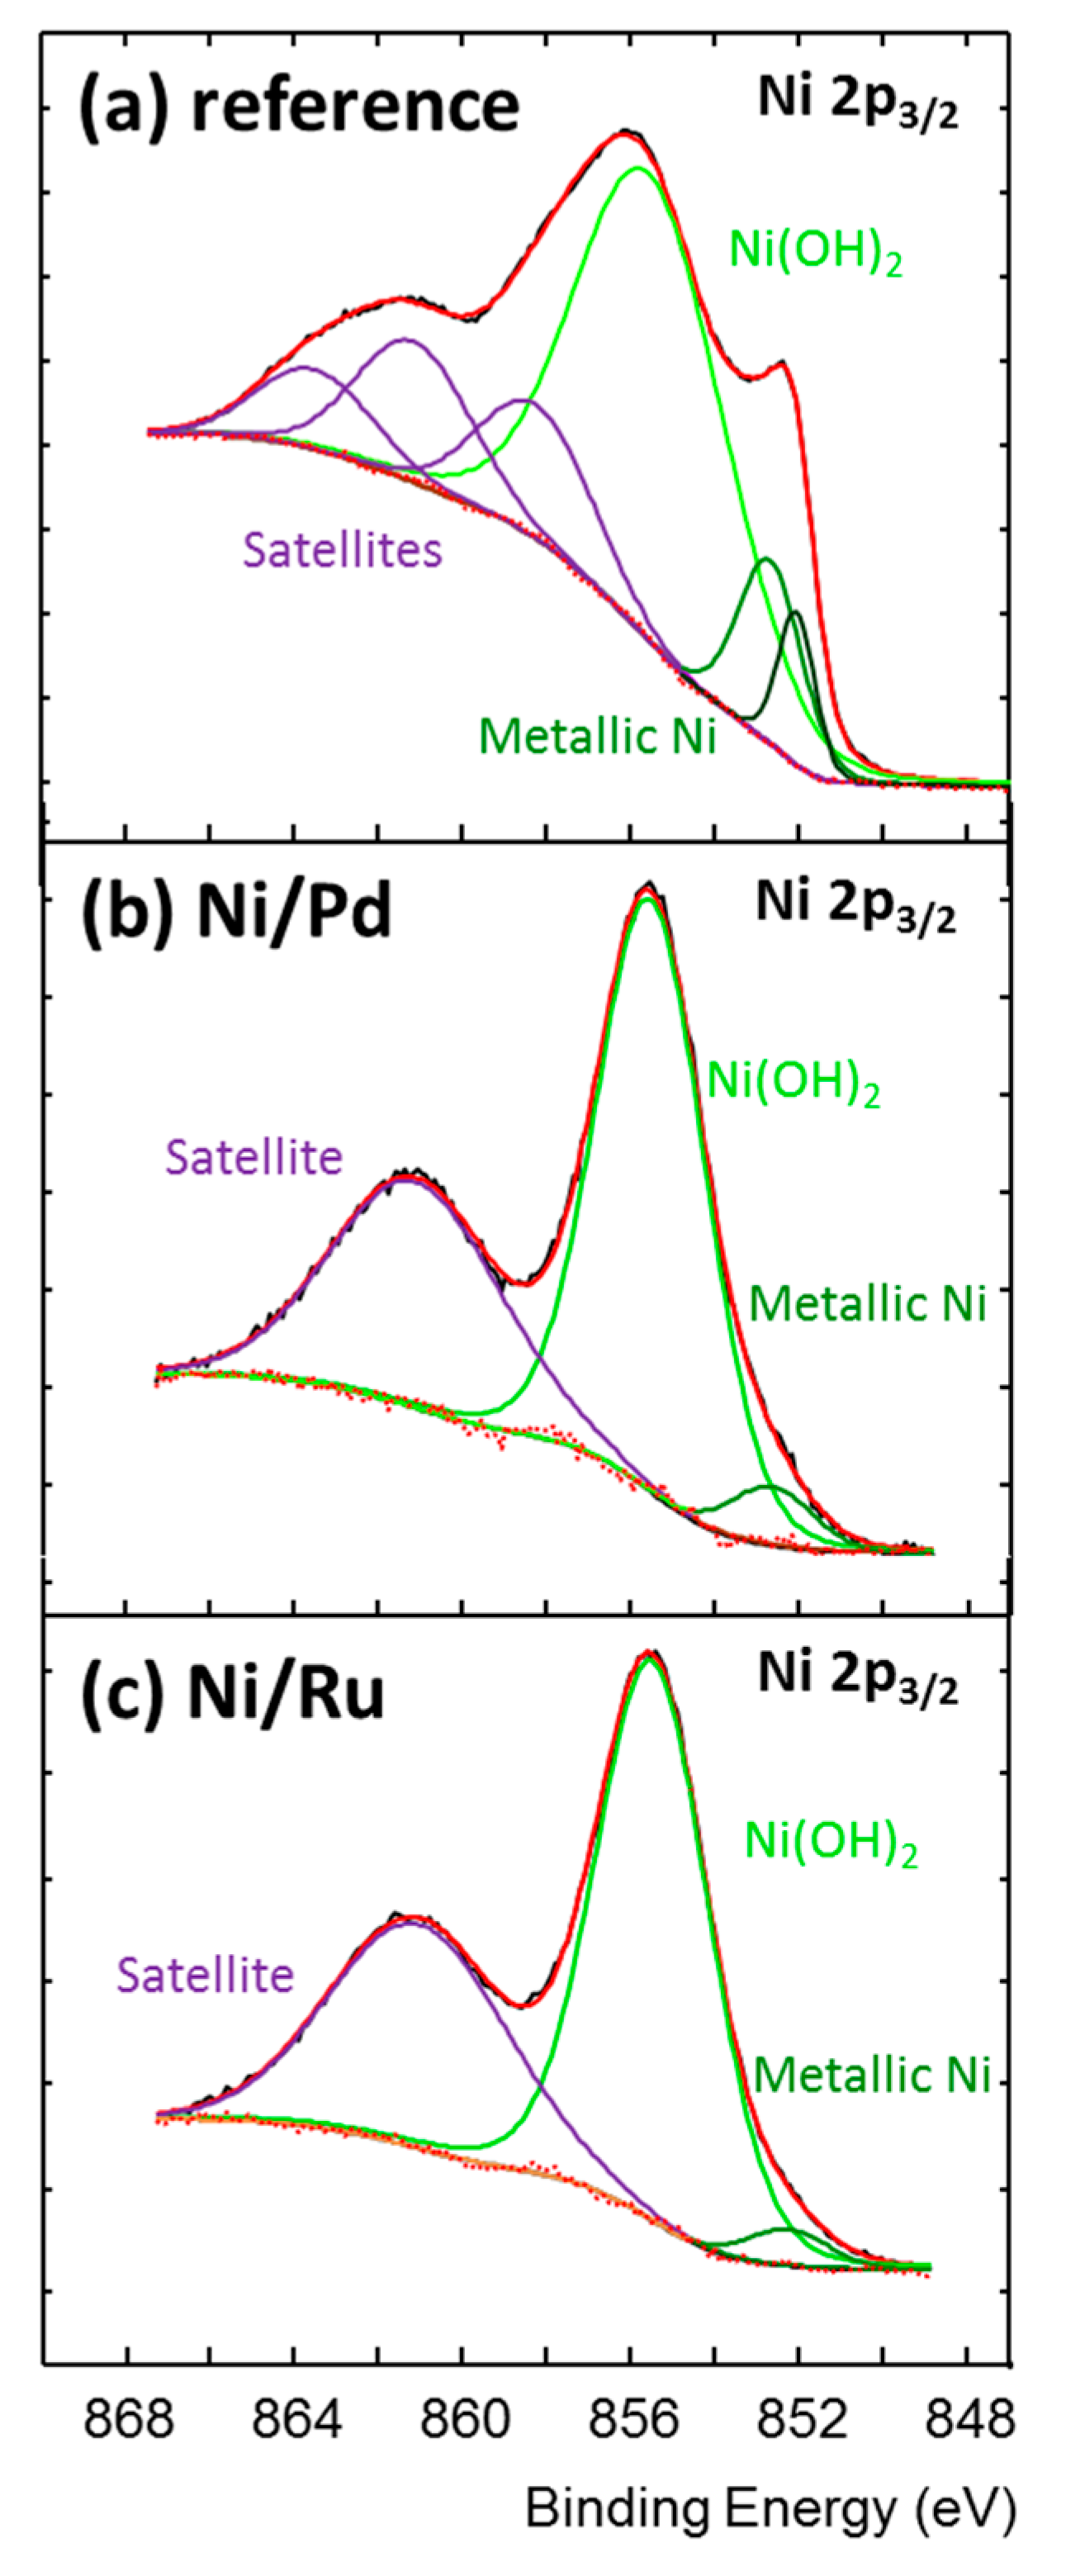
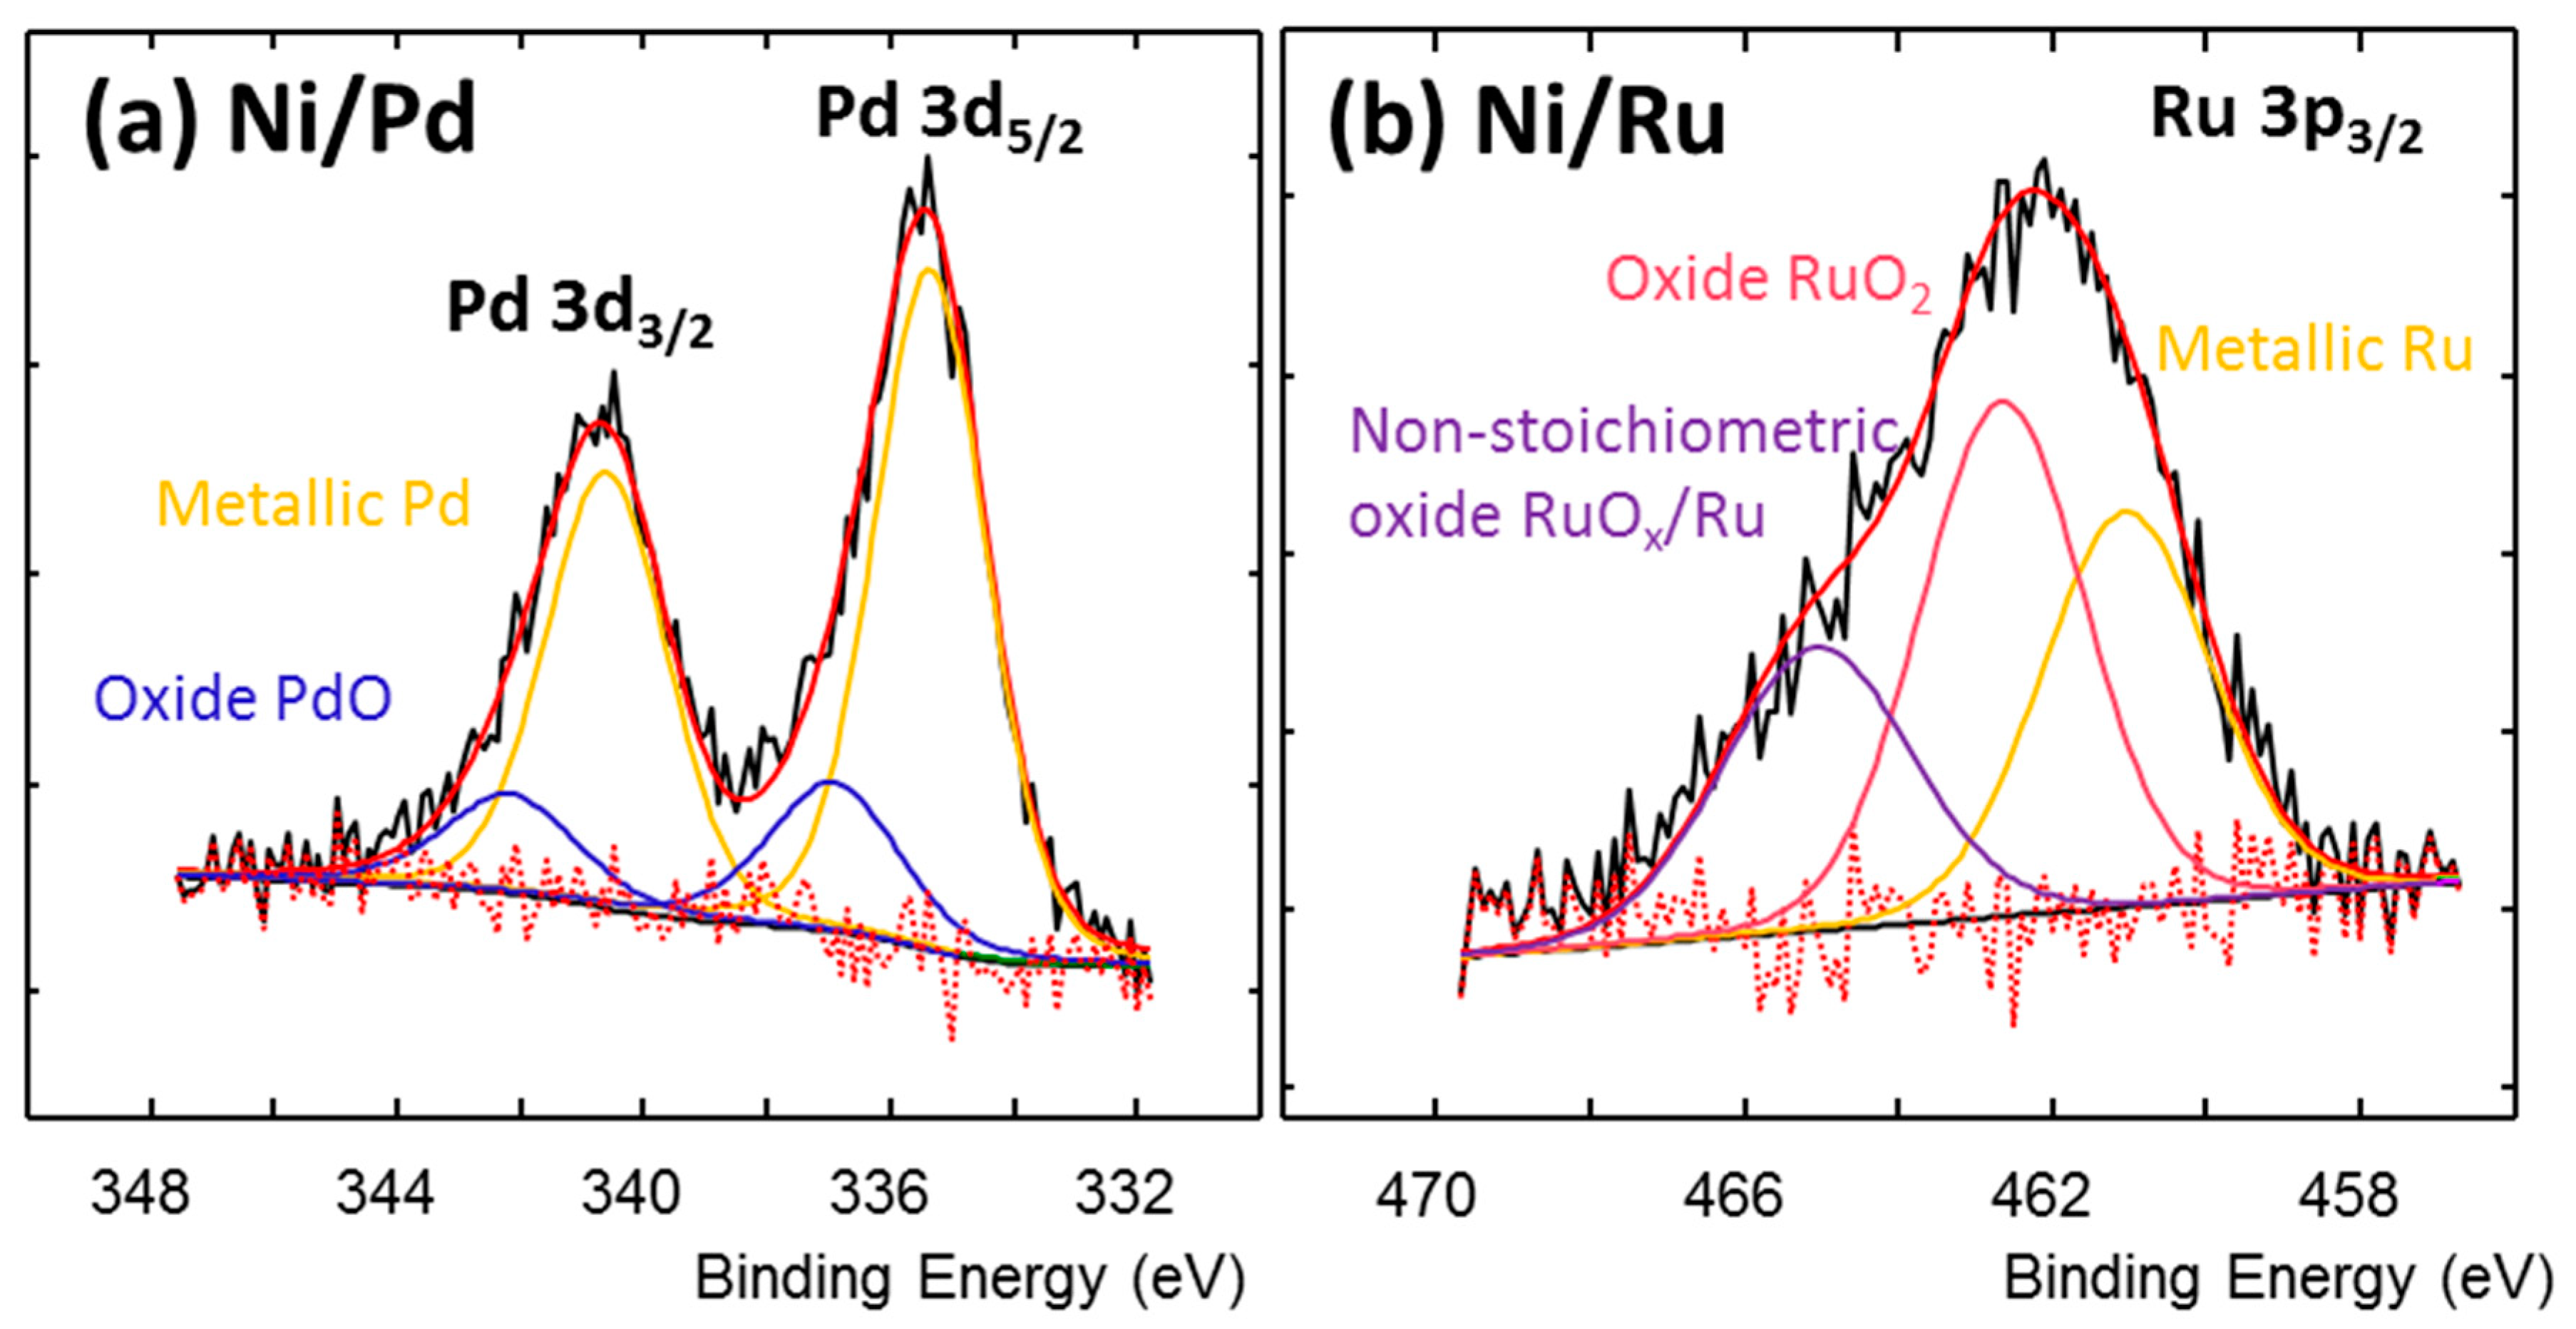
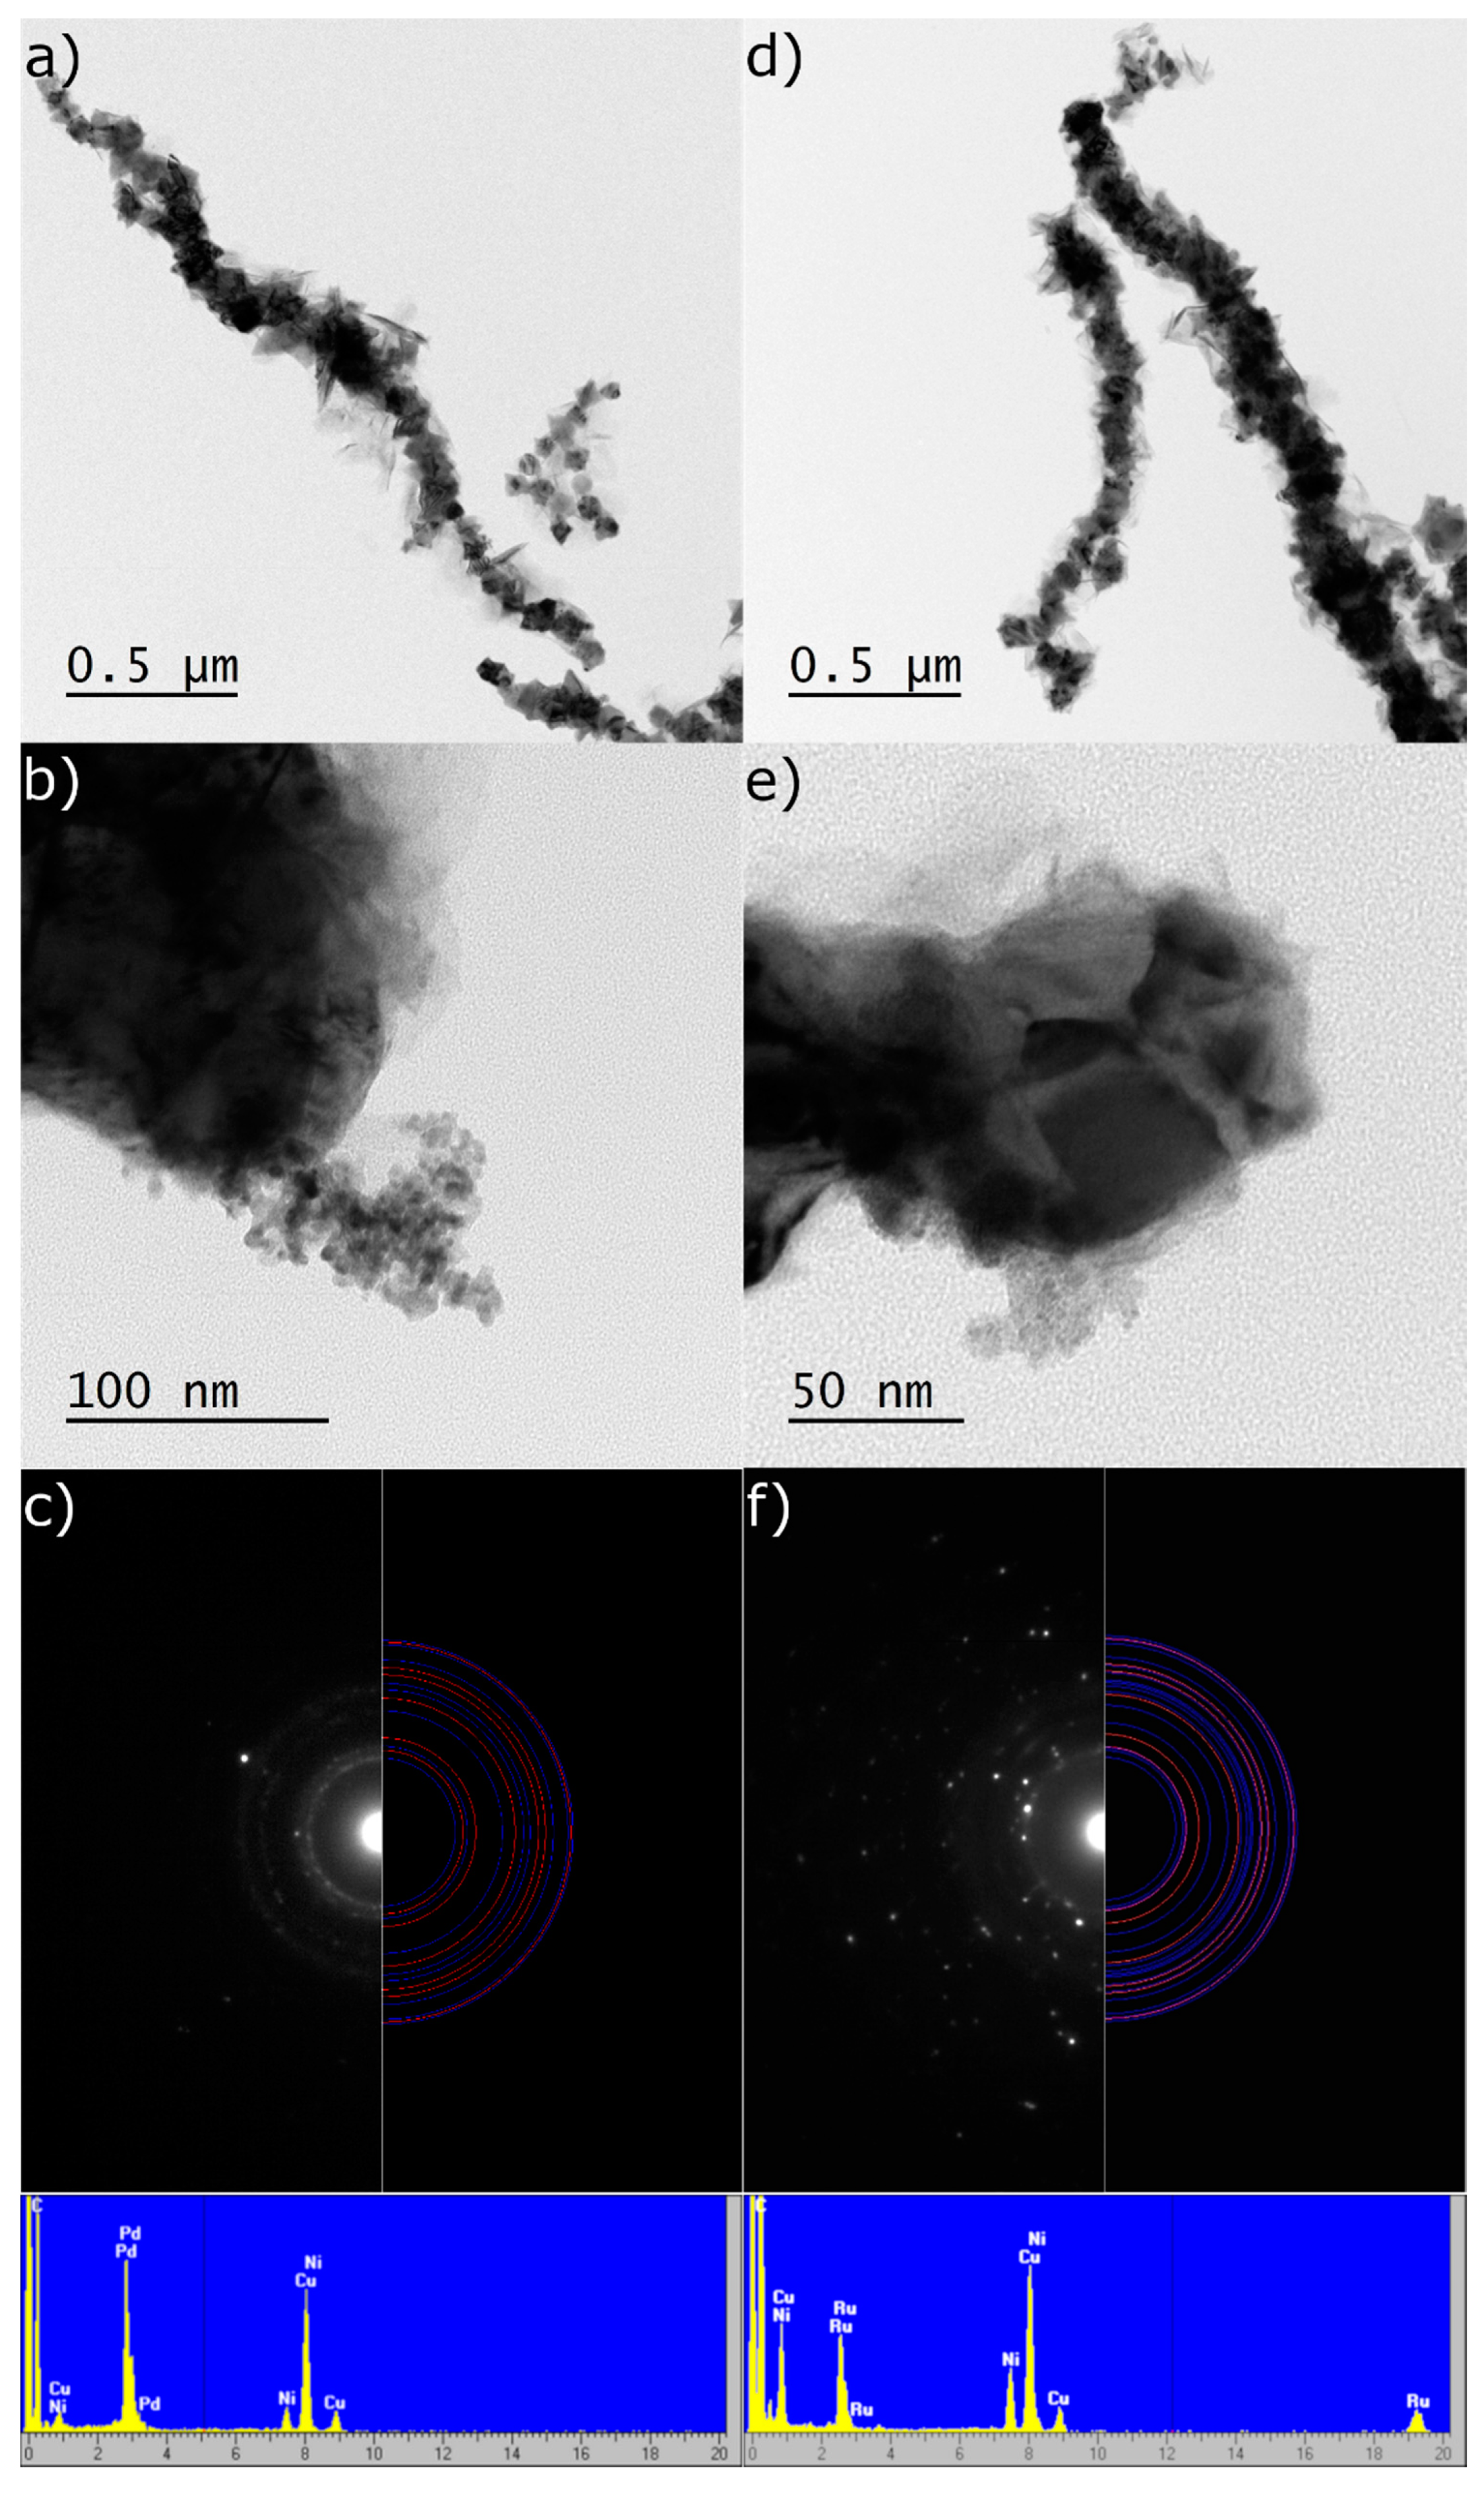
2.1. The Design, Preparation, and Structure of the Catalysts

The Energy dispersive X-ray fluorescence (EDXRF) spectrum of the 1.0% Ru/Ni at a nanowire carrier (Figure 1) has high-intensity Ni Kα and Ni K β peaks at 7.48 and 8.26 keV, Ru Kα and Ru Kβ peaks at 19.28 and 21.66 keV and Fe Kα, Zn Kα and Zn Kβ peaks at 6.40, 8.64, and 9.57 keV, respectively. The EDXRF spectrum also revealed several sum and escape peaks that corresponded with the high-intensity Ni Kα and Ni Kβ peaks. A quantitative analysis performed using the fundamental parameter method is presented in Table 1. The Ni foams that were used for the comparison were purchased commercially. However, the specific surface of the tested Ni foams was relatively low compared to the nanowires.
The X-ray diffraction patterns of the 1.0% Ru/Ni, 1.0%Pd/Ni, and Ni nanowire samples are presented in Figure 2. The peaks at about 44.5, 51.8, 76.4, 92.9, and 98.4 were attributed to the (111), (200), (220), (311), and (222) lattice planes of the crystalline Ni [JCPDS no. 03-065-2865], respectively. The patterns clearly showed peaks that could be attributed to the Ni nanowires (NWs), whereas only the most intense peak was observed for metallic Pd (2θ111~39). Because the strongest Ru (101) and Ni (111) diffraction lines overlapped at 2 θ~44° (see Figure 2B), the less intensive peaks of Ru NPs were analyzed. A qualitative phase analysis showed that small amounts of Zn and Si were also detected on the diffraction patterns of 1.0% Ru/Ni and 1.0% Pd/Ni in the nanowire samples. An X-ray diffraction line broadening analysis was used to characterize the Ni NWs-supported Pd and Ru nanoparticles and the Scherrer formula was applied to estimate the average particle size. An analysis of the experimental profiles showed that both the Ru and Pd diffraction lines were very broad (FWHM is about 2–3°), which suggests that the nanoparticles are very small. The particle size was estimated from the strongest diffraction lines (2θ111~39 for Pd NPs and 2θ100~38.4 and 2θ002~42.2 for Ru NPs) and they were about 3–5 nm for the studied catalysts. For the Ni nanowires, the values were larger at about 8–9 nm. The lattice parameters of the investigated samples were also calculated using the “Chekcell v.4” computer program. The results are listed in Table 2.
In order to further understand the composition and elemental states in bimetallic Ni/(Pd, Ru) nanowire systems, X-ray photoelectron spectroscopy (XPS) was used to obtain the surface information of the products. Because of the limited inelastic mean free path of photoelectrons, only the chemical state of the surface layers was reachable, and, therefore, the in-depth analysis was limited to about 2–4 nm. We paid particular attention to the electronic structure of the components of the examined systems by analyzing the Ni2p, Pd3p, and Ru4p core levels.
The structure of the Nip2p3/2 core level of the examined systems is presented in Figure 3. For the reference sample (see Figure 3a), multiple states of Ni were observed including metallic Ni (peak at 852.66 eV [26], 852.04 eV, which is similar to other nanostructured [27] forms) and nickel(II) dihydroxide (Ni(OH)2, which peaked at 855.52 eV [28]). The remaining peaks in the spectrum of the reference sample were characteristic for nickel and its oxide satellites. In the bimetallic systems, a trace of metallic nickel was observed in both Ni/Pd and the Ni/Ru systems (see Figure 3b,c, respectively). However, the dominant contribution to the chemical states of nickel was detected for Ni(OH)2. The content of the individual Ni states was different for each examined system. For the reference sample, 80.3% of the Ni atoms were in an Ni2+ state (Ni(OH)2) and 19.7% were in an Ni0 state (6.4% for the metallic state at a lower binding energy and 13.3% for the metallic state at a higher binding energy). In the bimetallic systems, a share of metallic Ni decreased. For the Ni/Pd system, the Ni2+ states constituted 93.4% of all of the Ni atoms, whereas, for Ni0, it was only 6.6%, while even a lower content of the metallic state were observed for the Ni/Ru system in which only 4.1% of all the Ni atoms were in the Ni0 state.
The relative Ni/Pd ratio, which was determined from the calculated atomic concentration, was 38.8 atomic %, whereas, for the Ni/Ru system, the Ni/Ru ratio was about 47.8 atomic %. For the Ni/Pd system, an additional analysis of the palladium chemical state (see Figure 4a) revealed that the palladium in the examined system existed in two chemical states. About 78.7% of all of the palladium atoms occurred in the metallic state (Pd3d5/2 at 335.33 eV similar to [29]), while the remaining 21.3% of Pd (Pd3d5/2 at 336.9 eV) existed in the form of PdO oxide, which is similar to Reference [30]. Analysis of the Ru3p3/2 core level in the Ni/Ru bimetallic system revealed (see Figure 4b) the presence of three different chemical states. The first chemical state, which was detected at 461.06 eV, was related to metallic Ru [31,32] and represented 33.5% of all of Ru atoms. Additionally, 40.9% of all of Ru atoms were in the second chemical state, which was visible at 462.66 eV. This can be ascribed to the RuO2 oxide [32,33], while the last chemical state of Ru was related to the peak at 465.07 eV and was assigned to non-stoichiometric oxide RuOx/Ru as in Reference [34]. For both the Ni/Pd and Ni/Ru systems, there was no evidence of chemical states that indicated a chemical bonding between Ni and Pd or Ni and Ru atoms. However, the formation of an alloy cannot be excluded since any expected chemical shift could be very small.
The transmission electron microscopy (TEM) (Figure 5) confirmed the nanosized character of the Ni wires. As can be seen in Figure 5a,d, the Ni wires were composed of blocks that were joined in wires. Both Pd and Ru nanoparticles were observed on the surface of the Ni wires. The presence of nanoparticles on the nanowire surface was confirmed by their selected area electron diffraction patterns and by an energy-dispersive spectroscopy (EDS). The TEM micrographs show that both types of nanoparticles were arranged individually and as conglomerates.

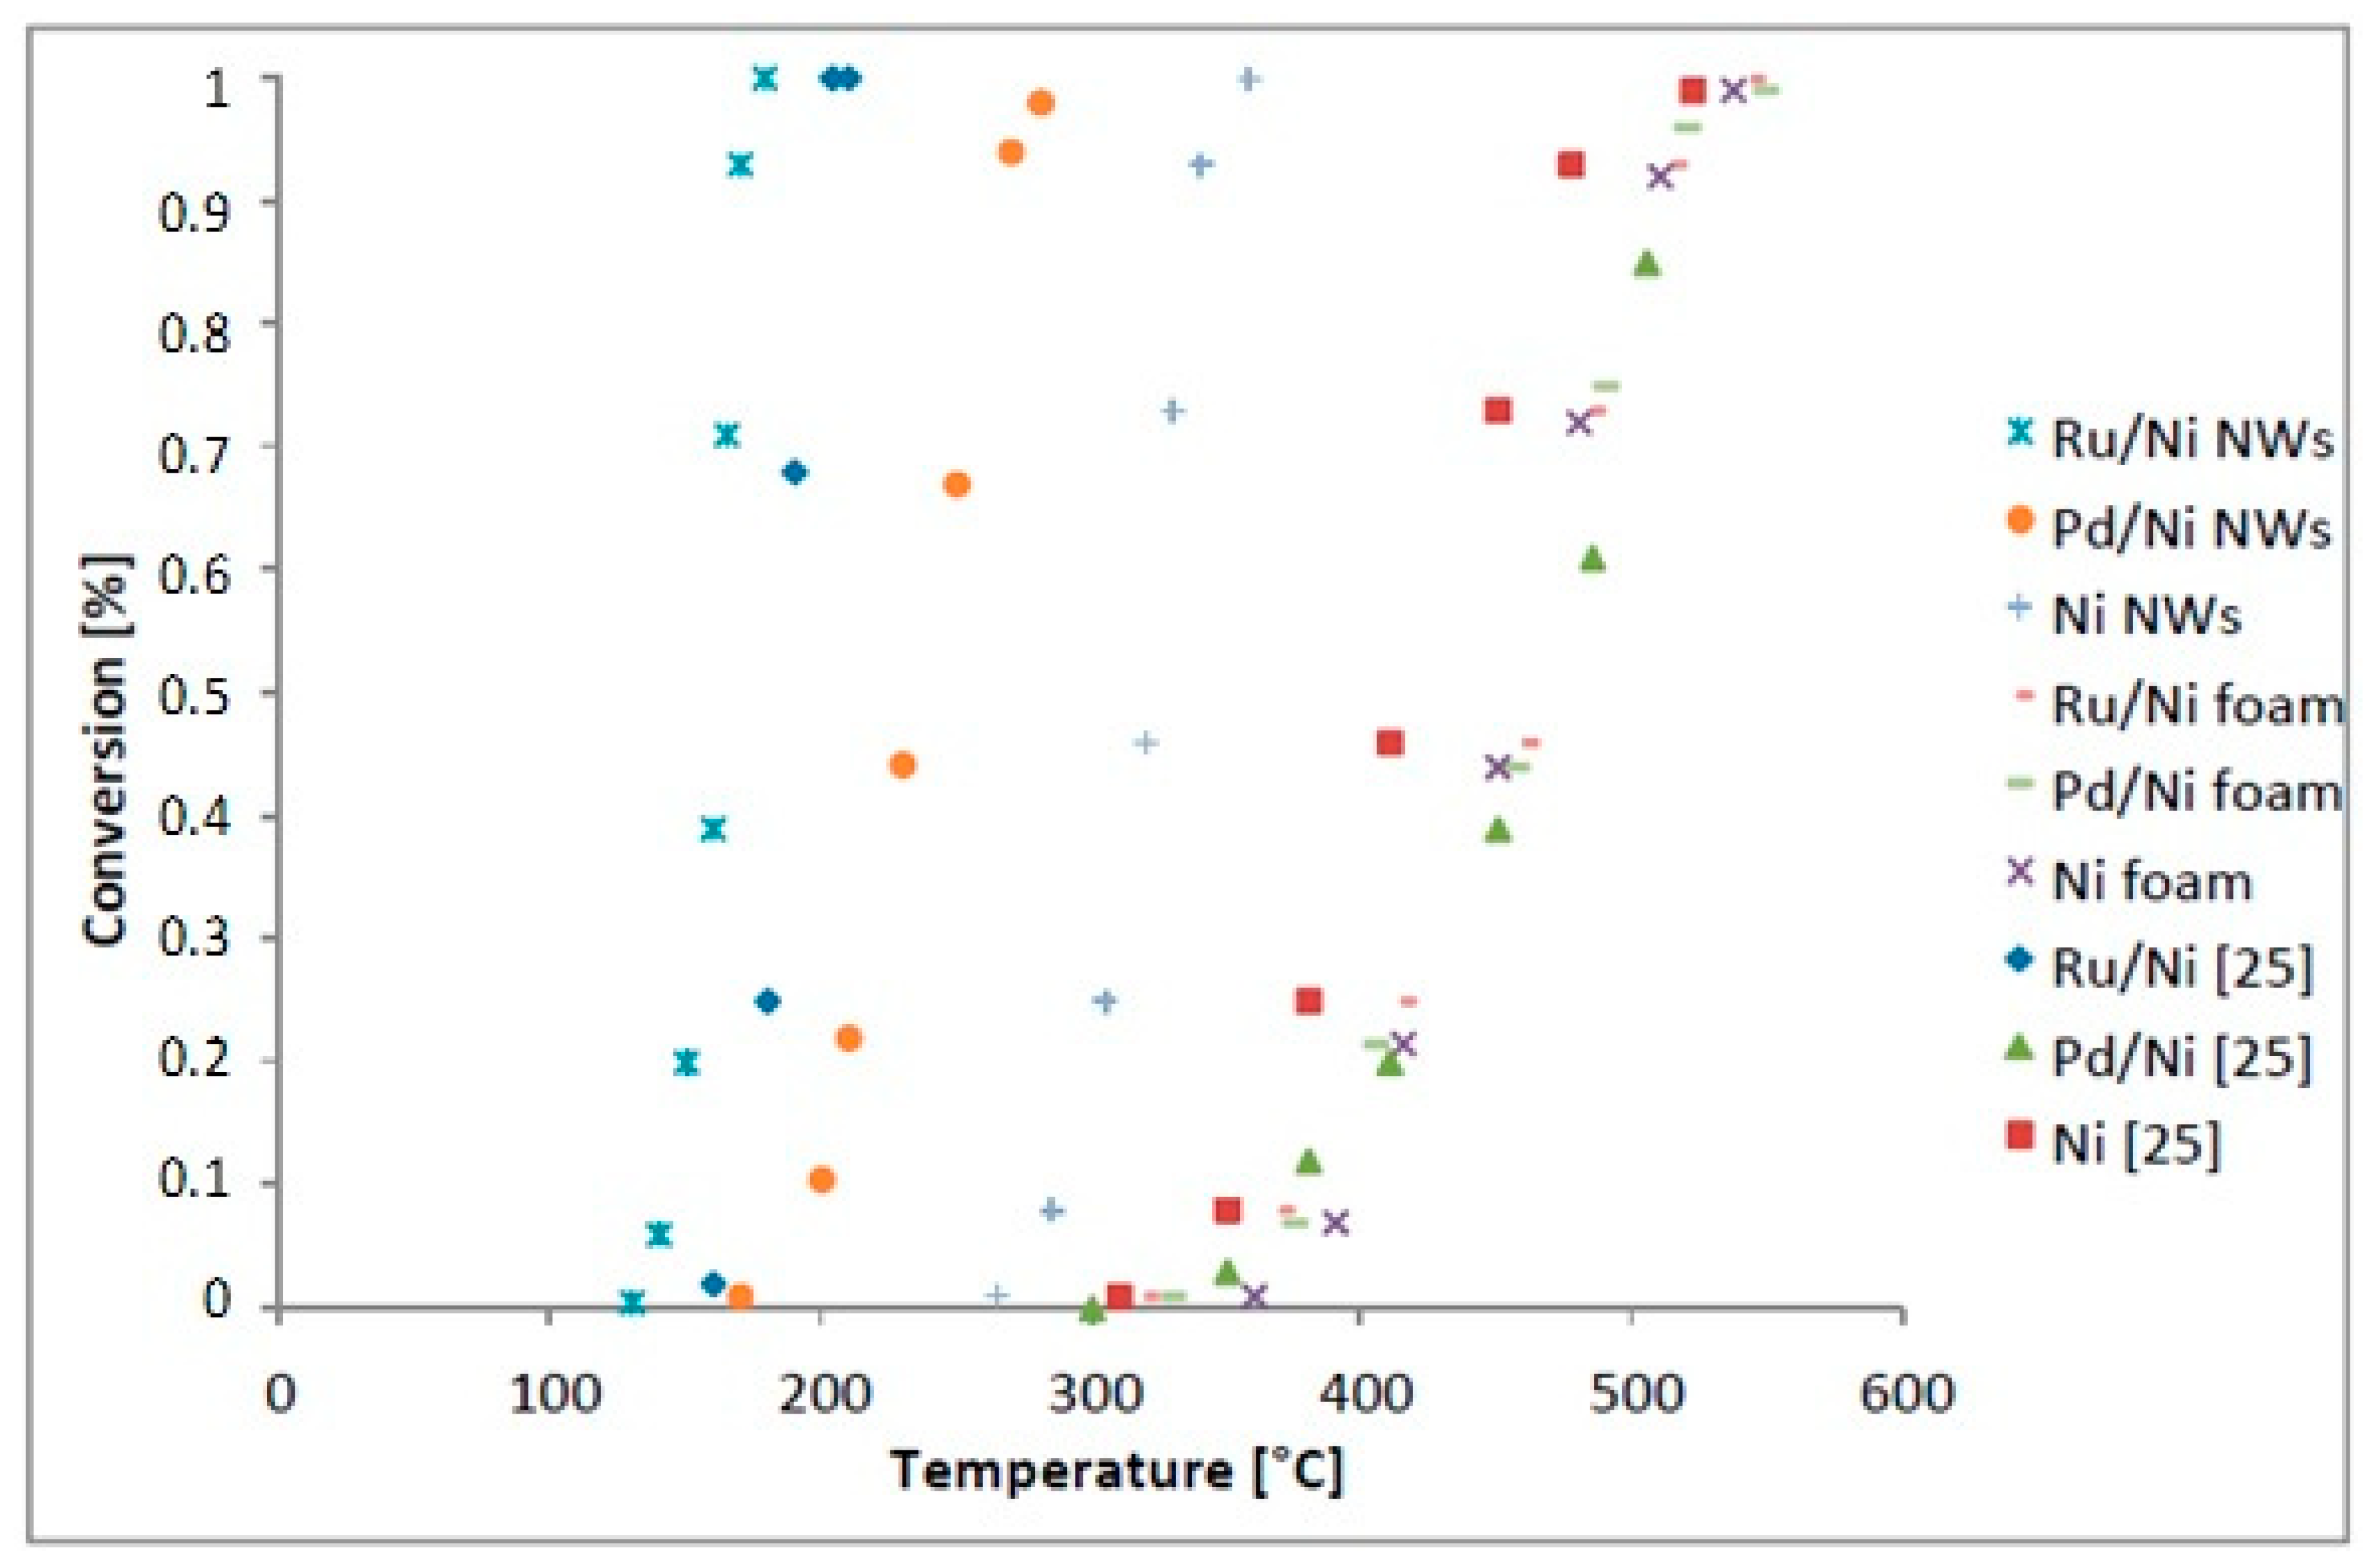
2.2. Methanation of CO2

The relationship between the methane yield (conversion degree) and temperature for the novel catalyst are plotted in Figure 6. The nano-Ru/nanowired-Ni system appeared to be the most active catalyst and produced a 100% conversion at a temperature of ca. 179 °C. Moreover, we observed the onset of the reaction at ca. 125 °C. At these points, the reaction was 100% selective toward methane. This means that the activity of the nanowire system clearly exceeded that of the Ni carrier as the reference material, which needed 358 °C for a conversion of 100%. A comparison of the nano-Ru/nano-wired-Ni to the analogous nano-Pd/nanowired-Ni clearly illustrated the advantageous performance of the Ru-based system or Ru/SiO2 ca. 400 °C to achieve a conversion of 100%. The new catalyst also appeared to be better than other systems reported in the literature for which the Ru-Ni bimetallics required 400 °C to achieve an 82.7% conversion with a 100% methane selectivity [25,35].
Table 3 compares our results with those reported in other studies. For this comparison, we used the turnover frequency (TOF), which is a parameter that allows a direct comparison of the catalytic measurements from various experiments. The Ru NPs supported on the Ni nanowires whose TOF productivity was 2479.2 at 179 °C (Table 3, entry 1) appeared to be superior to all of the other reported systems (Table 3, entries 11–12). We observed a 100% conversion to methane at this high TOF. The catalytic ability of all of the other Ru/Ni catalytic constructs were lower and were similar to those that have been reported in the literature for the Ru/Ni systems. Similarly, replacing nano-Ru with nano-Pd resulted in a significant decrease in the catalyst activity TOF = 2265.4 at 281 °C (Table 3, entry 2). However, similar to the Ru-nano-wired-Ni system, the activity of the Pd-nanowired-Ni compared advantageously to the other nano-Pd/Ni system (Table 3, entry 4). Practically, the large gap in the reactivity of the investigated systems at low temperatures compared to all of the other investigational or commercial systems is of crucial importance in this case because methanation can be significantly enhanced at low temperatures [22,23,24,25].
An interesting issue is that the surface of the high activity nano-Ru-nanowired-Ni catalyst was composed of the oxidized forms of the metals to a great extent. In particular, the Ni and Ru were mainly in the form of Ni(OH)2 and RuO2. Up to ca. 92% of Ni occurred in the form of Ni2+, while barely 4% took the form of Ni0. The presence of the non-stoichiometric oxides RuOx/Ru is also worth mentioning because the presence of metal oxides, in the form of nonstoichiometric compounds, especially those with defects, can greatly contribute to the catalytic activity of the oxide compositions. This can enable the efficient heterogeneous hydrogenation of gaseous carbon dioxide [21]. Moreover, the nano-Ru that was supported on the Ni-nanowires differed from the nano-Pd that was supported on the Ni-nanowires whose activity were notably lower, namely, 179 °C with a TOF = 2479.2 vs. 281 °C with a TOF = 2265.4 (see Table 3 entry 1 vs. 2). We observed that Pd was present in the form of well-defined compounds, i.e., almost 80% of all of the palladium atoms occurred in a metallic state and ca. 21% of Pd existed in the form of PdO. Therefore, we can speculate that this difference also explains the difference in the reactivity of the systems. Therefore, our study demonstrates how important the imperfect catalyst oxide structures are in the catalysis of the methanation reaction.
The nano-wired Ru/Ni system appeared to be very stable. The high performance of the catalyst could always be restored when it was used for a long time (10 h) or cycled between the ambient temperature and active temperature modes. One of the reasons for this is the low-temperature activity of the catalyst. Therefore, the active surface species could have not been destroyed under a high temperature. One question is: how did the surface species of the virgin catalyst compared to the catalyst affect the reaction? By comparing the surfaces of the virgin and used catalytic systems, we could also have expected information on the potential mechanism of CO2 methanation. Flight-Secondary Ion Mass Spectrometry (TOF-SIMS) is a method that is able to provide information from the one to three topmost monolayers of a sample surface. Accordingly, we used the TOF-SIMS method to compare the Ru/Ni nanowires before and after CO2 methanation ( Supplementary materials Figures S1 and S2). This enabled us to observe the presence of the carbon species associated with Ru (RuCO2H- (m/z = 147) and CORu (m/z = 130)) on the catalyst surface after the reaction. A series of hydrocarbons (C1−C7) were also observed. This complies well with the alleged mechanism of CO2 reduction in an Ru/Ni system that involves the adsorption of CO2. CO2 is then converted to CO in a slow process in which it is reduced to hydrocarbons and to CH4 [37]. The TOF-SIMS of the virgin catalyst was practically the same as the catalyst after the reaction. To explain this we should observe the atmosphere is a source of CO2 which adsorption on Ru at low temperatures is a well-known fact [38]. Therefore, CO2 could be adsorbed at a surface of the virgin Ru catalyst or catalyst precursor. In turn, the products of reduction can be formed when preparing the Ru nanoparticles using hydrogen. Accordingly, the surface carbon species on a virgin Ru/Ni catalyst surface are formed when preparing or storing a catalyst. Accordingly, the structure of the catalyst surface species is stable. Higher temperatures and a new portion of reactive hydrogen are needed to desorb methane from the surface and to induce a reaction. On the other hand, the stability of the surface species of the catalyst explains the high degree of stability and durability of a catalyst. The TOF SIMS spectra indicate various modes of CO2 adsorption at the Ru component. In turn, hydrogen adsorption is connected to the Ni component. This mode complies with what was previously observed for the Ru/Ni system [21,37].
We also tested the applicability of Ni foams as potential supports for decorating with nanostructured Ru and Pd. Both catalytic systems appeared to be much less active than the nano-wired systems. The reason is likely due to the specific surface of the foams being too small when compared to the 83.14 m²/g Ni nanowires (Table 3 entries 1 and 2) versus the Ni foams 3.45 m²/g for Pd/Ni and 3.06 m²/g for Ru/Ni (Table 3 entries 3 and 4). It could also be the result of the high porosity of the Ni nanowires of 99.31% (reaching the level of aerogels). From the practical point of view, we have presented in this paper a completely novel nano-Ru supported on a nano-wired Ni that appears to be highly reactive in the methanation of CO2 at temperatures as low as 130 °C.

3. Materials and Methods

3.1. Materials

Commercially available chemical reagents were used in the study: nickel chloride (II) hexahydrate (NiCl2∙6H2O, 99.9%, Sigma-Aldrich), ethylene glycol (EG, 99%, Chempur), sodium hydroxide (NaOH, 99%, Chempur), and hydrazine hydrate (N2H4∙H2O, 64–65% content, 98%, Sigma-Aldrich), Ni powder (Sigma-Aldrich), and Ni foams (Racemat BV, Netherlands). All of the chemicals were used without further purification. A neodymium magnet (1.3 T) was used to separate the nickel nanowires from the liquid medium. The Ni foam was Ni-4753 (number of pores/inch―47–53, estimated average pore (Ø)―0.4 mm, average density―0.4–0.7 g/cm3, relative density (foam/solid Ni)―4.8%, porosity (100% rel. density)―95.2%, specific surface―5400 m2/m3, specific surface area density―0.079 kg/m2, sheet length―900 mm and sheet width―600/500 mm).

3.2. Preparation of the Nickel Nanowires

The nickel nanowires (NiNWs) were prepared according to the method published elsewhere [5], which we optimized. In a typical procedure, 70 mL of 0.1 M NaOH in ethylene glycol (EG) was combined with 20 mL of hydrazine. The mixture was heated on a hot plate under constant stirring and, once it reached 100 °C, 10 mL of 0.1 M NiCl2 in ethylene glycol (EG) was added dropwise. The reaction was carried out until the gray magnetically active precipitate stopped forming and aggregating in the vicinity of the magnet. The solid was then separated from the solvent using magnetic decantation. It was rinsed with plenty of isopropanol and distilled water to remove the adulterants. Afterward, the NiNWs were dried overnight at 100 °C under ambient conditions.

3.3. Preparation of the Catalyst

3.3.1. Preparation of 1.0% Pd or Ru NPs on the Sol-Gel Silica Carrier

The monometallic Pd or Ru nanoparticles (NPs) were supported on silica according to the optimized procedure. To prepare the carrier, we used the Stöber tetraethyl orthosilicate (TEOS) method in a mixture of a 25% aqueous ammonia solution with methanol and water [39,40,41]. After the obtained precipitate underwent sonication, concentration, and drying, it was reduced under hydrogen (at 500 °C). In the main steps, a 1500 mL solution of anhydrous 99.8% methanol and 528 mL of 25 wt.% of the ammonia solution were mixed with 305 mL of deionized water for 10 min. Next, 100 mL of TEOS was added and stirred for 5 h (25 °C). The colloidal silica was centrifuged and stirred in an ultrasound bath for 90 min. The precipitate was washed with distilled water to a neutral pH. A solution containing a Pd or Ru precursor (0.435 g PdCl2 or 0.00285 g 35–40% RuCl3·H2O) in deionized water (10 mL for RuCl3·H2O and 8 mL with 2 mL 35% HCl for PdCl2) was added dropwise into the obtained carrier, i.e., colloidal silica, stirred for 30 min, dried at 60–90 °C (12 h in dark), ground, and sieved. Lastly, the obtained product was reduced under hydrogen (500 °C, 4 h).

3.3.2. Preparation of the Bimetallic Pd/Ni and Ru/Ni Catalysts

The Ru and Pd NPs, which were supported on Ni nanowires or Ni powder or Ni foam, were transferred from the intermediate carrier, i.e., SiO2 to the target carrier [25,40]. In a multistep procedure, the target carrier Ni (10.00 g) and Pd or Ru NPs of the desired polydispersity were deposited onto the intermediate carrier, e.g., 1.0% Pd/SiO2 (10.10 g) or 1.0% Ru/SiO2 (10.10 g), stirred mechanically, and sonicated with deionized water (80 mL). The resulting suspension was stirred for 10 min. Sodium hydroxide (23.3 mL 40% w/w) was added for the next 2 h at room temperature. The obtained product was allowed to sediment (ca. 18 h) and then centrifuged. After decantation, the resulting supernatant was washed with deionized water (eight times) and centrifuged to a neutral pH. The catalyst obtained after washing the precipitate was dried at 120 °C.

3.4. Methods of Catalyst Characterization

An Epsilon 3 energy-dispersive X-ray fluorescence (EDXRF) spectrometer (Panalytical, Almelo, The Netherlands) with a Rh target X-ray tube operating at a maximum voltage of 30 keV and a maximum power of 9 W was used for the chemical analyses. The spectrometer has thermoelectrically cooled the silicon drift detector (SDD) with 8-μm of Be window. The resolution was 135 eV at 5.9 keV. The Omnian software was used for the quantitative analysis based on the fundamental parameter method and the following measurement conditions: 5 kV, 300 s counting time, helium atmosphere to determine Si and P, 12 kV, 300 s counting time, helium atmosphere, 50 μm Al primary beam filter for Ca, 20 kV, 120 s counting time, air atmosphere, 200 μm Al primary beam filter for Fe and 30 kV, 120 s counting time, air atmosphere, and 100 μm Ag primary beam filter for Ni, Zn, and Ru. The current of the X-ray tube was fixed to not exceed a dead-time loss of ca. 50%.
A JEOL high resolution transmission electron microscopy (HRTEM) JEM 3010 working at a 300 kV accelerating voltage and equipped with a Gatan 2 k × 2 k OriusTM 833SC200D CCD camera and an EDS detector was used for the TEM characterization of the resulting materials. Isopropanol was used to suspend the samples, which were then deposited on a Cu grid that had been coated with amorphous carbon film standardized for the TEM observations.
The structural features of the catalysts were studied using the X-ray diffraction technique (XRD). The experiments were performed on a high-resolution PANalytical Empyrean diffractometer with Cu Kα radiation (40 kV, 30 mA) with a PIXcel detector. The data were collected in the 10°−140° 2θ range with a 0.0131° step. The “X’Pert High Score Plus” computer program and data from the ICDD PDF-4 database was used for the phase analysis.
X-ray photoelectron spectroscopy (XPS) using a Physical Electronics PHI 5700 spectrometer was used to analyze the Ni-based bimetallic systems. Monochromatic AlKα X-ray radiation (hν = 1486.7 eV) was operated to generate the photoelectron spectra of the core levels of particular elements. The obtained XPS spectra were analyzed using the Multipak v. 9.0 software from Physical Electronics.
The sample was degassed under a vacuum at 350 °C for 5 h before the adsorption measurements in a 3Flex apparatus (Micromeritics, Norcross, Georgia, USA). The N2 adsorption isotherm at 77 K in the range of 0.05 to 0.3 relative pressure was determined and the Brunauer–Emmett–Teller (BET) surface area was calculated.
The porosity of the NiNWs was measured using helium pycnometry (Accu Pyc 1330, Micromeritics). Prior to the measurement, the sample was kept at 200 °C for 4 h for degassing purposes. The measurement, which was carried out at room temperature, was repeated 10 times to ensure the reproducibility of the results.
The Flight-Secondary Ion Mass Spectrometry (TOF–SIMS) measurements were performed using a TOF-SIMS.5 (ION-TOF GmbH, Munster, Germany) reflection-type spectrometer, which was equipped with a bismuth liquid metal ion gun. Double-sided adhesive carbon tape was used to place the powdered samples into the sample holder. Positive and negative secondary ion spectra were collected by rastering the bismuth ion beam (30 kV, ~1 pA) across predetermined 500 × 500 μm areas. To ensure the maintenance of the static conditions, a primary ion dose was kept below 1012 ions/cm2 for all samples. An electron flood gun was used to compensate charging of the surfaces of the samples. SurfaceLab6.4 software was used for the analysis. The spectra positive spectra were internally mass calibrated using H+, CH3+, C2H3+, C3H3+, and C3H5+ ions, whereas the negative ones were internally mass calibrated H, C, CH, C2, C2H, C3, and C3H.

3.5. Methanation

A quartz flow microreactor with a fixed catalyst bed (7.5 mm diameter) was used to investigate the methanation. The feeding gas mixture was composed of 20% CO2 + 80% H2. This was continuously injected at a flow rate of 3 dm3/h under atmospheric pressure. The composition of the tail gases was measured using a thermal conductivity detector-equipped SRI gas chromatograph (1/8-inch diameter, 3-m long column, micro-packed with active carbon 80–100 mesh. The column temperature was 80 °C and Ar was used as the effluent gas (10 dm3 h−1).

4. Conclusions

In summary, the low-temperature methanation of CO2 can open a novel strategy for engineering this reaction because the thermodynamics of the reaction gets more advantageous at lower temperatures. However, a low temperature is usually considered to be 300–400 °C in the literature. We have shown in this study that a completely novel system of nano-Ru, which was supported on nano-wired Ni, appeared to be highly reactive in the methanation of CO2 at temperatures as low as 130–179 °C. A comparison of nano-Pd and nano-Ru, which was supported on Ni-nano-wires, enabled us to prove that oxidized surface metals are highly important for the high activity of the investigated nano-Ru@nanowired-Ni. Moreover, similar to the microscopic Sabatier rule, which indicates that an optimal reactivity level of the catalyst exists, we showed that the Ni nanowires (with a higher specific surface area than the standard metal surface, e.g., in the form of a metal foam, but smaller than nano-sized materials) significantly enhances the performance of the Ru-Ni catalytic system.

Supplementary Materials

The following are available online at https://www.mdpi.com/2073-4344/10/5/513/s1, Figure S1 Positive TOF-SIMS spectra obtained from sample 1 before (blue) and 2 after (red) process presented in narrowed mass range (A) 5–40 u (B) 40–80 u, (C) 80–145 u. The coincidental cover of some Ni and carbon species is possible, e.g., O-CO2+ (m/z = 60) and 60Ni+ (m/z = 60), Figure S2 Negative TOF-SIMS spectra obtained from sample before (blue) and after (red) process presented in narrowed mass range (A) 5–40 u, (B) 40–80 u, (C) 80–151 u.

Author Contributions

Conceptualization, J.P. (Jaroslaw Polanski), M.K., T.S., and A.S. Methodology, T.W., D.L., J.P. (Judyta Popiel), and A.S. Formal analysis, J.P. (Jaroslaw Polanski), M.K., and T.S. Investigation, M.K., T.S., D.J., D.L., R.S., M.Z., J.S., J.K., and K.B. Writing—original draft preparation, J.P. (Jaroslaw Polanski), T.S., M.K., R.S., M.Z., J.S., J.K., and K.B. Writing—review and editing, J.P. (Jaroslaw Polanski), D.L., J.P. (Judyta Popiel), and M.K. Project administration, J.P. (Jaroslaw Polanski). Funding acquisition, J.P. (Jaroslaw Polanski) and D.J. All authors have read and agreed to the published version of the manuscript.

Funding

The National Science Center OPUS 2018/29/B/ST8/02303, the National Science Center, Poland (under the Polonez program No. UMO-2015/19/P/ST5/03799), and the European Union’s Horizon 2020 research and innovation programme (Marie Skłodowska-Curie No. 665778) funded this research.

Acknowledgments

The authors would like to express their appreciation for the technical assistance from Joanna Michalska.

Conflicts of Interest

The authors declare no conflict of interest. The funders had no role in the design of the study, in the collection, analyses or interpretation of data, in the writing of the manuscript, or in the decision to publish the results.

References

  1. Seh, Z.W.; Kibsgaard, J.; Dickens, C.F.; Chorkendorff, I.; Nørskov, J.K.; Jaramillo, T.F. Combining theory and experiment in electrocatalysis: Insights into materials design. Science 2017, 355, 1–12. [Google Scholar] [CrossRef] [PubMed] [Green Version]
  2. Song, C. Proceedings of the 8th international conference on carbon dioxide utilization. Catal. Today 2006, 115, 2–32. [Google Scholar] [CrossRef]
  3. Kondratenko, E.V.; Mul, G.; Baltrusaitis, J.; Larrazábalc, G.O.; Pérez-Ramírez, J. Status and perspectives of CO2 conversion into fuels and chemicals by catalytic, photocatalytic and electrocatalytic processes. Energ. Environ. Sci. 2013, 6, 3112–3135. [Google Scholar] [CrossRef] [Green Version]
  4. Müller, K.; Städter, M.; Rachow, F.; Hoffmannbeck, D.; Schmeiβer, D. Sabatier- based CO2-Methanation by catalytic conversion. Environ. Earth Sci. 2013, 70, 3771–3778. [Google Scholar] [CrossRef]
  5. Zhang, J.; Xiang, W.; Liu, Y.; Hu, M.; Zhao, K. Synthesis of high-aspect-ratio nickel nanowires by dropping method. Nanoscale Res. Lett. 2016, 11, 118–122. [Google Scholar] [CrossRef] [Green Version]
  6. Ma, S.; Tan, Y.; Han, Y. Methanation of syngas over coral reef-like Ni/Al2O3 catalysts. J. Nat. Gas Chem. 2011, 20, 435–440. [Google Scholar] [CrossRef]
  7. Kopyscinski, J.; Seemann, M.C.; Moergeli, R.; Biollaz, S.M.A.; Schildhauer, T.J. Synthetic natural gas from wood: Reactions of ethylene in fluidised bed methanation. Appl. Catal. A 2013, 462–463, 150–156. [Google Scholar] [CrossRef]
  8. Kiendl, I.; Klemm, M.; Clemens, A.; Herrman, A. Dilute gas methanation of synthesis gas from biomass gasification. Fuel 2014, 123, 211–217. [Google Scholar] [CrossRef]
  9. Park, J.N.; McFarland, E.W. A highly dispersed Pd-Mg/SiO2 catalyst active for methanation of CO2. J. Catal. 2009, 266, 92–97. [Google Scholar] [CrossRef]
  10. Hu, C.W.; Yao, J.; Yang, H.Q.; Chen, Y.; Tian, A.M. On the Inhomogeneity of Low Nickel Loading Methanation Catalyst. J. Catal. 1997, 166, 1–7. [Google Scholar] [CrossRef]
  11. Choe, S.J.; Kang, H.J.; Kim, S.J.; Park, S.B.; Park, D.H.; Huh, D.S. Adsorbed carbon formation and carbon hydrogenation for CO2 methanation on the Ni(111) surface: ASED-MO study. Bull. Korean Chem. Soc. 2005, 26, 1682–1688. [Google Scholar] [CrossRef] [Green Version]
  12. Agnelli, M.; Kolb, M.; Mirodatos, C. CO Hydrogenation on a nickel catalyst.: 1. Kinetics and modeling of a low-temperature sintering process. J. Catal. 1994, 148, 9–21. [Google Scholar] [CrossRef]
  13. Kustov, A.L.; Frey, A.M.; Larsen, K.E.; Johannessen, T.; Norskov, J.K.; Christensen, C.H. CO methanation over supported bimetallic Ni-Fe catalysts: From computational studies towards catalyst optymalization. Appl. Catal. A. 2007, 320, 98–104. [Google Scholar] [CrossRef]
  14. Lunde, P.J.; Kester, F.L. Rates of methane formation from carbon dioxide and hydrogen over a ruthenium catalyst. J. Catal. 1973, 30, 423–429. [Google Scholar] [CrossRef]
  15. Dwyer, D.J.; Somorjai, G.A. Hydrogenation of CO and CO2 over iron foils: Correlations of rate, product distribution, and surface composition. J. Catal. 1978, 52, 291–301. [Google Scholar] [CrossRef] [Green Version]
  16. Solymosi, F.; Erdöhelyi, A.; Kocsis, M. Methanation of CO2 on supported Ru catalysts. J. Chem. Soc. Faraday Trans. 1981, 77, 1003–1012. [Google Scholar] [CrossRef]
  17. Zaǧli, E.; Falconer, J.L. Carbon dioxide adsorption and methanation on ruthenium. J. Catal. 1981, 69, 1–8. [Google Scholar] [CrossRef]
  18. Weatherbee, G.D.; Bartholomew, C.H. Hydrogenation of CO2 on group VIII metals: II. Kinetics and mechanism of CO2 hydrogenation on nickel. J. Catal. 1982, 77, 460–472. [Google Scholar] [CrossRef]
  19. Erdöhelyi, A.; Pasztor, M.; Solymosi, F. Catalytic hydrogenation of CO2 over supported palladium. J. Catal. 1986, 98, 166–177. [Google Scholar] [CrossRef] [Green Version]
  20. Zhang, Z.; Kladi, A.; Verykios, X.E. Effects of carrier doping on kinetic parameters of CO2 hydrogenation on supported rhodium catalysts. J. Catal. 1994, 148, 737–747. [Google Scholar] [CrossRef]
  21. Jia, J.; Qian, C.; Dong, Y.; Li, Y.F.; Wang, H.; Ghoussoub, M.; Butler, K.T.; Walsh, A.; Ozin, G.A. Heterogeneous catalytic hydrogenation of CO2 by metal oxides: Defect engineering—Perfecting imperfection. Chem. Soc. Rev. 2017, 46, 4631–4644. [Google Scholar] [CrossRef] [PubMed]
  22. Xu, X.; Moulijn, J. Mitigation of CO2 by chemical conversion: Plausible chemical reactions and promising products. Energy Fuels 1996, 10, 305–325. [Google Scholar] [CrossRef]
  23. Zhen, W.; Li, B.; Lu, G.; Maa, J. Enhancing catalytic activity and stability for CO2 methanation on Ni@MOF-5 via control of active species dispersion. Chem. Commun. 2015, 51, 1728–1731. [Google Scholar] [CrossRef] [PubMed]
  24. Abe, T.; Tanizawa, M.; Watanabe, K.; Taguchi, A. CO2 methanation property of Ru nanoparticle-loaded TiO2 prepared by polygonal barrel-sputtering method. Energy Environ. Sci. 2009, 2, 315–321. [Google Scholar] [CrossRef]
  25. Polanski, J.; Siudyga, T.; Bartczak, P.; Kapkowski, M.; Ambrożkiewicz, W.; Nobis, A.; Sitko, R.; Klimontko, J.; Szade, J.; Lelątko, J. Oxide passivated Ni-supported Ru nanoparticles in silica: A new catalyst for low-temperature carbon dioxide methanation. Appl. Catal. B 2017, 206, 16–23. [Google Scholar] [CrossRef]
  26. Powell, C.J. Recommended Auger parameters for 42 elemental solids. J. Electron Spectrosc. Relat. Phenom. 2012, 185, 1–3. [Google Scholar] [CrossRef]
  27. Ganesan, P.; Sivanantham, A.; Shanmugam, S. Nanostructured nickel-cobalt-titanium alloy grown on titanium substrate as efficient electrocatalyst for alkaline water electrolysis. ACS Appl. Mater. Interfaces 2017, 9, 12416–12426. [Google Scholar] [CrossRef]
  28. Dickinson, T.; Povey, A.F.; Sherwood, P.M.A. Dissolution and passivation of nickel. An X-ray photoelectron spectroscopic study. J. Chem. Soc. Faraday Trans. I 1977, 73, 327–343. [Google Scholar] [CrossRef]
  29. Légaré, P.P.; Finck, F.; Roche, R.; Maire, G. XPS investigation of the oxidation of the Al/Pd interface: The Al2O3/Pd interface. Surf. Sci. 1989, 217, 167–178. [Google Scholar] [CrossRef]
  30. Tressaud, A.; Khairoun, S.; Touhara, H.; Watanabe, N. X-Ray photoelectron spectroscopy of palladium fluorides. J. Anorg. Allg. Chem. 1986, 540, 291–299. [Google Scholar] [CrossRef]
  31. Kötz, R.; Lewrenz, H.J.; Stucki, S. XPS studies of oxygen evolution on Ru and RuO2 anodes. J. Electrochem. Soc. 1983, 130, 825–829. [Google Scholar] [CrossRef]
  32. Polanski, J.; Bartczak, P.; Ambrozkiewicz, W.; Sitko, R.; Siudyga, T.; Mianowski, A.; Szade, J.; Balin, K.; Lelątko, J. Ni-Supported Pd nanoparticles with Ca promoter: A new catalyst for low-temperature ammonia cracking. PLoS ONE 2015, 10, e0136805. [Google Scholar] [CrossRef] [PubMed]
  33. Stoch, J.; Dao, H.Q.; Szeppe, T. An ESCA study of supported ruthenium oxides catalyst. Bull. Polish. Acad. Sci. Chem. 1987, 35, 387–395. [Google Scholar]
  34. Shen, J.Y.; Adnot, A.; Kaliaguine, S. An ESCA study of the interaction of oxygen with the surface of ruthenium. Appl. Surf. Sci. 1991, 51, 47–60. [Google Scholar] [CrossRef]
  35. Zhen, W.; Li, B.; Lu, G.; Ma, J. Enhancing catalytic activity and stability for CO2 methanation on Ni–Ru/γ-Al2O3 via modulating impregnation sequence and controlling surface active species. RSC Adv. 2014, 4, 16472–16479. [Google Scholar] [CrossRef]
  36. Tada, S.; Ochieng, O.J.; Kikuchi, R.; Haneda, T.; Kameyama, H. Promotion of CO2 methanation activity and CH4 selectivity at low temperatures over Ru/CeO2/Al2O3 catalysts. Int. J. Hydrog. Energy 2014, 39, 10090–10100. [Google Scholar] [CrossRef]
  37. Swalus, C.; Jacquemin, M.; Poleunis, C.; Bertrand, P.; Ruiz, P. CO2 methanation on Rh/Al2O3 catalyst at low temperature: “In Situ” supply of hydrogen by Ni/activated carbon catalyst. Appl. Catal. B Environ. 2012, 125, 41–50. [Google Scholar] [CrossRef]
  38. Pachecka, M.; Sturm, J.M.; Lee, C.J.; Bijkerk, F. Adsorption and dissociation of CO2 on Ru(0001). J. Phys. Chem. C 2017, 121, 6729–6735. [Google Scholar] [CrossRef] [Green Version]
  39. Rao, K.S. A novel method for synthesis of silica nanoparticles. J. Colloid Interface Sci. 2005, 289, 125–131. [Google Scholar] [CrossRef]
  40. Okudera, H.; Hozumi, A. The formation and growth mechanisms of silica thin film and spherical particles through the Stöber process. Thin Solid Film. 2003, 434, 62–68. [Google Scholar] [CrossRef]
  41. Kapkowski, M.; Ambrożkiewicz, W.; Siudyga, T.; Sitko, R.; Szade, J.; Klimontko, J.; Balin, K.; Lelątko, J.; Polanski, J. Nano silica and molybdenum supported Re, Rh, Ru or Ir nanoparticles for selective solvent-free glycerol conversion to cyclic acetals with propanone and butanone under mild conditions. Appl. Catal. B 2017, 202, 335–345. [Google Scholar] [CrossRef]
Figure 1. The EDXRF spectrum of 1.0% Ru/Ni on nanowires that were collected using Rh target X-ray tube operating at 30 kV and 300 μA.
Catalysts 10 00513 g001
Figure 2. (A) The X-ray diffraction patterns of the 1.0% Pd/Ni, 1.0% Ru/Ni, and Ni nanowires (NWs) samples in the 20–130 2θ range. The Miller indices for the experimental peaks of Ni NWs are marked. (B,C) The larger diffraction patterns in the 30–58° 2θ range. The main peaks of Pd and Ru nanoparticles (NPs) are shown.
Catalysts 10 00513 g002
Figure 3. The high-resolution XPS spectra of Ni2p3/2 for (a) the reference sample, (b) the Ni/Pd system, and (c) the Ni/Ru system. A black line represents the measured data, the red line represents the fitted data, and the dotted red line represents the difference between the measured and fitted data. Individual contributions to the fitted data are represented by the colored lines and were assigned to a specific chemical state.
Catalysts 10 00513 g003
Figure 4. The high-resolution X-ray photoelectron spectroscopy (XPS) spectra of (a) Pd3p3/2 from the Ni/Pd system and (b) Ru3p3/2 from the Ni/Ru system. A black line represents the measured data, the red line represents the fitted data, and the dotted red line represents the difference between the measured and fitted data. The individual contributions to the fitted data are represented by the colored lines and were assigned to a specific chemical state.
Catalysts 10 00513 g004
Figure 5. TEM micrographs of the Ni nanowires (NWs) with (ac) Pd nanoparticles and with (df) Ru nanoparticles. (a,b) and (d,e) show the recorded bright field images at different magnifications. (c,f) present the recorded selected area electron diffraction patterns from regions that are shown in (b,e), respectively. Red circles correspond to the theoretical diffraction rings for Ni whereas the blue circles correspond to the theoretical diffraction rings for (c) Pd and (f) Ru. The EDS spectra were shown inside.
Catalysts 10 00513 g005
Figure 6. CO2 conversion of the new catalysts and those that were reported in Reference [25].
Catalysts 10 00513 g006
Table 1. Results of the EDXRF analysis of the SiO2 and Ni supported catalysts.
CatalystChemical Element [wt.%]
PdRuZnFeNiSiCaPCl
SiO2--N\DN\DN\DN\DN\DN\DN\D
1.0% Pd/SiO21.14 ± 0.035-N\DN\DN\DN\DN\DN\DN\D
1.0% Ru/SiO2-1.12 ± 0.023N\DN\DN\DN\DN\DN\DN\D
Ni a--2.2 ± 0.100.21 ± 0.01596 ± 3.9--0.34 ± 0.023-
1.0% Pd/Ni a0.98 ± 0.057-1.72 ± 0.0740.19 ± 0.01497 ± 5.10.15 ± 0.0110.10 ± 0.0100.28 ± 0.018
1.0% Ru/Ni a-1.33 ± 0.0681.70 ± 0.0830.23 ± 0.01395 ± 5.70.67 ± 0.0420.15 ± 0.0100.26 ± 0.015-
Ni b----92 ± 5.20.23 ± 0.0135.4 ± 0.350.42 ± 0.0250.62 ± 0.032
1.0% Pd/Ni b0.65 ± 0.057-- 87 ± 4.32.91 ± 0.157.0 ± 0.440.58 ± 0.0350.79 ± 0.046
1.0% Ru/Ni b-0.86 ± 0.045--95 ± 4.80.22 ± 0.0182.3 ± 0.120.66 ± 0.0350.25 ± 0.016
a\Nanowires. b\Nickel foam shape fitted to catalyst bed. N\D―not determined.
Table 2. The average crystallite size and lattice parameters of the investigated nanomaterials as determined by the X-ray diffraction technique (XRD) method.
CatalystLattice Parameters [Å]D [nm] NiD [nm] PdD [nm] Ru
Ni NWsfor Ni a
a = 3.527 (±0.006)
-8--
for Ni afor Pd a
1.0% Pd/Ni NWsa = 3.524 (±0.002)a = 4.060 (±0.008)93–4-
for Ni afor Ru b
1.0% Ru/Ni NWsa = 3.526 (±0.003)a = 2.711 (±0.006)
c = 4.277 (±0.007)
9-4–5
a\cubic, Fm3m. b\hexagonal, P63/mmc.
Table 3. CO2 methanation on the Ru and Pd nanoparticles deposited on different nickel and silica carriers compared to the literature data.
EntryCatalystT [°C]TOF [h−1]Ref.
11.0% Ru/Ni nanowires (NWs)1792479.2-
21.0% Pd/Ni NWs2812265.4-
31.0% Ru/Ni foam544442.3-
41.0% Pd/Ni foam549419.1-
5Ni NWs358528.6-
6Ni522514.0
7Ni foam537499.7
81.0% Ru/SiO23811208.6[25]
91.5% Ru/Ni204940.0[25]
100.5% Pd/Ni5052423.0[25]
110.8 Ru/TiO2180487.3[24] a
12Ru–CeO2/Al2O33002256.0[36] a
a\for a broader comparison, compare Reference [25].

