Article

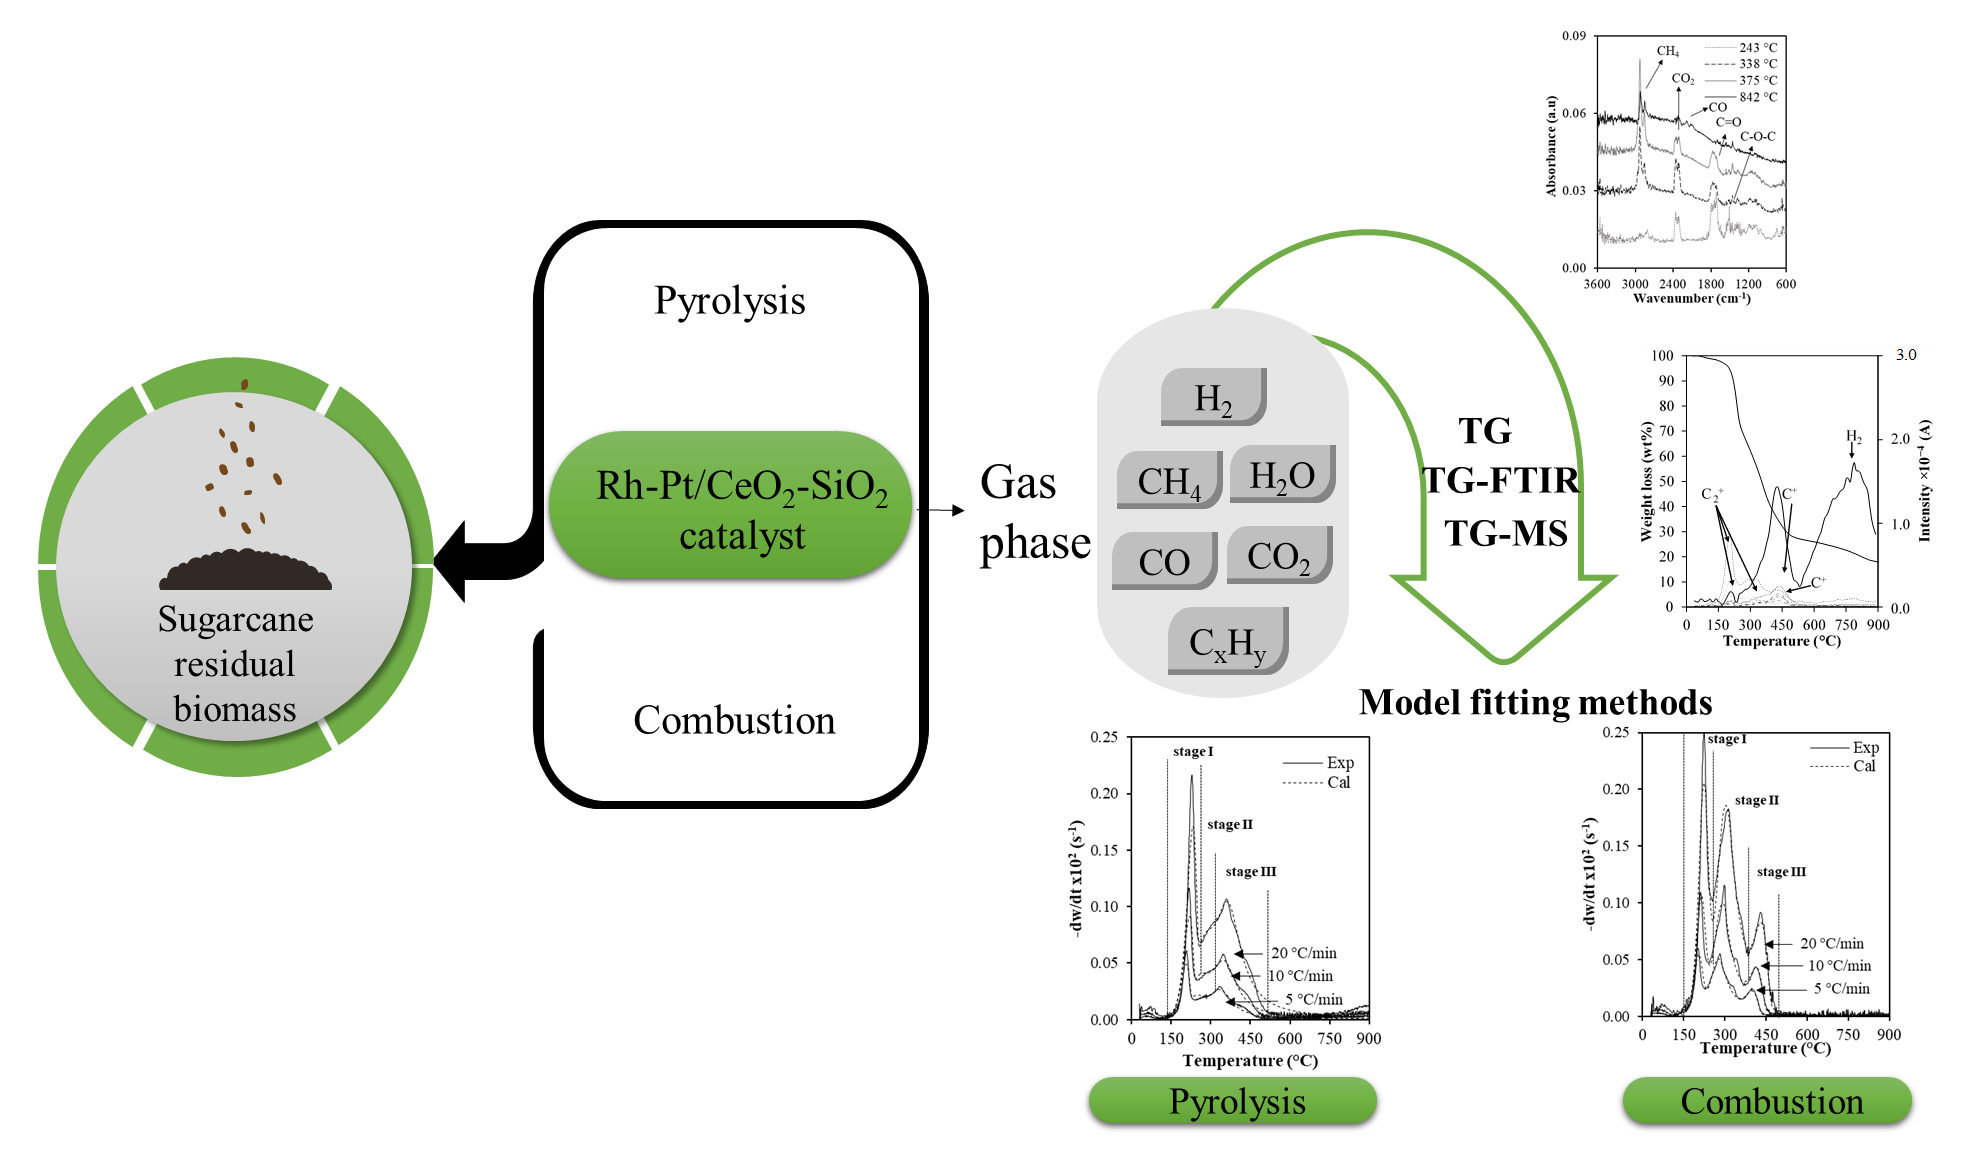
Kinetics of the Catalytic Thermal Degradation of Sugarcane Residual Biomass Over Rh-Pt/CeO2-SiO2 for Syngas Production

1
Energy, Materials and Environment Laboratory, Chemical Engineering Department, Universidad de La Sabana, Campus Universitario Puente del Común, Km. 7 Autopista Norte, 250001 Bogotá, Colombia
2
Department of Chemical Engineering, University of Alicante, P.O. Box 99, E-03080 Alicante, Spain
3
University Institute of Engineering of Chemical Processes, University of Alicante, P.O. Box 99, E-03080 Alicante, Spain
*
Author to whom correspondence should be addressed.
Catalysts 2020, 10(5), 508; https://doi.org/10.3390/catal10050508
Submission received: 3 April 2020 / Revised: 22 April 2020 / Accepted: 23 April 2020 / Published: 6 May 2020

Abstract

:
Thermochemical processes for biomass conversion are promising to produce renewable hydrogen-rich syngas. In the present study, model fitting methods were used to propose thermal degradation kinetics during catalytic and non-catalytic pyrolysis (in N2) and combustion (in synthetic air) of sugarcane residual biomass. Catalytic processes were performed over a Rh-Pt/CeO2-SiO2 catalyst and the models were proposed based on the Thermogravimetric (TG) analysis, TG coupled to Fourier Transformed Infrared Spectrometry (TG-FTIR) and TG coupled to mass spectrometry (TG-MS). Results showed three different degradation stages and a catalyst effect on product distribution. In pyrolysis, Rh-Pt/CeO2-SiO2 catalyst promoted reforming reactions which increased the presence of H2. Meanwhile, during catalytic combustion, oxidation of the carbon and hydrogen present in biomass favored the release of H2O, CO and CO2. Furthermore, the catalyst decreased the overall activation energies of pyrolysis and combustion from 120.9 and 154.9 kJ mol−1 to 107.0 and 138.0 kJ mol−1, respectively. Considering the positive effect of the Rh-Pt/CeO2-SiO2 catalyst during pyrolysis of sugarcane residual biomass, it could be considered as a potential catalyst to improve the thermal degradation of biomass for syngas production. Moreover, the proposed kinetic parameters are useful to design an appropriate thermochemical unit for H2-rich syngas production as a non-conventional energy technology.

Graphical Abstract

1. Introduction

The increase in energy consumption due to population growth and the dependence on fossil fuels have enlarged greenhouse gases emissions (GHG) with a major impact on environment and global warming [1]. As a result, the use of renewable resources for sustainable energy production has been recently promoted [2]. Lignocellulosic biomass, which includes agricultural and agroindustrial residues [3], is considered as an interesting renewable resource since it has low cost, could be carbon neutral [4], and its conversion implies low GHG emissions [5]. Different processes have been proposed for the use of lignocellulosic biomass, such as pyrolysis [6], gasification [7], combustion [8,9], carbonization [10] and liquefaction [11]. A combination of processes has been proposed as a non-conventional energy technology to produce hydrogen (H2) from biomass [6,12,13]. H2 has a high calorific value and can be used in fuel cells (FC), which convert chemical energy into power and heat [14].
Colombia is the third Latin American country in biomass production [15] and generates approximately 72 million tons of agricultural waste per year with a potential energy of at least 331,000 TJ/year [16]. Sugarcane press-mud is a byproduct obtained from the clarification of sugarcane juice during the non-centrifugal sugar production [17]. This residue is obtained with a yield of 3 to 5 wt% [18], which represents about 1.36 Mton/year of sugarcane press-mud [19]. Currently, this residue is used as a raw material for organic fertilizers [17] or, more often, discarded in large quantities, generating pollution in sources of water. Sugarcane press-mud has been used to produce bioethanol through fermentation [19]; nonetheless, it contains approximately 30 wt% lignocellulosic rich solid waste that is currently discarded [19]. This solid waste will be hereinafter called sugarcane residual biomass and will be the focus of this study.
Among thermochemical processes, pyrolysis of biomass is a widely used technology to produce power or syngas in the absence of O2 [20,21]. Moreover, it is the most studied process since it precedes other thermochemical processes as gasification and combustion [22]. Some studies have shown that, due to the lignocellulosic composition of sugarcane residual biomass, pyrolysis is an alternative to convert it into valuable products, such as H2-rich syngas, bio-oils and biochar [3,23,24]. However, one of the main problems during thermochemical processes is the low quality of the produced gas due to the presence of higher organic and oxygenated compounds known as tars [25]. These condensable compounds decrease gas yields and process efficiency [26]. In order to improve the gas quality, some authors have proposed the integration of pyrolysis with reforming [27] or gasification [28] to reform the volatiles obtained during pyrolysis, therefore obtaining a H2-rich gas stream [27]. Nevertheless, these processes are more complex, since each one operates under different optimal conditions [29]. Thus, costs increase because of the need of more than one thermochemical unit [13,27,30]. Hence, catalytic pyrolysis has emerged as a feasible and economic alternative due to several reactions taking place, such as catalytic cracking, reforming and deoxygenation reactions of heavy compounds that allow for organic compounds degradation [6] and carbon conversion [31]. Consequently, less tars and a H2-rich gas can be obtained in a single step.
Several catalysts have shown to improve the formation of gases during biomass pyrolysis [22,31,32]. Among them, there is a trend in the use of Ni-based catalyst due to the higher activity and low cost [25]. However, they can present deactivation due to the formation of coke on the catalyst surface [33]. Moreover, catalysts with noble metals such as Pt/Al2O3 [34], Rh-perovskite [30] and Pt-Rh/MgAl(O) [28] have been tested during integrated pyrolysis processes with steam reforming to improve the quality of condensable and non-condensable gas streams from pyrolysis [35,36]. In these studies, Pt and Rh have shown great activity promoting reforming reactions; Pt has a great selectivity to H2, and Rh has a great capacity to break O–H bonds, which deliver an increase in the H2 and CO yields [36]. Although these catalysts have been used in steam reforming, it has been observed that during pyrolysis H2O is present throughout the temperature range, allowing the reforming reactions to take place [31]. The above is caused by the H2O contained in the sample and the degradation of hemicellulose and lignin [31]. Thus, studying low noble metal loading (<1% wt) catalysts in pyrolysis could improve the composition of the gas streams obtained from this step, reducing additional equipment requirements or subsequent high temperature conditions.
Besides, in order to obtain a rich gas outlet stream and to avoid catalyst deactivation, the use of multifunctional catalyst that combine different supports has been recently proposed [33]. The presence of CeO2 in catalysts such as Ni-Ce/Al2O3 and Ce/HZSM-5 avoids deactivation, since its redox properties prevent coke formation [33]. Furthermore, noble metal catalysts have shown resistance to deactivation and higher gas yields during biomass pyrolysis [28,30] and other thermochemical processes such as combustion [34] and gasification [37]. CeO2 used as catalyst support can improve the thermal stability and basicity of the catalyst, which increases CO2 adsorption by inhibiting coke formation and reducing its deactivation [38]. Additionally, supports such as SiO2 offer high surface area, increasing the availability of active sites in the catalytic structure [38]. In this sense, a Rh-Pt/CeO2-SiO2 catalyst designed by Cifuentes et al. [39] for ethanol steam reforming has shown elevated activity and selectivity to H2. Consequently, it is proposed to evaluate this catalyst during the biomass pyrolysis for H2-rich syngas production.
In that sense, understanding the thermal degradation of biomass under different atmospheres is an important step in the design of biomass conversion process to obtain H2. Thereby, differences in product distribution and kinetic parameters under catalytic and non-catalytic conditions must be addressed for different degradation atmospheres. Thus, pyrolysis (N2) is commonly compared to combustion (O2) [40,41,42,43], because the latter is the traditional thermal degradation process employed to handle lignocellulosic solid wastes. For that purpose, TG analysis have been widely used in the characterization of thermal degradation of different types of biomass, such as nutshell, pine sawdust [1], other lignocellulosic biomass [40] and plastics [41]. TG analysis provides real-time information on the thermal degradation of the sample as a function of time and temperature [44,45].
Once thermal degradation of the sample is studied, kinetic studies could be performed. Degradation kinetics are an important tool to understand the progress of decomposition reactions [46]. Besides, kinetic study provides kinetic parameters as activation energy (Ei), pre-exponential factor (k) and reaction models that describe the thermal degradation and allow for the design of thermochemical units suitable for this type of residues [41]. Kinetic models of biomass pyrolysis are determined based on the correlation between thermal degradation analysis and information about the released products. This could be done by integrating TG analysis with FTIR (TG-FTIR) and mass spectrometry (TG-MS) [8,47].
Kinetic modelling is usually performed by numerical methods like model fitting methods, which estimate kinetic parameters of the thermal decomposition process using an integral approach, hence the correlation with experimental data is easy and precise [9,48,49]. Gangavati et al. [24] reported the kinetic parameters found through TGA of a press-mud obtained from a sugar mill in India. Parameters were calculated using different relations from literature such as Coast and Redfern, Agrawall and Sivasubramanian methods in order to compare the values obtained [24]. Meanwhile, Garrido et al. [41] studied the thermal decomposition of viscoelastic memory foam by TG Analysis under different atmospheres and proposed a model with three consecutive reactions and the kinetic parameters using integral methods that involve all the heating rates evaluated, which gives more accurate parameters [49,50]. The above agree with Anca-Couce et al. [51], who compared kinetic parameters obtained by model free methods and model fitting methods during beechwood pyrolysis and concluded that model fitting methods are more reliable and show a better fit. However, for catalytic processes, the kinetic parameters have been only obtained by model free methods. For instance, Yang et al. [22] evaluated the effect of the multifunctional Ni-CaO-Ca2SiO4 catalyst on the kinetics of catalytic pyrolysis of straw, sawdust and cellulose finding an increase in the intensity of H2 and CO observed by TG-MS and the reduction of activation energies for all biomasses. Moreover, Loy et al. [5] reported a kinetic parameter during non-catalytic and catalytic pyrolysis of rice husk, using rice hull ash catalyst, obtaining Ei values in the range of 190–186 kJ mol−1 and 154–150 kJ mol−1, respectively. The parameters were obtained by model free methods [5].
Therefore, this study aimed to evaluate the effect of the Rh-Pt/CeO2-SiO2 catalyst during the pyrolysis and combustion of sugarcane residual biomass. Thermal degradation kinetic models were proposed, and their parameters calculated by model fitting methods based on the released products obtained from TG, TG-FTIR and TG-MS analysis. Obtaining the accurate kinetic parameters of catalytic conditions under different atmospheres and understanding the products evolution of the biomass catalytic pyrolysis will help us with a rigorous reactor design of the thermal degradation of sugarcane residual biomass.

2. Results and Discussion

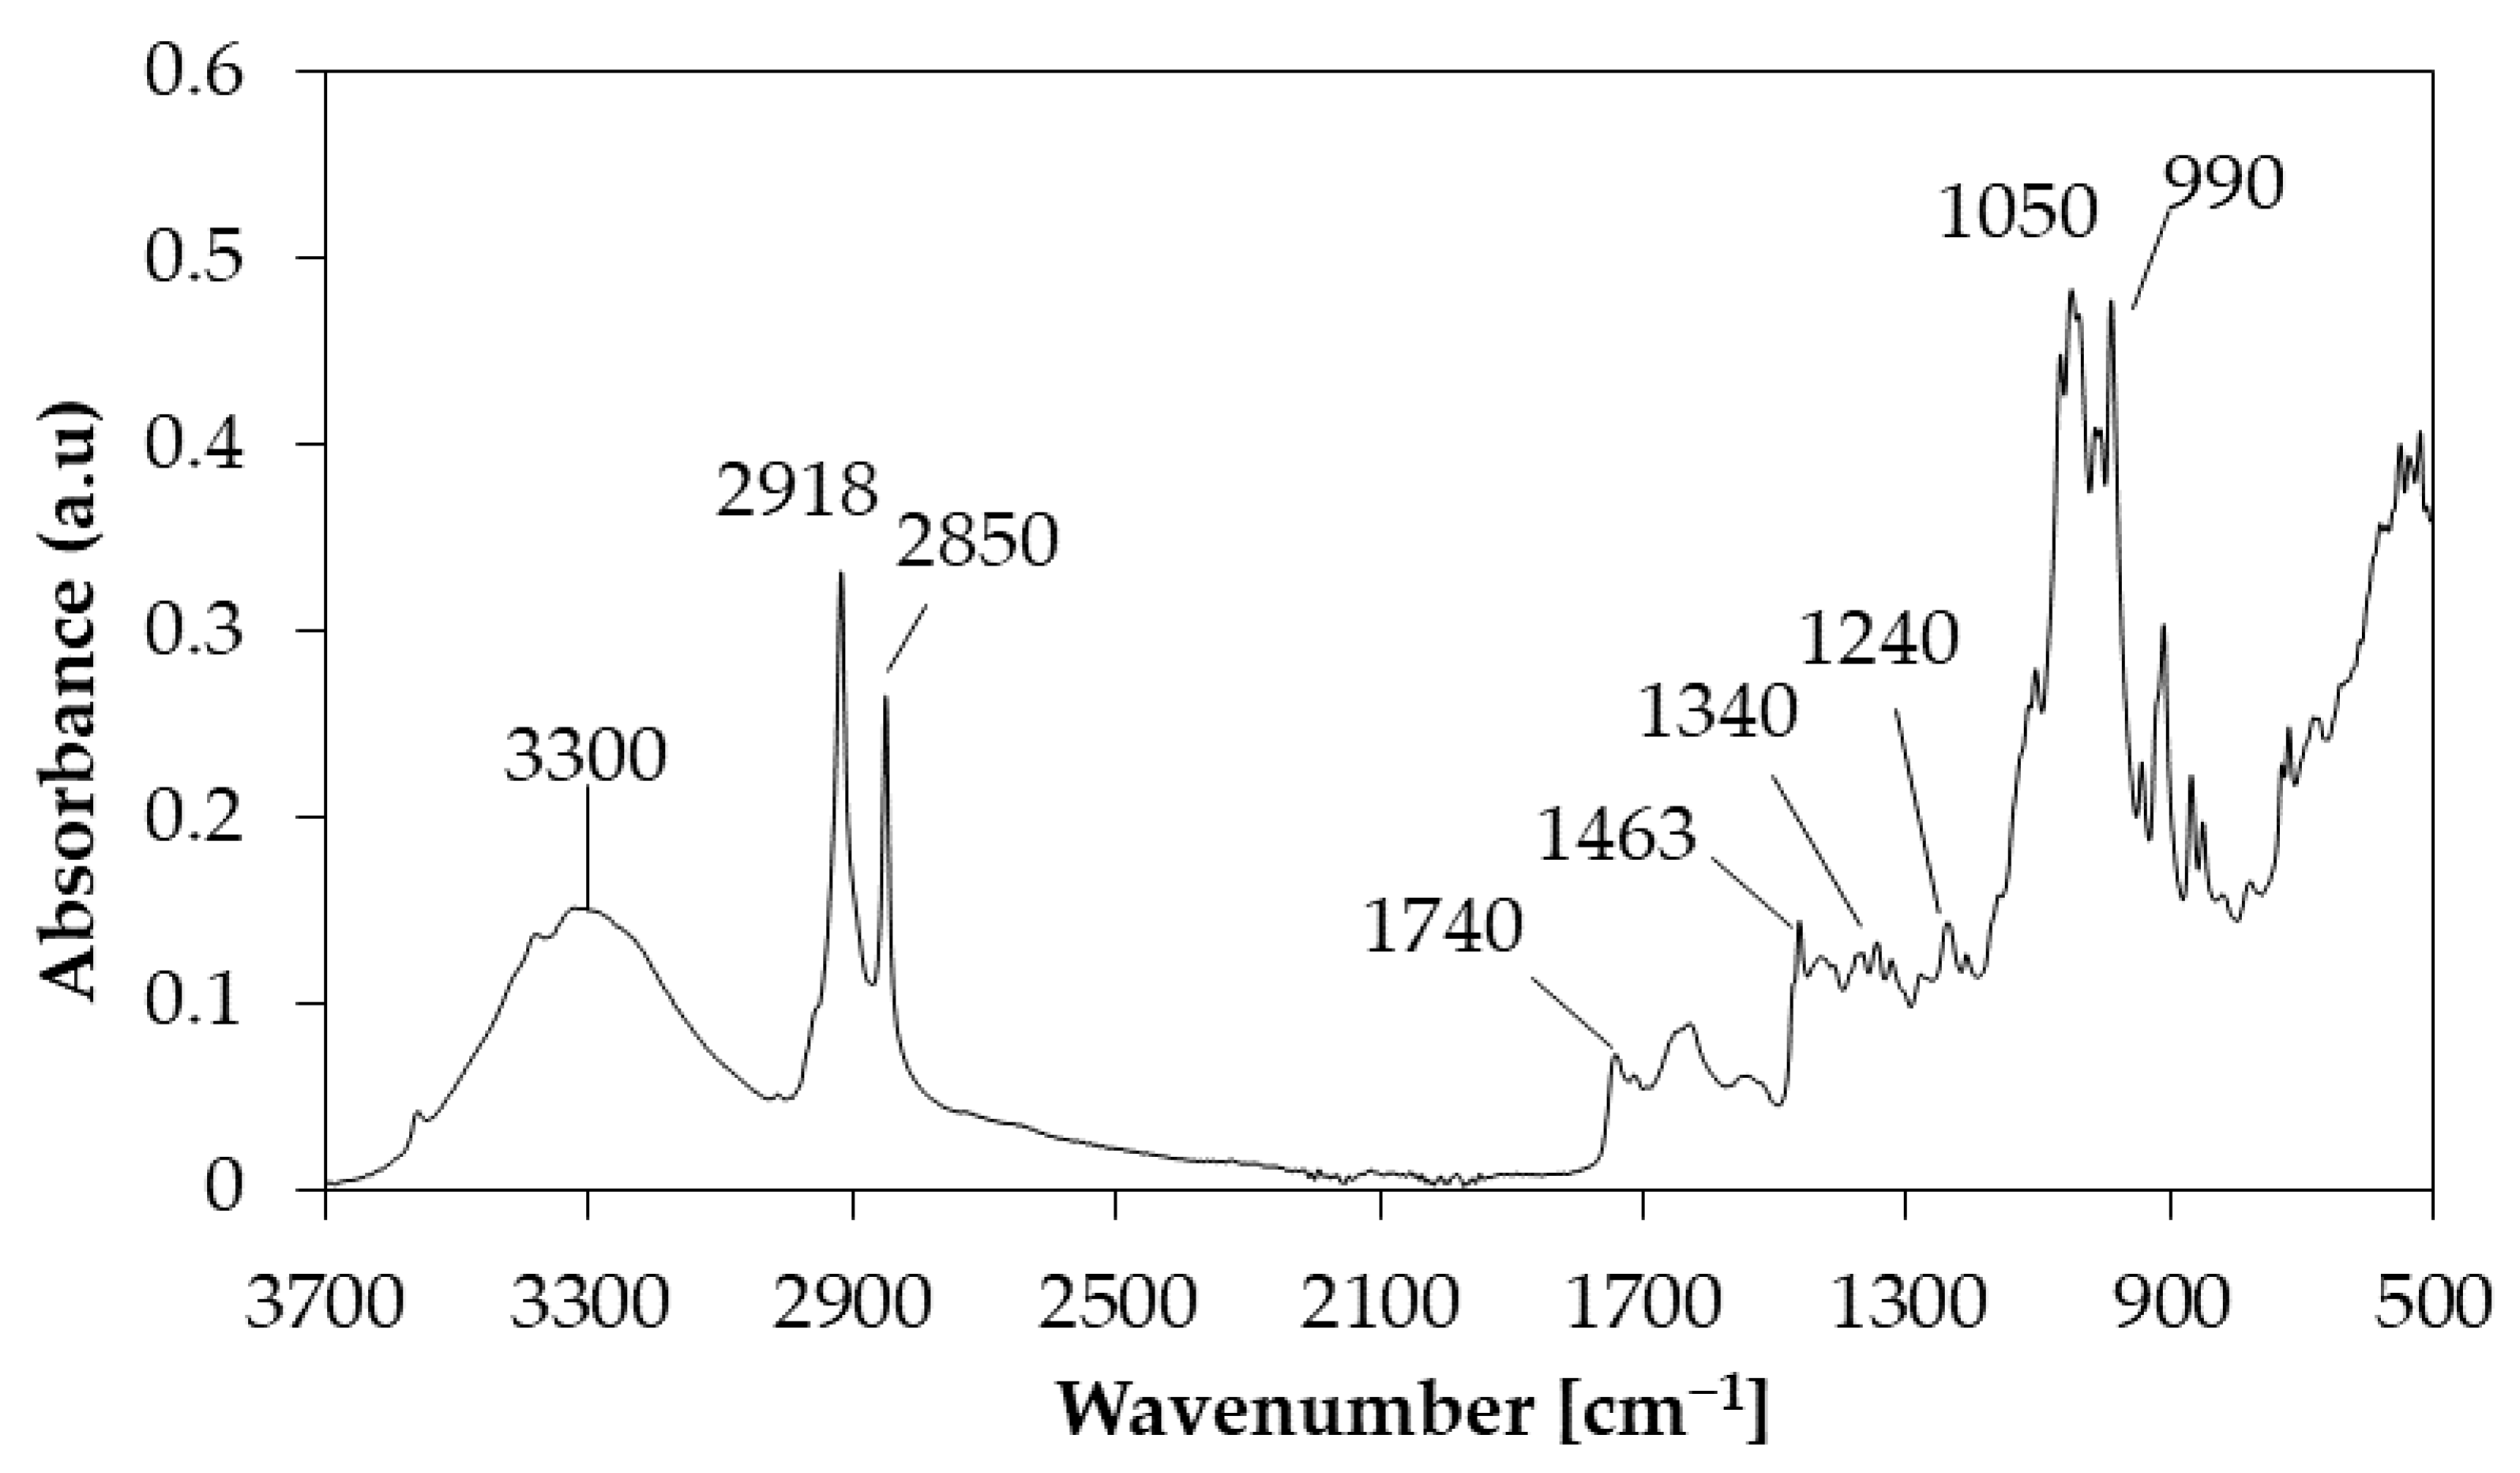
2.1. Biomass Characterization
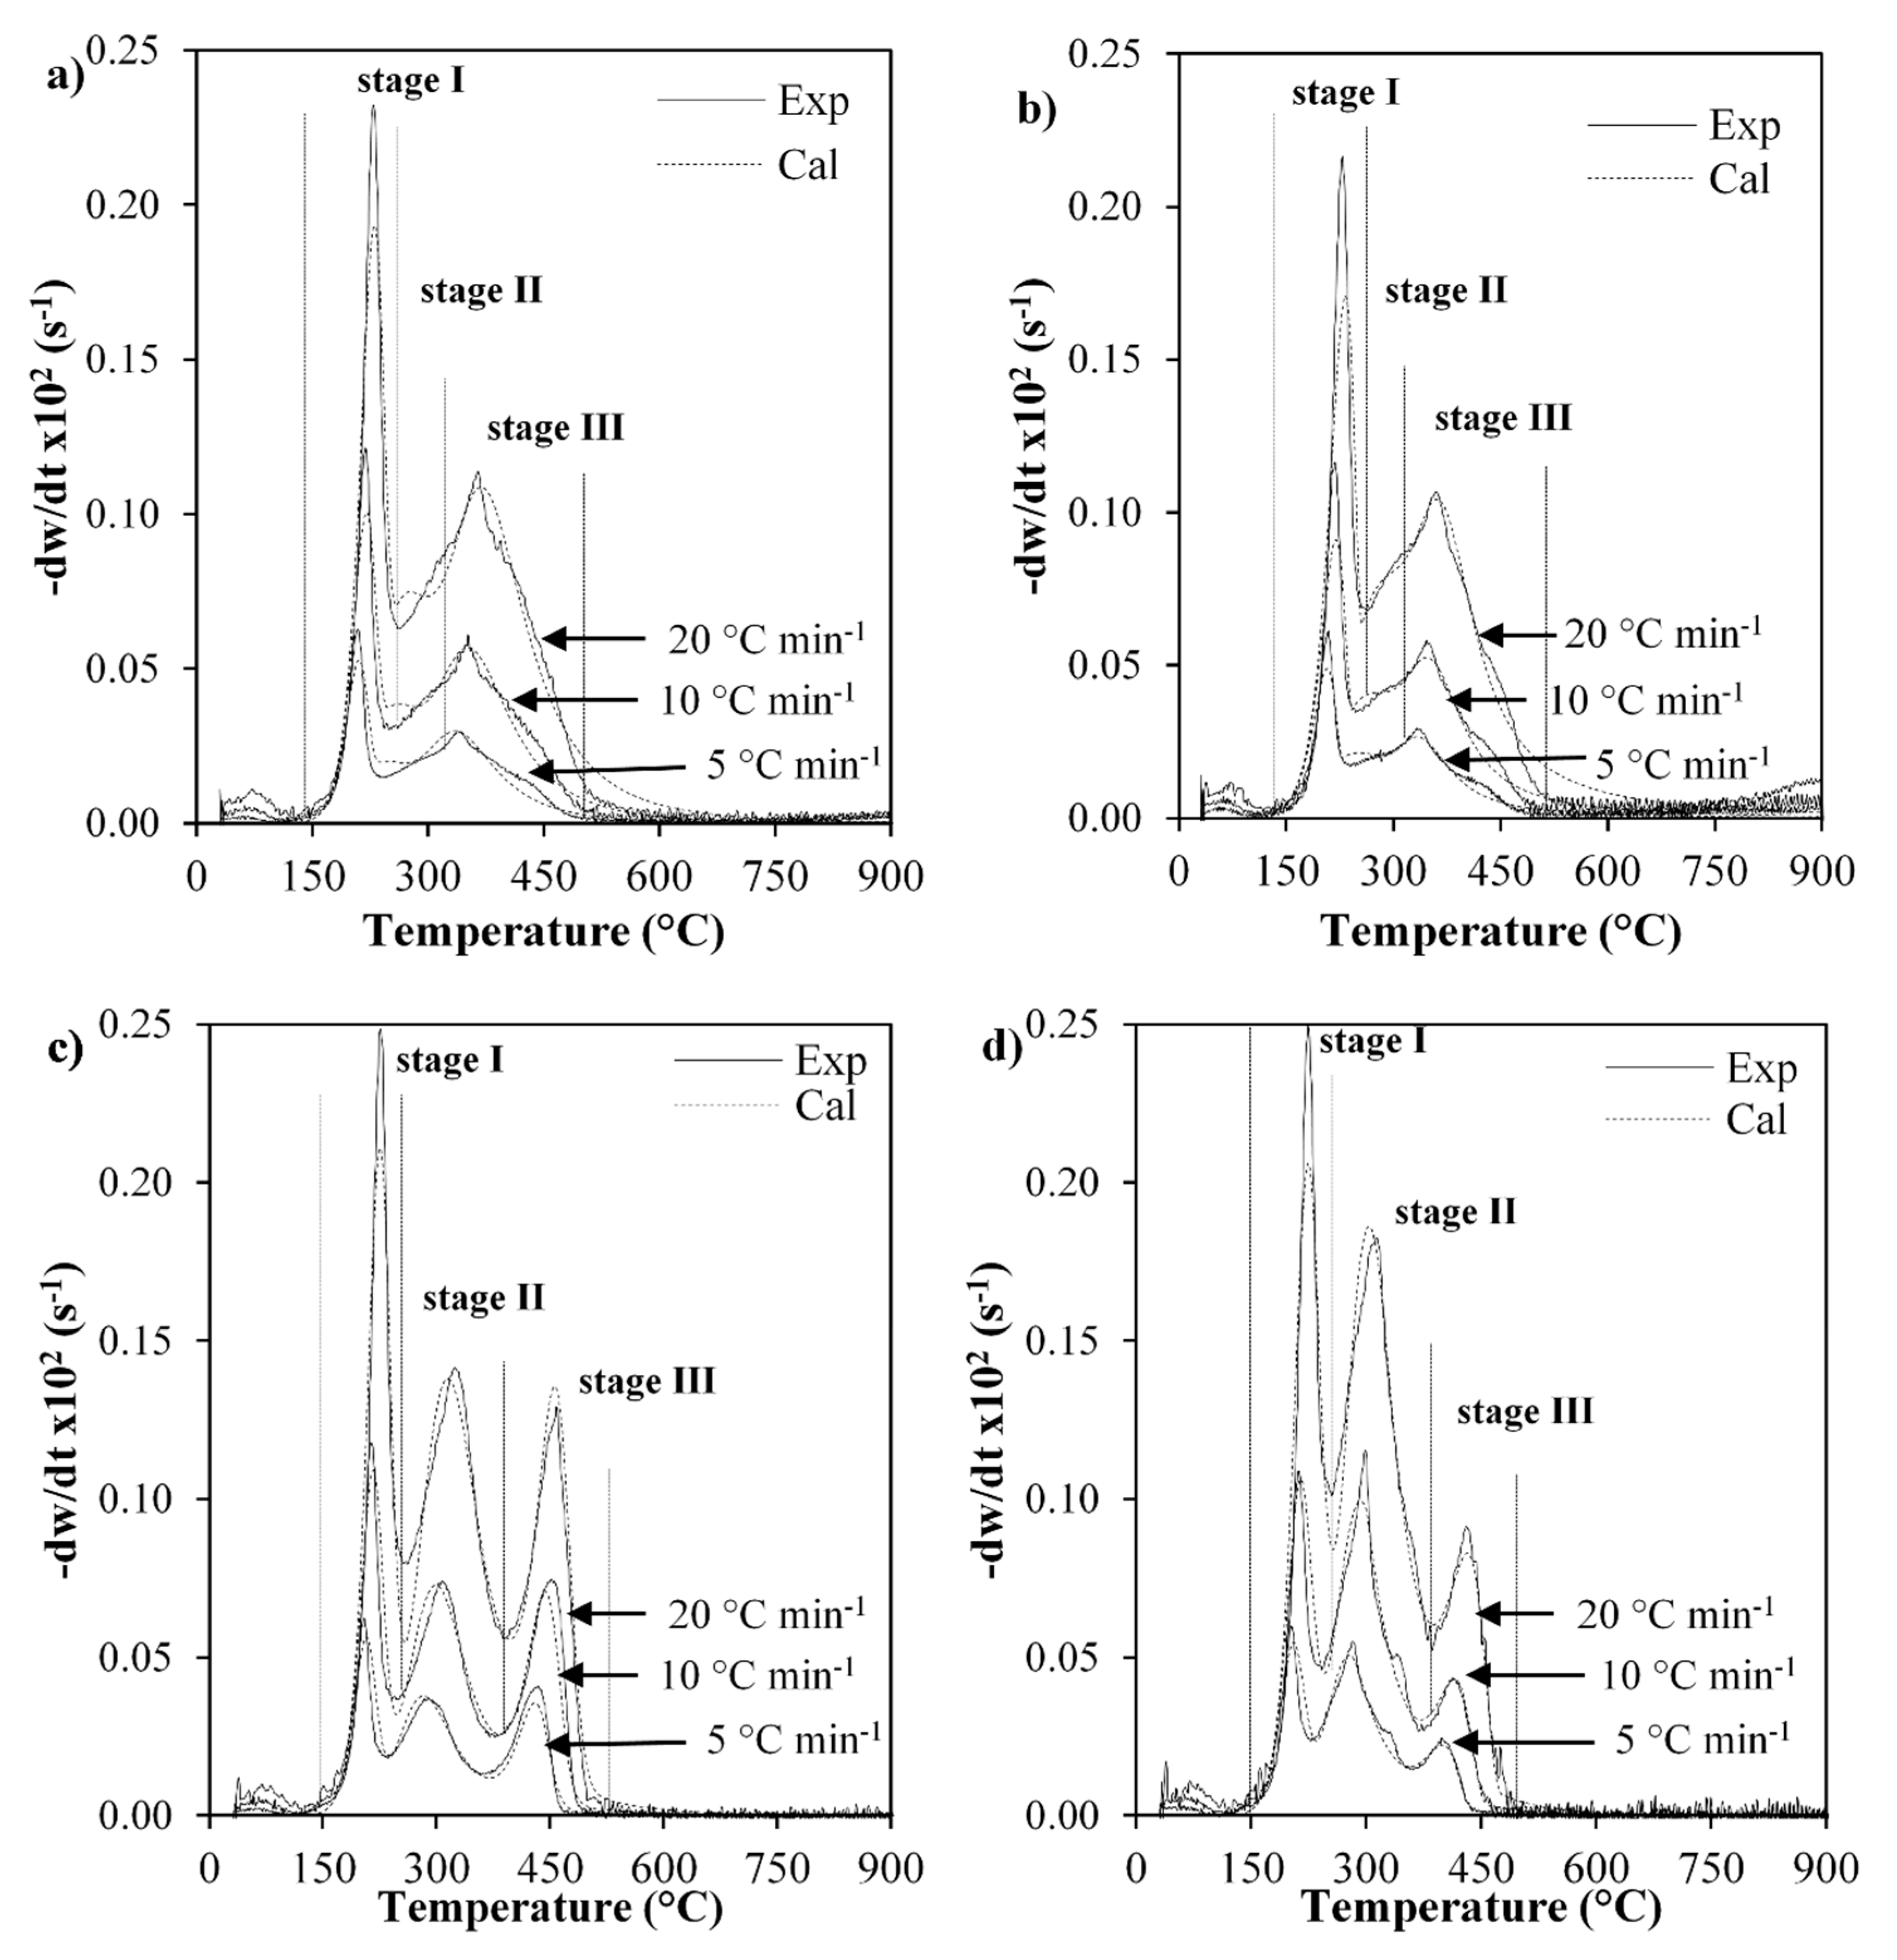
Table 1 presents the results of the ultimate and proximal analysis carried out on the sugarcane residual biomass. The composition obtained in the ultimate analysis is comparable to that reported for other biomass such as peat [52], pinewood [53] and vegetable waste [48], among others. The sugarcane residual biomass contains a low percentage of nitrogen and does not contain sulfur, which makes it promising for its thermal conversion since it reduces the emissions of SO2, NOx and soot [4]. Besides, it presents a higher heating value of 22.9 MJ kg−1, which is within the average of the energy contained in the traditional coal found in Colombia [54]. Moreover, it is similar to the reported for the olive peel, which has been used to obtain H2 through pyrolysis [55]. The ashes percentage reported for different types of biomass is lower than 10% [40,45,53]. Sugarcane residual biomass has an 8.1 wt% ash, which is composed mainly of Al, K, Fe and Si, according to the ICP-MS analysis. Depending on the concentration of these metals, they can act as catalysts, modifying the products of the decomposition. However, concentrations of these metals in sugarcane residual biomass are below the minimum concentrations that affect thermal degradation products [56].
The IR spectrum of the sugarcane residual biomass (Figure 1) shows signals from the bands associated with the vibrations of the CH2 and CH3 (2935–2915 cm−1) and the –OH (3370–3420 cm−1) stretches, which are attributed to the functional groups present in hemicellulose, cellulose and lignin [53]. Besides, the presence of these components is confirmed by bands in 1740, 1329 and 1375 cm−1, characteristic of cellulose and hemicellulose and bands in 1463 and 1240 cm−1, associated with lignin [48,57]. The bands identified at 1740 and 1620 cm−1 are related to ketone and ester groups, associated with the fat content of biomass [57]. Bands at 2980 and 2925 cm−1 correspond to the stretches of the methyl (C–H) and methylene (=CH2) groups, respectively [1,58]. Finally, bands between 1200 and 900 cm−1 are related to the overlap of polysaccharide and siloxane, and the peak centered at 1050 cm−1 is attributed to the symmetric stretching of the polysaccharides (C–O–C) [52]. Therefore, sugarcane residual biomass is composed mainly of volatile matter, which in previous studies was found to be mainly composed of cellulose, hemicellulose and lignin [23]. The content of crude fiber (hemicellulose, cellulose and lignin) in the sugarcane residual biomass and the characterization of the complete sample was reported in previous studies [19]. Nevertheless, sugarcane residual biomass also presents approximately 18 wt% of ashes and fixed carbon that will have to be considered in the subsequent analysis. The TG analysis of the sugarcane residual biomass is analyzed as follows.

2.2. TG Analysis

Thermal degradation of the sugarcane residual biomass was analyzed under N2 and air atmospheres, in the presence and in the absence of Rh-Pt/CeO2-SiO2 catalyst. The biomass/catalyst ratio is an important aspect in thermo-catalytic processes. Sebestyén et al. [59] analyzed two biomass/catalyst ratios, i.e., 10:1 and 1:1, during the catalytic pyrolysis of biomass in the presence of HZSM-5 and found that the effect of the catalyst is poorly visible at a ratio of 10:1. The 1:1 ratio allows to observe the effect of the catalyst in kinetic studies, but it must be varied for applications in pilot-scale reactors. Thus, following previous methodologies of catalytic pyrolysis [6,22], in this study, we used a biomass/catalyst ratio of 1:1 to clearly observe the effect of the catalyst at a lab-scale. Figure 2 shows the DTG curves obtained during the pyrolysis and combustion of both biomass and biomass/catalyst 1:1. During thermal degradation of the biomass by pyrolysis (Figure 2a,b) and combustion (Figure 2c,d), three characteristic degradation stages were identified: dehydration, devolatilization and degradation [26]. The first degradation zone (Stage I) corresponds to the dehydration phase, in which the moisture contained in the sample and some volatile compounds are released [40]. The degradation in this stage is intense in comparison with other studies; this is due to degradation of hemicellulose, cellulose and lignin that forms H2O(g) from the OH-groups [59]; this is consistent with that reported for pine sawdust, salt sawdust, walnut shell [1] and wood sawdust [45]. The second zone (Stage II) corresponds to the degradation of hemicellulose and cellulose. This stage presents a greater peak for the thermal degradation during combustion, due to the presence of O2, which allows the conversion of the carbonaceous residues, since oxidation reactions are favored [40]. During pyrolysis (Figure 2a,b), a shoulder is observed, which may be associated with the overlap between the degradation of hemicellulose and cellulose. Finally, there is the third degradation stage (Stage III), which ends at a temperature close to 500 °C and coincides with that reported for sugarcane press-mud [24] and pine sawdust [1]. The last stage corresponds to the overlapping of cellulose and lignin, since, as reported by Yang et al. [57] and Naik et al. [53], the degradation of lignin occurs over the entire range of temperature, with a maximum peak of degradation at temperatures >500 °C. However, no significant weight loss was observed at these temperatures during either pyrolysis or combustion of the sugarcane residual biomass.
Additionally, during pyrolysis and combustion, no further degradation of samples was achieved at temperatures >500 °C. The final solid obtained for pyrolysis and combustion was 20 and 8 wt%, respectively. Differences between the conversion of the sample in both atmospheres are attributed to the presence of O2, which favors oxidation reactions including fixed carbon content [40]. Therefore, the final weight percentage of the combustion reaction represents the same value of ash present in the sample (see Table 1). On the contrary, during pyrolysis, the final weight fraction at 900 °C was higher, as carbonaceous compounds (fixed carbon) remained unreacted even at higher temperatures increasing the final biochar. Nonetheless, the final solid fraction of 20 wt% is similar to that reported for wood sawdust [45] and Chlorella vulgaris [60].
In Figure 2, it is observed that, with an increase in the heating rate, the decomposition rates increase. Additionally, a higher conversion is observed during pyrolysis of biomass with a heating rate of 5 °C min−1. Similar results were reported by Mishra and Mohanty [1], who reported that at higher heating rates, biomass does not react completely, causing a greater production of carbonaceous residues. On the other hand, there is no difference between the conversions of the sample for the different reaction rates in the oxidizing atmosphere, surely caused by the presence of oxygen which accelerates decomposition.
Additionally, Figure 2b,d shows the DTG curves during pyrolysis and combustion of sugarcane residual biomass in the presence of the Rh-Pt/CeO2-SiO2 catalyst. For both atmospheres, a shift is observed to the left of the curves for all the heating rates. This suggests that the catalyst reduces thermal degradation temperatures [26], causing the sample to degrade faster and at lower temperature. Catalytic pyrolysis also shows a greater degradation of the sample, which suggests that the catalyst is active even at temperatures <400 °C, where different reactions are occurring compared to the sample without catalyst (Figure 2a). On the contrary, Loy et al. [61] observed a lower degradation during pyrolysis of rice husk biomass with commercial Ni powder catalysts compared to the sample without catalyst. They attributed this behavior to the possible coke deposits due to polymerization reactions that deactivates the catalyst, leading to a lower conversion of the sample [61]. This suggests that catalytic pyrolysis over Rh-Pt/CeO2-SiO2 allows further degradation of the biomass because it is active for the decomposition of other compounds at higher temperatures.
Current results suggest that the pyrolysis and combustion of biomass follow a different path, since there is a difference between the degradation of the three main components (i.e., hemicellulose, cellulose and lignin). Therefore, it is important to associate each degradation stage with the released products in order to propose the possible reactions that are occurring. For this, TG-FTIR and TG-MS analyses were carried out, and the results are shown in the upcoming sections.

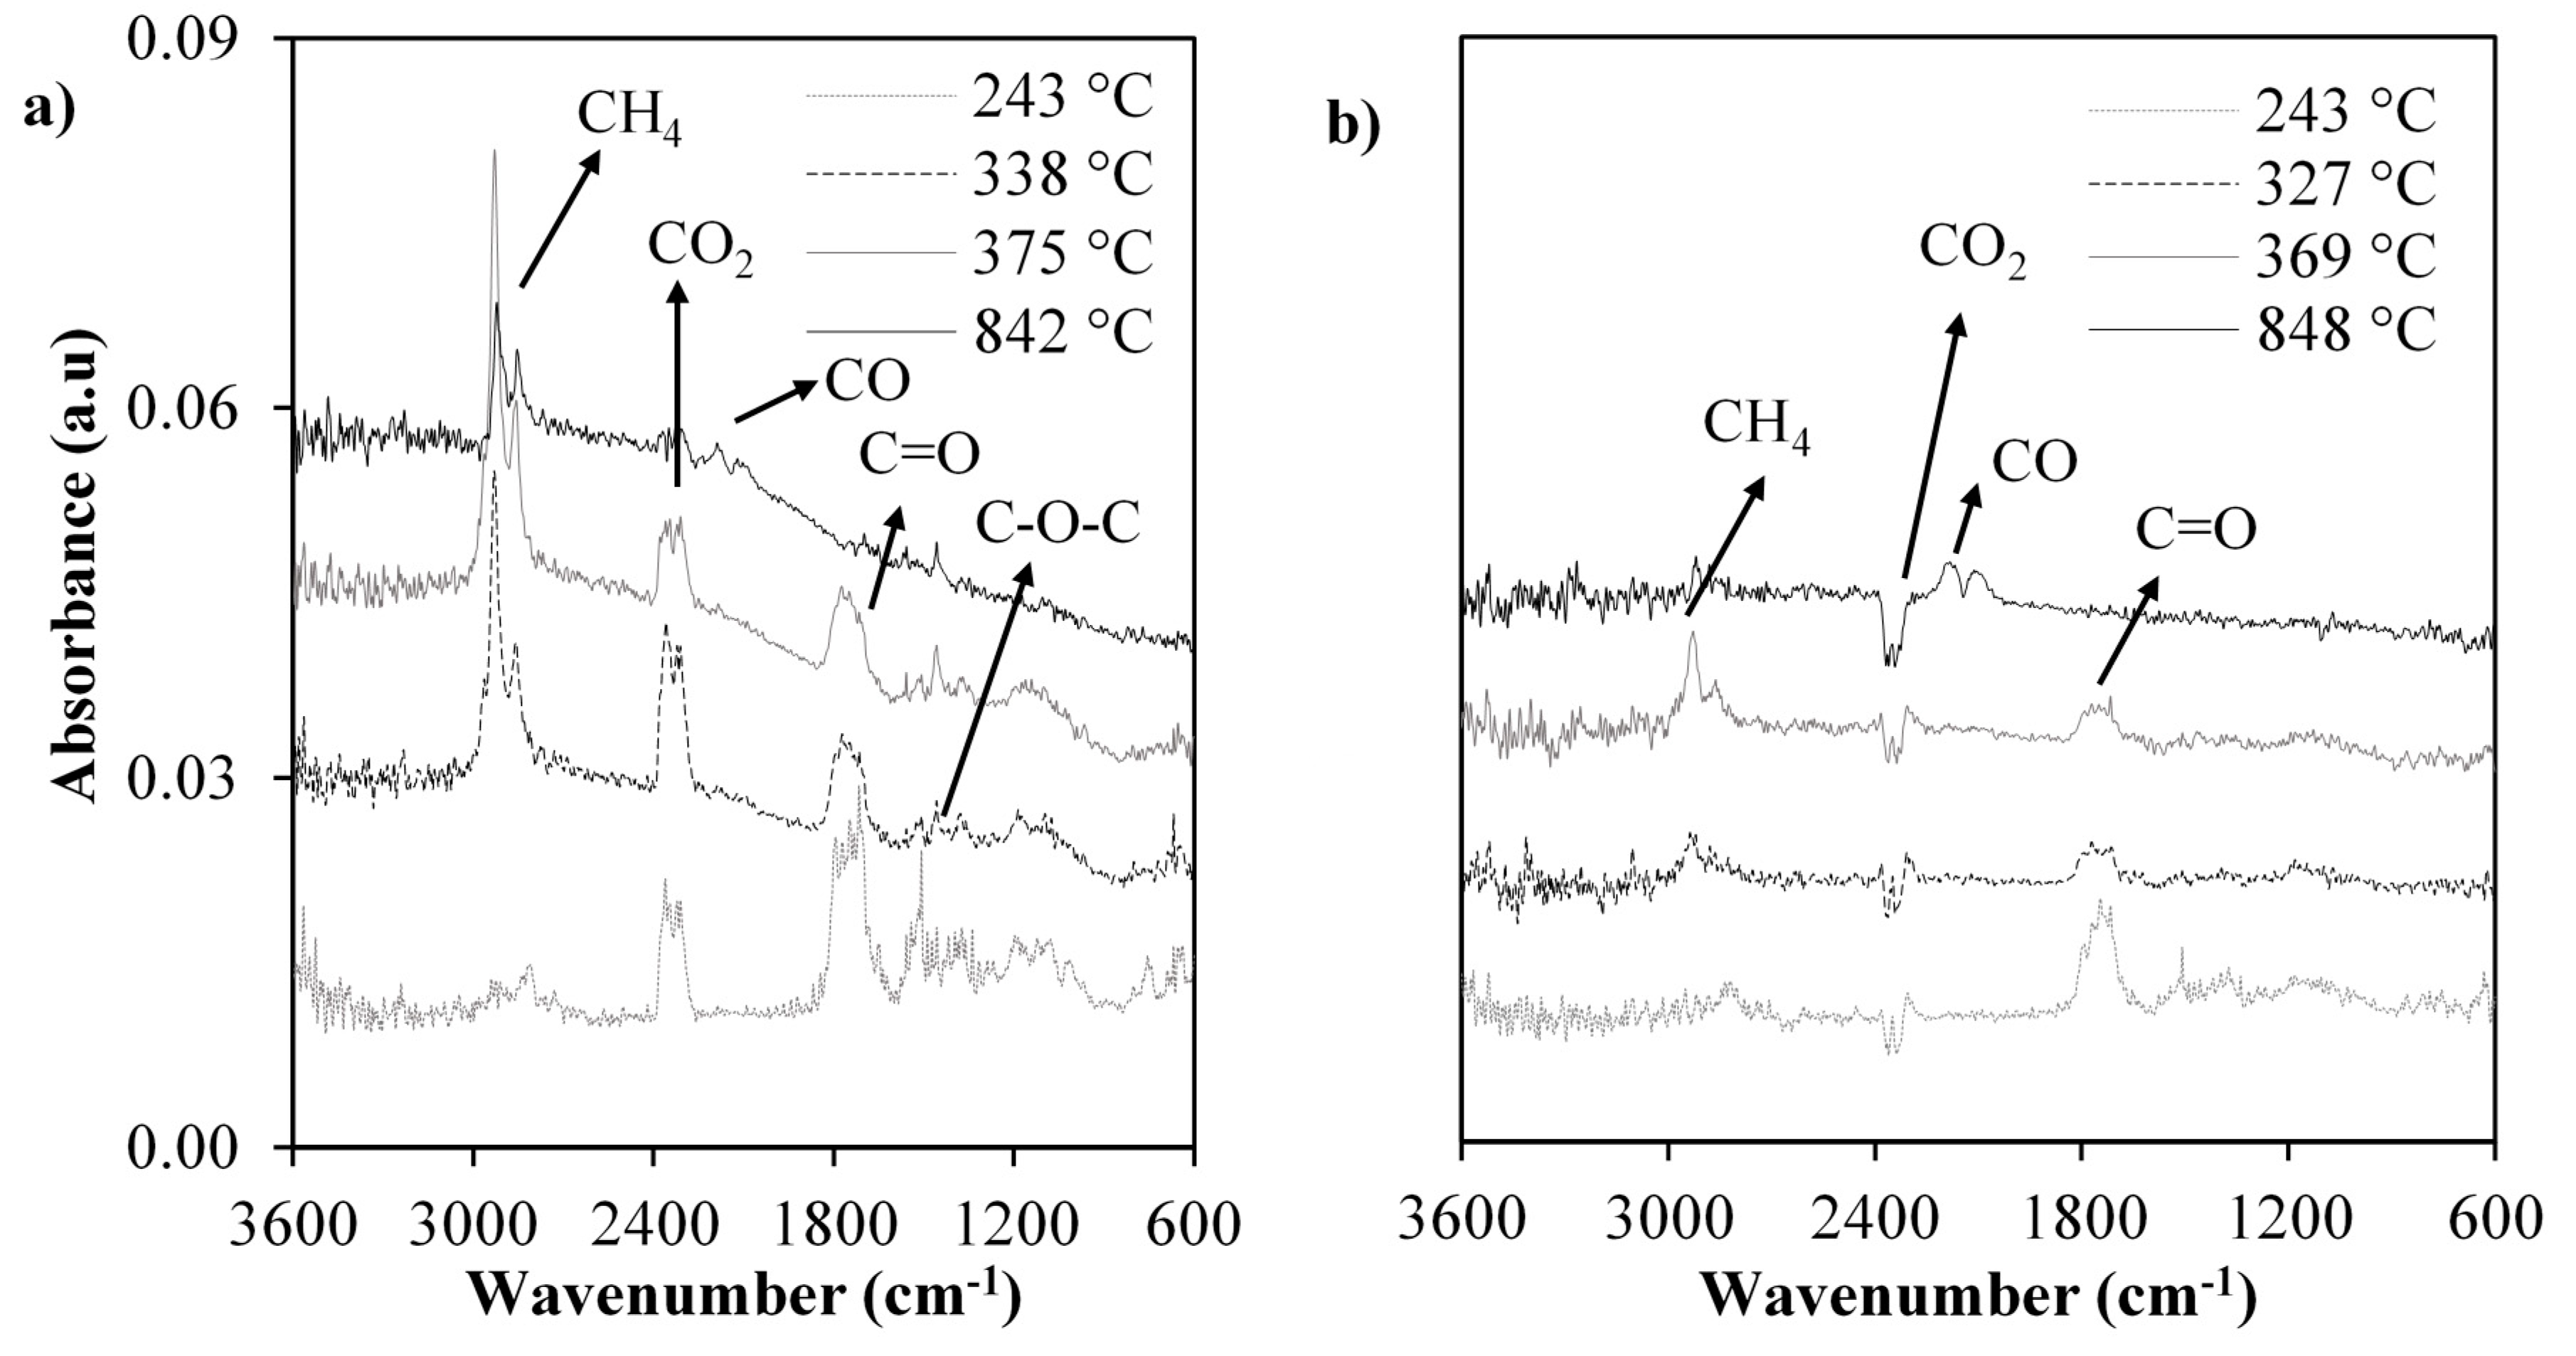
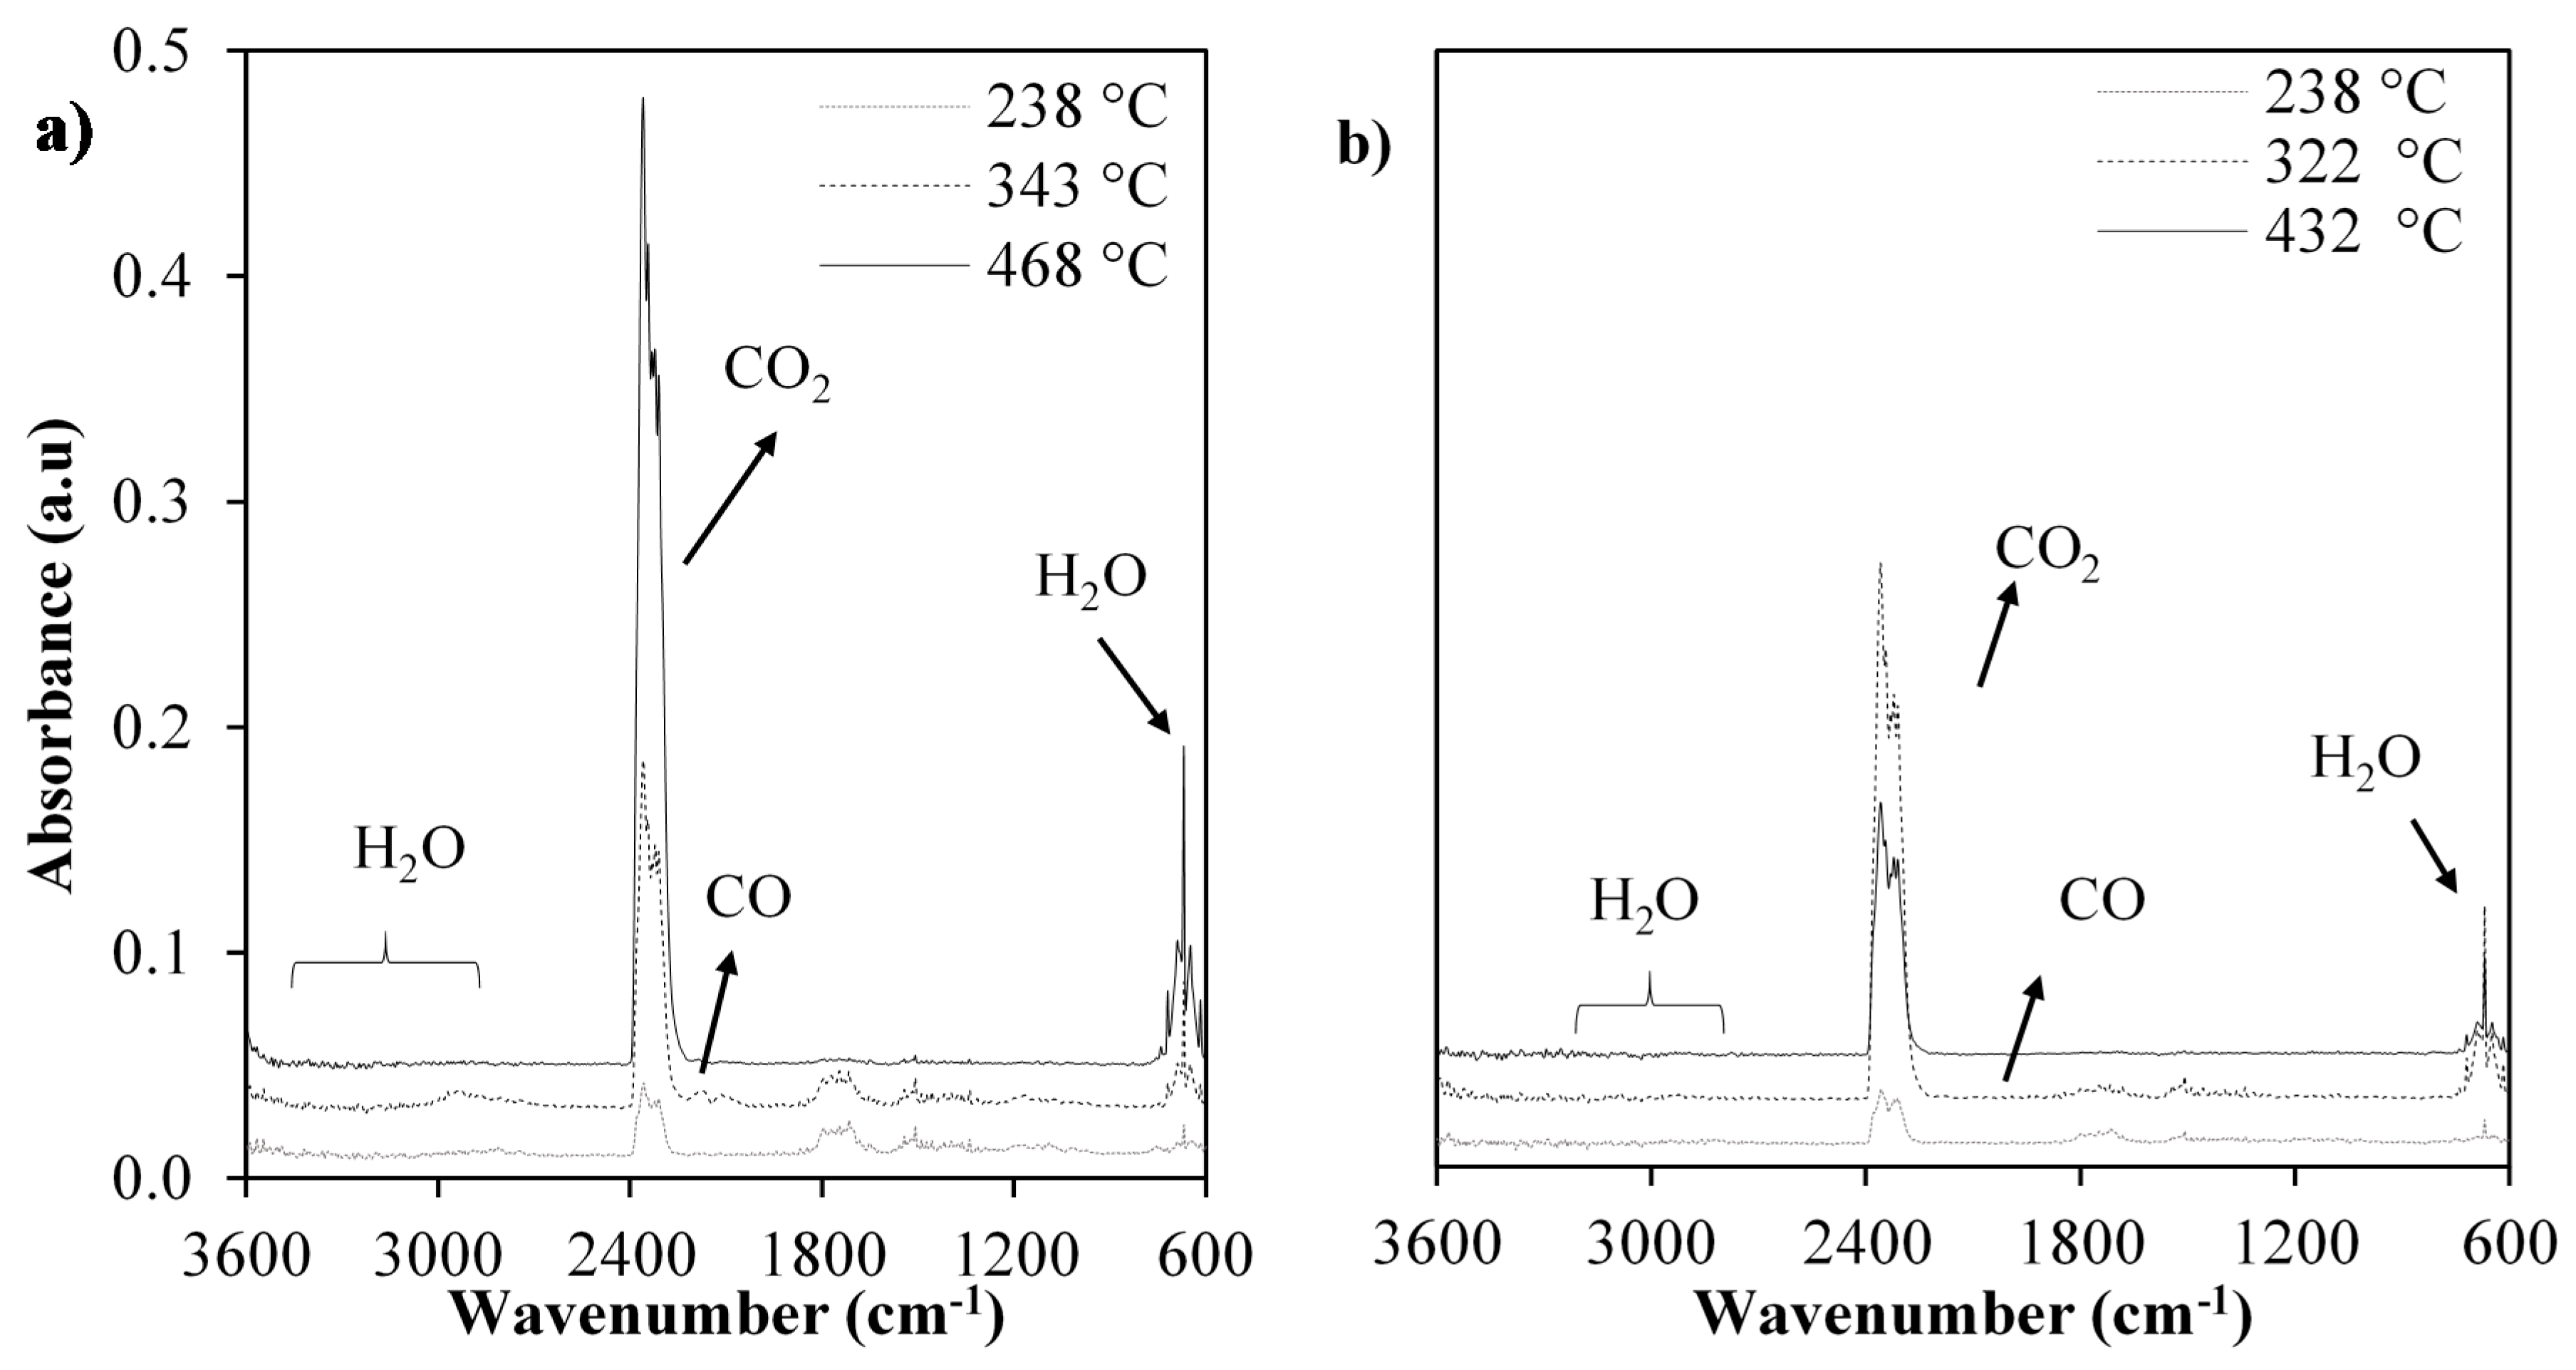
2.3. TG-FTIR Analysis
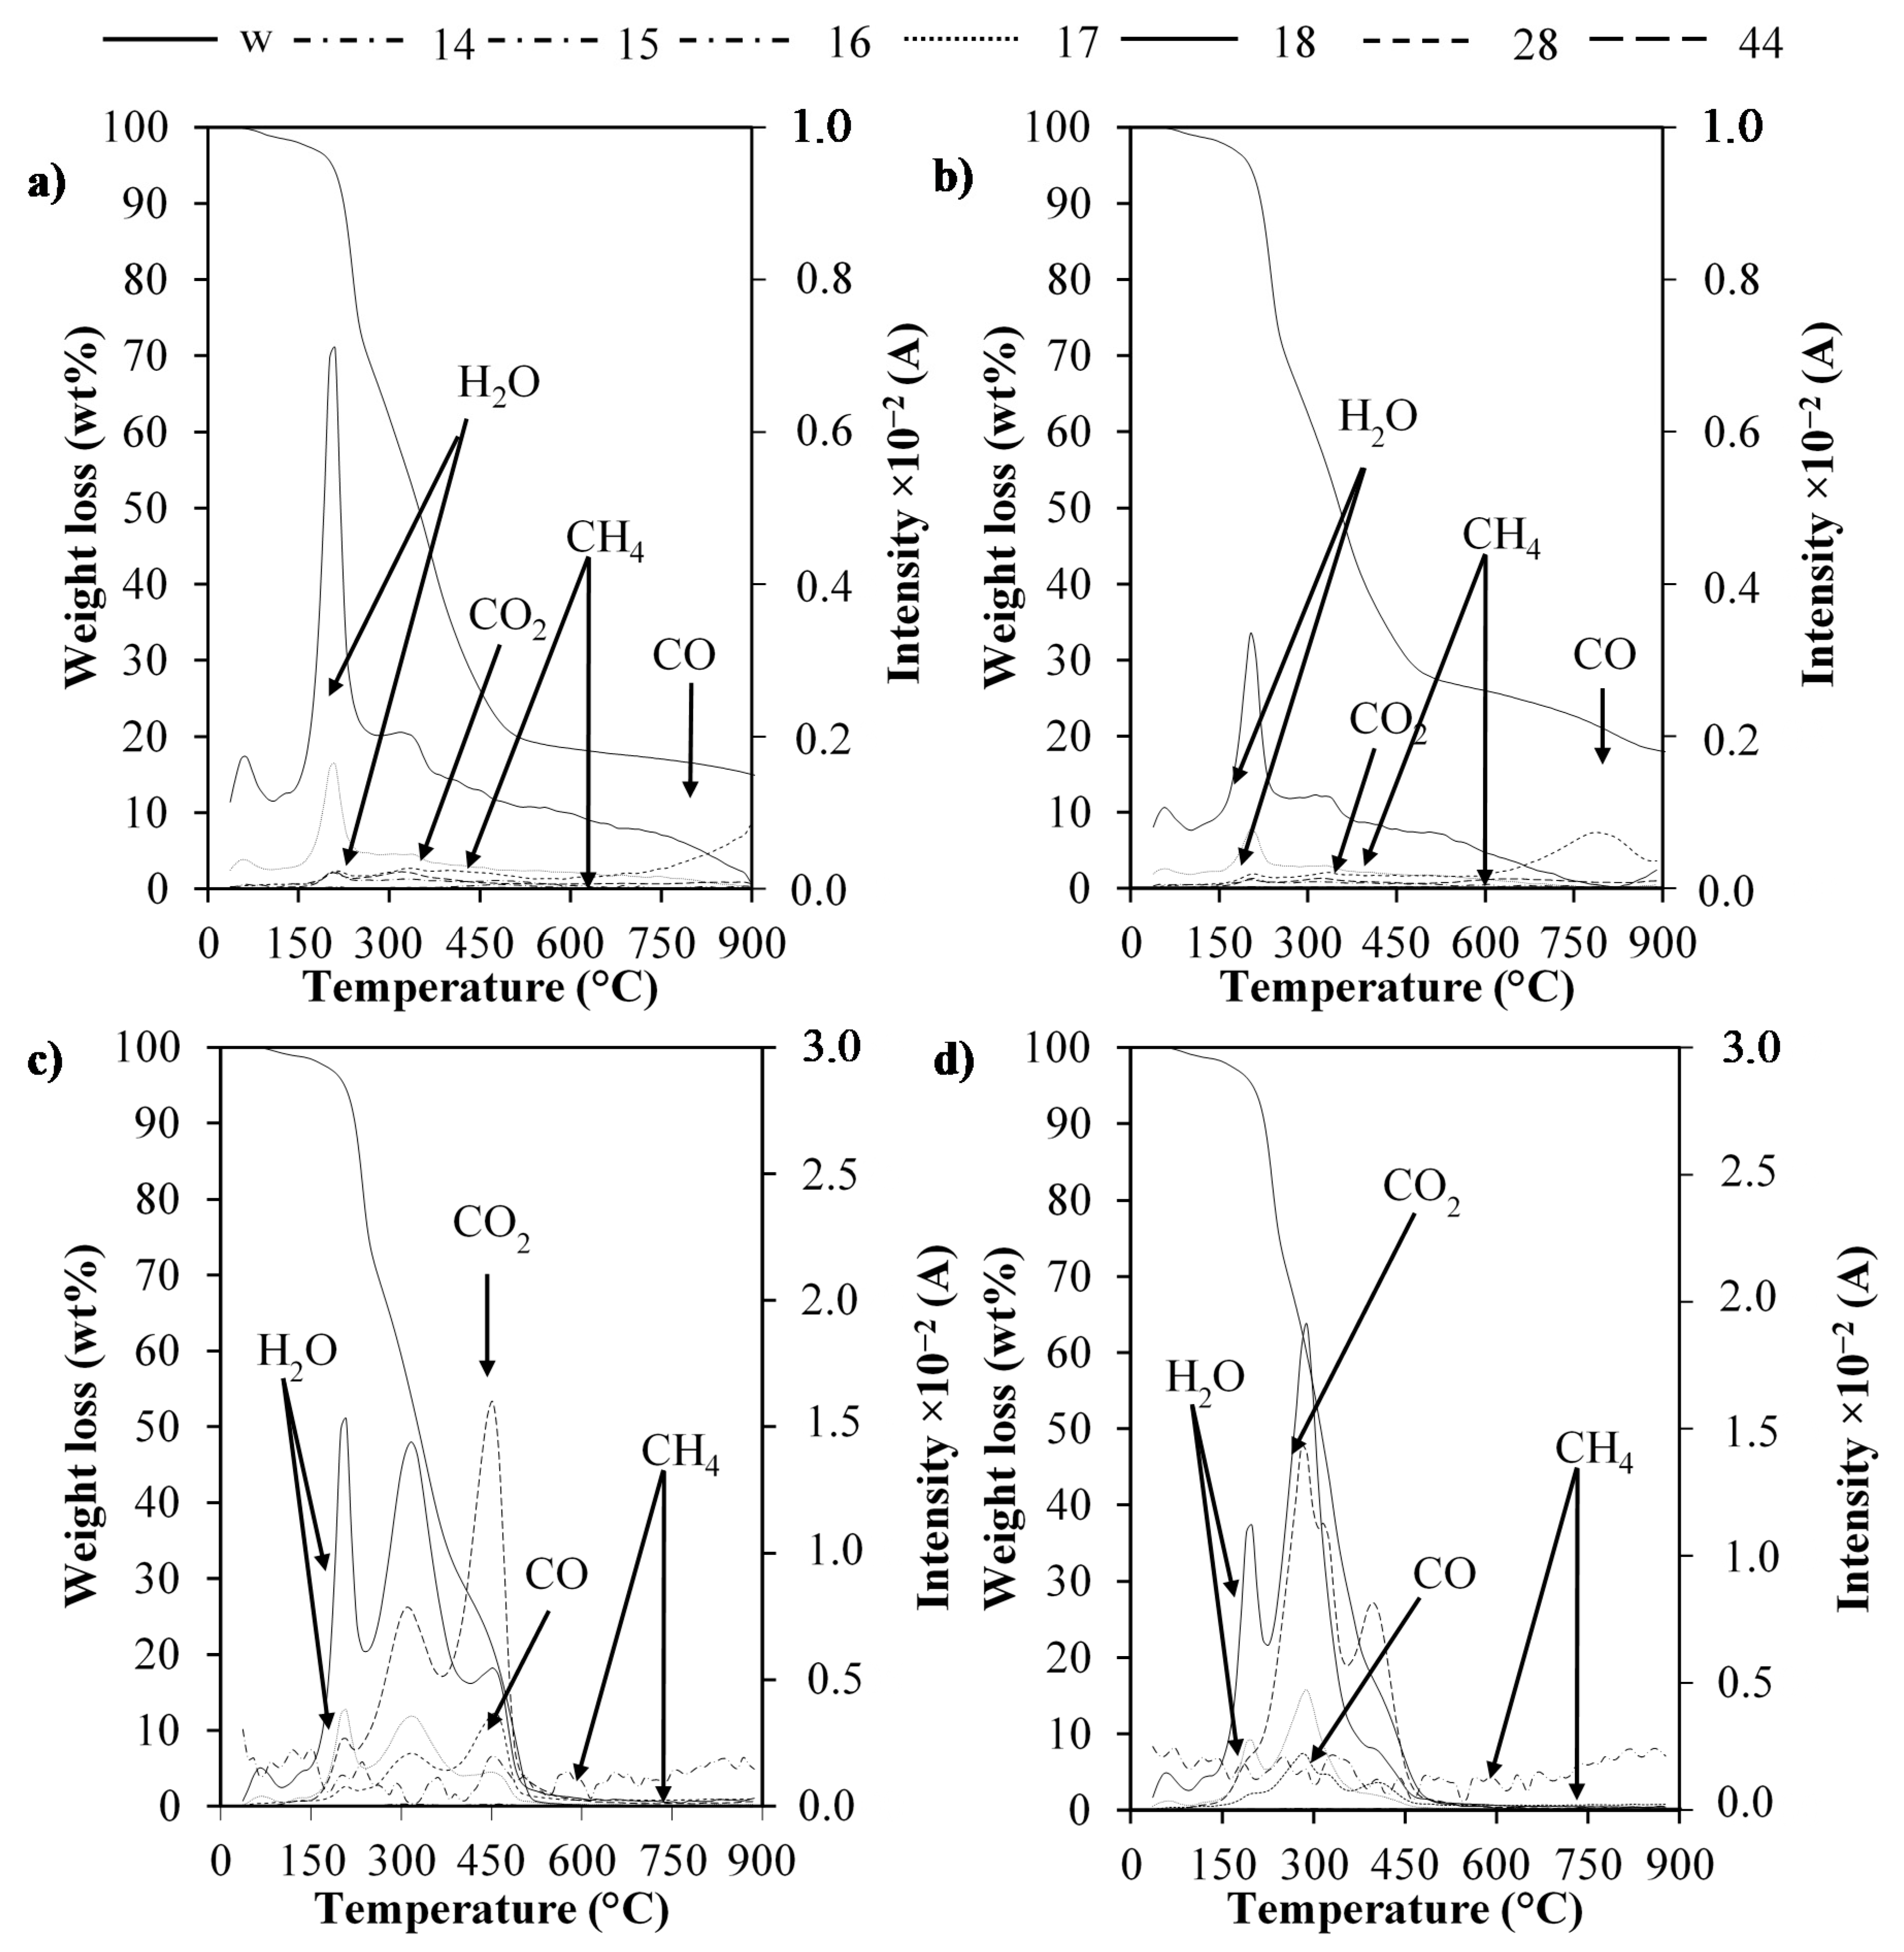
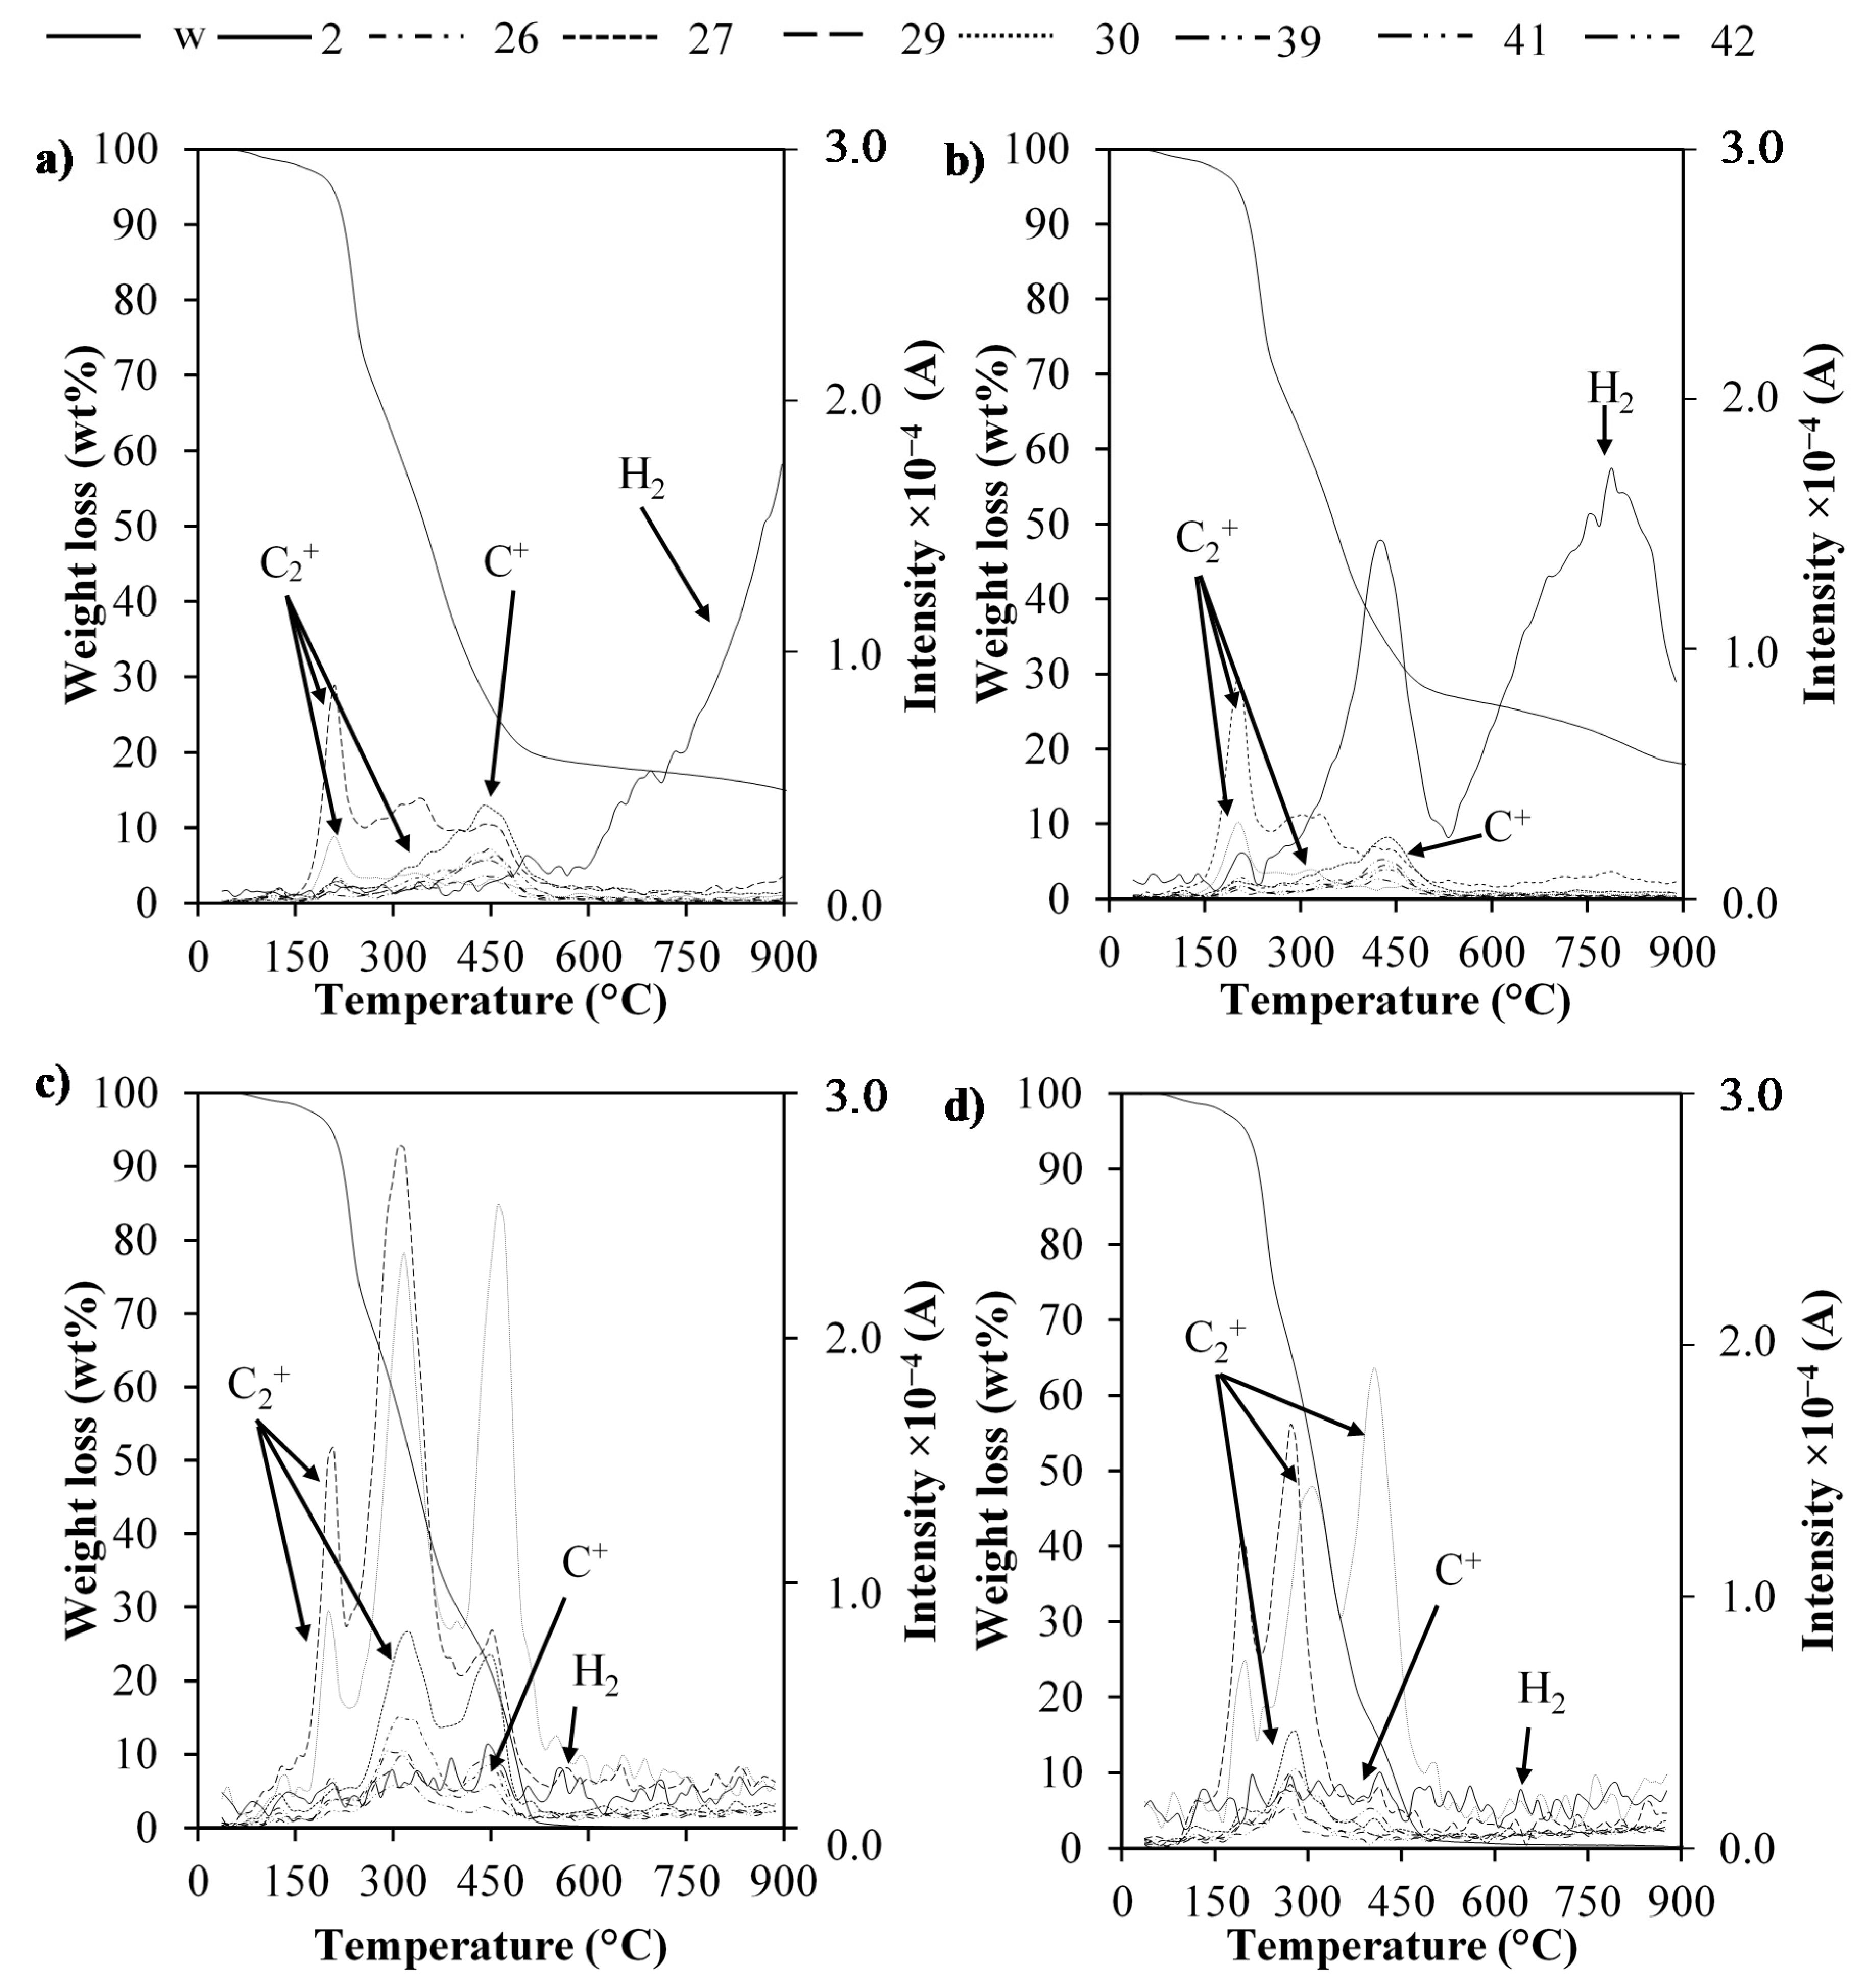
Figure 3 shows the FTIR spectra obtained for each temperature of the degradation stages mentioned in Section 2.2. Additionally, Table 2 presents the summary of the main signals observed for functional groups such as C=O, C=C, O–H and C–O–H under both atmospheres. Moreover, characteristic bands of the released gaseous products, i.e., CO2, CO, H2O and CH4, are listed. During the non-catalytic pyrolysis (Figure 3a), in stage I of degradation occurring at 243 °C, bands of CO2 were observed between 1800 and 1400 cm−1 (C=O and C=C groups) [52] and close to 2400–2200 cm−1. These bands decrease when the temperature increases, which indicates that C=O and C=C bonds are breaking at higher temperatures. Then, in stages II and III (338 and 375 °C), bands between 3200 and 2700 cm−1, associated with the symmetrical and asymmetric vibrations of the C–H groups [62], appear and increase with temperature. In all the spectra, there is a noise zone between 3900–3300 cm−1, which may be associated with the moisture of the samples. Although in DTG curves (Figure 2) a fourth stage was not identified, a less intense band between 2100–1900 cm−1 was observed at 842 °C. This band is associated with the formation of CO due to the breaking of the C=O and C=C bonds and possible OH bonds [42,52], which explains the decrease in the intensity of the bands at 1684, 1718 and 1509 cm−1. Moreover, it confirms that the degradation of these groups leads to the formation of CH4, due to the increase of bands at 2924 and 1440 cm−1 favored by the increase in temperature. The presence of other functional groups such as –CH2OH, OCH3, CHO and C–O–H (furans) can be identified in the region between 1900 and 1100 cm−1 [47,52].
Concerning the spectra obtained for the catalytic pyrolysis (Figure 3b), it shows the signal of the same functional groups as the non-catalytic process. However, bands show a lower intensity and appear at lower temperatures, which coincides with the observed in Figure 2a,b, where the curves shifted to the left due to de decrease in the degradation temperature of the biomass. Besides, the CO2 band (2330 cm−1) is observed negative, which indicates that CO2 reacts in the presence of catalyst. This may be related with the dry reforming of hydrocarbons that can be favored [61]. Consequently, a decrease in the intensity of the C=C and CH4 bands is also observed. During pyrolysis (Figure 3a), the formation of alkanes, alkenes, other hydrogenated compounds and some carboxylic acids or esters are favored. On the contrary, during catalytic pyrolysis (Figure 3b), other reactions are favored by the presence of catalyst that possibly produce H2 and CO. H2 cannot be observed through TG-FTIR, but a small peak at about 2115 cm−1, corresponding to CO, suggests that reforming and tar-cracking reactions are occurring [6]. Hence, it can be said that the sugarcane residual biomass follows the three stages of degradation characteristic of biomass in inert atmosphere or pyrolysis [45].
The spectra derived from the maximum temperatures of degradation in the combustion of sugarcane residual biomass are shown in Figure 4. The same bands were identified in both atmospheres (pyrolysis and combustion), but with different intensities. During combustion, the band of CO2 at 2330 cm−1 shows a greater intensity than during pyrolysis. Likewise, in non-catalytic conditions (Figure 4a), CO2 increases with temperature. Besides, the bands of CO and hydroxyl groups (–OH at 3727 and 669 cm−1), which are related with water [63], appear in the second stage of degradation. Otherwise, in catalytic combustion, bands of CO and CO2 were identified since stage II of degradation (Figure 4b). The above indicates that the formation of CO2 through decarboxylation reactions, due to the breakdown of carboxylic acids [62,63], is occurring at lower temperatures, confirming that observed by TG analysis. In the case of pyrolysis, the intensity of the band of the C=O groups increases with temperature (Figure 5).
TG-FTIR results (Figure 3 and Figure 4) provide useful evidence of the formation of volatile organic species during pyrolysis and combustion of the sugarcane residual biomass, in which catalytic pyrolysis promotes the conversion of carbon and the breaking of C=C bonds, releasing more volatiles. Meanwhile, during combustion, despite obtaining a higher sample conversion, the main volatiles obtained were CO2 and CO, with higher intensities than during pyrolysis. However, due to the similarity between the functional groups of some compounds, the bands cannot be easily assigned. Consequently, the products of degradation are better detailed by TG-MS analysis, as presented in what follows.

2.4. TG-MS Analysis

Figure 5 shows the ion profiles of CO (m/z = 28), CO2 (m/z = 44), CH4 (m/z = 14, 15 and 16) and H2O (m/z = 17 and 18) during catalytic and non-catalytic thermal degradation in pyrolysis and combustion atmospheres. Additionally, a semi-quantitative analysis was carried out, by integrating the intensity vs. temperature data of each ion (Table 3). Moreover, non-catalytic pyrolysis was used to normalize the areas obtained for all catalytic and non-catalytic pyrolysis and combustion; this was done in order to compare the syngas composition under the different conditions. The appearance of the degradation products corresponds to each of the three stages of degradation identified for both pyrolysis and combustion, which is consistent with that observed in TGA and TG-FTIR analyses. In addition, H2O and CH4 profiles show changes in their intensity in both atmospheres from the first stages of degradation (Figure 5a,c). Finally, CO and CO2 are clearly identified during combustion in the three stages of degradation (238, 343 and 468 °C).
The combustion of sugarcane residual biomass showed CO, CO2 and H2O as the main products, with intensities higher than pyrolysis (Figure 5c vs. Figure 5a and Table 3). Furthermore, in presence of catalyst, intensity of CO and CO2 peaks increased when compared with the combustion without catalyst (Figure 5d vs. Figure 5c). This confirms that the presence of catalyst favors the formation of these products through oxidation reactions of the heavier hydrocarbons (C+) [59], by chemisorption of O2 at the active sites of the catalyst. These active sites break the C=C bonds and promote the formation of CO and CO2 [42]. Therefore, C2+, C3+ and CH2O+ reduced their proportions. The same behavior was observed by TG-FTIR.
Figure 6 shows the ion profiles that make up some of the products of biomass pyrolysis: H2 (m/z = 2), C2H2+ and C2H3+, named C2+ hydrocarbons (m/z = 26, 27), C3H5+ and C3H6+, named C3+ hydrocarbons (m/z = 39, 41, 42) and formaldehyde (CH2O+, m/z = 30) and the effect of the Rh-Pt/CeO2-SiO2 catalyst therein. Figure 6b,d shows that the ion profiles are displaced slightly to the left, suggesting that the catalyst promotes the reactions at lower temperatures [59]. In addition, in the atmosphere of non-catalytic pyrolysis (Figure 6a), an increase in the H2 profile can be observed and only occurs at temperatures above 600 °C. On the other hand, for the biomass/catalyst sample, two peaks of H2 at 300 and 550 °C are observed, accompanied by a CO peak. Yang et al. [22] studied the catalytic pyrolysis of sawdust and straw on Ni-CaO-Ca2SiO4 catalyst and observed only one H2 peak at 400 °C. Therefore, our Rh-Pt/CeO2-SiO2 catalyst is showing itself able to promote reforming reactions between the water released in both, dehydration and degradation stages, and the C2+ and C3+ compounds, leading to a release of CO and H2 [33]. This is confirmed by the decrease in the intensity of C2+ and C3+ ions and the spectra obtained in Section 2.3 (Figure 3a and Table 3), and by the observed in Figure 5a, where the H2O intensity is lower for the catalytic pyrolysis and is more revealing that the signal observed in TG-FTIR (Figure 3b). Besides, Table 3 shows that during catalytic pyrolysis, the amount of H2 is 2.4 times higher than non-catalytic conditions. Minh Loy el al. [61] reported an increase of 1.4 times H2 composition over non-catalytic pyrolysis of rice husk in the presence of Ni powder catalyst. Furthermore, despite this catalyst being designed for reforming processes, in which it is active at temperatures above 600 °C [39], in Figure 6b it can be seen that Rh-Pt/CeO2-SiO2 is active for the production of H2 even at 300 °C.
On the other hand, Table 3 shows that combustion produces half as much H2 as non-catalytic pyrolysis, which explains the low intensity of the H2 ion signal observed in Figure 6c,d. This confirms that the presence of O2 in the medium causes the hydrocarbons preferentially convert into CO and CO2 (Figure 5c,d). These results are consistent with Yuan et al. [40], who reported the presence of H2 during pyrolysis of rice husks and other wood and plant residues, while did not observe the presence of H2 during the combustion of the same residues.
These results show in detail some of the compounds identified during the decomposition of sugarcane residual biomass in the two atmospheres, where different reactions occur. Moreover, the catalyst makes the reactions occur faster and at lower temperatures. This leads to a proposal of two different mechanisms of degradation. In the case of pyrolysis, it is observed that in stage I dehydration of the sample occurs, and in sequence, the hemicellulose and cellulose are degraded in light volatile compounds such as CH4, ethane and ethylene. Meanwhile, during stage II, heavier compounds are obtained, including propylene and carboxylic acids. In Stage III, the higher hydrocarbons disappear as the temperature increases (> 400 °C), and this leads to the formation of H2, CO and CO2. During the catalytic pyrolysis, it is observed that the catalyst affects the degradation reactions of the heavy compounds, which occurs at a lower temperature and allows for a higher production of H2 and CO.
The mechanism proposed for combustion and pyrolysis follows three main parallel reactions. Nevertheless, as noted in the results shown in Section 2.3 and Section 2.4, different product distribution occurs mainly by the presence of oxygen during combustion that favors decarboxylation reactions, obtaining CO and CO2. Therefore, in the following section, the kinetic models for pyrolysis and combustion are proposed in order to obtain the parameters that describe the thermal decomposition of this residue and the effect of the Rh-Pt/CeO2-SiO2 catalyst.

2.5. Kinetic Model

Despite differences between the product distribution in the two atmospheres evaluated, both present three stages of degradation, as can be seen in DTG decomposition curves (Section 2.2). The proposed model consists of three parallel reactions (according to the stages of degradation identified), each one following an independent reaction, according to Equation (1). The same models were used in the absence (pyrolysis) and in the presence (combustion) of air and were used to find the kinetic parameters of the reactions in the presence and in the absence of Rh-Pt/CeO2-SiO2 catalyst.
c s i 0 Component i ( c s i 0 v i ) R e s i d u e i + v i V o l a t i l e s i
where “Componenti” (i = 1 to 3) refers to different fractions of the original material, “Volatilesi” are the gases and condensable volatiles evolved in the corresponding reactions (i = 1 to 3), and “Residuei” is the char formed in the decomposition of each Componenti (i = 1 to 3). In addition, a fraction of material is introduced into the model that cannot be decomposed under the test conditions, cinert0, which will be different in pyrolysis and combustion. The parameters v i and ( c s i 0 v i ) are the yield coefficients for volatiles and solid residues, respectively. Finally, c s i 0 represents the sum of initial mass fractions of Componenti [41,43].
Due to the temperature interval where the first component (Component1) is decomposed, it would mainly be related to the degradation of hemicellulose [64]. In the same way, Component2 would be related to the decomposition of the cellulosic components of the biomass, and the third component (Component3) would represent lignin fractions [64]. Nevertheles, the analysis of these different fractions does not represent exacttly the contributions of each component ( c S i 0 ), as mentioned in previus works [41,64].
This is also supported by the evolution of volatiles observed in the TG-FTIR and TG-MS analyses (Section 2.3 and Section 2.4). The same reaction pathway described by Equation (1) is valid in the presence of oxygen, but obviously it differs from pyrolysis in the presence of oxygen as reactant in the three reactions.
The reaction conversion is defined as the ratio between the mass fractions of the solid reacted at any time (cSi0wSi) and the corresponding initial fraction of this component [43]:
α i = c S i 0   w S i c S i 0 ; i = 1 ,   2 ,   3
In the previous expression, wsi is the weight fraction related to the decomposition of Componenti. Applying the kinetic law for the proposed solid decomposition, the kinetic expression for the decomposition of each Componenti can be expressed as follows:
d ( w s i / c s i 0 ) d t = d α i / d t = k i ( 1 α i ) n i
where ni is the reaction order and ki the kinetic constant of the corresponding reaction that follow the Arrhenius equation:
k i = k i 0 e x p E i / R T ,   i = 1 ,   2 ,   3
ki0 is the pre-exponential factor (s−1) and Ei is the apparent activation energy (kJ mol−1). To solve the differential equations described in Equation (3) and find the degree of conversion αi, the Euler method was used. With the experimental data obtained from the TGA analysis (Section 2.2), 12 parameters were assumed (ni, ki0, Ei and cSi0) for each of the atmospheres (catalytic and non-catalytic pyrolysis and combustion), but these parameters were maintained for the runs performed at different heating rates. The model data calculated was the change of the mass fraction of each Componenti with time (−dws/dt):
w s c a l = 1 c i n e r t 0 i c S i 0 α i
d w s c a l d t = i c S i 0 d α i d t
The optimization was carried out in Microsoft Excel spreadsheet, using the Solver function. The approach of the functions to be optimized was made by minimizing the square differences between the calculated and experimental data. The objective function (O.F.) to be minimized in each case was:
F . O = m = 1 M j = 1 J ( w s e x p w s c a l ) 2
where M is the number of experiments, which in this case were three, one for each heating rate (5, 10 and 20 °C min−1), and J is the number of points used in the optimization of each experiment. Finally, the variation coefficient (VC (%)) was calculated to validate the model obtained (Equation (8)) [41,43].
V C = F . O / ( J P ) w s e x p ¯ * 100
where J is the number of data points in each experiment (approx. 300), and P is number of parameters optimised. w s e x p ¯ is the average of experimental values of mass fraction for each run.
The kinetic parameters obtained from the optimization of the experimental curves are presented in Table 4. It was observed that the presence of Rh-Pt/CeO2-SiO2 catalyst has a positive effect over Ei values of Component1 and Component2 in pyrolysis and Component1 and Component3 in combustion. For the pyrolysis of Components 1 and 2, the presence of catalyst resulted in a decrease of Ei from 133.6 and 108.9 kJ mol−1 to 104.2 and 75.1 kJ mol−1, respectively. Meanwhile, in combustion the catalyst decreased the Ei values for Components 1 and 3, from 144.2 and 210.5 kJ mol−1 to 127.5 and 156.6 kJ mol−1, respectively. This confirms that the Rh-Pt/CeO2-SiO2 catalyst has a positive effect by reducing the difficulty of thermal degradation [59] of sugarcane residual biomass.
The values of Ei and the kinetic constants obtained for the pyrolysis are similar to those reported for rice husk [61], considering that Component1 is mainly related to the decomposition of hemicellulose, Component2 to the cellulose and Component3 to the lignin. Moreover, Wang et al. [32] reported Ei values of 154, 113.3 and 206 kJ mol−1, for hemicellulose, cellulose and lignin, respectively. Although the presence of catalyst does not decrease the Ei for all of the degradation stages, it reduces the Ei of the overall process from 120.9 to 107.0 kJ mol−1 in pyrolysis and from 154.9 to 138.0 kJ mol−1 in combustion (Table 4). This shows that the Rh-Pt/CeO2-SiO2 catalyst is promising for the use in biomass thermal degradation processes and may offer lower energy requirements. Besides, those values are comparable with the values of catalytic pyrolysis reported by Fong et al. [60] over HZSM-5 zeolite/limestone for algae biomass (between 145 and 156 kJ mol−1) and those of in-situ catalytic pyrolysis of rice husk over Ni powder catalyst reported by Loy et al. [61] (between 50 and 163 kJ mol−1), all of them obtained by model free methods.
In the absence of catalyst, ci0 calculated values for decomposition of Component1 (Table 3) are similar because dehydration and volatile released products at lower temperatures are the same for both atmospheres [44]; as it was analized in previous Sections (2.3 and 2.4). On the contrary, calculated ci0 values for Components 2 and 3 vary considerably between pyrolysis and combustion. For Component2, pyrolysis conversion (0.28) is lower than in combustion (0.49) due to the oxidation reactions that are taking place during combustion, obtainig the greatest intensities of CO and CO2 ions in the TG-MS results, compared with pyrolysis (Section 2.4). Furthermore, during decomposition of Component3, the degradation of heavier compounds occurs for pyrolysis [61], while in combustion such degradation happened in earlier stages due to the presence of oxygen. Therefore, ci0 values of pyrolysis (0.36) for Component3 are higher than the one obtained for combustion (0.21).
In the presence of Rh-Pt/CeO2-SiO2 catalyst, ci0 values for pyrolysis and combustion increase in Component2 compared to non-catalytic conditions. For pyrolysis, contribution of this Component2 increases due to the degradation of heavier compounds (C2+ and C3+) through refomirng reactions [59], which are favored by the catalyst, resulting in the release of H2. In the case of combustion, the catalyst favors the oxidation reactions and the released C2+ and C3+ are oxidazed to CO and CO2 in the second stage of degradation. Since the major conversion of the C2+ and C3+ at catalytic conditions occurs at lower temperatures, the ci0 values of the Component3 were lower for both atmospheres (pyrolysis and combustion) compared with the non-catalytic process.
Figure 2 shows the fitting data for DTG curves. Both pyrolysis and combustion present a good agreement between experimental and calculated curves, showing a good fit using the proposed and optimized model. The variation coefficient for the data obtained to both atmospheres under catalytic and non-catalytic conditions were <5%. The lower Ei values observed, compared with non-catalytic processes, reveal the effect of the Rh-Pt/CeO2-SiO2 catalyst on the thermal degradation of biomass. Besides, the lower activation energies obtained in comparison with other biomass makes Rh-Pt/CeO2-SiO2 catalyst promising for its use in pyrolysis to syngas production. Full activity and stability tests and catalyst characterization during the catalytic pyrolysis of sugarcane residual biomass over Rh-Pt/CeO2-SiO2 is currently ongoing in our laboratory.

3. Materials and Methods

3.1. Biomass Recolection, Pretreatment and Characerization

The liquid sugarcane press-mud residue was collected from Tolima, Colombia. Initially, the press-mud residue was hydrolyzed at 130 °C for 1 h in an autoclave (TOMY Digital Biology, Tokyo, Japan) for subsequent fermentation. Then, the sugarcane press-mud was filtered using a sieve (70-mesh, 212 µm) to remove the solid phase. Afterwards, the solid residue containing the lignocellulosic material was dried at 60 °C for 72 h, grounded and sieved in a AS200 sieve (Retsch, Haan, Germany). Finally, the dry solid fraction (sugarcane residual biomass) with particle sizes <212 μm was the biomass used in this study.
Samples were characterized by elemental analysis using a CHNS analyzer FlashEA 1112 Series (Thermo Fisher Scientific, Waltham, MA, USA). Oxygen content was determined by difference on a dry ash basis. The proximate analysis was performed by thermogravimetry in a TGA/DSC1 (Mettler Toledo, Columbus, OH, USA), following the method described by García et al. [65] The enthalpy of combustion was measured in a calorimetric pump AC-350 (LECO, St. Joseph, MI, USA); this was used to determine the lower and higher heating value on dry basis (LHVdb and HHVdb), according to Equations (9) and (10).
L H V d b ( cal   g 1 ) = Δ H c o m b u s t i o n ( cal   g 1 ) 10.56   ( % N ) 22.01   ( % S ) 52.56   ( % H )
H H V d b ( cal   g 1 ) = L H V d b   ( cal   g 1 ) + 52.56   ( % H )
where % N, S and H are the weight percentages from elemental analysis of the sample, Δ H c o m b u s t i o n is the enthalpy of combustion of the biomass, and the numbers represent the different formation enthalpies in cal g−1.
Moreover, the quantitative analysis of the composition of the ashes was carried out by inductive coupling plasma mass spectrometry (ICP-MS 7700x) (Algilent Technologies, Santa Clara, CA, USA). Samples were prepared following the EPA 3051A method (acid digestion with microwaves for sediments, sludges, soils and solids). For this, the digestion of 0.1 g of biomass was performed using 4 mL of HNO3 and 1 mL of H2O2, then the digestion was completed by microwave with a maximum power of 950 W. Finally, the digested sample was filtered with glass fiber and diluted into water to a volume of 25 mL and analyzed in the ICP-MS. To obtain information of the functional groups in the biomass, the sample was characterized by Attenuated Total Reflection Fourier Transform Spectroscopy (ATR-FTIR, IFS 66S) (Bruker, Billerica, MA, USA). Each IR spectrum was obtained in a scanning range of 4000 and 600 cm−1 with 4 cm−1 of resolution.

3.2. Catalyst Synthesis

The Rh-Pt/CeO2-SiO2 catalyst was prepared following the methodology proposed by Cifuentes et al. [38] For this, the mixed support was obtained by dissolving the Ce(NO3)3·6H2O (99.9%, Merck, Darmstadt, Germany), as CeO2 precursor, in distilled water and added slowly to the SiO2 (Merck, Darmstadt, Germany). Subsequently, the support was dried for 24 h in an oven at 80 °C and calcined at 500 °C for 4 h. Rhodium (III) chloride hydrate (RhCl3·H2O) (Merck, Darmstadt, Germany) and hexachloroplatinic acid hexahydrate (H2PtCl6·6H2O) (Merck, Darmstadt, Germany) were used as precursor salts of the metals and were added by the incipient wet impregnation method [39] up to a total load of 0.4 wt% of each metal. These loads of rhodium (Rh) and platinum (Pt) were selected considering their reported activity in reforming reactions [39]. The final solid was dried at 80 °C for 24 h, then calcined at 700 °C for 2 h and reduced with 8% H2/He at a flowrate of 200 mL min−1. Finally, to ensure a particle size <177 μm, the final solid obtained was sieved on an 80-mesh sieve. The effect of the Rh-Pt/CeO2-SiO2 catalyst was evaluated using a 1:1 biomass/catalyst ratio. This ratio was selected based on the results reported by [6,22,59]. A complete characterization of the catalyst has been previously reported [38], with a surface area of 104 m2 gcat−1.

3.3. TG Analysis

Thermal degradation of biomass was evaluated at three different heating rates (5, 10 and 20 °C min−1) up to 900 °C in two reaction atmospheres, pyrolysis (N2) and combustion (synthetic air). These conditions were applied to the sugarcane residual biomass samples with and without catalyst, for a total of 12 experiments. The analysis was carried out in a thermobalance model STA6000 (Perkin Elmer, Waltham, MA, USA). For all the experiments, 2–5 mg of dried samples was used, with a total flow rate of 100 mL min−1. To ensure the reproducibility of the experiments, duplicates of experiments were carried out randomly, ensuring a difference <5%. Weight loss was defined as the ratio between the mass of the solid at any time (m) and the initial mass of the solid (m0). Moreover, the DTG curves represent the weight change with time.

3.4. TG-FTIR Analysis

Volatile compounds obtained during the thermal degradation were analyzed by TG-FTIR analysis, using a TGA/DSC1 (Mettler Toledo, Columbus, OH, USA), coupled to a Nicolet 6700 FT-IR spectrometer (Thermo Scientific, Waltham, MA, USA). The experiments were carried out in the two reaction atmospheres, pyrolysis and combustion, with a flow rate of 100 mL min−1, heating up to 900 °C at 10 °C min−1 with approximately 5 mg of the samples. The absorbance was measured with a resolution of 4 cm−1 in a range of 3600–600 cm−1.

3.5. TG-MS Analysis

To identify diatomic molecules such as H2, which cannot be identified by TG-FTIR, and to associate the identified functional groups with specific compounds, TGA-MS analysis was performed. Tests were carried out in a thermobalance TGA/SDTA851e/LF/1600 model (Mettler Toledo, Columbus, OH, USA), coupled to a mass spectrometer Thermostar GSD301T model (Pfeiffer vacuum, Asslar, Germany), which works on Square-Input Response (SIR) mode with ionization of 70 eV. In these experiments, the gases used were He (pyrolysis) and He:O2 = 4:1 (combustion), both with a flow rate of 100 mL min−1 and approximately 5 mg of sample, heating up to 900 °C at 30 °C min−1. To track a broad spectrum of compounds, two different runs were performed. In the first, the mass/charge ratios (m/z) were followed in the range of 2–46 and the next, in the range of 50–106. The response of the different ions was divided by the He response (m/z = 4). Finally, to obtain the proportions of the species, the areas of the followed ions were calculated integrating the TG-MS results.

3.6. Kinetic Model

A model fitting method was used for the kinetic modeling. For that purpose, a model explaining thermal decomposition in both atmospheres (pyrolysis and combustion) was proposed. This methodology has been used in kinetic models for biomass [44] and other types of materials [41]. The kinetic model proposed for the pyrolysis of biomasses could be interpreted considering the materials formed by three different fractions, as shown in Equation (1). Note that, at first, none of the components is related to a particular chemical structure; i.e., Componenti do not correspond to celullose, hemicellulose or lignin fractions [64].
All raw and processed Excel data from TG, TG-FTIR, TG-MS analysis and the fitting method of the estimated kinetic parameters can be downloaded from [dataset] [66].

4. Conclusions

Catalytic and non-catalytic thermal degradation of sugarcane residual biomass under non-isothermal conditions was studied for pyrolysis and combustion. Under the oxidizing atmosphere of combustion H2O, CO2 and CO are mainly produced. Contrarily, H2O, C+2, C+3, CO and H2 are the main products during pyrolysis. Catalytic pyrolysis over the Rh-Pt/CeO2-SiO2 catalyst increases the production of H2 at 300 and 550 °C. Moreover, a decrease in H2O, C+2 and C+3 products indicates that the catalyst accelerates the formation of light hydrocarbons, favored by cracking and reforming reactions of the heavier compounds.
Product distributions obtained from TG-FTIR and TG-MS analysis were used to propose two kinetic models for the thermal degradation of sugarcane residual biomass. The proposed models presented a good fit (VC <5%) with the experimental data based on the parallel decomposition of three different components. The evolution of volatiles takes place in three different stages: dehydration (stage I), degradation of hemicellulose and cellulose (stage II) and degradation of cellulose and lignin (stage III). The presence of catalyst shows a positive effect on the kinetic parameter reducing the activation energies for both pyrolysis and combustion. In the case of catalytic pyrolysis, the overall activation energies decrease by about 20%–30%, compared with the non-catalytic pyrolysis. In this way, the Rh-Pt/CeO2-SiO2 catalyst improves the performance of the sugarcane residual biomass pyrolysis and is presented as a suitable catalyst for obtaining H2-rich syngas. Furthermore, the kinetic parameters obtained can be used in thermochemical unit design for catalytic pyrolysis.

Author Contributions

Conceptualization, E.Q., J.A.C. and M.C.; methodology, E.Q., M.F.V. and J.A.C.; validation, E.Q., M.F.V. and J.A.C.; investigation, E.Q.; writing—original draft preparation, E.Q.; resources, J.M., J.A.C. and M.C. writing—review and editing, J.M., J.A.C. and M.C.; visualization, J.M. and M.C.; supervision, J.M., M.F.V. and M.C.; project administration, J.M. and M.C.; funding acquisition, J.M. and M.C. All authors have read and agreed to the published version of the manuscript.

Funding

This research was funded by Colciencias (Francisco Jose de Caldas Fund) and Universidad de La Sabana through the Project ING-221 (Colciencias contract 548–2019) and The International Relations Department of University of Alicante for the financial support through the program named “University Development Cooperation 2018”.

Acknowledgments

E. Quiroga acknowledges the Universidad de La Sabana for the Teaching Assistant Scholarship for her master’s studies.

Conflicts of Interest

There are no conflicts of interest to declare.

References

  1. Mishra, R.K.; Mohanty, K. Pyrolysis kinetics and thermal behavior of waste sawdust biomass using thermogravimetric analysis. Bioresour. Technol. 2018, 251, 63–74. [Google Scholar] [CrossRef]
  2. Organización de las Naciones Unidas (ONU) Combatir el Cambio Climático—Desarrollo Sostenible. Available online: http://www.un.org/sustainabledevelopment/es/combatir-el-cambio-climatico/ (accessed on 11 April 2017).
  3. Ansari, K.B.; Gaikar, V.G. Pressmud as an alternate resource for hydrocarbons and chemicals by thermal pyrolysis. Ind. Eng. Chem. Res. 2014, 53, 1878–1889. [Google Scholar] [CrossRef]
  4. Xiang, Z.; Liang, J.; Morgan, H.M., Jr.; Liu, Y.; Mao, H.; Bu, Q. Thermal behavior and kinetic study for co-pyrolysis of lignocellulosic biomass with polyethylene over Cobalt modified ZSM-5 catalyst by thermogravimetric analysis. Bioresour. Technol. 2018, 247, 804–811. [Google Scholar] [CrossRef] [PubMed]
  5. Loy, A.C.M.; Gan, D.K.W.; Yusup, S.; Chin, B.L.F.; Lam, M.K.; Shahbaz, M.; Unrean, P.; Acda, M.N.; Rianawati, E. Thermogravimetric kinetic modelling of in-situ catalytic pyrolytic conversion of rice husk to bioenergy using rice hull ash catalyst. Bioresour. Technol. 2018, 261, 213–222. [Google Scholar] [CrossRef]
  6. Zhao, M.; Memon, M.Z.; Ji, G.; Yang, X.; Vuppaladadiyam, A.K.; Song, Y.; Raheem, A.; Li, J.; Wang, W.; Zhou, H. Alkali metal bifunctional catalyst-sorbents enabled biomass pyrolysis for enhanced hydrogen production. Renew. Energy 2020, 148, 168–175. [Google Scholar] [CrossRef]
  7. Wu, Y.; Liao, Y.; Liu, G.; Ma, X. Syngas production by chemical looping gasification of biomass with steam and CaO additive. Int. J. Hydrog. Energy 2018, 43, 19375–19383. [Google Scholar] [CrossRef]
  8. Gunasee, S.D.; Carrier, M.; Gorgens, J.F.; Mohee, R. Pyrolysis and combustion of municipal solid wastes: Evaluation of synergistic effects using TGA-MS. J. Anal. Appl. Pyrolysis 2016, 121, 50–61. [Google Scholar] [CrossRef] [Green Version]
  9. Wang, Q.; Wang, G.; Zhan, J.; Lee, J.-Y.; Wang, H.; Wang, C. Combustion behaviors and kinetics analysis of coal, biomass and plastic. Thermochim. Acta 2018, 669, 140–148. [Google Scholar] [CrossRef] [Green Version]
  10. Sharma, H.B.; Sarmah, A.K.; Dubey, B. Hydrothermal carbonization of renewable waste biomass for solid biofuel production: A discussion on process mechanism, the influence of process parameters, environmental performance and fuel properties of hydrochar. Renew. Sustain. Energy Rev. 2020, 123, 109761. [Google Scholar] [CrossRef]
  11. Jaswal, R.; Shende, A.; Nan, W.; Amar, V.; Shende, R. Hydrothermal liquefaction and photocatalytic reforming of pinewood (pinus ponderosa)-derived acid hydrolysis residue for hydrogen and bio-oil production. Energy Fuels 2019, 33, 6454–6462. [Google Scholar] [CrossRef]
  12. Duman, G.; Watanabe, T.; Uddin, M.A.; Yanik, J. Steam gasification of safflower seed cake and catalytic tar decomposition over ceria modified iron oxide catalysts. Fuel Process. Technol. 2014, 126, 276–283. [Google Scholar] [CrossRef] [Green Version]
  13. Guo, F.; Li, X.; Liu, Y.; Peng, K.; Guo, C.; Rao, Z. Catalytic cracking of biomass pyrolysis tar over char-supported catalysts. Energy Convers. Manag. 2018, 167, 81–90. [Google Scholar] [CrossRef]
  14. Lucia, U. Overview on fuel cells. Renew. Sustain. Energy Rev. 2014, 30, 164–169. [Google Scholar] [CrossRef]
  15. Portafolio “Colombia tiene potencial para producir energía con biomasa” | Infraestructura | Economía | Portafolio. Available online: https://www.portafolio.co/economia/infraestructura/colombia-tiene-potencial-para-producir-energia-con-biomasa-505377 (accessed on 18 February 2019).
  16. Escalante, H.; Orduz, J.; Zapata, H.; Cardona, M.C.; Duarte, M. Atlas del Potencial Energético de la Biomasa Residual en Colombia; Universidad Industrial de Santander: Bucaramanga, Colombia, 2011. [Google Scholar]
  17. García-Torres, R.; Rios-Leal, E.; Martínez-Toledo, Á.; Ramos-Morales, F.; Cruz-Sánchez, S.; Cuevas-Díaz, M.D.C. Uso de cachaza y bagazo de caña de azúcar en la remoción de hidrocarburos en el suelo contaminado. Rev. Int. Contam. Ambient. 2011, 27, 31–39. [Google Scholar]
  18. Procaña Asociación Colombiana de Productores y Proveedores de caña de azucar. Available online: http://www.procana.org/new/quienes-somos/subproductos-y-derivados-de-la-caña.html (accessed on 13 March 2017).
  19. Sanchez, N.; Ruiz, R.Y.; Cifuentes, B.; Cobo, M. Dataset for controlling sugarcane press-mud fermentation to increase bioethanol steam reforming for hydrogen production. Waste Manag. 2019, 98, 1–13. [Google Scholar] [CrossRef]
  20. Shen, Y.; Wang, J.; Ge, X.; Chen, M. By-products recycling for syngas cleanup in biomass pyrolysis—An overview. Renew. Sustain. Energy Rev. 2016, 59, 1246–1268. [Google Scholar] [CrossRef]
  21. Domínguez, A.; Menéndez, J.A.; Pis, J.J. Hydrogen rich fuel gas production from the pyrolysis of wet sewage sludge at high temperature. J. Anal. Appl. Pyrolysis 2006, 77, 127–132. [Google Scholar] [CrossRef]
  22. Yang, H.; Ji, G.; Clough, P.T.; Xu, X.; Zhao, M. Kinetics of catalytic biomass pyrolysis using Ni-based functional materials. Fuel Process. Technol. 2019, 195, 106145. [Google Scholar] [CrossRef]
  23. Gupta, N.; Tripathi, S.; Balomajumder, C. Characterization of pressmud: A sugar industry waste. Fuel 2011, 90, 389–394. [Google Scholar] [CrossRef]
  24. Gangavati, P.B.; Safi, M.J.; Singh, A.; Prasad, B.; Mishra, I.M. Pyrolysis and thermal oxidation kinetics of sugar mill press mud. Thermochim. Acta 2005, 428, 63–70. [Google Scholar] [CrossRef]
  25. Yu, H.; Liu, Y.; Liu, J.; Chen, D. High catalytic performance of an innovative Ni/magnesium slag catalyst for the syngas production and tar removal from biomass pyrolysis. Fuel 2019, 254, 115622. [Google Scholar] [CrossRef]
  26. Garba, M.U.; Inalegwu, A.; Musa, U.; Aboje, A.A.; Kovo, A.S.; Adeniyi, D.O. Thermogravimetric characteristic and kinetic of catalytic co-pyrolysis of biomass with low- and high-density polyethylenes. Biomass Convers. Biorefin. 2018, 8, 143–150. [Google Scholar] [CrossRef]
  27. Akubo, K.; Nahil, M.A.; Williams, P.T. Pyrolysis-catalytic steam reforming of agricultural biomass wastes and biomass components for production of hydrogen/syngas. J. Energy Inst. 2019, 92, 1987–1996. [Google Scholar] [CrossRef]
  28. Albertazzi, S.; Basile, F.; Brandin, J.; Einvall, J.; Fornasari, G.; Hulteberg, C.; Sanati, M.; Trifirò, F.; Vaccari, A. Pt-Rh/MgAl(O) catalyst for the upgrading of biomass-generated synthesis gases. Energy Fuels 2009, 23, 573–579. [Google Scholar] [CrossRef]
  29. Santamaria, L.; Arregi, A.; Alvarez, J.; Artetxe, M.; Amutio, M.; Lopez, G.; Bilbao, J.; Olazar, M. Performance of a Ni/ZrO2 catalyst in the steam reforming of the volatiles derived from biomass pyrolysis. J. Anal. Appl. Pyrolysis 2018, 136, 222–231. [Google Scholar] [CrossRef]
  30. Ammendola, P.; Lisi, L.; Piriou, B.; Ruoppolo, G. Rh-perovskite catalysts for conversion of tar from biomass pyrolysis. Chem. Eng. J. 2009, 154, 361–368. [Google Scholar] [CrossRef]
  31. Lu, Q.; Li, W.; Zhang, X.; Liu, Z.; Cao, Q.; Xie, X.; Yuan, S. Experimental study on catalytic pyrolysis of biomass over a Ni/Ca-promoted Fe catalyst. Fuel 2020, 263, 116690. [Google Scholar] [CrossRef]
  32. Wang, C.; Li, L.; Zeng, Z.; Xu, X.; Ma, X.; Chen, R.; Su, C. Catalytic performance of potassium in lignocellulosic biomass pyrolysis based on an optimized three-parallel distributed activation energy model. Bioresour. Technol. 2019, 281, 412–420. [Google Scholar] [CrossRef]
  33. Balasundram, V.; Ibrahim, N.; Kasmani, R.M.; Hamid, M.K.A.; Isha, R.; Hasbullah, H.; Ali, R.R. Thermogravimetric catalytic pyrolysis and kinetic studies of coconut copra and rice husk for possible maximum production of pyrolysis oil. J. Clean. Prod. 2017, 167, 218–228. [Google Scholar] [CrossRef]
  34. Federici, J.A.; Vlachos, D.G. Experimental studies on syngas catalytic combustion on Pt/Al2O3 in a microreactor. Combust. Flame 2011, 158, 2540–2543. [Google Scholar] [CrossRef]
  35. Li, S.; Zheng, H.; Zheng, Y.; Tian, J.; Jing, T.; Chang, J.S.; Ho, S.H. Recent advances in hydrogen production by thermo-catalytic conversion of biomass. Int. J. Hydrog. Energy 2019, 44, 14266–14278. [Google Scholar] [CrossRef]
  36. Rioche, C.; Kulkarni, S.; Meunier, F.C.; Breen, J.P.; Burch, R. Steam reforming of model compounds and fast pyrolysis bio-oil on supported noble metal catalysts. Appl. Catal. B Environ. 2005, 61, 130–139. [Google Scholar] [CrossRef]
  37. Tomishige, K.; Asadullah, M.; Kunimori, K. Syngas production by biomass gasification using Rh/CeO2/SiO2 catalysts and fluidized bed reactor. Catal. Today 2004, 89, 389–403. [Google Scholar] [CrossRef]
  38. Cifuentes, B.; Valero, M.F.; Conesa, J.A.J.; Cobo, M. Hydrogen Production by Steam Reforming of Ethanol on Rh-Pt Catalysts: Influence of CeO2, ZrO2, and La2O3 as Supports. Catalysts 2015, 5, 1872–1896. [Google Scholar] [CrossRef] [Green Version]
  39. Cifuentes, B.; Hernández, M.; Monsalve, S.; Cobo, M. Hydrogen production by steam reforming of ethanol on a RhPt/CeO2/SiO2 catalyst: Synergistic effect of the Si:Ce ratio on the catalyst performance. Appl. Catal. A Gen. 2016, 523, 283–293. [Google Scholar] [CrossRef]
  40. Yuan, R.; Yu, S.; Shen, Y. Pyrolysis and combustion kinetics of lignocellulosic biomass pellets with calcium-rich wastes from agro-forestry residues. Waste Manag. 2019, 87, 86–96. [Google Scholar] [CrossRef]
  41. Garrido, M.A.; Font, R.; Conesa, J.A. Kinetic study and thermal decomposition behavior of viscoelastic memory foam. Energy Convers. Manag. 2016, 119, 327–337. [Google Scholar] [CrossRef] [Green Version]
  42. Safar, M.; Lin, B.J.; Chen, W.H.; Langauer, D.; Chang, J.S.; Raclavska, H.; Pétrissans, A.; Rousset, P.; Pétrissans, M. Catalytic effects of potassium on biomass pyrolysis, combustion and torrefaction. Appl. Energy 2019, 235, 346–355. [Google Scholar] [CrossRef]
  43. Conesa, J.A.; Soler, A. Decomposition kinetics of materials combining biomass and electronic waste. J. Therm. Anal. Calorim. 2017, 128, 225–233. [Google Scholar] [CrossRef] [Green Version]
  44. Ding, Y.; Ezekoye, O.A.; Zhang, J.; Wang, C.; Lu, S. The effect of chemical reaction kinetic parameters on the bench-scale pyrolysis of lignocellulosic biomass. Fuel 2018, 232, 147–153. [Google Scholar] [CrossRef]
  45. Zhang, X.; Deng, H.; Hou, X.; Qiu, R.; Chen, Z. Pyrolytic behavior and kinetic of wood sawdust at isothermal and non-isothermal conditions. Renew. Energy 2019, 142, 284–294. [Google Scholar] [CrossRef]
  46. Dhyani, V.; Bhaskar, T. A comprehensive review on the pyrolysis of lignocellulosic biomass. Renew. Energy 2018, 129, 695–716. [Google Scholar] [CrossRef]
  47. Gu, X.; Ma, X.; Li, L.; Liu, C.; Cheng, K.; Li, Z. Pyrolysis of poplar wood sawdust by TG-FTIR and Py–GC/MS. J. Anal. Appl. Pyrolysis 2013, 102, 16–23. [Google Scholar] [CrossRef]
  48. Gogoi, M.; Konwar, K.; Bhuyan, N.; Borah, R.C.; Kalita, A.C.; Nath, H.P.; Saikia, N. Assessments of pyrolysis kinetics and mechanisms of biomass residues using thermogravimetry. Bioresour. Technol. Rep. 2018, 4, 40–49. [Google Scholar] [CrossRef]
  49. Caballero, A.; Conesa, J.A. Mathematical considerations for nonisothermal kinetics in thermal decomposition. J. Anal. Appl. Pyrolysis 2005, 73, 85–100. [Google Scholar] [CrossRef]
  50. Arenas, C.N.; Navarro, M.V.; Martínez, J.D. Pyrolysis kinetics of biomass wastes using isoconversional methods and the distributed activation energy model. Bioresour. Technol. 2019, 288, 121485. [Google Scholar] [CrossRef]
  51. Anca-Couce, A.; Berger, A.; Zobel, N. How to determine consistent biomass pyrolysis kinetics in a parallel reaction scheme. Fuel 2014, 123, 230–240. [Google Scholar] [CrossRef]
  52. Yang, J.; Chen, H.; Zhao, W.; Zhou, J. TG-FTIR-MS study of pyrolysis products evolving from peat. J. Anal. Appl. Pyrolysis 2016, 117, 296–309. [Google Scholar] [CrossRef]
  53. Naik, S.; Goud, V.V.; Rout, P.K.; Jacobson, K.; Dalai, A.K. Characterization of Canadian biomass for alternative renewable biofuel. Renew. Energy 2010, 35, 1624–1631. [Google Scholar] [CrossRef]
  54. Ministerio de Minas y Energía de Colombia. El Carbón Colombiano: Fuente de Energía para el Mundo; Ministerio de Minas y Energía de Colombia: Bogotá, Colombia, 2016. [Google Scholar]
  55. Demirbaş, A. Gaseous products from biomass by pyrolysis and gasification: Effects of catalyst on hydrogen yield. Energy Convers. Manag. 2002, 43, 897–909. [Google Scholar] [CrossRef]
  56. Wang, K.; Zhang, J.; Shanks, B.H.; Brown, R.C. The deleterious effect of inorganic salts on hydrocarbon yields from catalytic pyrolysis of lignocellulosic biomass and its mitigation. Appl. Energy 2015, 148, 115–120. [Google Scholar] [CrossRef]
  57. Yang, H.; Yan, R.; Chen, H.; Lee, D.H.; Zheng, C. Characteristics of hemicellulose, cellulose and lignin pyrolysis. Fuel 2007, 86, 1781–1788. [Google Scholar] [CrossRef]
  58. Carpio, R.B.; Zhang, Y.; Kuo, C.T.; Chen, W.T.; Schideman, L.C.; de Leon, R.L.; Charles, L.; Leon, R.L. De Characterization and thermal decomposition of demineralized wastewater algae biomass. Algal Res. 2019, 38, 101399. [Google Scholar] [CrossRef]
  59. Sebestyén, Z.; Barta-Rajnai, E.; Bozi, J.; Blazsó, M.; Jakab, E.; Miskolczi, N.; Czégény, Z. Thermo-catalytic Pyrolysis of biomass and plastic mixtures using HZSM-5. Appl. Energy 2017, 207, 114–122. [Google Scholar] [CrossRef] [Green Version]
  60. Fong, M.J.B.; Loy, A.C.M.; Chin, B.L.F.; Lam, M.K.; Yusup, S.; Jawad, Z.A. Catalytic pyrolysis of Chlorella vulgaris: Kinetic and thermodynamic analysis. Bioresour. Technol. 2019, 289, 121689. [Google Scholar] [CrossRef] [PubMed]
  61. Minh Loy, A.C.; Yusup, S.; Fui Chin, B.L.; Wai Gan, D.K.; Shahbaz, M.; Acda, M.N.; Unrean, P.; Rianawati, E. Comparative study of in-situ catalytic pyrolysis of rice husk for syngas production: Kinetics modelling and product gas analysis. J. Clean. Prod. 2018, 197, 1231–1243. [Google Scholar] [CrossRef]
  62. Long, Y.; Ruan, L.; Lv, X.; Lv, Y.; Su, J.; Wen, Y. TG-FTIR analysis of pyrolusite reduction by major biomass components. Chin. J. Chem. Eng. 2015, 23, 1691–1697. [Google Scholar] [CrossRef]
  63. Mehmood, M.A.; Ahmad, M.S.; Liu, Q.; Liu, C.G.; Tahir, M.H.; Aloqbi, A.A.; Tarbiah, N.I.; Alsufiani, H.M.; Gull, M. Helianthus tuberosus as a promising feedstock for bioenergy and chemicals appraised through pyrolysis, kinetics, and TG-FTIR-MS based study. Energy Convers. Manag. 2019, 194, 37–45. [Google Scholar] [CrossRef]
  64. Conesa, J.A.; Domene, A. Biomasses pyrolysis and combustion kinetics through n-th order parallel reactions. Thermochim. Acta 2011, 523, 176–181. [Google Scholar] [CrossRef] [Green Version]
  65. García, R.; Pizarro, C.; Lavín, A.G.; Bueno, J.L. Biomass proximate analysis using thermogravimetry. Bioresour. Technol. 2013, 139, 1–4. [Google Scholar] [CrossRef]
  66. Quiroga, E.; Moltó, J.; Conesa, J.A.; Valero, M.F.; Cobo, M. Data of Pyrolysis and Combustion of Sugarcane Residual Biomass over Rh-Pt/CeO2 -SiO2 Catalyst by tg, TG-FTIR and TG-MS. Mendeley Dataset. Available online: https://data.mendeley.com/datasets/gkysct9wjz/1 (accessed on 17 October 2019).
Figure 1. FTIR spectra of sugarcane residual biomass.
Catalysts 10 00508 g001
Figure 2. DTG curves during (a,b) pyrolysis (N2) and (c,d) combustion (synthetic air) of (a,c) biomass and (b,d) biomass/catalyst 1:1. Catalyst: Rh-Pt/CeO2-SiO2. Continuous lines for experimental data (Exp) and dashed lines for calculated data (Cal).
Catalysts 10 00508 g002
Figure 3. FTIR spectra obtained at the maximum decomposition rates during pyrolysis of (a) biomass and (b) biomass/catalyst 1:1 at 10 °C min−1. Catalyst: Rh-Pt/CeO2-SiO2.
Catalysts 10 00508 g003
Figure 4. FTIR spectra obtained at the maximum decomposition rates during combustion of (a) biomass and (b) biomass/catalyst 1:1 at 10 °C min−1. Catalyst: Rh-Pt/CeO2-SiO2.
Catalysts 10 00508 g004
Figure 5. Profiles of the ions m/z = 14, 15, 16, 17, 18, 28 and 44 by TG-MS at 30 °C min−1, during (a,b) pyrolysis and (c,d) combustion, for (a,c) biomass y (b,d) biomass/catalyst 1:1. Catalyst: Rh-Pt/CeO2-SiO2.
Catalysts 10 00508 g005
Figure 6. Profiles of the ions m/z = 2, 26, 27, 27, 29, 30, 39, 41 y 42 by TG-MS at 30 °C min−1, during (a,b) pyrolysis and (c,d) combustion, for (a,c) biomass y (b,d) biomass/catalyst 1:1. Catalyst: Rh-Pt/CeO2-SiO2.
Catalysts 10 00508 g006
Table 1. Characterization of the sugarcane residual biomass.
Moisture (as Received) [wt%]2
Elemental Analysis [wt%]
C50.0
H7.2
N0.9
SN.D
O (by difference) *33.7
Proximate Analysis [wt%]
Ashes 18.1
Volatile matter 182.8
Fixed carbon 19.1
Calorific Value [MJ kg−1]
HHVdb22.9
LHVdb21.3
ICP-MS [mg g−1]
Al3.30
K2.58
Fe2.52
Si1.07
Mg1.04
* Free of ashes. 1 Dry basis. N.D not detected.
Table 2. Assignment of the observed bands to the functional groups during the pyrolysis and combustion of sugarcane residual biomass [62,63].
SpeciesFunctional GroupWavenumber (cm−1)
CH4C–H2924, 1440
CO2C=O2361
COC–O2115
Aldehydes, ketones and acidsC=O1900–1600
Carboxylic acidsC=O1173
AromaticsC=C1640
Overtones of CO2C=O726–586
Hydroxyl groupO–H3900–3600
H2OO–H1509, 1757
Hydroxyl group of phenolic compoundsO–H1336, 1450
PhenolsC–O–H1223
Table 3. Relative proportion of key species with respect to non-catalytic pyrolysis.
SpeciesKey Ion Fragmentm/zNon-Catalytic PyrolysisCatalytic PyrolysisNon-Catalytic CombustionCatalytic Combustion
H2H2+21.02.40.50.6
MethaneCH3+151.00.61.81.5
CH4+161.00.816.621.2
WaterOH+171.00.62.62.2
H2O+181.00.52.31.9
COCO+281.01.23.62.3
C2+
Hydrocarbons
C2H2+261.00.72.21.3
C2H3+271.00.62.11.0
C3+HydrocarbonsC3H5+411.00.82.01.5
C3H6+421.00.83.12.8
C3H7+431.00.87.35.9
AldehydesCHO+291.00.93.41.7
FormaldehydeCH2O+301.00.911.18.7
CO2CO2+441.00.928.526.6
AlcoholsCH2OH+311.00.856.552.4
C2H5OH+461.01.014.113.1
Table 4. Kinetic parameters obtained for the catalytic and non-catalytic pyrolysis and combustion of sugarcane residual biomass.
ComponentKinetic ParameterNon-catalytic PyrolysisCatalytic PyrolysisNon-catalytic CombustionCatalytic Combustion
1Tmax243243238238
ki0 [s−1]2 × 10121 × 1093 × 10135 × 1011
Ei [kJ·mol−1]133.6104.2144.2127.5
ni1.00.81.31.3
ci00.180.170.240.26
2Tmax338327343322
ki0 [s−1]4 × 1087 × 1047 × 1071 × 1010
Ei [kJ·mol−1]108.975.1110.0130.3
ni4.34.62.93.0
ci00.280.480.490.53
3Tmax375369468432
ki0 [s−1]5 × 1074 × 1092 × 10135 × 109
Ei [kJ·mol−1]120.2141.7210.5156.6
ni3.02.61.20.9
ci00.360.180.210.13
Cinert00.180.180.070.07
VC3.4%1.1%2.7%1.3%

