Article

A Dialysis Photocatalytic Reactor for the Green Production of Vanillin

by
Giovanni Camera-Roda
1,*,
Francesco Parrino
2,
Vittorio Loddo
3 and
Leonardo Palmisano
3
1
Department of Civil, Chemical, Environmental, and Materials Engineering, University of Bologna, via Terracini 28, 40131 Bologna, Italy
2
Dipartimento di Ingegneria industriale, University of Trento, Via Sommarive 9, 38123 Trento, Italy
3
Dipartimento di Ingegneria, University of Palermo, Viale delle Scienze Ed. 6, 90128 Palermo, Italy
*
Author to whom correspondence should be addressed.
Catalysts 2020, 10(3), 326; https://doi.org/10.3390/catal10030326
Submission received: 30 January 2020 / Revised: 11 March 2020 / Accepted: 12 March 2020 / Published: 14 March 2020
(This article belongs to the Special Issue Photocatalytic Membrane Reactors)

Abstract

:
In the present work, dialysis was used to recover vanillin while being produced by partial photocatalytic oxidation of ferulic acid in an aqueous solution at ambient temperature. The relatively high value of the permeate flux through a dense polyether-block amide membrane allowed continuously extracting vanillin from the reacting solution, thus avoiding its successive oxidation. The rate of vanillin formation was improved, compared to other reactor configurations, because intermediate compounds permeated from the reacting solution and did not hinder the reaction, while ferulic acid permeated in the opposite direction to partially replenish the reactor with the substrate. The photocatalytic membrane reactor obtained by the effective coupling of dialysis with the photocatalytic reaction improved the production yield. For instance, with the utilized experimental set up, the total amount of vanillin produced after 5 h in the membrane reactor was more than one-third higher than in the photocatalytic reactor without dialysis. The results obtained with a mathematical model agree with the experimentally observed behavior. The model allowed estimating vanillin diffusivity in the membrane and showed that concentration polarization might limit the process.

1. Introduction

The utilization of vanillin as a flavoring in foodstuff, cosmetics, pharmaceutical, and nutraceutical products is so widespread that the natural product can satisfy less than 1% of the worldwide demand, while vanillin is mainly produced from petrochemical precursors or from lignin, which is present in the waste stream of pulp and paper firms. Even though there is little room to increase the natural production, under the push of a more sensitive market, industry brands are moving towards more “natural” or green products [1,2].
Therefore, alternative routes of production have been explored [2,3,4], which, although more expensive than the conventional routes of chemical synthesis (but more economical than the natural one), are able to meet consumer expectations for eco-friendly products and sustainable processes. Thanks to the very high flavor perception of vanillin, only small amounts of vanillin are added to the final product, whose price is marginally affected by the cost of vanillin, so that industry could afford the higher cost of a “greener” vanillin. Most of the proposed alternative green routes have common problems: the formed vanillin inhibits the rate of its production and vanillin is further degraded in the reaction environment.
These negative phenomena cause low production yields, but their effects can be minimized if vanillin is recovered directly from the (bio)reactor. Thus, in parallel with the studies on green processes to synthesize vanillin, the problem of recovering vanillin from the reacting solution has attracted attention and has been faced through different solutions [5,6,7,8,9,10]. In view of the previously cited effects of the presence of vanillin in the reacting solution, it is obvious that it is useless to separate vanillin with a post-process after its production. On the contrary, vanillin must be recovered during its formation in an “integrated process” where separation acts simultaneously with reaction.
This implies that the operating conditions of the separation process must be compatible with the reaction. Liquid–liquid extraction and distillation, often used to post purify vanillin, do not satisfy this requirement and their integration with the reaction may be complex. Therefore, the attention is focused mainly on membrane separation processes that can be more easily coupled with these reactions and are generally considered to be more environment-friendly. In particular, non-pressure driven membrane processes are promising because, contrary to pressure-driven membrane processes, some of them are able to selectively permeate organic compounds such as vanillin [10]. Pervaporation [5,6,7,8] and membrane contactors [9] have been identified as viable membrane processes. Membrane contactors need a solvent to extract vanillin, and then vanillin can be separated from the solvent by further liquid–liquid extraction with acidic water. This process is complicated by the presence of the solvent and by the necessity of recovering it. In pervaporation, no solvent is needed because the same membrane acts as the solvent, and in practice vanillin is continuously recovered by the evaporation of the permeate downstream of the membrane. Pervaporation shows high selectivity towards vanillin, thus enhancing the reaction selectivity, and very satisfactory retention of the substrate (ferulic acid), thus improving the conversion. Ultimately, both properties increase the production yield. However, the permeate flux is low mainly due to the low volatility of vanillin, as Camera-Roda et al. demonstrated [8], and this is particularly true at the relatively low temperatures required in the biotechnological production of vanillin. In practice, pervaporation infers that the permeate is evaporated and the low value of the flux makes necessary a large membrane area to get the permeate flow rate, which is needed to recover a satisfactory fraction of the produced vanillin.
On the contrary, volatility becomes unimportant if the permeate does not evaporate. Therefore, in the present work, dialysis, a process where both the retentate and the permeate are liquid phases, was studied for the recovery of the vanillin produced by the photocatalytic partial oxidation of ferulic acid. A few results on the dialysis process with the permeation of vanillin in aqueous solution were presented in a previous preliminary work [11]. The present study offers a deeper analysis of the membrane process with emphasis on the mechanisms which control the yield of the membrane reactor. It is worth noting that the results of this study can be extended to the biotechnological production of vanillin because they have in common the necessity to operate a recovery of the vanillin. The same polymeric membranes studied in pervaporation were adopted for dialysis because they are characterized by a high vanillin permeability, thanks to the favorable values of vanillin solubility and diffusivity.

2. Results and Discussion

2.1. Photocatalytic Experiments

The amount of reacted ferulic acid (FA) in a run of photocatalytic oxidation of ferulic acid without dialysis is shown in Figure 1.
The slope of the curve in Figure 1 indicates that, at short times, when the presence of the products is still negligible, the rate of disappearance of ferulic acid is higher than the rate which is observed later. However, the observed decrease of the rate with time cannot be justified solely by the diminution of the substrate concentration. In fact, an important role is played by the products of the oxidation of ferulic acid (the same vanillin and the other intermediates), whose action is to competitively utilize the active sites and the photogenerated oxidizing agents [12], thus slowing down the oxidation of ferulic acid and the production of vanillin.
Vanillin is the most important intermediate, which is produced by the photocatalytic partial oxidation of ferulic acid. The amount of vanillin in the reacting solution vs. time is illustrated in Figure 2.
The slope of the curve in Figure 2 at longer times decreases, mainly because vanillin can be further oxidized to vanillic acid [3] if it remains in the reacting solution. Essentially, its concentration presents the typical behavior of an intermediate product of reactions in series [3] with the presence of a maximum at an optimal reaction time, which is not yet reached in the experiment shown in Figure 2.

2.2. Dialysis Experiments

In this section, the experimental results of dialysis without photocatalysis are analyzed in view of the utilization of the PEBAX membranes in the photocatalytic membrane reactor.
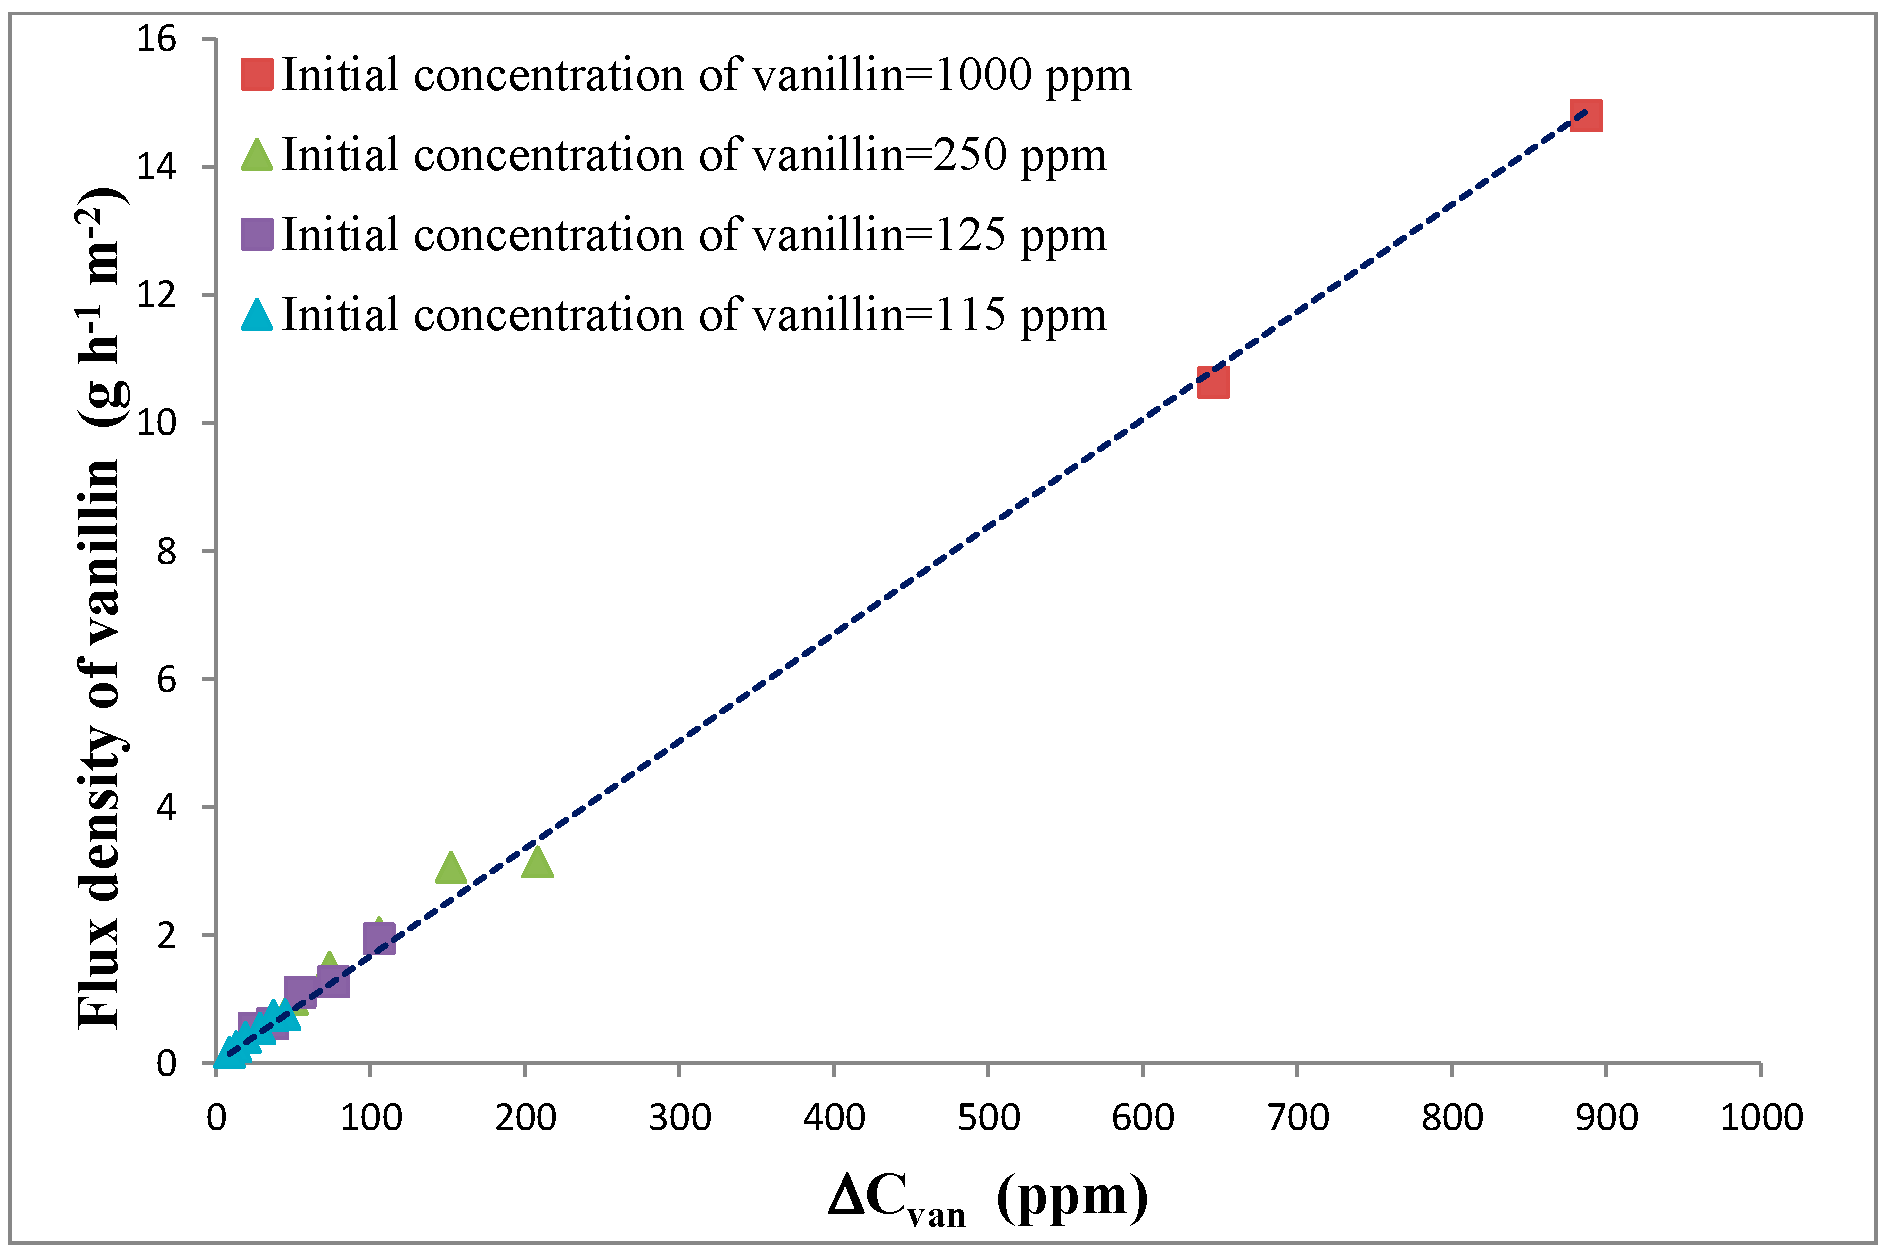
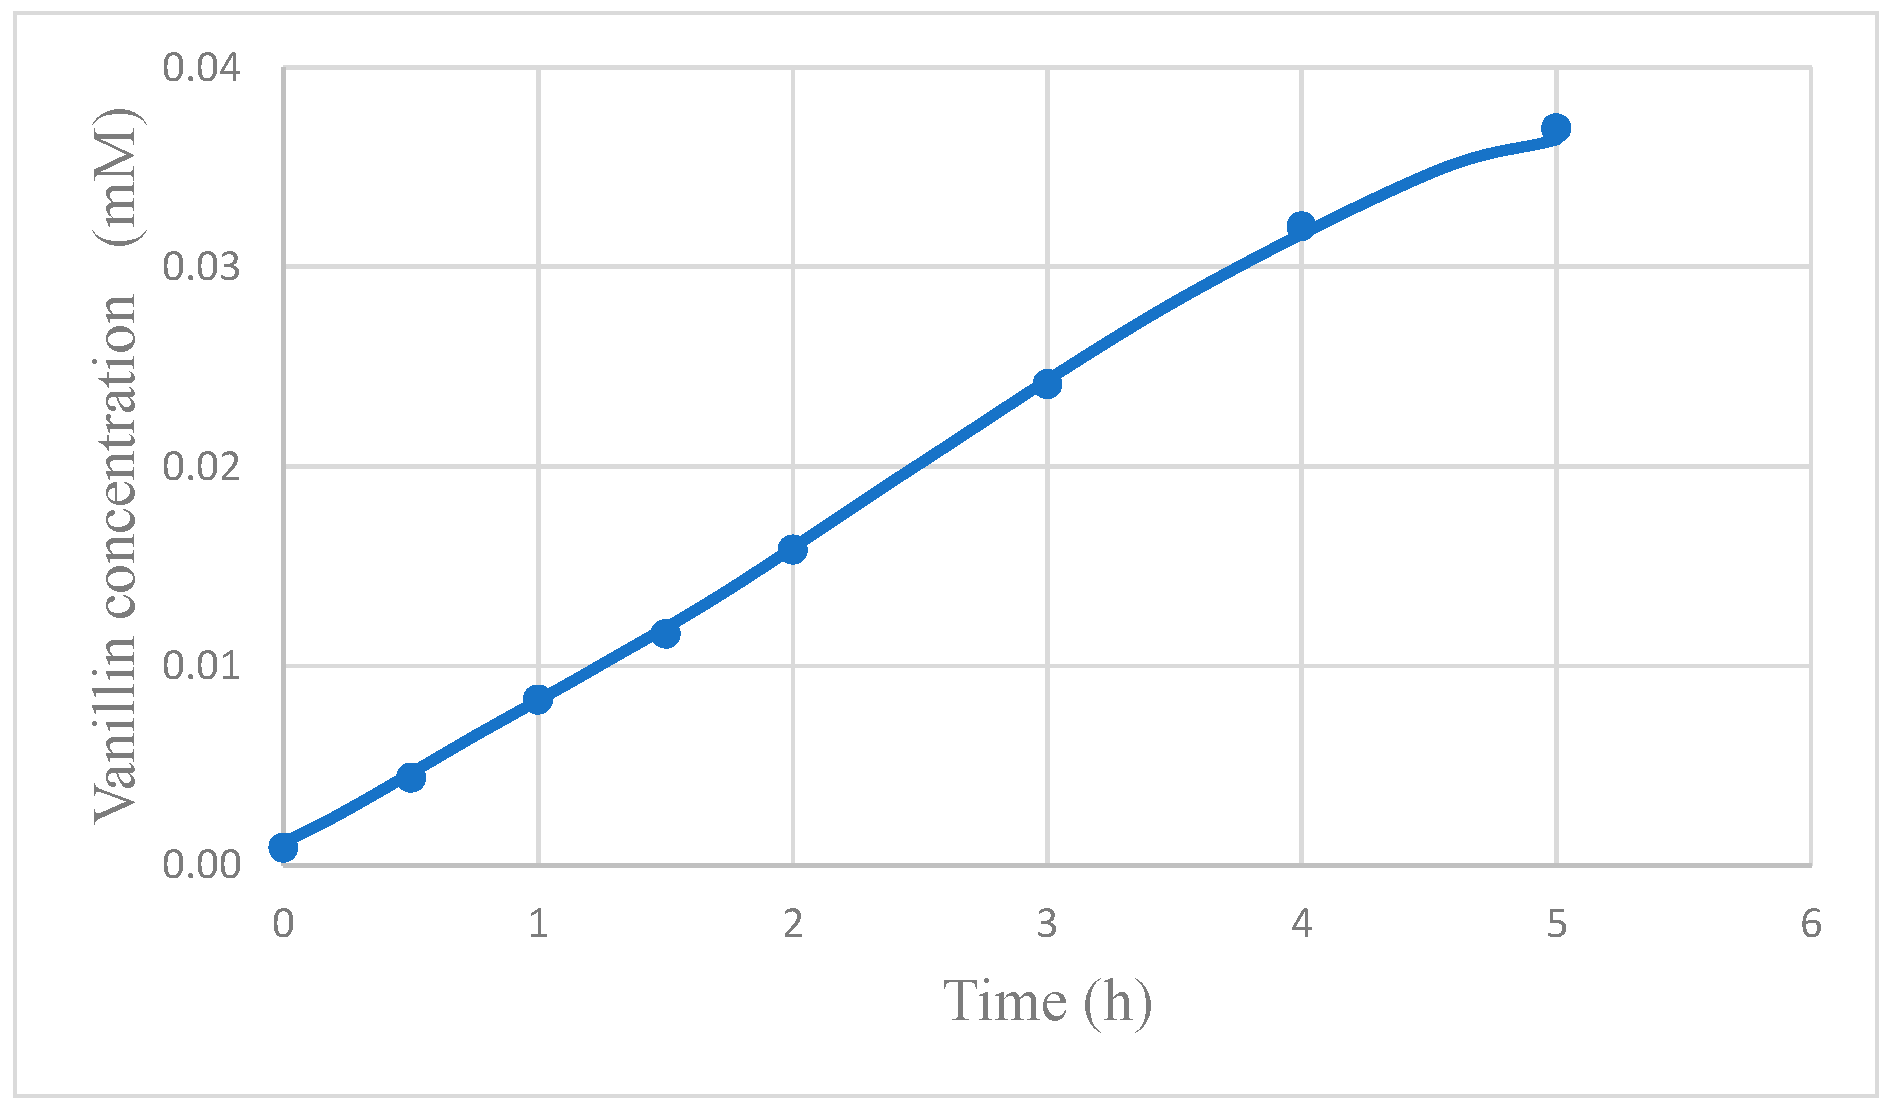
The difference between the chemical potential of vanillin between the two phases at the opposite side of the membrane (Liquid 1, upstream, and Liquid 2, downstream) is the driving force for permeation. The concentration of vanillin in the tested solutions is relatively low and the value of the activity coefficient even at the highest tested concentration (about 1000 ppm) is close to the one at infinite dilution. In fact, according to the NRTL model with the values of the intervening parameters reported by De Albuquerque and Mazzotti [13], the activity coefficient of vanillin in aqueous solution is about 131 at 1000 ppm and 132 at 1 ppm. Consequently, the driving force is directly proportional to the difference of the vanillin concentration (ΔCvan = C1,van−C2,van), as confirmed by the experimental results shown in Figure 3.
Even if vanillin permeates just by diffusion through a non-porous membrane and concentration polarization (as discussed below) affects the rate of permeation, the flux is more than 10 times higher than the one obtained at the same concentration and temperature in pervaporation. For the sake of comparison, in pervaporation, the vanillin flux density is about 1.1 g/(m2 h) (pervaporation at 60 °C with Cvan,upstream the membrane =1000 ppm, Ppermeate =2 mbar), whereas, in dialysis, it is 15 g/(m2 h) (ΔCvan ≈ 1000 ppm, operating conditions in the Figure 4 description). Moreover, in dialysis, the flux does not change significantly in the temperature range from 20 to 60 °C, whereas, in pervaporation, the flux is approximately halved every 10 °C decrease of the temperature. The possibility of operating with a higher flux allows for a substantial decrease in the membrane area required to obtain the desired recovery of vanillin. Moreover, the flux remains high even at ambient temperature and dialysis can also be utilized effectively in bioreactors. The permeation of water is irrelevant because the solutions are so diluted that the driving force for water permeation is negligible.
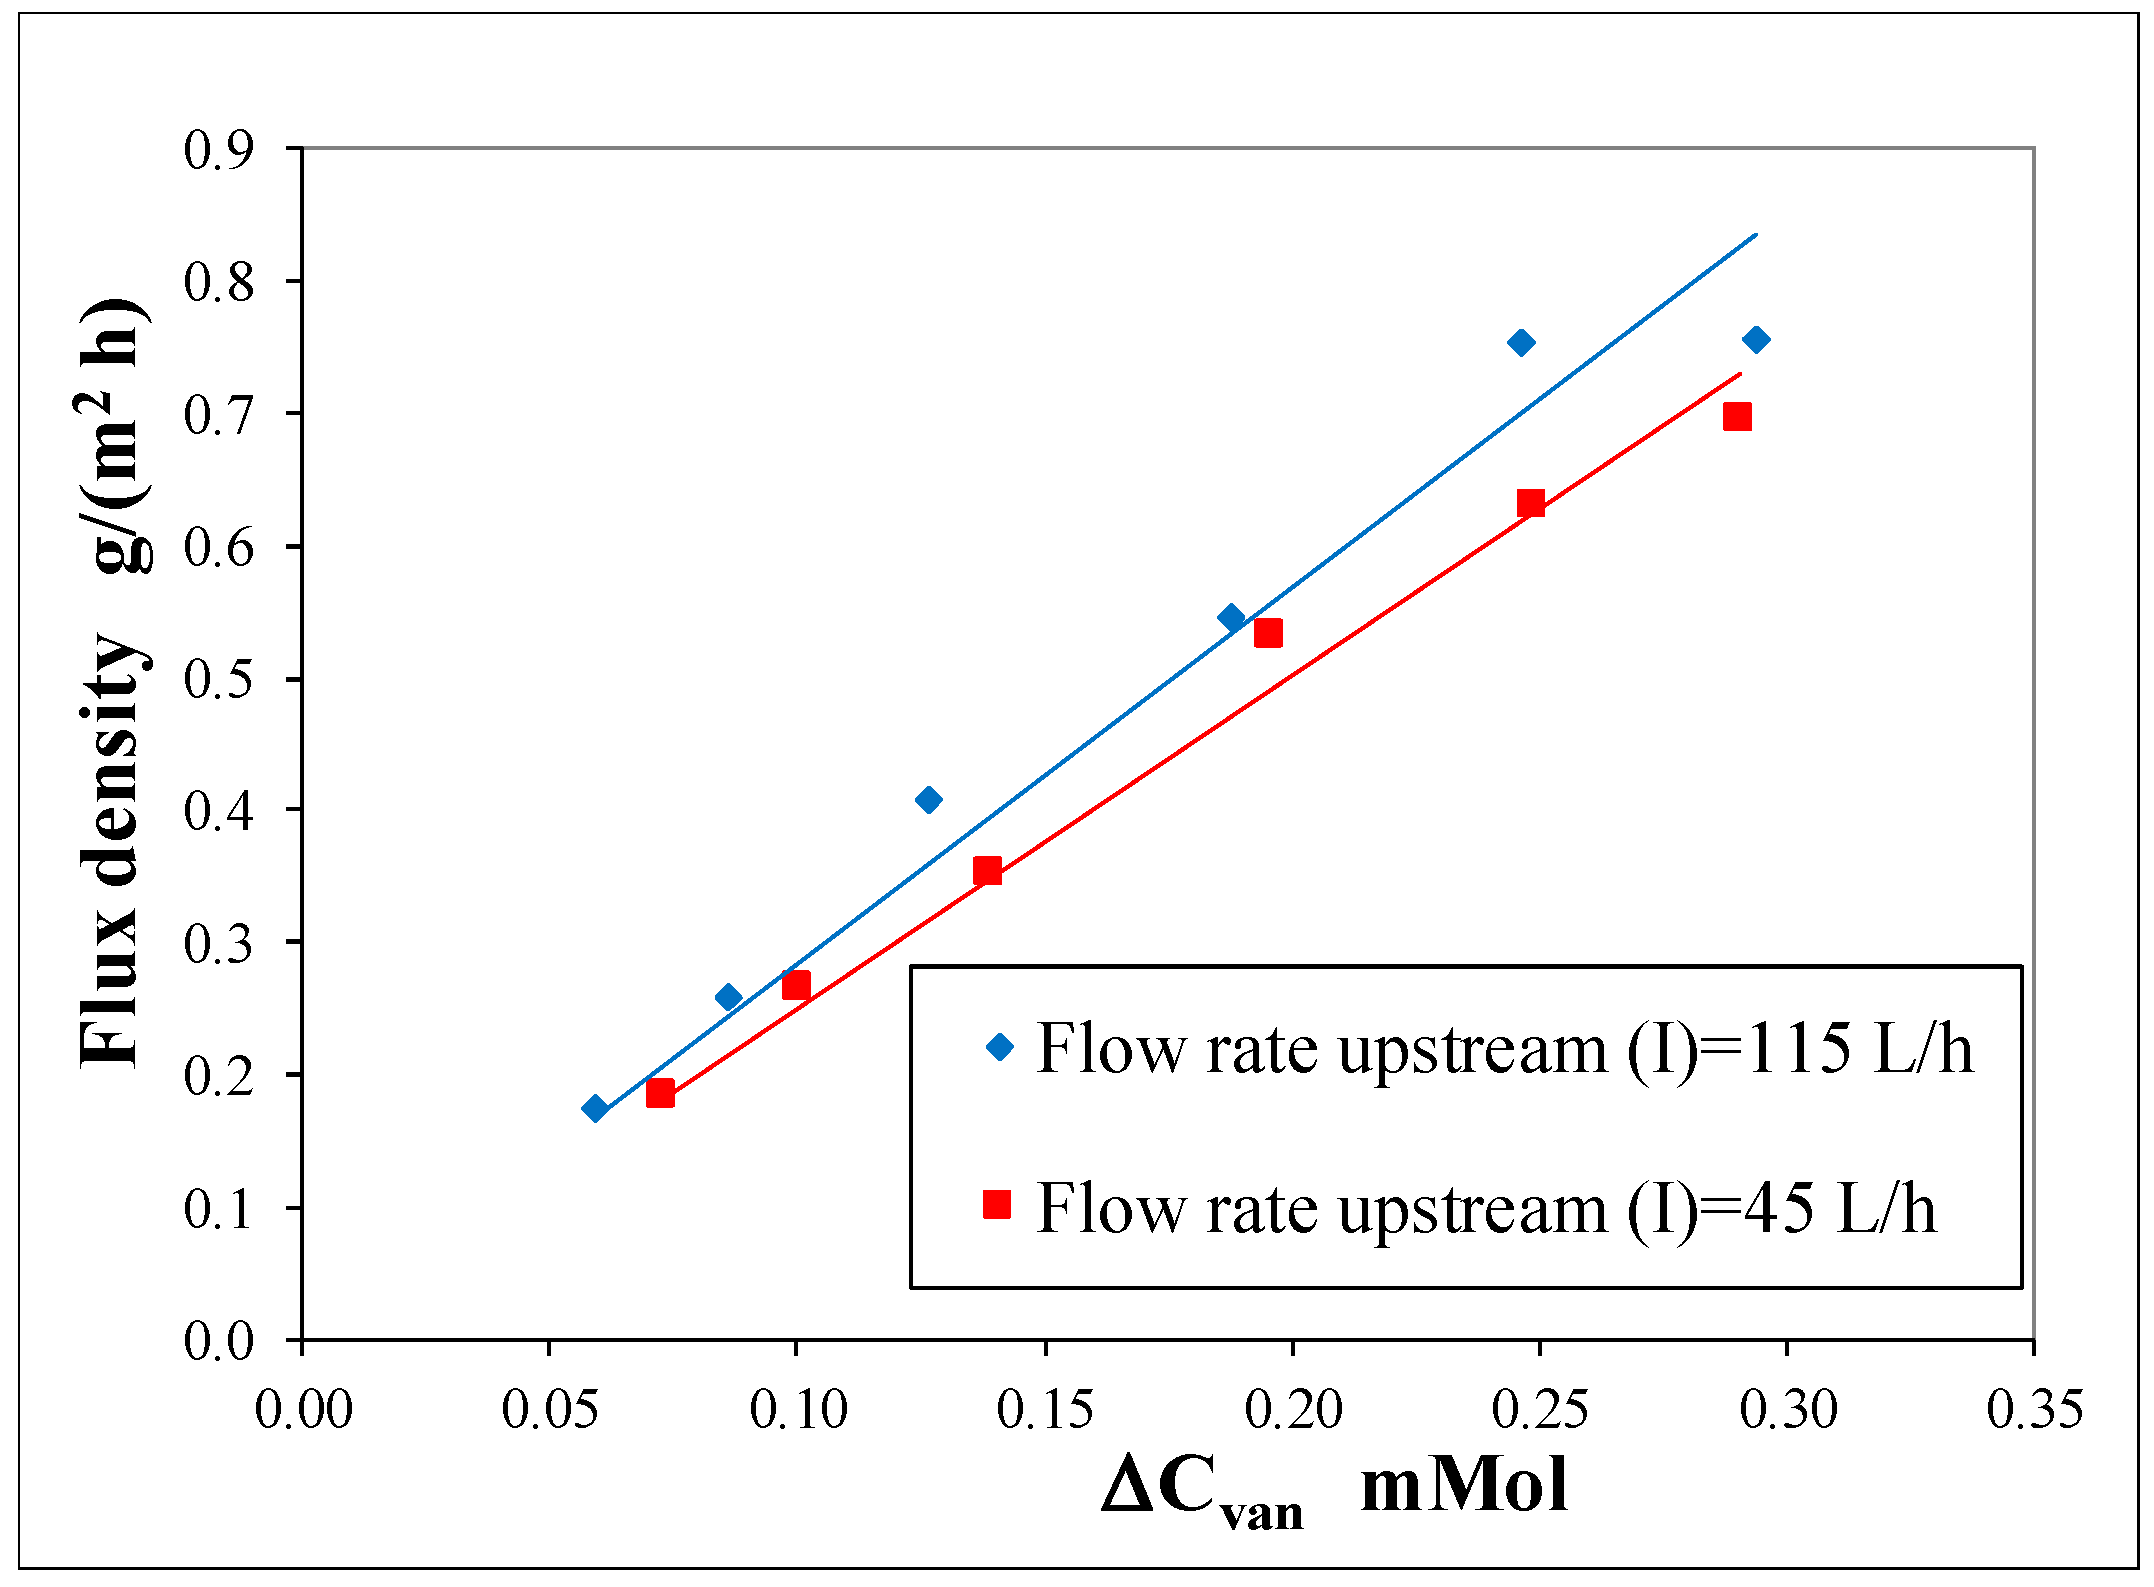
Figure 4 shows that the flux density is also affected by the flow rate of the fluid passing through the module. This outcome reveals that concentration polarization cannot be neglected. At higher flow rates, the flux density of vanillin increases because the mass transfer of vanillin from the bulk of Liquid 1 to the surface of the membrane is favored by the higher tangential velocity of the fluid and concentration polarization diminishes.
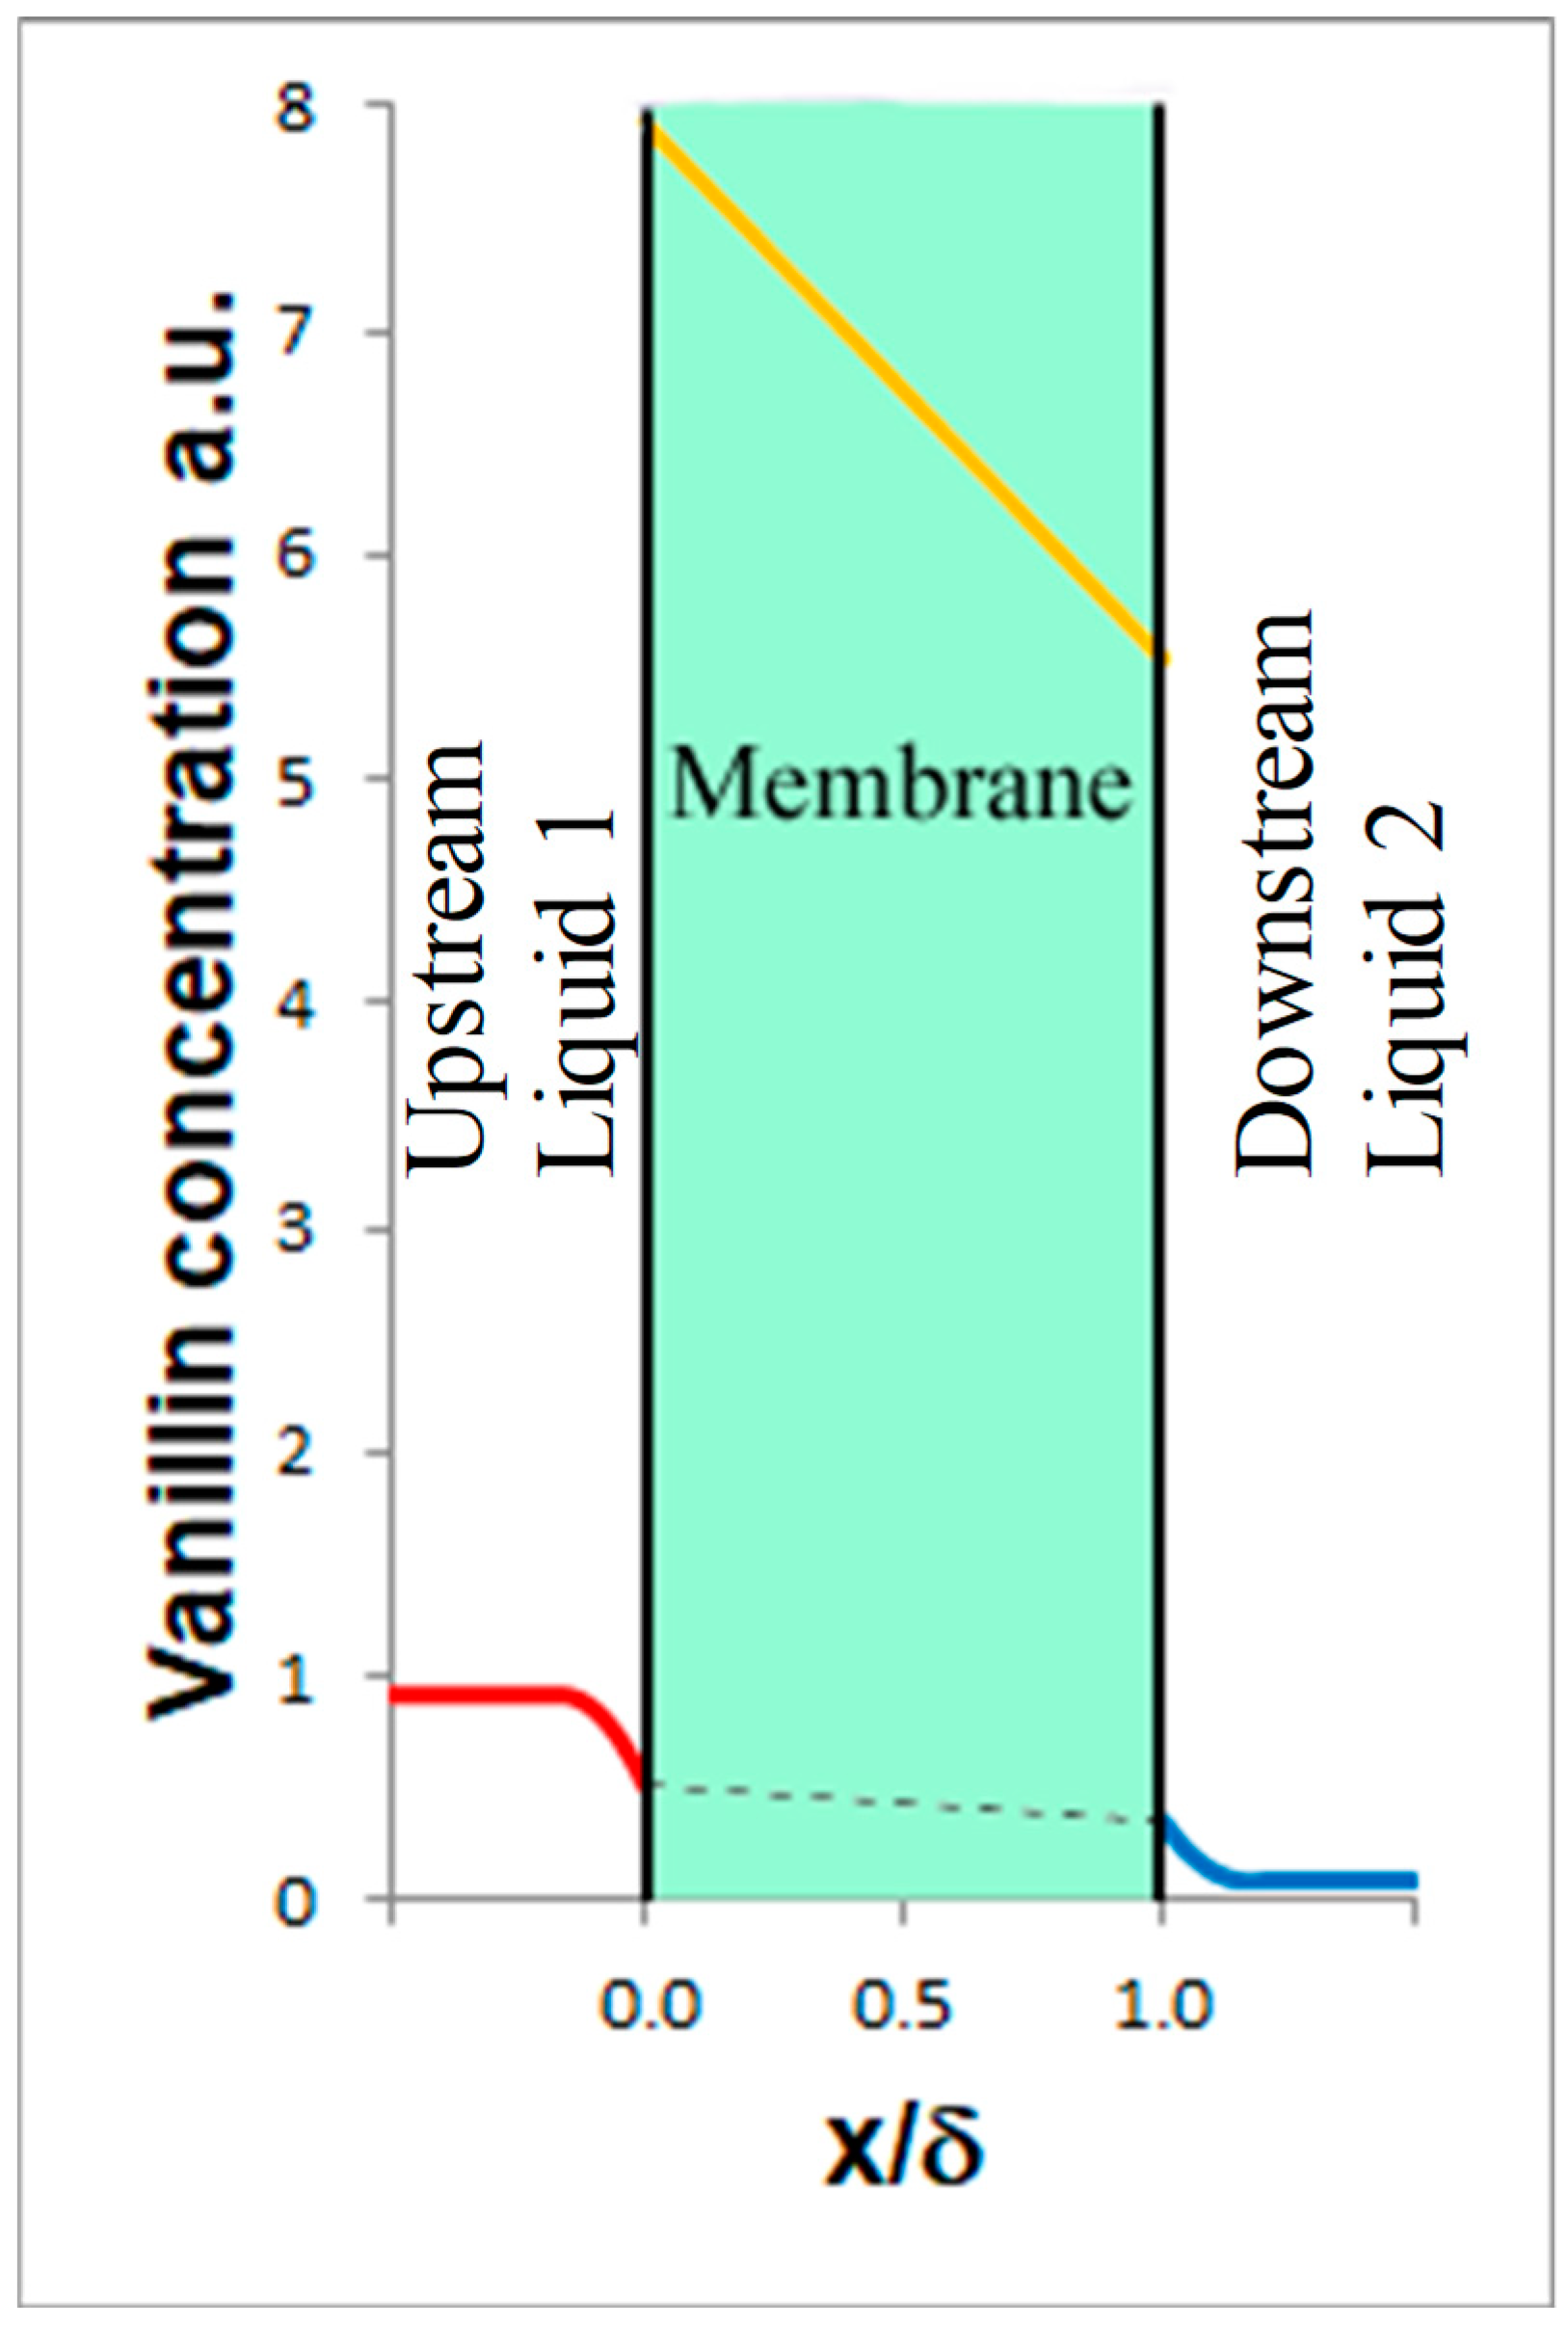
To get a better understanding of concentration polarization and of the phenomena which take place in dialysis, the transient behavior of vanillin permeation was experimentally studied by varying the initial concentration of vanillin and the upstream flow rate. The results were analyzed through a mathematical model, which is substantially based on a solution–diffusion mechanism.
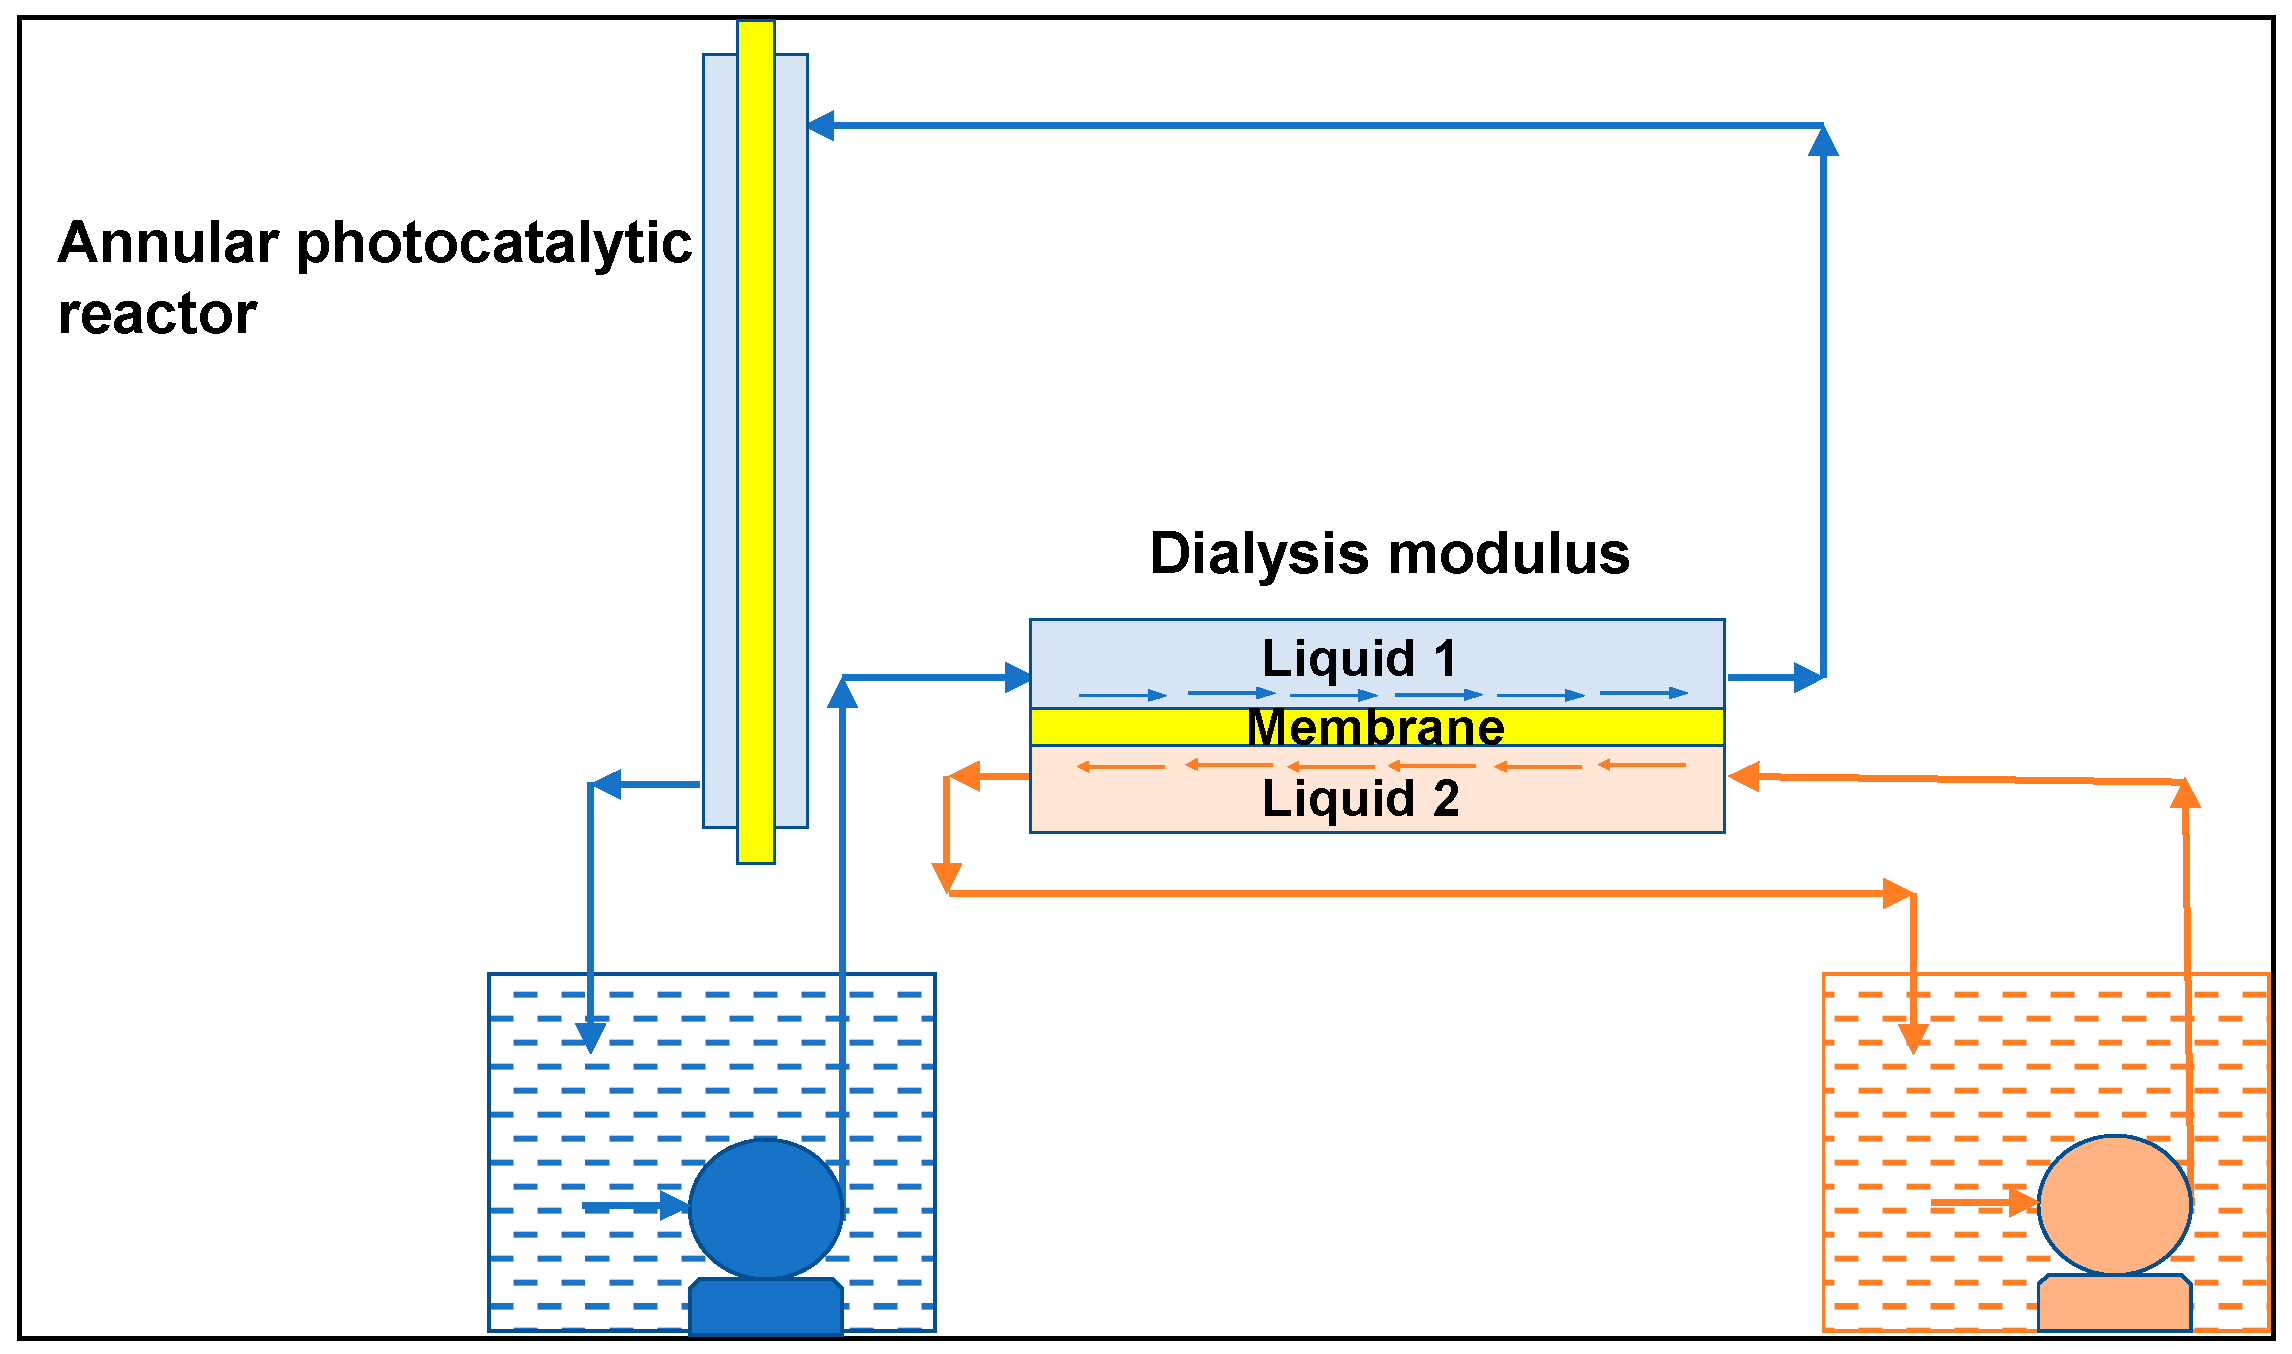
Referring to Figure 5, which schematically shows the system comprising the upstream Liquid 1, the membrane, and the downstream Liquid 2, the model takes into account (see also [11]):
• Mass transport upstream of the membrane (Liquid 1):
d C 1 d t = A m V 1 k 1 [ C 1 C 1 | x = 0 ] , where C 1 is the vanillin concentration in the bulk of Liquid 1, t is the time, A m is the membrane area, V 1 the volume of Liquid 1, k 1 is the mass transfer coefficient of vanillin in Liquid 1, and C 1 | x = 0 is the vanillin concentration at x = 0 in Liquid 1.
• Equilibrium at the interface between Liquid 1 and the membrane:
C m | x = 0 = K van C 1 | x = 0 , where K van is the partition coefficient with C m | x = 0 the vanillin concentration in the membrane at x = 0.
• Mass transport inside the membrane:
C m t x [ D 0 exp ( g C m ) C m x ] = 0 , where C m ( x , t ) is the vanillin concentration in the membrane, g is the so-called plasticization coefficient, and D 0 is the diffusion coefficient of vanillin in the membrane for C m →0.
• Equilibrium at the interface between the membrane and Liquid 2:
C m | x = δ = K van C 2 | x = δ where C m | x = δ is the vanillin concentration in the membrane at x = δ and C 2 | x = δ is the vanillin concentration in Liquid 2 at x = δ.
• Mass transport downstream of the membrane (Liquid 2):
d C 2 d t = A m V 2 k 2 [ C 2 | x = δ C 2 ] where C 2 is the vanillin concentration in the bulk of Liquid 2, V 2 is the volume of Liquid 2, and k 2 is the mass transfer coefficient of vanillin in Liquid 2.
The mass transfer coefficients k1 and k2 in Liquids 1 and 2 were predicted by the following well-known analogy:
Sh = 1.62 ( Re × Sc × D h L ) 1 / 3 , with Sh = k D h D the Sherwood number, Re = v m D h ν the Reynolds number, Sc = ν D the Schmidt number, Dh the hydraulic diameter, L the length of the channel, D the vanillin diffusivity in the aqueous solution, ν the kinematic viscosity of the solution, and vm the average velocity.
To evaluate the partition coefficients ( K van = C van | membrane C van | liquid   phase ), experiments on the adsorption in the membrane were carried out until reaching equilibrium. The partition coefficient of vanillin resulted to be Kvan = 21.3 and 15.1 at 30 and 60 °C, respectively. In an analogous way, the partition coefficient of ferulic acid at 30 °C was found to be 29.9.
The equations of the model were solved numerically by the volume control method with a Crank–Nicolson time integration scheme with the initial conditions, at t = 0, C 1 = C 0 , C 1 | x = 0 = 0 , C m = 0 (at 0 ≤ x ≤ δ), C 2 | x = δ = 0 , and C 2 = 0 , where C 0 is the initial concentration of vanillin in Liquid 1. In this way, the trends over time of all the unknown concentrations were evaluated.
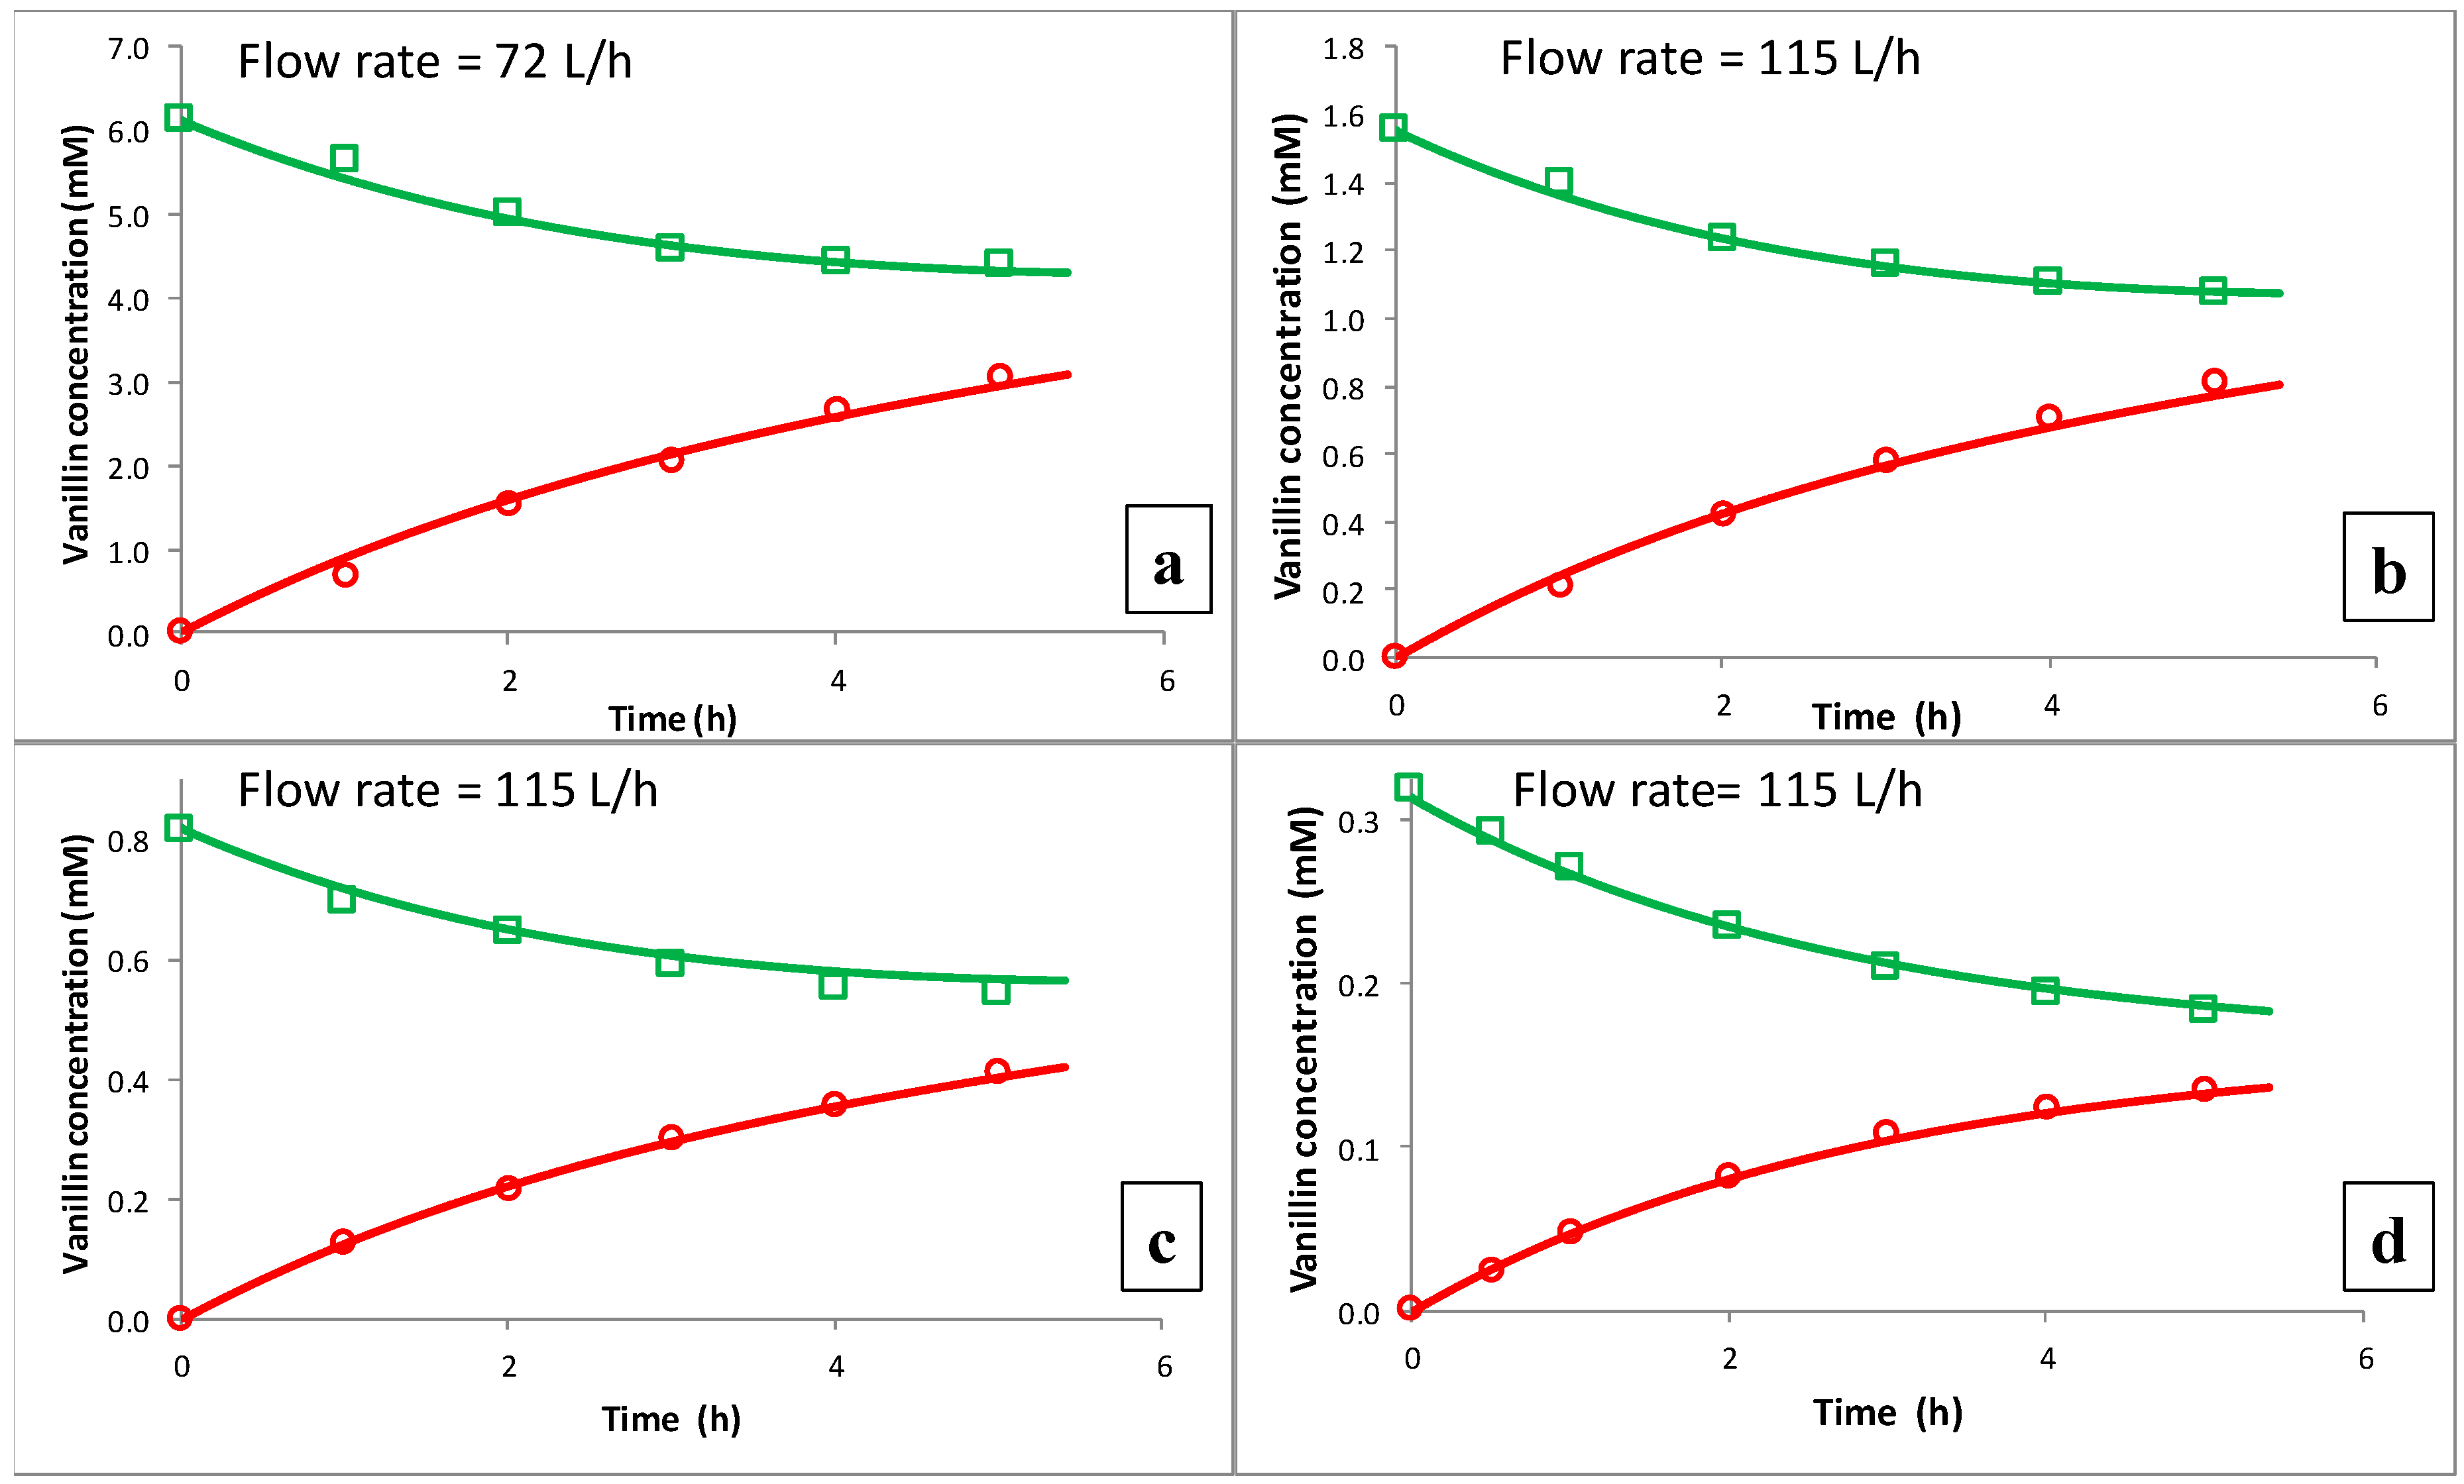
The experimental data, obtained from several dialysis experiments carried out at different initial concentrations of vanillin in Liquid 1 and different flow rates through the module, were used to validate the mathematical model. All parameters were independently measured, taken from the literature, or evaluated by established relationships (as the previously presented analogy for the mass transfer coefficients). The only exceptions were the vanillin diffusivity in the membrane and the correlated plasticization coefficient, which were estimated by a least squares non-linear fitting procedure. The best fit (see Figure 6) was obtained with D 0 = 9 × 10⁻¹¹ m2/s and g = 0. The high values of both the diffusivity and the partition coefficient contribute to the high permeability of vanillin through the membrane.
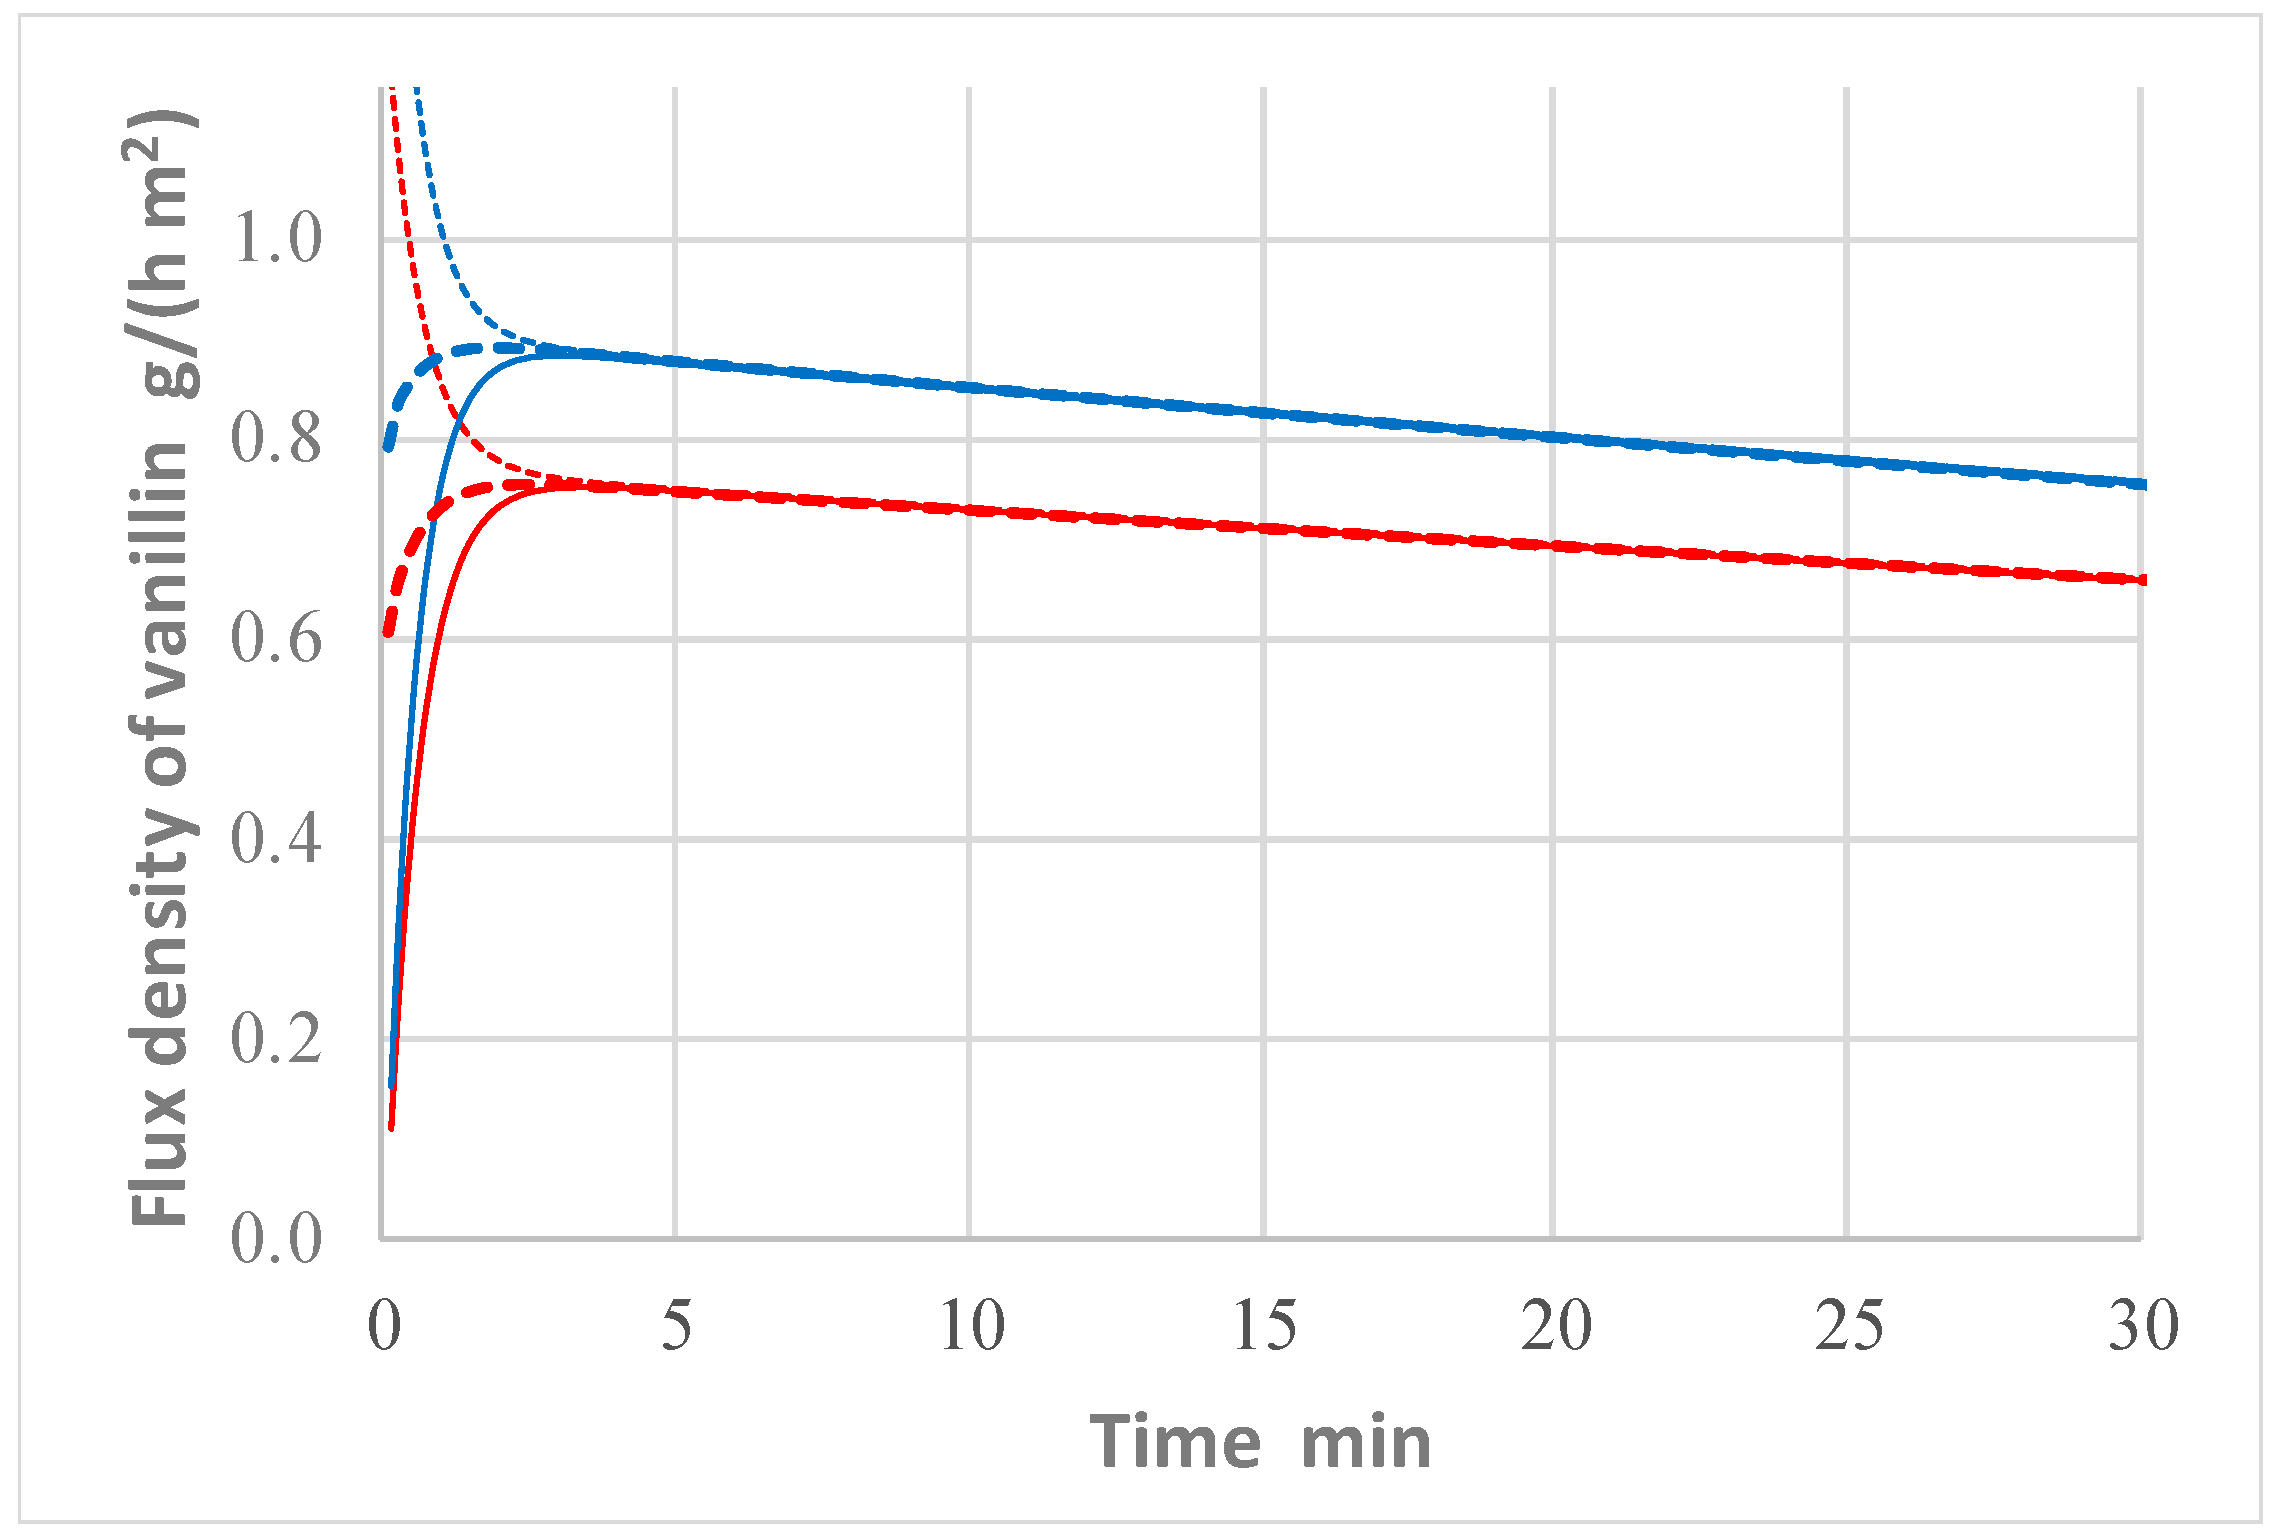
The model reveals that, after a relatively short initial period (less than 5 min), the system approaches a pseudo-steady-state condition, which is characterized, at a given time, by the same value, J, for the flux of vanillin upstream of the membrane, at any cross section inside the membrane and downstream of the membrane. This phenomenon is apparent in Figure 7, which reports the flux density of vanillin, calculated by the model, upstream of the membrane, in the middle of the membrane (at x = δ/2), and downstream of the membrane vs. time in two cases, which simulate two experiments carried out with the same initial concentration of vanillin, but different flow rates of Liquid 1.
When the pseudo-steady state is reached, the following equalities hold:
J = C 1 C 1 | x = 0 R upstream = C 1 | x = 0 C 2 | x = δ R membrane = C 2 | x = δ C 2 R downstream = C 1 C 2 R total , where Rupstream, Rmembrane, and Rdownstream indicate the resistances to vanillin mass transfer upstream, through, and downstream of the membrane, respectively, and Rtotal is the total resistance ( R total = R upstream + R membrane + R downstream ). It follows that:
R upstream R total = C 1 C 1 | x = 0 C 1 C 2 ; R membrane R total = C 1 | x = 0 C 2 | x = δ C 1 C 2 ; and R downstream R total = C 2 | x = δ C 2 C 1 C 2 . Alternatively, the resistance to mass transfer at pseudo-steady state can be evaluated directly from the mass transport equations as:
R upstream = 1 k 1 ; R membrane = δ D 0 K van (valid only if g = 0, as in the present case); and R downstream = 1 k 2 .
Therefore, it is possible to use the values of the concentrations ( C 1 , C 1 | x = 0 , C 2 | x = δ , C 2 ) calculated by the model to estimate the ratios of the various resistances to the total resistance. Some values of these ratios are also reported in [11]. Notably, R membrane turns out to be just a small fraction of the total resistance. For instance, when the flow rate of Liquid 1 is 45 L/h, R membrane is just 16% of the total resistance. It is clear that concentration polarization upstream and downstream of the membrane controls the permeation. It is rather surprising that, even if the membrane is non-porous and relatively thick (45 µm) and permeation takes place only due to a diffusion mechanism, membrane resistance is minor. Contrary to pervaporation, concentration polarization can limit the rate of permeation because of the much higher permeate flux. Therefore, there is extensive room for improvement of vanillin flux simply by designing the module for a high tangential velocity to limit concentration polarization. It is worth observing that the flow was laminar in all presented experiments. In fact, for Liquid 2 it is Re = 1070 (flow rate = 75 L/h), while for Liquid 1 it is Re = 620 (flow rate = 45 L/h) and Re = 1600 (flow rate = 115 L/h). Besides, in the operating conditions indicated in the Figure 7 description, the permeate flow rate of vanillin increases by about 15% simply by augmenting the flow rate of Liquid 1 through the module from 45 to 115 L/h.

2.3. Membrane Reactor, MR (Dialysis Integrated with Photocatalysis)

Camera-Roda et al. [8] established that the main reason for the high retention of ferulic acid (FA) observed in pervaporation is not the dissociation of FA, as hypothesized by Brazinha et al. [6], but rather the low volatility of FA, whose evaporation is negligible in the permeate even at the very low permeate pressure and relatively high temperature utilized in pervaporation. Given the similar molecular structure, it is expected that the solubility and diffusivity of FA in the membrane are analogous to those of vanillin. This implies that, in dialysis, without the evaporative step, FA can also permeate relatively easily through the membrane. The same may hold for most of the other organic intermediate compounds that are produced. These suppositions were confirmed in dialysis experiments. Therefore, in dialysis, it becomes possible to feed the substrate to the reactor by permeating it from the opposite side of the membrane as long as it is consumed by the reaction. In this way, the concentration of FA and, consequently, the rate of reaction can be maintained higher in the reactor, thus enhancing the production. Given these considerations, experimental runs with the MR were carried out with the same initial concentration of FA (1 mM) in both the aqueous solutions at the two opposite sides of the membrane. In fact, if FA is initially present in Liquid 2, this latter acts as a substrate reservoir for the replenishment of the FA consumed by the reaction [14]. Table 1 reports the values of the concentration of the main organic compounds after 5 h of reaction on the two sides (reactor and the opposite side) of the membrane.
The values in Table 1 demonstrate that all organic compounds produced by the reaction permeate. The presence of cis-ferulic acid is due to the UVA illumination in the reactor, which transforms trans-FA into cis-FA [3]. This latter permeates to Liquid 2 along with all the intermediate organic compounds. Trans-ferulic acid permeates from Liquid 2 to the reactor, because in the reactor TFA disappears due to the reaction, so that the concentration of TFA is higher in Liquid 2.
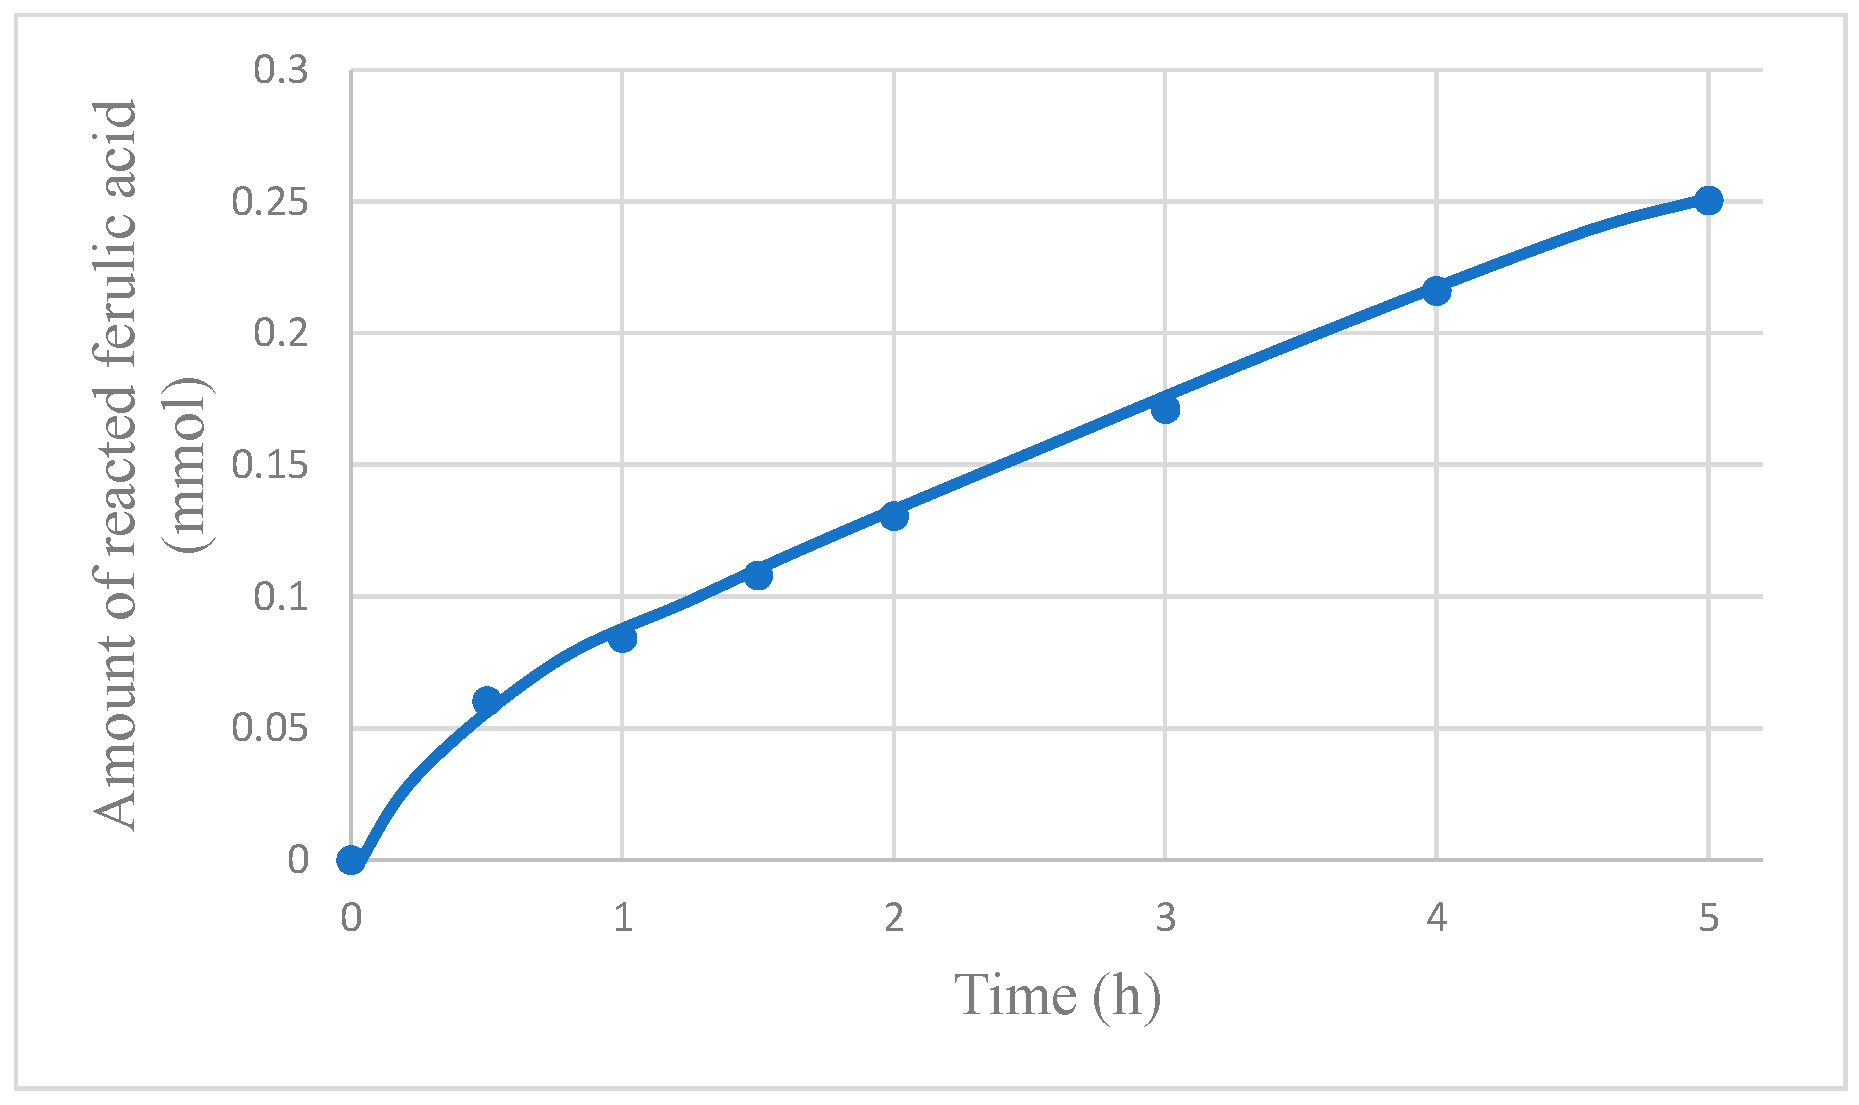
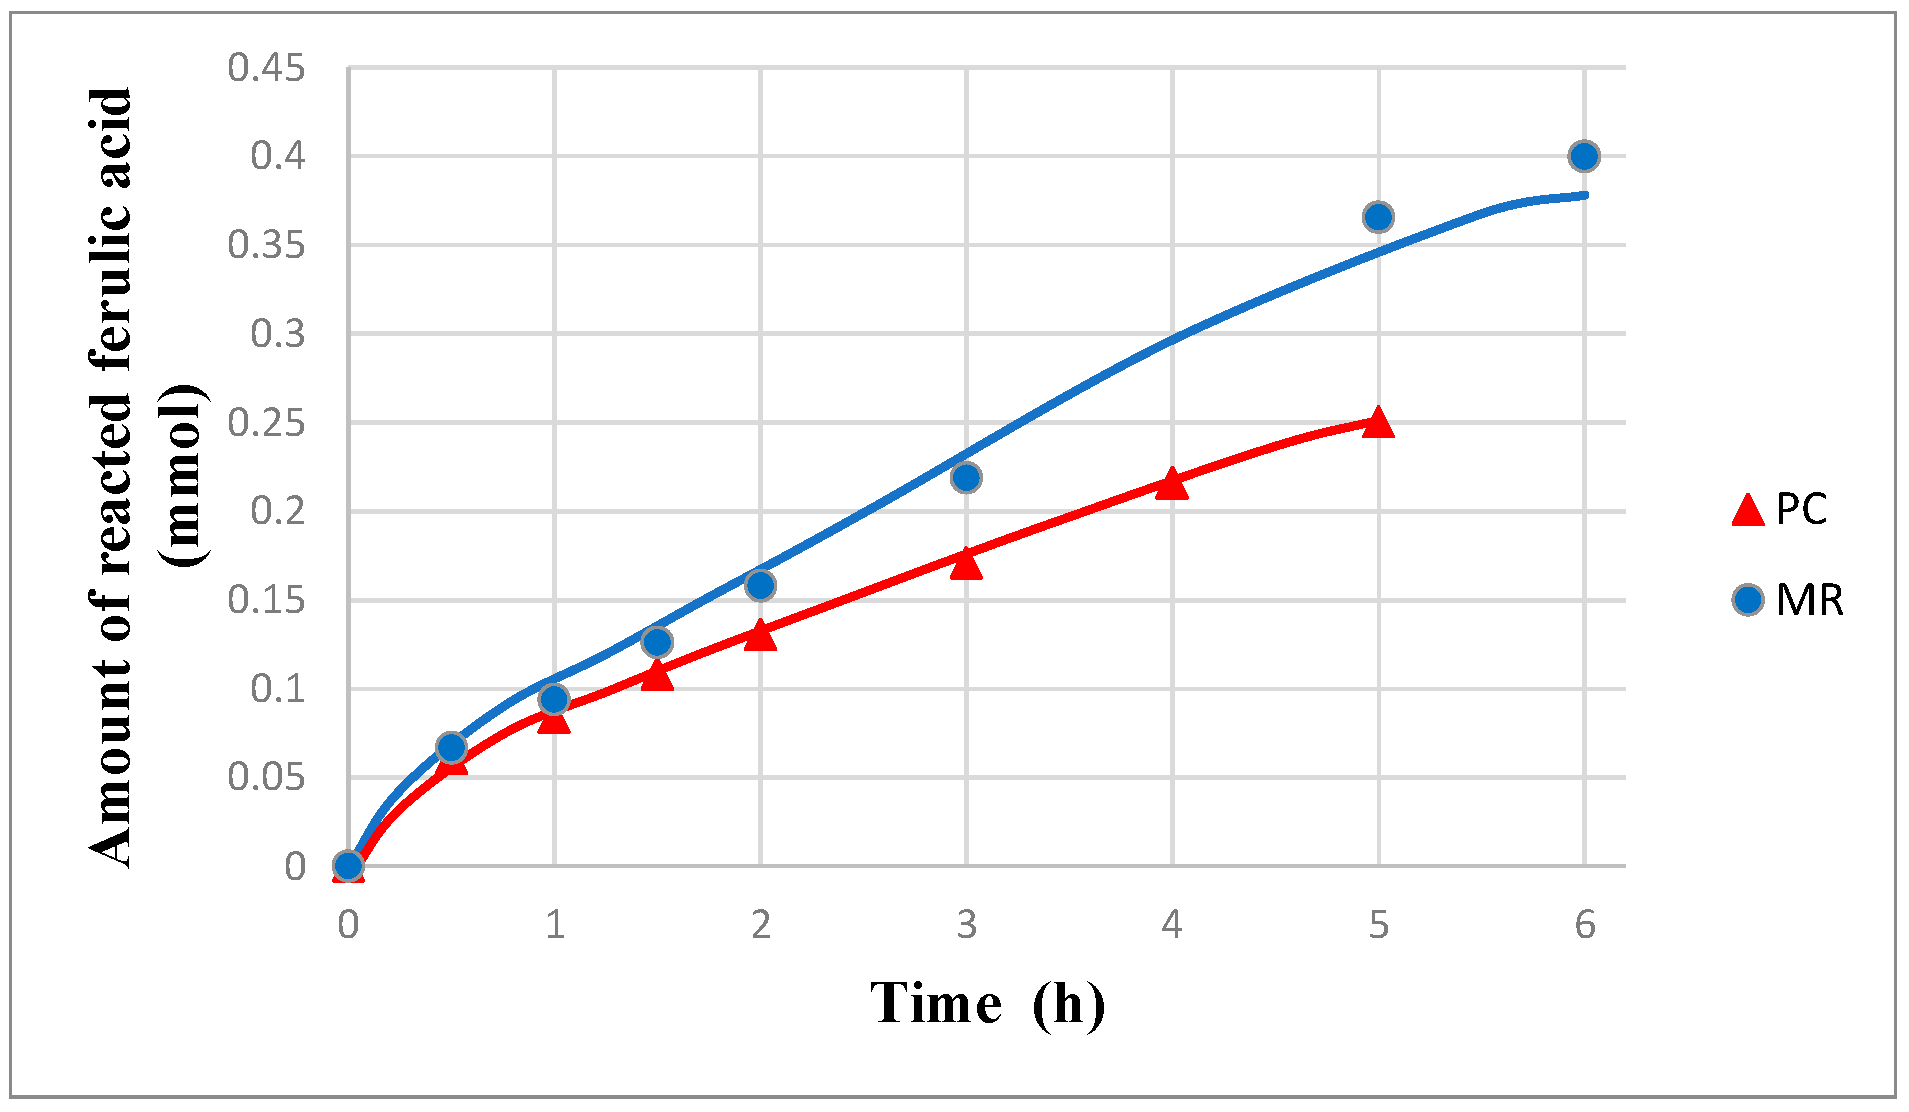
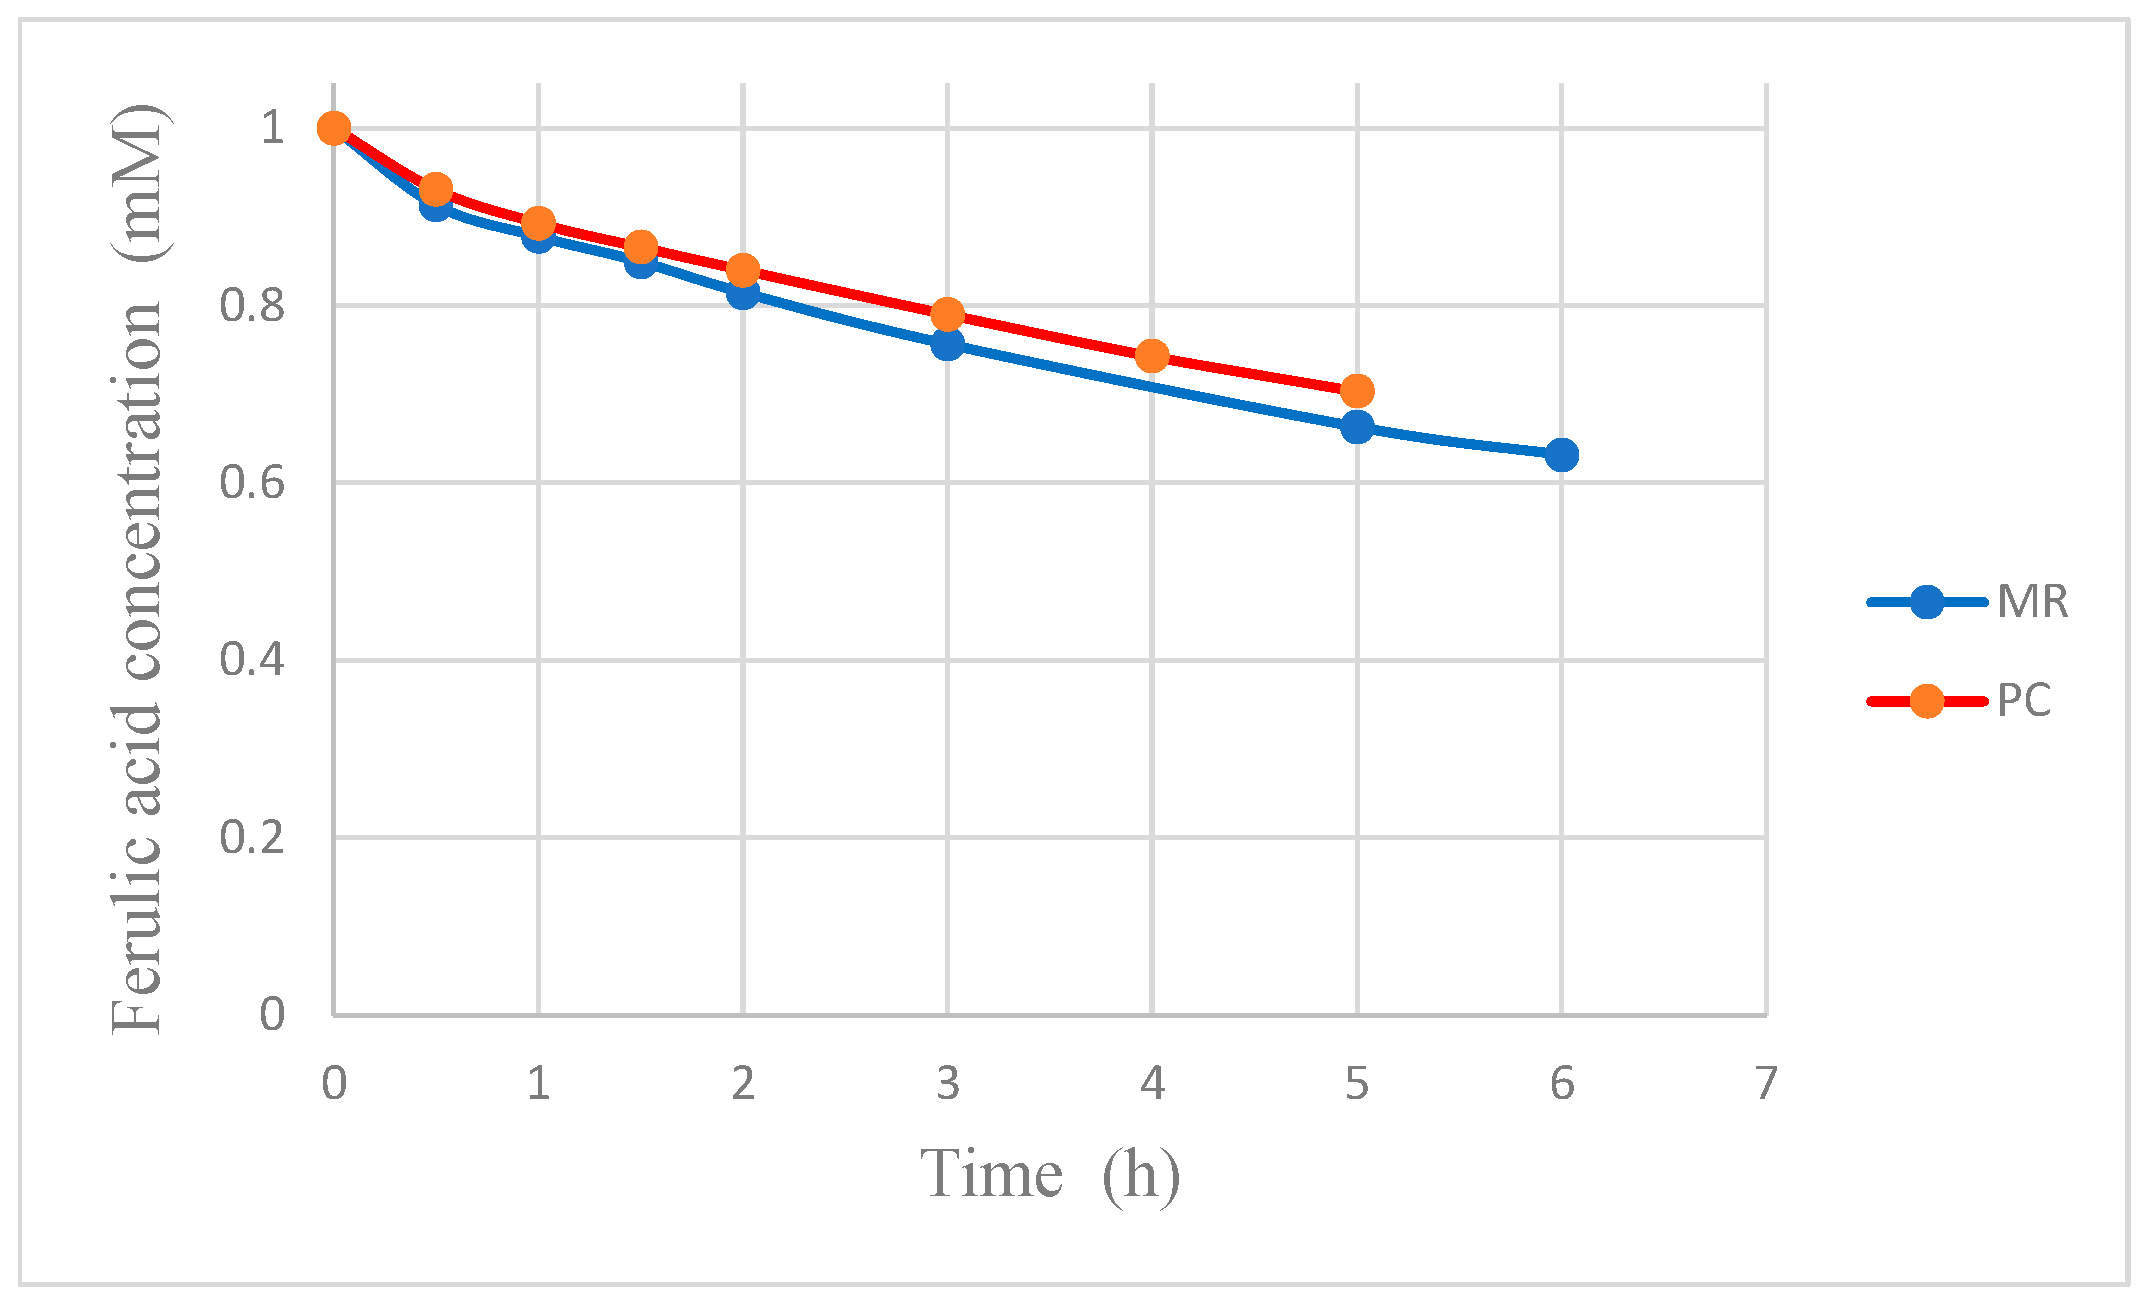
Interestingly, as shown in Figure 8, the amount of reacted FA (regardless if cis-FA or trans-FA) is higher in the MR than in PC (i.e., without dialysis). There are two mechanisms for the increase of FA transformation:
(1) The recovery of vanillin and the other intermediate compounds reduces the inhibition of the photocatalytic oxidation of FA caused by the presence of these compounds.
(2) The substrate consumed by the reaction is partially replenished by the permeation of FA from the opposite side of the membrane.
If the first phenomenon were negligible, the FA concentration would be higher in the MR than in photocatalysis alone (PC). However, in Figure 9, it is apparent that the opposite is true, thus showing that the removal of the organics effectively increases the reaction rate by reducing the inhibition caused by these compounds. It is worth noticing that, in the case of pervaporation, only vanillin is removed from the reacting solution, whereas almost all the other intermediate compounds do not permeate, due to their low volatility, and their presence hinders the rate of oxidation of FA.
Figure 10 confirms that the replenishment of FA from Liquid 2 into the reactor by permeation is efficient and the permeation of FA rises when the concentration of FA in the reactor tends to decrease because the driving force for permeation increases.
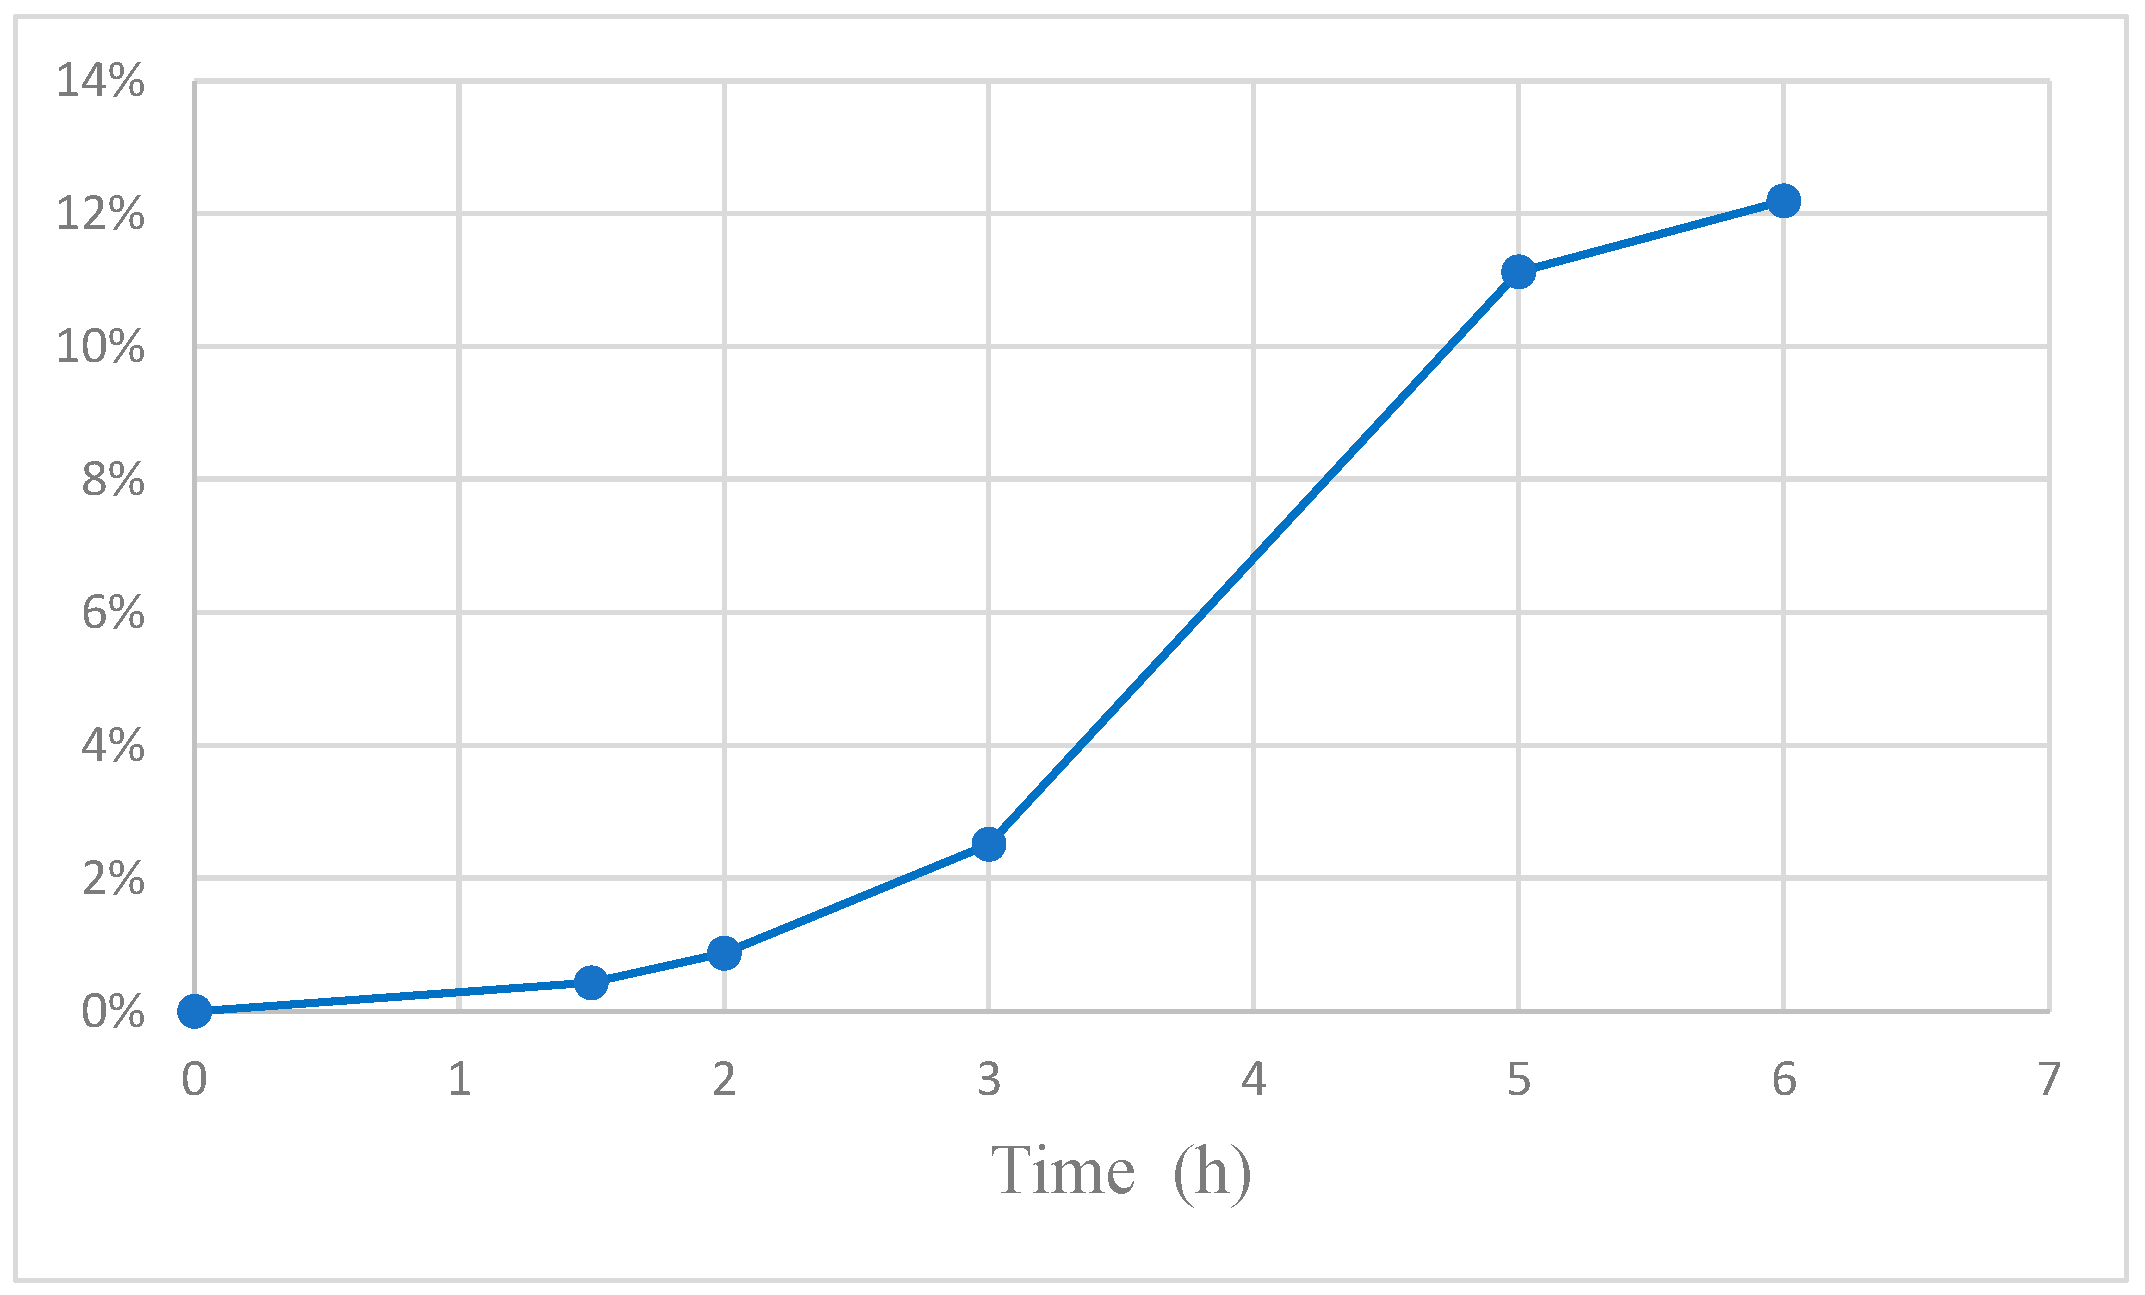
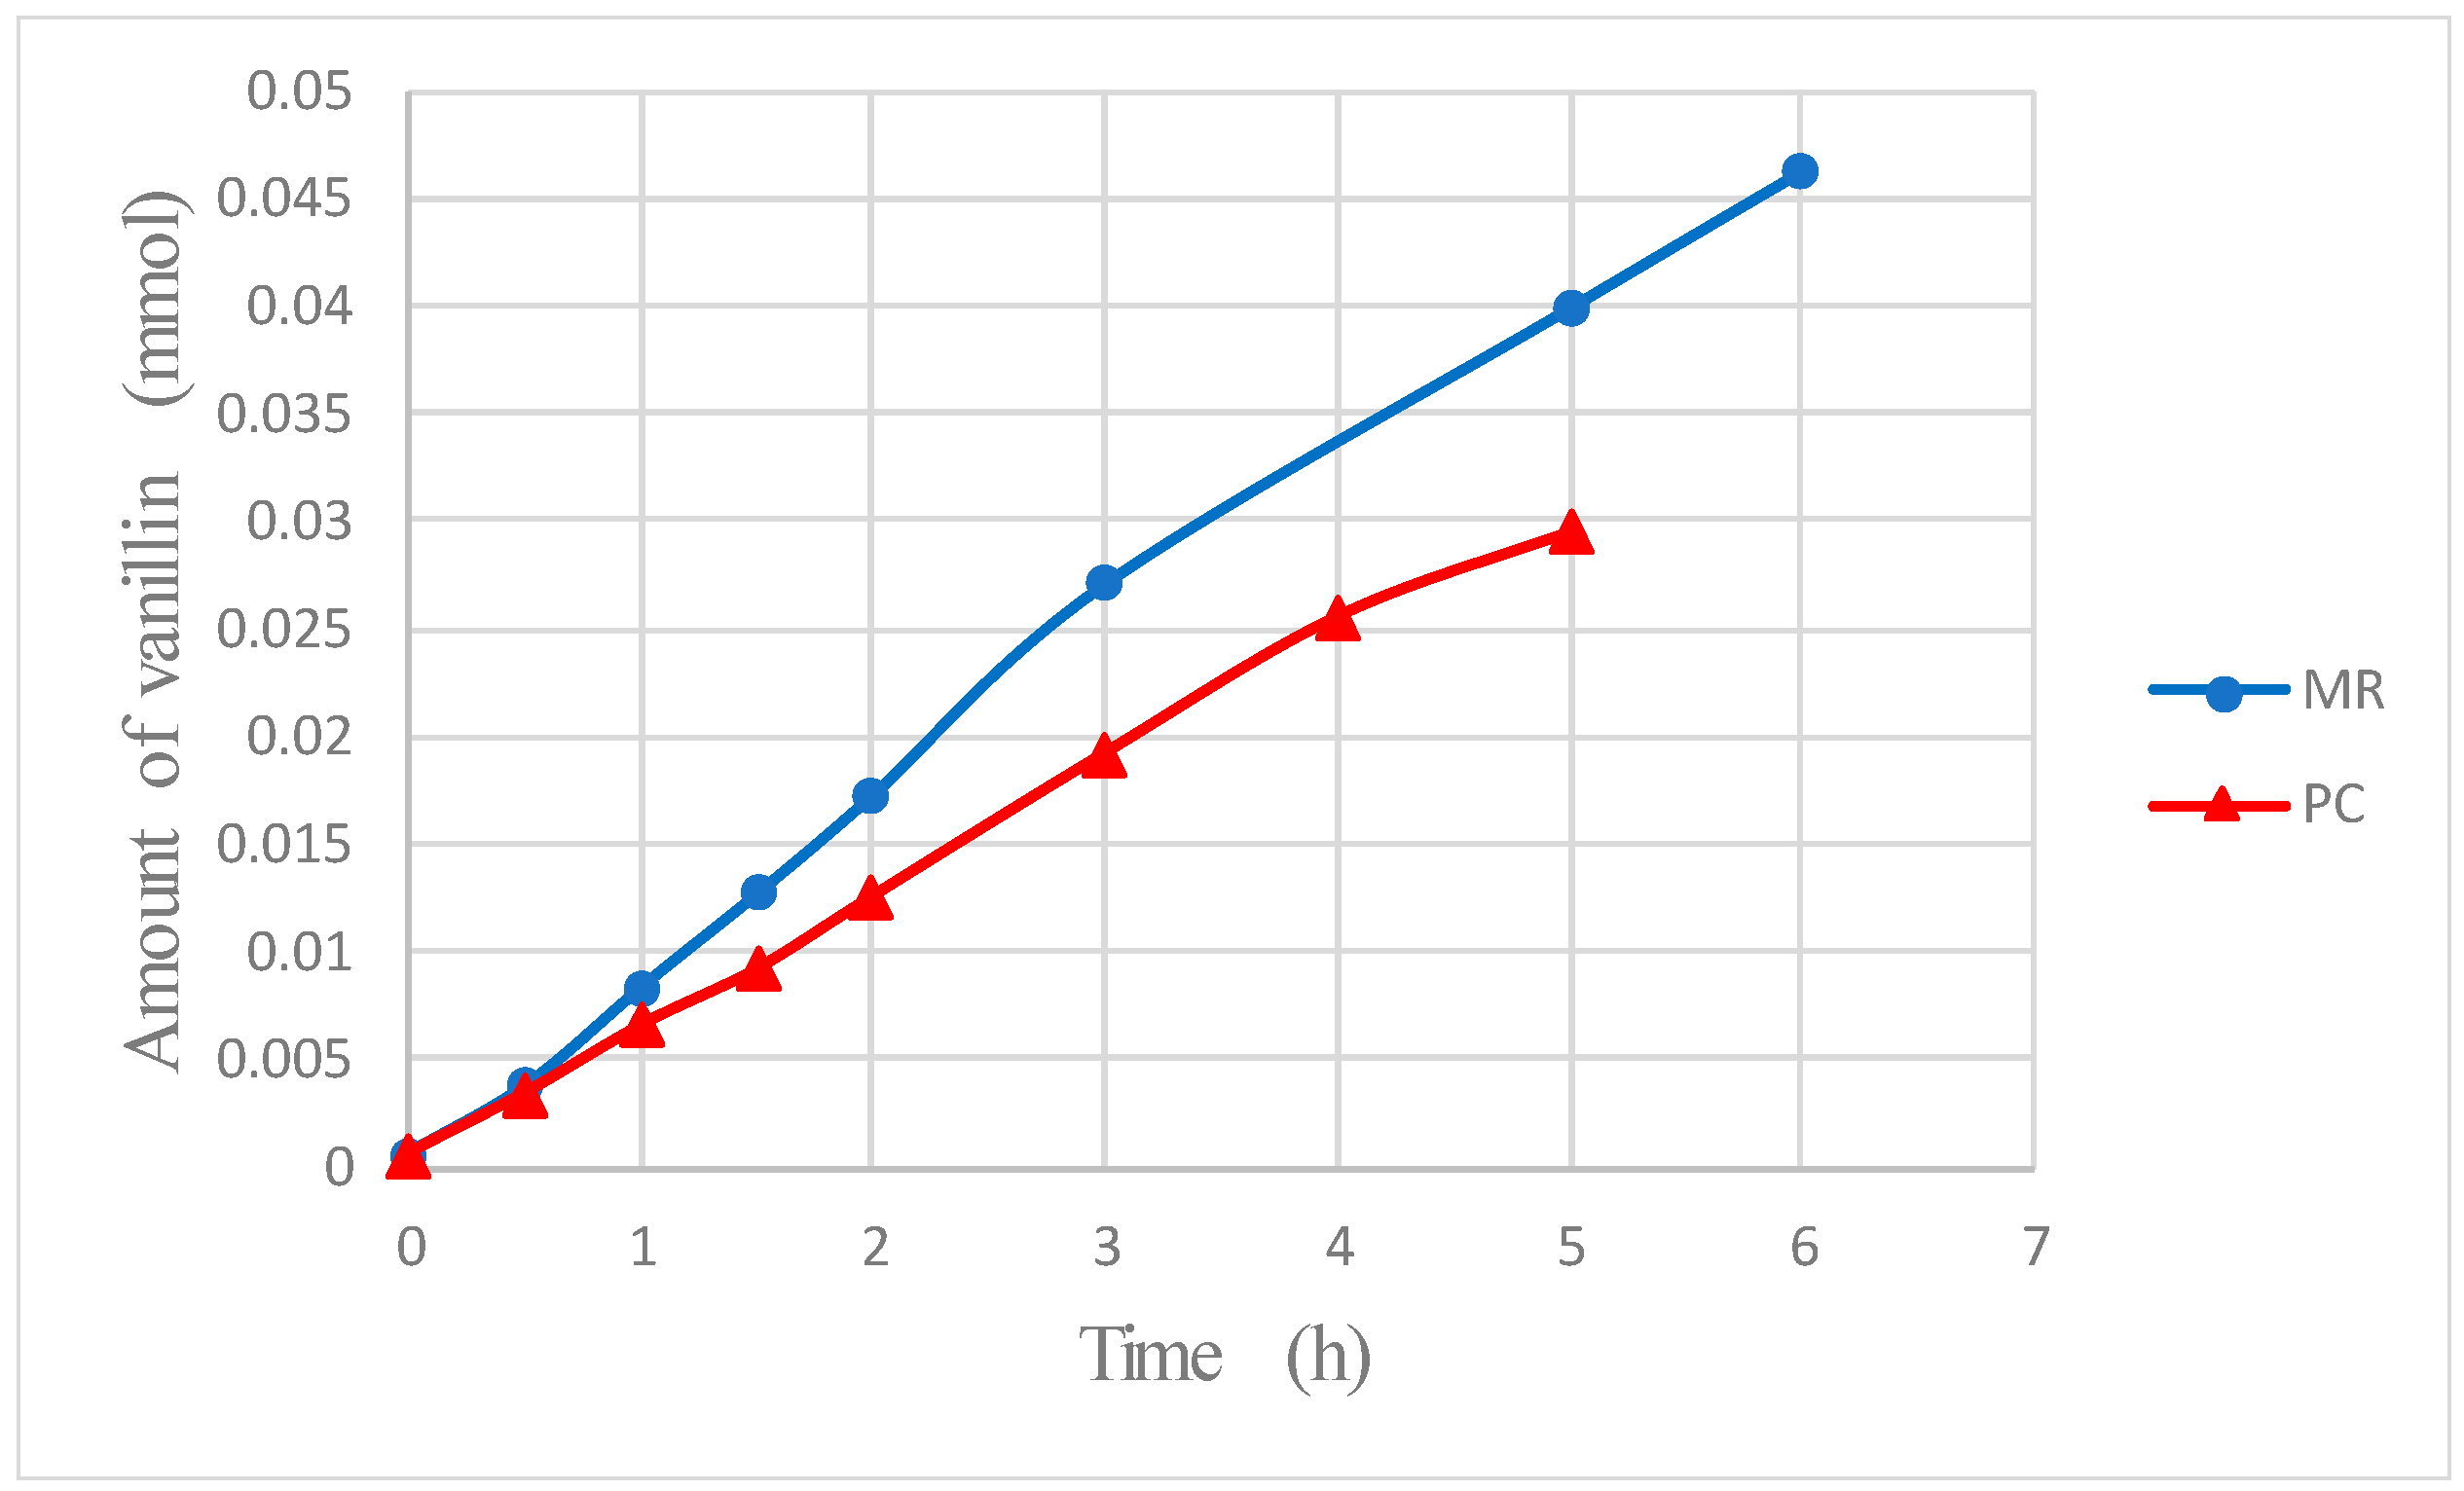
The final result of the increase of the reaction rate and of the lowering of vanillin degradation obtained by its recovery by dialysis is the improvement of vanillin production. In fact, Figure 11 shows that the amount of produced vanillin is significantly higher in the MR. For instance, with the present experimental system, the total amount of vanillin produced after 5 h in the membrane reactor was more than one third higher than in the photocatalytic reactor without dialysis. It is expected that the higher is the ratio, Φ, between the characteristic rate of vanillin permeation to the rate of reaction [10], i.e., the higher is the ratio of the membrane area to the reactor volume, the more important is the improvement of vanillin production. With the values of Da and 1/Pe, which are reported in Section 3, this ratio is Φ = 1 / Pe Da = 0.87. Thus, the order of magnitude of Φ is 1, a value which is worth improving [10] by increasing the membrane area to obtain a further enhancement of the vanillin yield.
Finally, it was observed that the photocatalytic powders do not permeate (the membrane is not porous) and that no decay of the permeability takes place even after several experimental runs.

3. Materials and Methods

Vanillin and trans-ferulic acid (TFA) were purchased from Sigma-Aldrich (Milan, Italy) with a purity > 99%. The concentrations of the organic compounds in the aqueous solutions (prepared with demineralized water) were analyzed by HPLC chromatography according to the methods described in [3].
The membranes in polyether block amide (PEBA) were prepared by the solvent casting method. PEBAX® 2533 by Arkema Italia srl (RHO (Milan), Italy) was dissolved in n-butyl alcohol and isopropyl alcohol (PEBAX 8.7 w %, n-butyl alcohol 22.8 w %, isopropyl alcohol 68.5 w %) and the solution was cast onto a glass plate by a doctor blade with adjustable clearance. Then, the solvents were evaporated for 1 day at 70 °C. The clearance of the doctor blade was regulated to obtain non-porous (“dense”) membranes with a final thickness of about 45 µm.
In the experiments with the integrated process (membrane reactor, MR), dialysis was coupled with the production of vanillin, which was obtained by the partial oxidation of ferulic acid in a photocatalytic annular reactor (inner diameter = 2.4 cm; outer diameter = 3.4 cm, length = 26.5 cm, volume =115 mL) according to the procedure described in [7]. The photocatalyst was titanium dioxide (Merck TiO2, 100% anatase). It was utilized as fine powders in suspension into the aqueous solution with a mass concentration of 1 g of photocatalyst per liter of solution. With this concentration, the optical thickness was about 5. A linear fluorescent blacklight lamp (Philips 8W TL/08, Eindhoven, Netherlands) was positioned on the axis of the annular reactor. The emission spectrum of the lamp ranges from 350 to 400 nm with 82% of the emitted radiant power concentrated from 360 to 380 nm and an emission maximum at 365 nm.
The experimental system, comprising the reactor and the membrane module, is schematically shown in Figure 12.
The integration of the membrane process was achieved by continuously recirculating the reacting solution (Liquid 1) through the reactor and the membrane module. The flow rate of the recirculated stream was sufficiently high to obtain very low values (much less than unity) of the Damköhler number, Da, and of the reciprocal of the Péclet number for membrane processes, 1/Pe [10]. In this way, the two separate apparatuses (reactor and membrane module) work in differential conditions and the coupling of the membrane separation and the reaction is almost complete [15]. Da and 1/Pe can be defined as: Da = r FA C FA , 0 × V r V ˙ and 1 / Pe = n ˙ van ,   permeate n ˙ van ,   in , where r FA is the volumetric rate of disappearance of FA in the reactor, V ˙ is the volumetric flow rate through the reactor, C FA , 0 is the initial concentration of ferulic acid, V r is the volume of the reactor, n ˙ van ,   permeate is the permeate molar flow rate of vanillin, and n ˙ van ,   in is the inlet molar flow rate of vanillin to the dialysis module.
The values of Da and 1 / Pe varied slightly in the different experiments. Typical values for the MR, which were used in the current work, can be estimated as
r FA ≈ 1 mmol/(L h), V ˙ = 115 L/h, C FA , 0 = 1 mM, V r = 0.115 L Da ≈ 1 × 10⁻³ << 1
n ˙ van ,   permeate ≈ 0.1 mmol/h, n ˙ van ,   in = 1 (mM) × 115 (L/h) = 115 mmol/h 1 / Pe ≈ 0.87 × 10⁻³ << 1.
The same apparatuses (photocatalytic reactor and dialysis modulus) were also used for the experiments with photocatalysis alone (PC) and dialysis alone, simply by eliminating the unnecessary apparatus from the system. In the runs with dialysis and without the reactor, at time 0 Liquid 1 was an aqueous solution containing only vanillin at different concentrations, while Liquid 2 was pure water. In the runs with photocatalysis and without dialysis (PC), at time 0 Liquid 1 was an aqueous solution containing the photocatalyst in suspension, as previously described, and trans-ferulic acid at a concentration of 1 mM. Under UVA irradiation a fraction of TFA is transformed into cis-ferulic acid (CFA). Both enantiomers (TFA and CFA) react in the presence of titanium dioxide and UVA irradiation [3]. When it is preferable to consider the cumulative amount of TFA and CFA, they are indicated here as a generic species, “ferulic acid” (FA). With the sole PC, the composition of Liquid 1 is not affected by dialysis, thus Liquid 2 is not considered. In the runs with the MR, at time 0 Liquid 1 was the same as without dialysis while Liquid 2 was an aqueous solution containing only trans-ferulic acid at a concentration of 1 mM. The reasons for this choice were discussed in the previous section.
The active membrane area in the dialysis modulus is 96 cm2 and the two aqueous solutions (Liquids 1 and 2 in Figure 12) flow in counter-current tangentially to the membrane, as schematically shown in Figure 1. The volumes of Liquids 1 and 2 were 1 L each. In the dialysis modulus, the channels where Liquids 1 and 2 are in contact with the membrane have a rectangular cross section with the following dimensions: for Liquid 1, length = 12 cm, width = 8 cm, and thickness = 4 mm; and, for Liquid 2, length = 12 cm, width = 8 cm, and thickness = 2 mm.

4. Conclusions

Even if pervaporation has been considered so far as one of the most interesting membrane processes to recover vanillin in a membrane reactor, dialysis with the same polymeric PEBAX membranes has several advantages over pervaporation.
Contrary to pervaporation, dialysis does not require that the permeate evaporates. Thus, the low volatility of vanillin does not limit the permeation and the energy consumption is lower because no latent heat of vaporization is used. The main consequence is that the permeate flux is at least one order of magnitude higher than in pervaporation. However, as a mathematical model demonstrated, the high permeate flux favors polarization concentration, whose negative effects cannot be neglected and should be limited by careful design of the module and adequate flow rate through the membrane. The mathematical model was also used to assess the transport properties of vanillin in the membrane.
The recovery of vanillin by dialysis has beneficial effects on the production yield by avoiding the further oxidation of this valuable intermediate product.
Besides, it was observed that the PEBAX membrane shows a very high permeability towards almost all the organics, i.e. the substrate, vanillin, and the other intermediate compounds. This property has both positive and negative effects. Besides the previously cited positive effect of protecting vanillin from degradation, the removal from the reacting solution of the competitive intermediates permits a more effective utilization by the substrate (ferulic acid) of the photogenerated oxidizing agents with an increase of the reaction rate. Moreover, the high permeability of the substrate may allow for the replenishment of the substrate consumed by the reaction. In fact, the liquid solution downstream of the membrane (i.e., at the other side of the reacting solution) can be used as a reservoir of the substrate if initially a sufficient amount of substrate is fed there. The negative effect of the high permeability of the organics is that the membrane selectivity is almost null and an additional step is needed to purify the produced vanillin. On the other hand, presently all the production techniques of vanillin require one or more purification steps.
Contrary to pervaporation, dialysis is effective also at ambient temperature and this feature makes it suitable also for the bioreactions that cannot withstand high temperatures.
With the mathematical model, it is possible to assess the transport properties of the permeants in the membrane or, in general, to analyze the experimental data. Once it has been validated, its utilization can be extended to the design of the MR.

Author Contributions

G.C.-R.: writing, model, design of experiments, analysis of the results; F.P.: design of experiments, chemical analysis, experimental runs, analysis of the results; V.L.: critical discussions, design of experiments, analysis of the results, revision of the manuscript; L.P.: supervision of the work, design of experiments, analysis of the results, revision of the manuscript. All authors have read and agreed to the published version of the manuscript.

Funding

This research received no external funding.

Conflicts of Interest

The authors declare no conflict of interest.

References

  1. Bomgardner, M.M. The problem with vanilla. Chem. Eng. News 2016, 94, 38–42. [Google Scholar]
  2. Ciriminna, R.; Fidalgo, A.; Meneguzzo, F.; Parrino, F.; Ilharco, L.; Pagliaro, M. Vanillin: The case for greener production driven by sustainability megatrend. Chem. Open 2019, 8, 660–667. [Google Scholar] [CrossRef] [PubMed]
  3. Augugliaro, V.; Camera-Roda, G.; Loddo, V.; Palmisano, G.; Palmisano, L.; Parrino, F. Synthesis of vanillin in water by TiO2 photocatalysis. Appl. Catal. B 2012, 111–112, 555–561. [Google Scholar] [CrossRef]
  4. Banerjee, G.; Chattopadhyay, P. Vanillin biotechnology: The perspectives and future. J. Sci. D Agric. 2019, 99, 499–506. [Google Scholar] [CrossRef] [PubMed]
  5. Böddeker, K.W.; Gatfield, I.L.; Jähnig, J.; Schorm, C. Pervaporation at the vapor pressure limit: Vanillin. J. Membr. Sci. 1997, 137, 155–158. [Google Scholar] [CrossRef]
  6. Brazinha, C.; Barbosa, D.S.; Crespo, J.G. Sustainable recovery of pure natural vanillin from fermentation media in a single pervaporation step. Green Chem. 2011, 13, 2197–2203. [Google Scholar] [CrossRef]
  7. Camera-Roda, G.; Augugliaro, V.; Cardillo, A.; Loddo, V.; Palmisano, G.; Palmisano, L. A pervaporation photocatalytic reactor for the green synthesis of vanillin. Chem. Eng. J. 2013, 224, 136–143. [Google Scholar] [CrossRef] [Green Version]
  8. Camera-Roda, G.; Cardillo, A.; Loddo, V.; Palmisano, L.; Parrino, F. Improvement of Membrane Performances to Enhance the Yield of Vanillin in a Pervaporation Reactor. Membranes 2014, 4, 96–112. [Google Scholar] [CrossRef] [PubMed] [Green Version]
  9. Sciubba, L.; Di Gioia, D.; Fava, F.; Gostoli, C. Membrane-based solvent extraction of vanillin in hollow fiber contactors. Desalination 2009, 241, 357–364. [Google Scholar] [CrossRef]
  10. Camera-Roda, G.; Loddo, V.; Palmisano, L.; Parrino, F. PMRs Utilizing Non-Pressure-Driven Membrane Techniques. In Current Trends and Future Developments on (Bio-) Membranes; Basile, A., Mozia, S., Molinari, R., Eds.; Elsevier: Amsterdam, The Netherlands, 2018; pp. 129–171. [Google Scholar]
  11. Camera-Roda, G.; Loddo, V.; Palmisano, L.; Parrino, F. Green Synthesis of Vanillin: Pervaporation and Dialysis for Process Intensification in a Membrane Reactor. Chem. Eng. Trans. 2019, 75, 1–6. [Google Scholar]
  12. Camera-Roda, G.; Santarelli, F.; Augugliaro, V.; Loddo, V.; Palmisano, G.; Palmisano, L.; Yurdakal, S. Photocatalytic process intensification by coupling with pervaporation. Catal. Today 2011, 161, 209–213. [Google Scholar] [CrossRef]
  13. De Albuquerque, I.; Mazzotti, M. Crystallization process design using thermodynamics to avoid oiling out in a mixture of vanillin and water. Cryst. Growth Des. 2014, 14, 5617–5625. [Google Scholar] [CrossRef]
  14. Molinari, R.; Lavorato, C.; Argurio, P. Photocatalytic reduction of acetophenone in membrane reactors under UV and visible light using TiO2 and Pd/TiO2 catalysts. Chem. Eng. J. 2015, 274, 307–316. [Google Scholar] [CrossRef]
  15. Camera-Roda, G.; Loddo, V.; Palmisano, L.; Parrino, F.; Santarelli, F. Process intensification in a photocatalytic membrane reactor: Analysis of the techniques to integrate reaction and separation. Chem. Eng. J. 2017, 310, 352–359. [Google Scholar] [CrossRef]
Figure 1. The amount of reacted ferulic acid (FA) vs. time, t, in the case of photocatalysis without dialysis.
Catalysts 10 00326 g001
Figure 2. The concentration of vanillin in the reacting solution vs. time, t, in the case of photocatalysis without dialysis.
Catalysts 10 00326 g002
Figure 3. Permeate flux density of vanillin vs. the driving force ΔCvan. T = 60 °C, Ph ≈ 5.5, upstream flow rate of Liquid 1 through the module = 115 L/h (Re1 = 1600), and downstream flow rate of Liquid 2 through the module = 72 L/h (Re2 = 1020).
Catalysts 10 00326 g003
Figure 4. Flux density of vanillin vs. the driving force ΔCvan. T = 60 °C, pH ≈ 5.5, and downstream flow rate of Liquid 2 through the module = 75 L/h (Re2 = 1020).
Catalysts 10 00326 g004
Figure 5. Scheme of the dialysis process (dialysis membrane with Liquid 1, upstream, and Liquid 2, downstream) with exemplificative concentration profile of vanillin (red curve in Liquid 1, yellow curve in the membrane, and blue curve in Liquid 2).
Catalysts 10 00326 g005
Figure 6. The fitting of the experimental data (dots) by the mathematical model (lines) for some experimental runs at different initial vanillin concentration in Liquid 1. Upstream data (green) and downstream data (red). Upstream initial concentrations: ≈ 6 mM (a); ≈ 1.6 mM (b); ≈ 0.8 mM (c); and ≈ 0.3 mM (d). Flow rates for Liquid 1 are indicated in the figure. Flow rates for Liquid 2 = 75 L/h (ad).
Catalysts 10 00326 g006
Figure 7. Flux density of vanillin vs. time, as predicted by the model. Upstream of the membrane (dotted lines), in the middle of the membrane at x = δ/2 (dashed lines), and downstream of the membrane (continuous lines). Flow rate of Liquid 1: 45 L/h (red lines) and 115 L/h (blue lines). For all the curves: flow rate of Liquid 2 = 72 L/h and upstream initial concentration of vanillin ≈ 0.3 mM.
Catalysts 10 00326 g007
Figure 8. Amount of reacted ferulic acid (FA) vs. time in PC and in MR. Initial concentration of ferulic acid in Liquid 1= 1 mM and (for the MR) initial concentration of ferulic acid in Liquid 2 = 1 mM.
Catalysts 10 00326 g008
Figure 9. Ferulic acid (FA) concentration in the reactor vs. time. The operating conditions are the same as those in Figure 8.
Catalysts 10 00326 g009
Figure 10. Percentage of ferulic acid (FA) that passed from Liquid 2 to the reactor vs. time. The operating conditions are the same as those in Figure 8.
Catalysts 10 00326 g010
Figure 11. Total amount of vanillin in the experimental set-ups (i.e., for the MR, the sum of the amount of vanillin in the reacting solution plus the one in the permeate) vs. time. The operating conditions are the same as those in Figure 8.
Catalysts 10 00326 g011
Figure 12. Scheme of the system.
Catalysts 10 00326 g012
Table 1. Concentration (mM) of some organic compounds in the reacting solution of the MR and at the opposite side of the membrane after 5 h. At time 0, the aqueous solutions on both sides contained only trans-ferulic acid with a 1 mM concentration.
CompoundReacting Solution
(Liquid 1)
Opposite side of Membrane
(Liquid 2)
Trans-ferulic acid0.460.85
Cis-ferulic acid0.220.068
Vanillin0.0430.0074
Caffeic acid0.0280.0038

