Article

Catalyzed Steam Gasification of Cistus Ladanifer Biochar

by
José María Encinar
1,
Juan Félix González
2 and
Sergio Nogales-Delgado
1,*
1
Department of Chemical Engineering and Physical-Chemistry, University of Extremadura, Av. De Elvas, s/n, 06006 Badajoz, Spain
2
Department of Applied Physics, University of Extremadura, Av. De Elvas, s/n, 06006 Badajoz, Spain
*
Author to whom correspondence should be addressed.
Catalysts 2020, 10(12), 1430; https://doi.org/10.3390/catal10121430
Submission received: 29 October 2020 / Revised: 23 November 2020 / Accepted: 4 December 2020 / Published: 7 December 2020

Abstract

:
Gasification processes require the use of cheap and sustainable raw materials, as well as the optimization of the process, for a suitable commercial use. Cistus Ladanifer (rockrose) could be a suitable raw material for this purpose, as it grows spontaneously in Mediterranean regions, and might contribute to the economic development of these areas. In this research, a study about catalyzed gasification of Cistus Ladanifer biochar was carried out. The aim was to characterize the gaseous phase and to carry out a kinetic study. The experiments were carried out in a thermobalance connected to a gas chromatograph to quantify the exhaust gas. The operating variables studied were the initial carbon mass, temperature, steam partial pressure, the kind of catalyst (ionic or cationic), catalyst concentration and the method to incorporate the catalyst (impregnation or mixture). As a result, impregnation was the most effective way to mix the raw material and the catalyst, with K+ and CO32− as the most active cations and anions used in this experience, respectively. Temperature and steam partial vapor showed a positive effect on conversion and gas yield. The use of ideal models for gas-solid reactions showed acceptable results for the kinetic study.

Graphical Abstract

1. Introduction

The steady decrease in oil reserves, as well as the subsequent problems related to the use of this kind of energy source, has made the search of alternative energy sources necessary, as fossil feedstock cannot be regenerated whereas in renewable energy sources this fact is possible [1,2]. Among these sources, wastes from biomass play an important role due to their renewable nature. In that sense, many international organizations (such as the European Union) encourages the use of renewable energies [3]. This way, gas emissions and the subsequent greenhouse effect can be mitigated [4,5].
There are many ways and raw materials for the energy use of biomass [6]. Nevertheless, gasification processes, both at medium and large-scale, seem to offer the most attractive options. Moreover, gasification carried out in non-oxidizing conditions, decreases the emission of pollutants and, as a consequence, contributes to palliate the greenhouse effect [5,7].
Wastes from biomass are more reactive than mineral coals, both in the case of pyrolysis and gasification. For instance, steam gasification rate for biomass is 4 to 10 times higher than in the case of lignite [7,8]. This high reactivity of biomass is a consequence of its chemical and physical properties. Thus, volatile content of biomass (80–90%) doubles the corresponding value for mineral coals. Hydrogen/carbon and oxygen/carbon molar ratios are in the range of 1.3–1.5 and 0.5–0.8, respectively [6,7]. These ratios are substantially higher than those related to coals, with ranges between 0.8–0.9 and 0.1–0.3, respectively [7]. Finally, biochar from biomass, especially from woody biomass, has a high levels of porosity, with values between 40 and 50% (expressed in% volume of pores to the total volume of the sample) and pore size distributions between 20 and 30 μm, whereas mineral coals show porosities between 2 and 18% and pore sizes from 5 Åformicropores to 5–20 ηm for mesopores. Total pore volume and BET Surface show similar trends, reaching for biochar values of 0.6–0.8 mL·mL−1 and 500–2000 m2·g−1, respectively, whereas for mineral coals total pore volume is between 10−1 and 10−2 mL·g−1 and BET surface area hardly reach values between 10–20 m2.g−1 [6,8]. As a consequence, biochar gasification, due to its higher reactivity, can be an important way to develop new energy sources and chemical products.
Although gasification with air is a very common process, it is not suitable when high hydrogen quantities are required. For that purpose, it is necessary to use steam as a rising agent. Thus, steam gasification has raised interest due to the fact that it produces high amounts of hydrogen [9]. This gaseous fuel can be used in fuel cells, contributing to a new technology for clean electricity production [10]. Among other advantages, steam gasification produces a gas with a high heating value, reduces the diluent effect of nitrogen when air is used and, economically, it does not require the use of oxygen for gasification. However, steam gasification is a more complex process and endothermic. In this case, there is no possibility of using the heat required for the process from partial combustion of biomass, as in the case of gasification with air or oxygen [8,9,10].
Heat requirements of steam gasification can be mitigated by the use of catalysts that reduce the temperature required to carry out the process at a suitable reaction rate. For this reason, researchers have shown great interest in the mechanism and kinetics related to catalysts including alkaline, alkali earth or transition metals [11]. However, in practice, most gasification processes are not catalyzed due to problems related to costs and catalyst recovery [12]. Thus, it is necessary and useful to try and look for cheap catalysts in order to reduce energy costs of gasification [13].
The commercial development of gasification processes requires the use of a cheap and abundant raw material. Thus, the use of agricultural and forestry wastes is a suitable option [14,15,16,17]. Another possibility is to produce the raw material through non-food crops or the collection of biomass spontaneously generated in the countryside [18]. In that sense, gum rockrose (Cistus Ladanifer) is a flowering plant, very abundant in Mediterranean regions such as Extremadura (Spain), spontaneously growing in scrublands. The properties of its extracts or essential oils have been widely studied in the literature, offering antifungal, antibacterial and antioxidant activity [19,20,21,22]. However, to the best of our knowledge, this plant (or its wastes as herbaceous biomass) has not been extensively used for energy use.
Considering the above, and as a continuation of previous research works [23,24,25], a study about catalyzed steam gasification of pyrolyzed rockrose biochar was carried out. The aim of this work was to characterize the gaseous phase in order to assess its energy use, as well as the determination of the influence of some operating variables and a kinetic study.

2. Results and Discussion

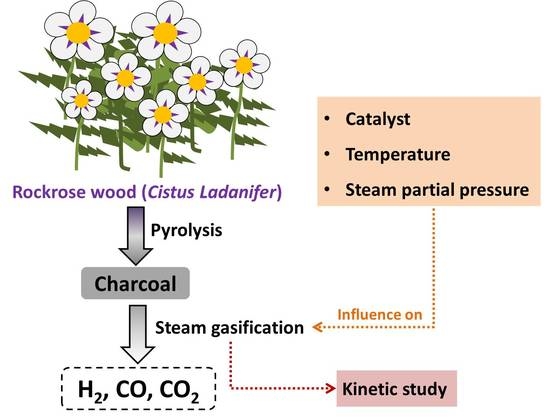
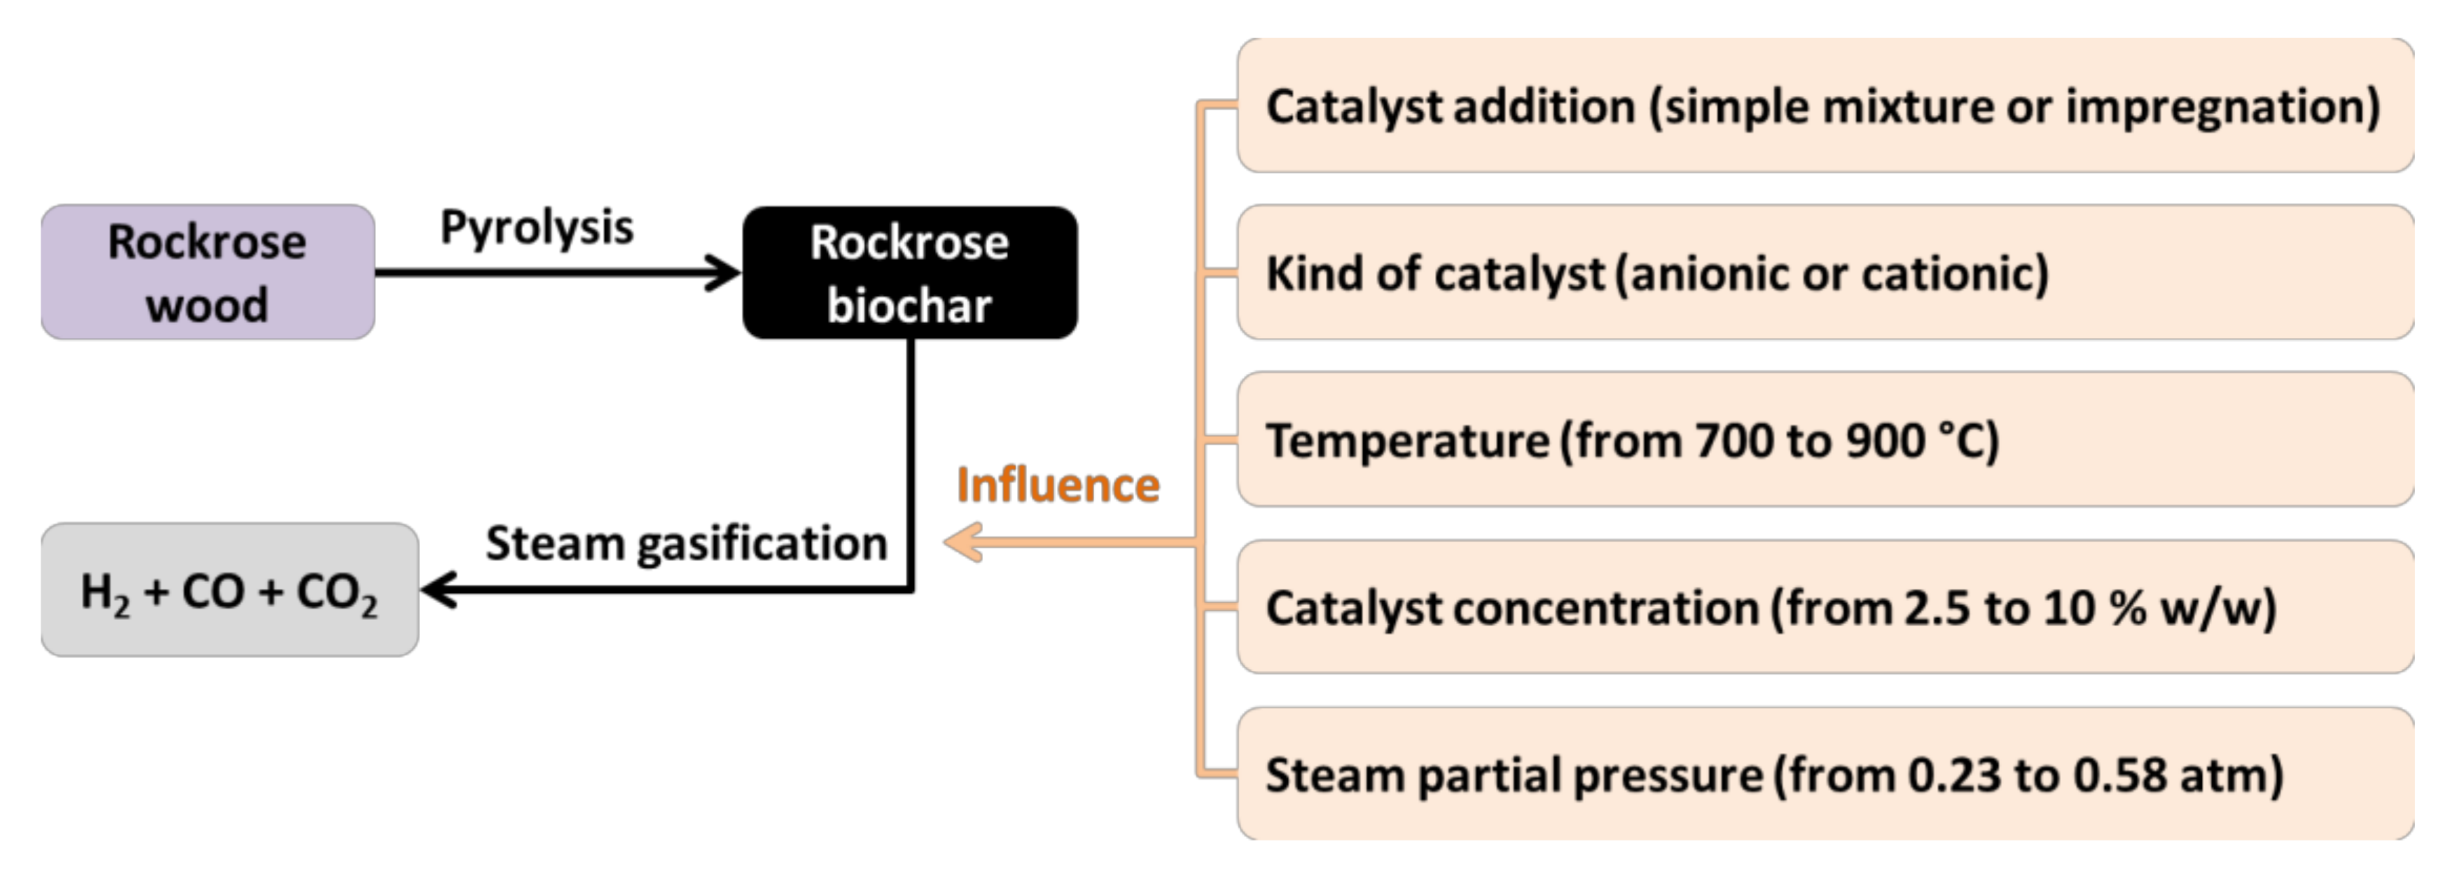
As it was pointed out, the operating variables studied were temperature, steam partial pressure, kind of catalyst (cationic and anionic part), catalyst concentration and catalyst addition. The influence of each of them is explained down below.

2.1. Influence of Catalyst Addition

Different studies have been carried out, by using sodium, potassium, magnesium, and calcium carbonates. These catalysts, as it was pointed out, have been added to the biochar through two procedures: impregnation and physical mixture. In both situations, the results were compared to those obtained in an experiment carried out without any catalyst (control sample). For the set of experiments where the catalyst was added through physical mixture, the results obtained (conversion and gas generation) hardly improved the results obtained without catalyst. On the contrary, when the samples were prepared by impregnation, both conversion and gas generation were clearly higher than in the case of control samples. These results pointed out that impregnation produced a better catalyst distribution in the pores of the material and, as a consequence, a higher effectiveness was achieved. All the catalysts studied, except for magnesium carbonate, showed this same trend. In the case of the latter, as it can be seen in Figure 1, no catalytic effect was observed, and the obtained results were similar to those related to the non-catalyzed experiment. The typical behavior of magnesium carbonate could be due to the low stability of this salt, whose decomposition point is around 200 °C, and due to its low solubility (1 g·L−1). For this reason, (low catalytic activity), the results for both preparation procedures were similar. Nevertheless, and taking into account the general behavior, impregnation was the method used for further experimentation.

2.2. Influence of the Kind of Catalyst

As mentioned above, the influence of the anionic and cationic part of the catalyst was studied. The cations used were sodium, potassium, magnesium, and calcium, whereas the anions used were carbonate, chloride, nitrate, acetate and fluoride. In all cases, according to the results obtained in the previous section, impregnation was used to prepare the samples with catalysts.
As it was described earlier, weight loss was recorded over time. From these data the conversion of the process can be determined (Figure 1 and Figure 2) and, therefore, its subsequent monitoring. Another possibility can be through gas analysis. Thus, apart from nitrogen, which was used as the carrier gas, other gases such as H2, CO and CO2 were detected. Due to the fact that the latter way can be considered more intuitive, the influence of operating variables was studied according to the gas evolved.
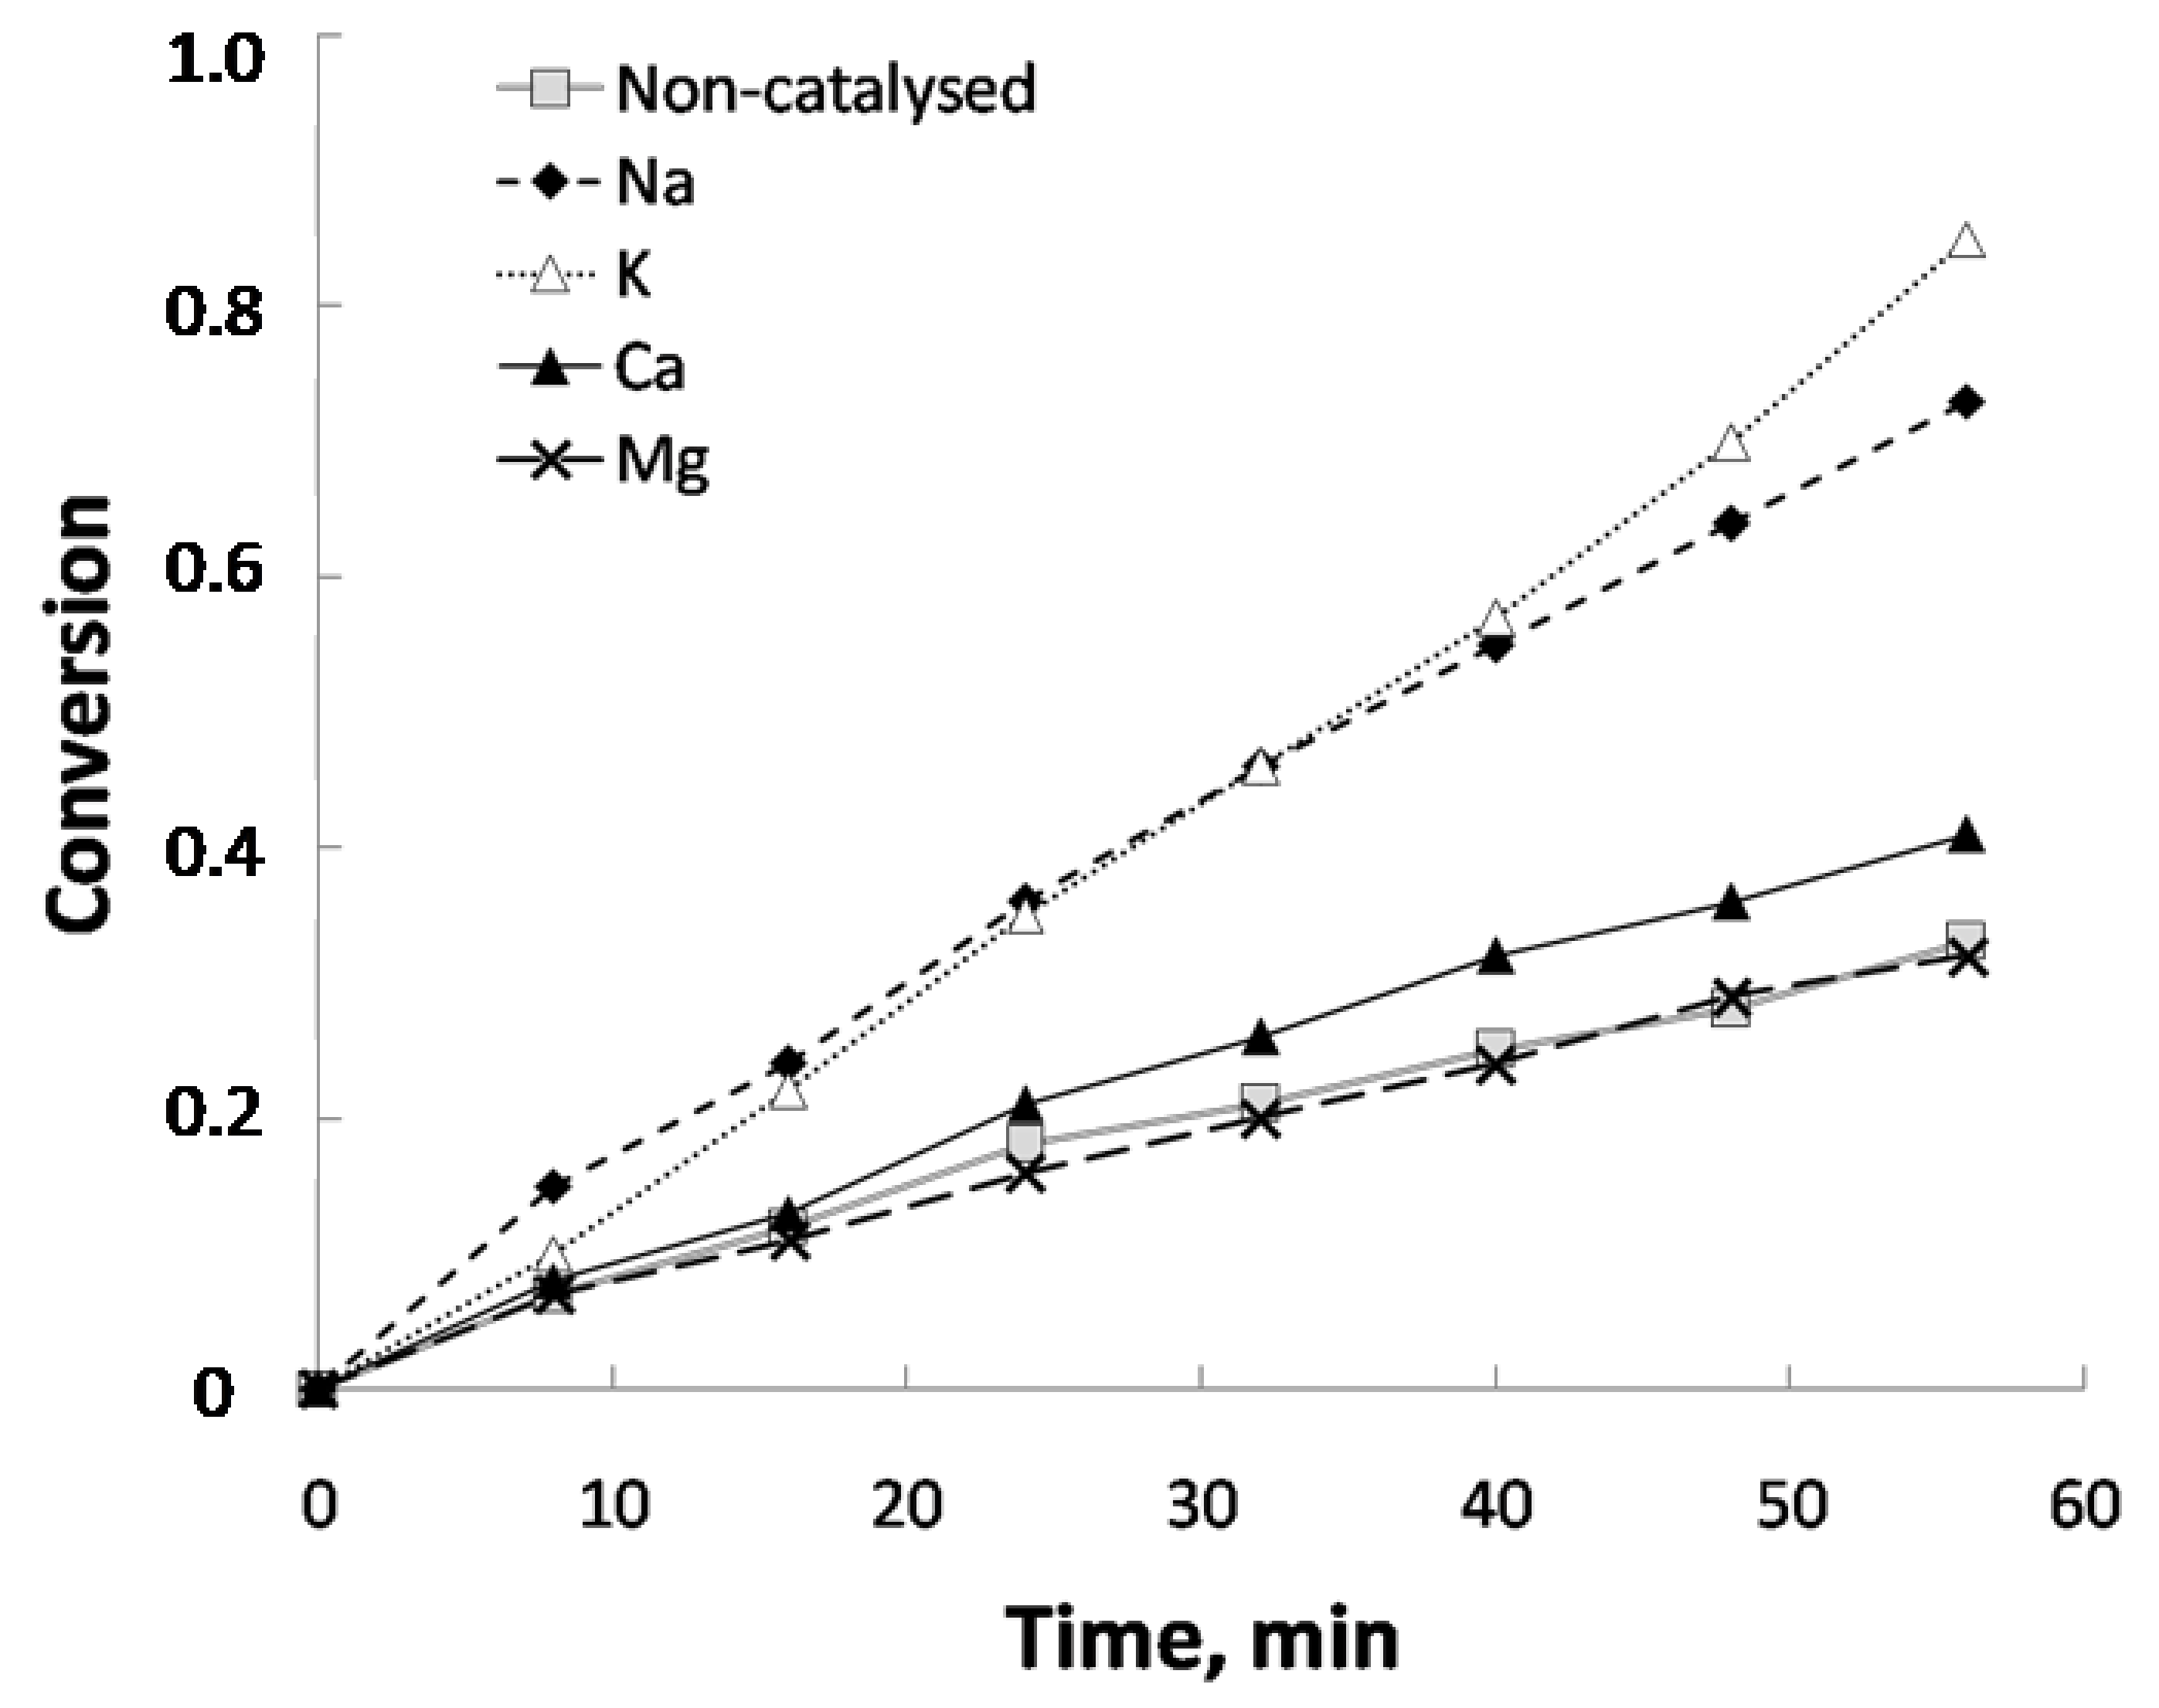
Figure 1 and Table 1 show the influence of the cationic part on conversion and mole generation over reaction time, respectively. As it can be seen, catalysts with Na and K were the most effective ones, with a similar behavior. In contrast, Ca and Mg showed lower values. Concerning Mg, mole generation was lower than in the case of control sample. The higher effectiveness of Na and K can be due, firstly, to the high solubility of the corresponding salts used as precursors for sample impregnation. On the contrary, Ca and Mg carbonates, as it is well known, are basically insoluble. As the results obtained with Na and K are similar, and taking into account that sodium salts are much cheaper than potassium salts, the former was selected to carry out the study of the effect of the anionic part, whose results are shown in
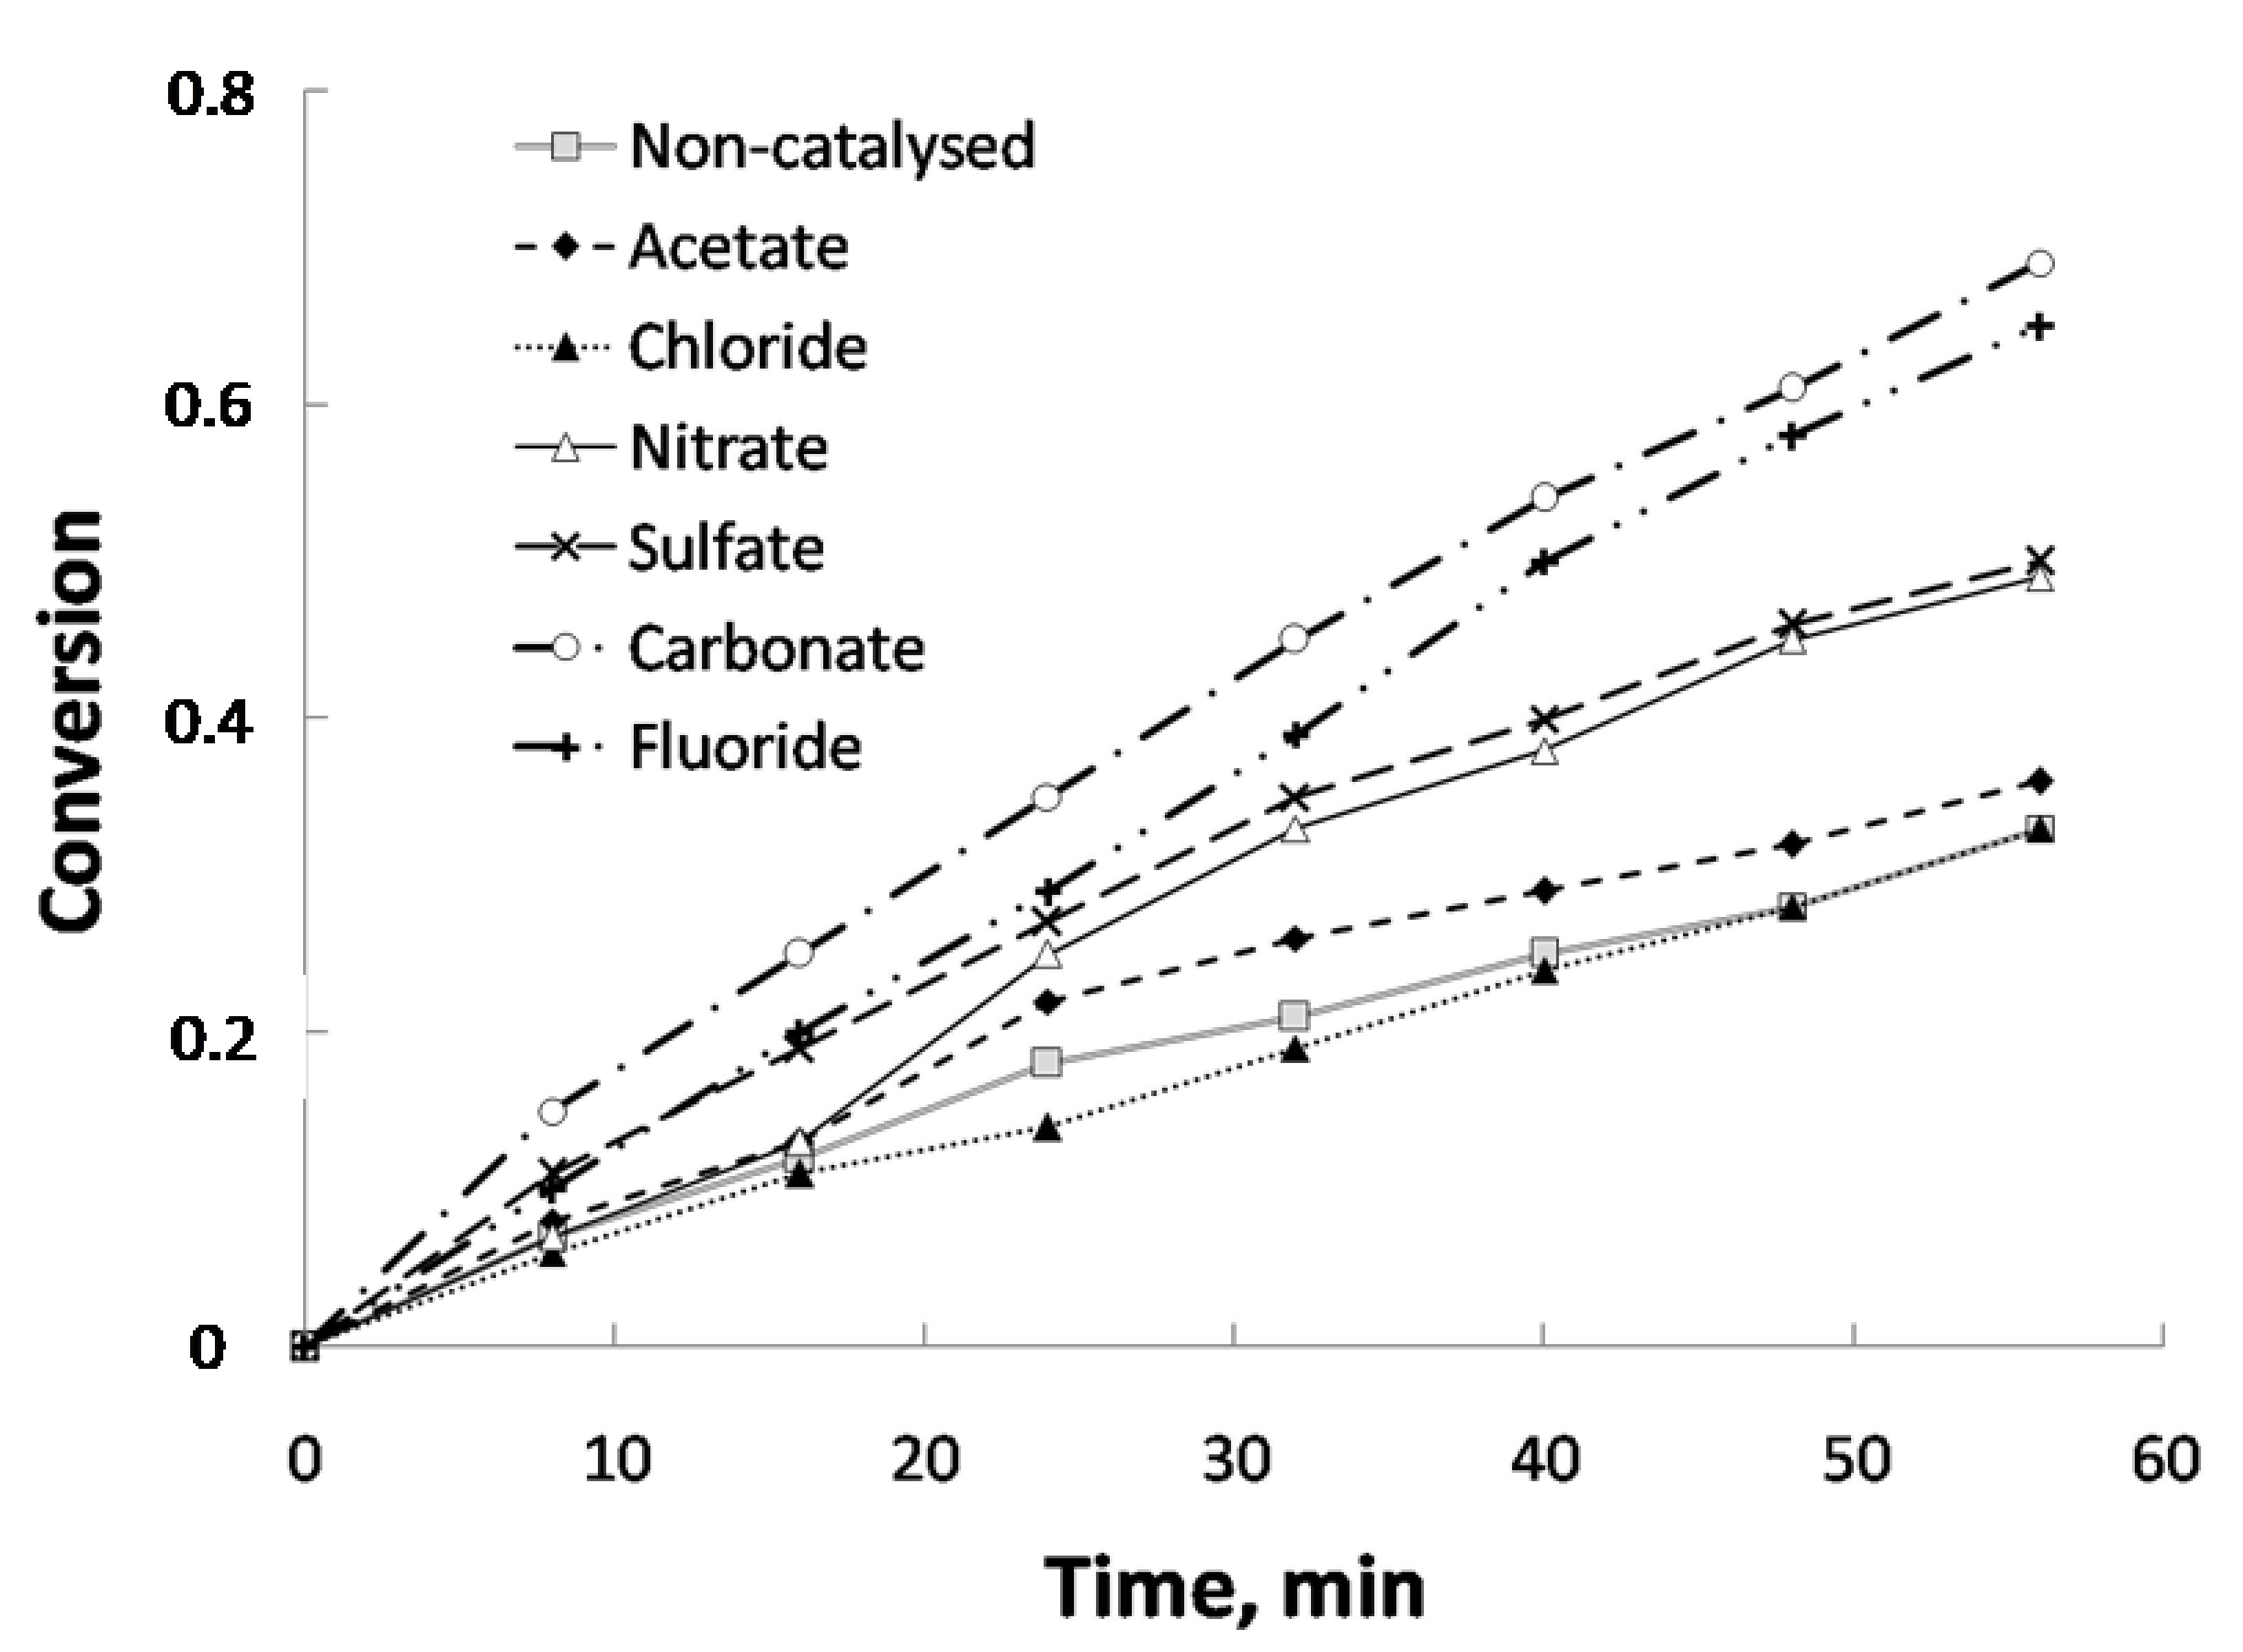
 Figure 2 and Table 2. It can be observed that sodium carbonate showed the best results, followed by sodium fluoride. Sulfate and nitrate showed medium values and, finally, chloride and acetate provoked conversion values that were similar to those of the control sample. As a consequence, and considering the two set of experiments carried out and cost considerations (for a possible commercial use), sodium carbonate was chosen as the most suitable catalyst for the study of the influence of the rest of operating variables. Apart from solubility (which was already commented), the best behavior for sodium carbonate could be related to its basicity. Indeed, according to Wen [26], during the reaction of carbonate, complexes that are electron donor-acceptor can be generated, which are able to absorb gas and can react with H2O to form an intermediate product that in turn, reacts with CO to regenerate carbonate. In that sense, Otsuka and Tomita [27] proposed a cyclical mechanism carbonate-oxide from which they justify the catalytic activity of different cations based on their ease of exchange between carbonate and oxide. This exchange, which is favored by the solubility of the precursor salt, is easier for alkaline metals (Na and K) than in the case of alkaline earth metals (Mg and Ca). In addition, concerning Mg, this exchange is negligible due to the instability of MgCO3 at the temperatures at which the experiments were carried out. Conversion (Figure 1) and gas generation results (Table 1) seem to align with the basicity of cations, as conversion and gas generation were similar for Na and K, whereas for Ca both parameters decreased and in the case of Mg, due to the abovementioned reasons, did not show any catalytic activity.

2.3. Influence of Temperature

Five experiments at different temperatures (between 700 and 900 °C) were carried out, with an initial mass of around 500 mg and steam and nitrogen partial pressures of 0.51 and 0.49 atm, respectively. The catalyst used was sodium carbonate and its concentration was 5% w/w.
Table 3 shows the influence of temperature on mole generation at the end of the experiment, including a mass balance. Mole generation was variable and, as it can be observed, mole accumulation increased with temperature, especially in the case of hydrogen. Another remarkable fact was the increase in CO/CO2 ratio, which points out a lower carbon dioxide generation at high temperatures. Consequently, temperature had a positive effect up to 850 °C. Surprisingly enough, there was a decrease in gas generation at 900 °C. This could be explained by the fact that the melting point of sodium carbonate takes place at 1127 K (854 °C) and, as it is known, it also implies decomposition of the salt. As a consequence, the melting and thermal decomposition of this salt implied a catalytic activity loss, showing a reaction rate similar to control samples. Under these circumstances, the experiment at 900 °C was ruled out for the following study, due to the poor performance of the catalyst at that temperature. According to the reasoning followed from Equation (1) to Equation (4), Equation (5) was obtained, from which ∆H2 was calculated.
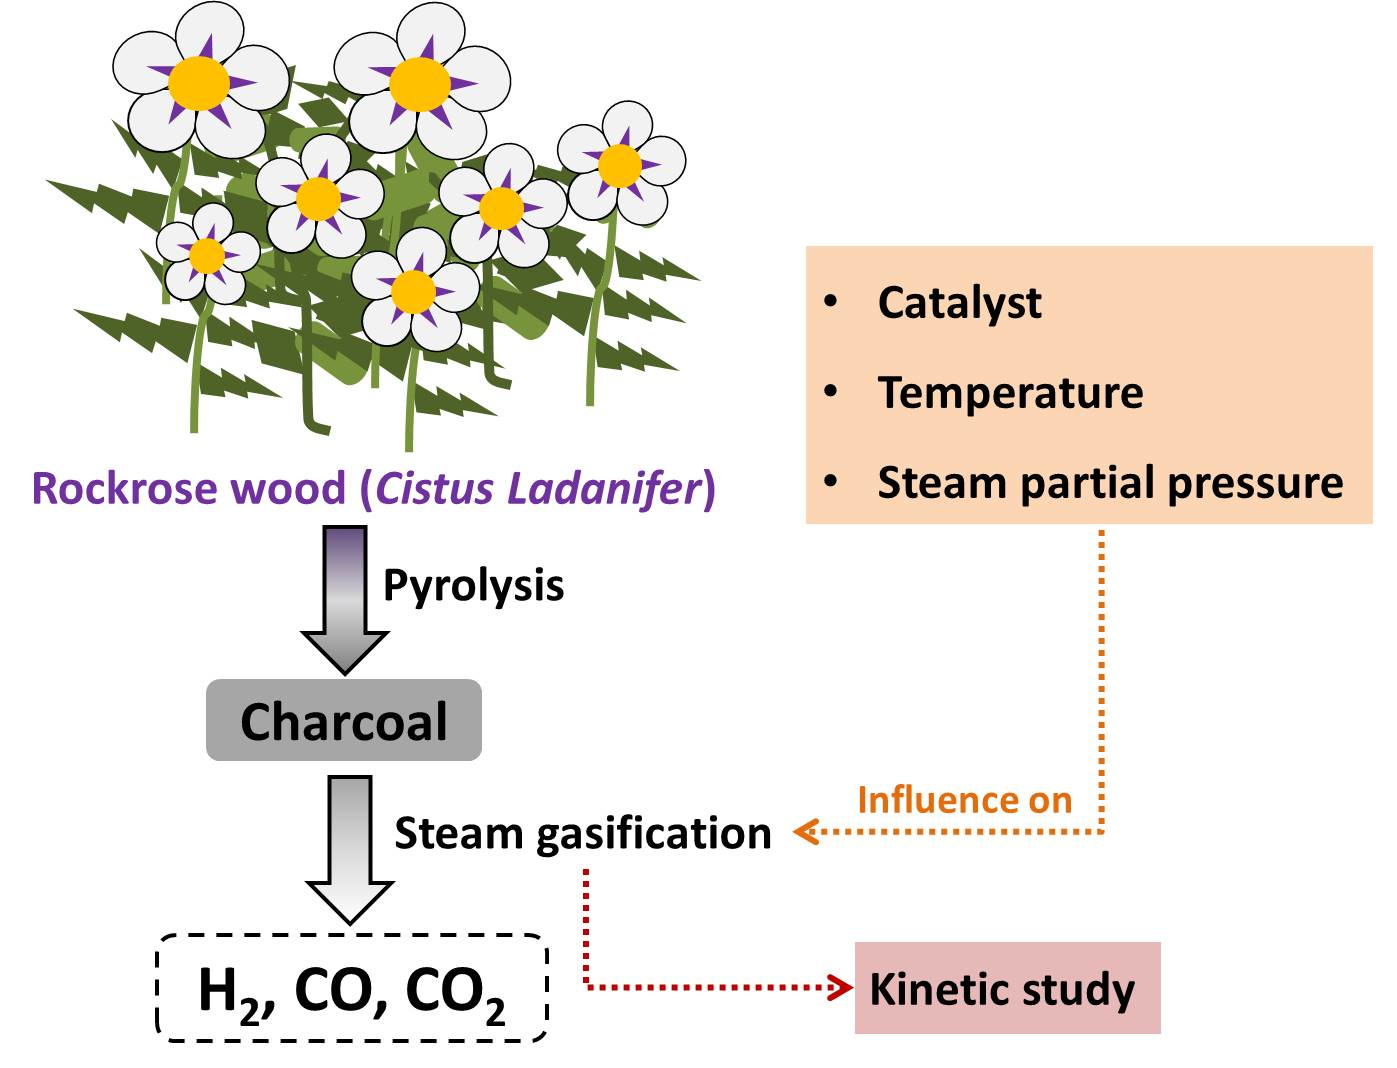
The basic reaction of the carbon-steam system is the one shown in Equation (1).On the other hand, initially, three important reactions should be considered: water gas shift reaction (2), carbon monoxide methanation (3) and biochar hydrogasification (4). Considering the results obtained, it can be stated that reaction (3) and (4) did not take place under these experimental conditions, as methane was not detected in the evolved gases obtained in no case. Other reactions, such asthe Boudouard equilibrium reaction (2CO ⇆ CO2 +C), could not take place if experimental conditions and high steam partial pressures are considered [11]. In that sense, it should be taken into account that steam partial pressure at the experimental conditions used in this experience were around 0.5 atm, and the partial pressures of CO and CO2 were around 0.05 atm. In addition, the Boudouard reaction is exothermic. Therefore, at the reaction temperatures of these experiments (around 1000 K) the balance will shift in CO production. Thus, considering the above, andtaking into account the considerable amounts of CO and CO2, it is clear that both reactions described in Equations (1) and (2) are the main reactions in the process, and their importance depended on the experimental conditions used.
C + H2O ⮀ CO + H2ΔH = 130.29 kJ
CO + H2O ⮀ CO2 +H2ΔH = −40.38 kJ
CO + 3H2 ⮀ CH4 + H2O
C + 2H2 ⮀ CH4
Considering Equations (1) and (2), and taking into account the stoichiometric ratio of H2, CO and CO2, Equation (5) was obtained. Thus, considering that according to Equation (1), “n” moles of CO and “n” moles of H2 are generated; and supposing that from “n” moles of CO generated in Equation (1), “x” CO moles react according to Equation (2) and, as a consequence, “x” moles of CO2 and “x” moles of H2 are generated; in the chemical balance there would be “n + x” moles of H2 (generated in Equations (1) and (2)), “x” moles of CO2 (generated in Equation (2)) and “nx” moles of CO (generated in Equation (1) minus the moles reacting in Equation (2)). Thus, Equation (5) is obtained, as follows:
Moles of H2 (n + x) = Moles of CO (nx) + 2·moles of CO2 (2·x)
According to this equation a gas balance can be established, which should be fulfilled in the absence of other reactions. In that sense, Table 3 shows the results of this balance for the set of experiments considered. It can be observed that the balance was reasonably fulfilled, not showing for the worst case (850 °C) an error of 4%. Consequently, these results seemed to confirm that Reactions (1) and (2) took place in the process, almost exclusively. Concerning these two reactions, CO/CO2 mole ratio evolution with temperature can provide information about the relative importance of both. As it was commented, this ratio increased with temperature. Thus, according to the values shown in Table 3, the abovementioned ratio went from 1 at 700 °C to a range between 3 and 4 for higher temperatures. These results seemed to indicate that at low temperatures, Reaction (2) would shift to carbon dioxide production and, as a consequence, the CO generated in Reaction (1) would be converted to generate CO2 and H2. At high temperatures, and due to the exothermic nature of Reaction (2), the chemical equilibrium would shift toward carbon monoxide production, showing a certain composition of both gases.
Regardless the theoretical considerations previously stated and the kinetic study (that will be discussed later on), one of the aims of biochar gasification, from a practical point of view, is the production of gases for their energy use. Table 4 shows a wide range of results concerning conversion, gas production and their corresponding high heating values. As observed, there was a considerable increase in gas yield and conversion with temperature, which is in accordance with the relationship between temperature and reaction rate.
Regarding high heating values (in dry bases and nitrogen-free conditions), when the calculation basis was m3 N, the results slightly differed among themselves. When the calculation basis was 1 kg of biochar fed, high heating values considerably increased with temperature as a consequence of the increase in gas yield. Finally, with the calculation basis of 1 kg of biochar converted, gas yield showed slight changes, without a defined trend. Obviously, the latter values corresponded to the highest energy that could be obtained from the evolved gases during the gasification process, as it was defined for a conversion of 100%.
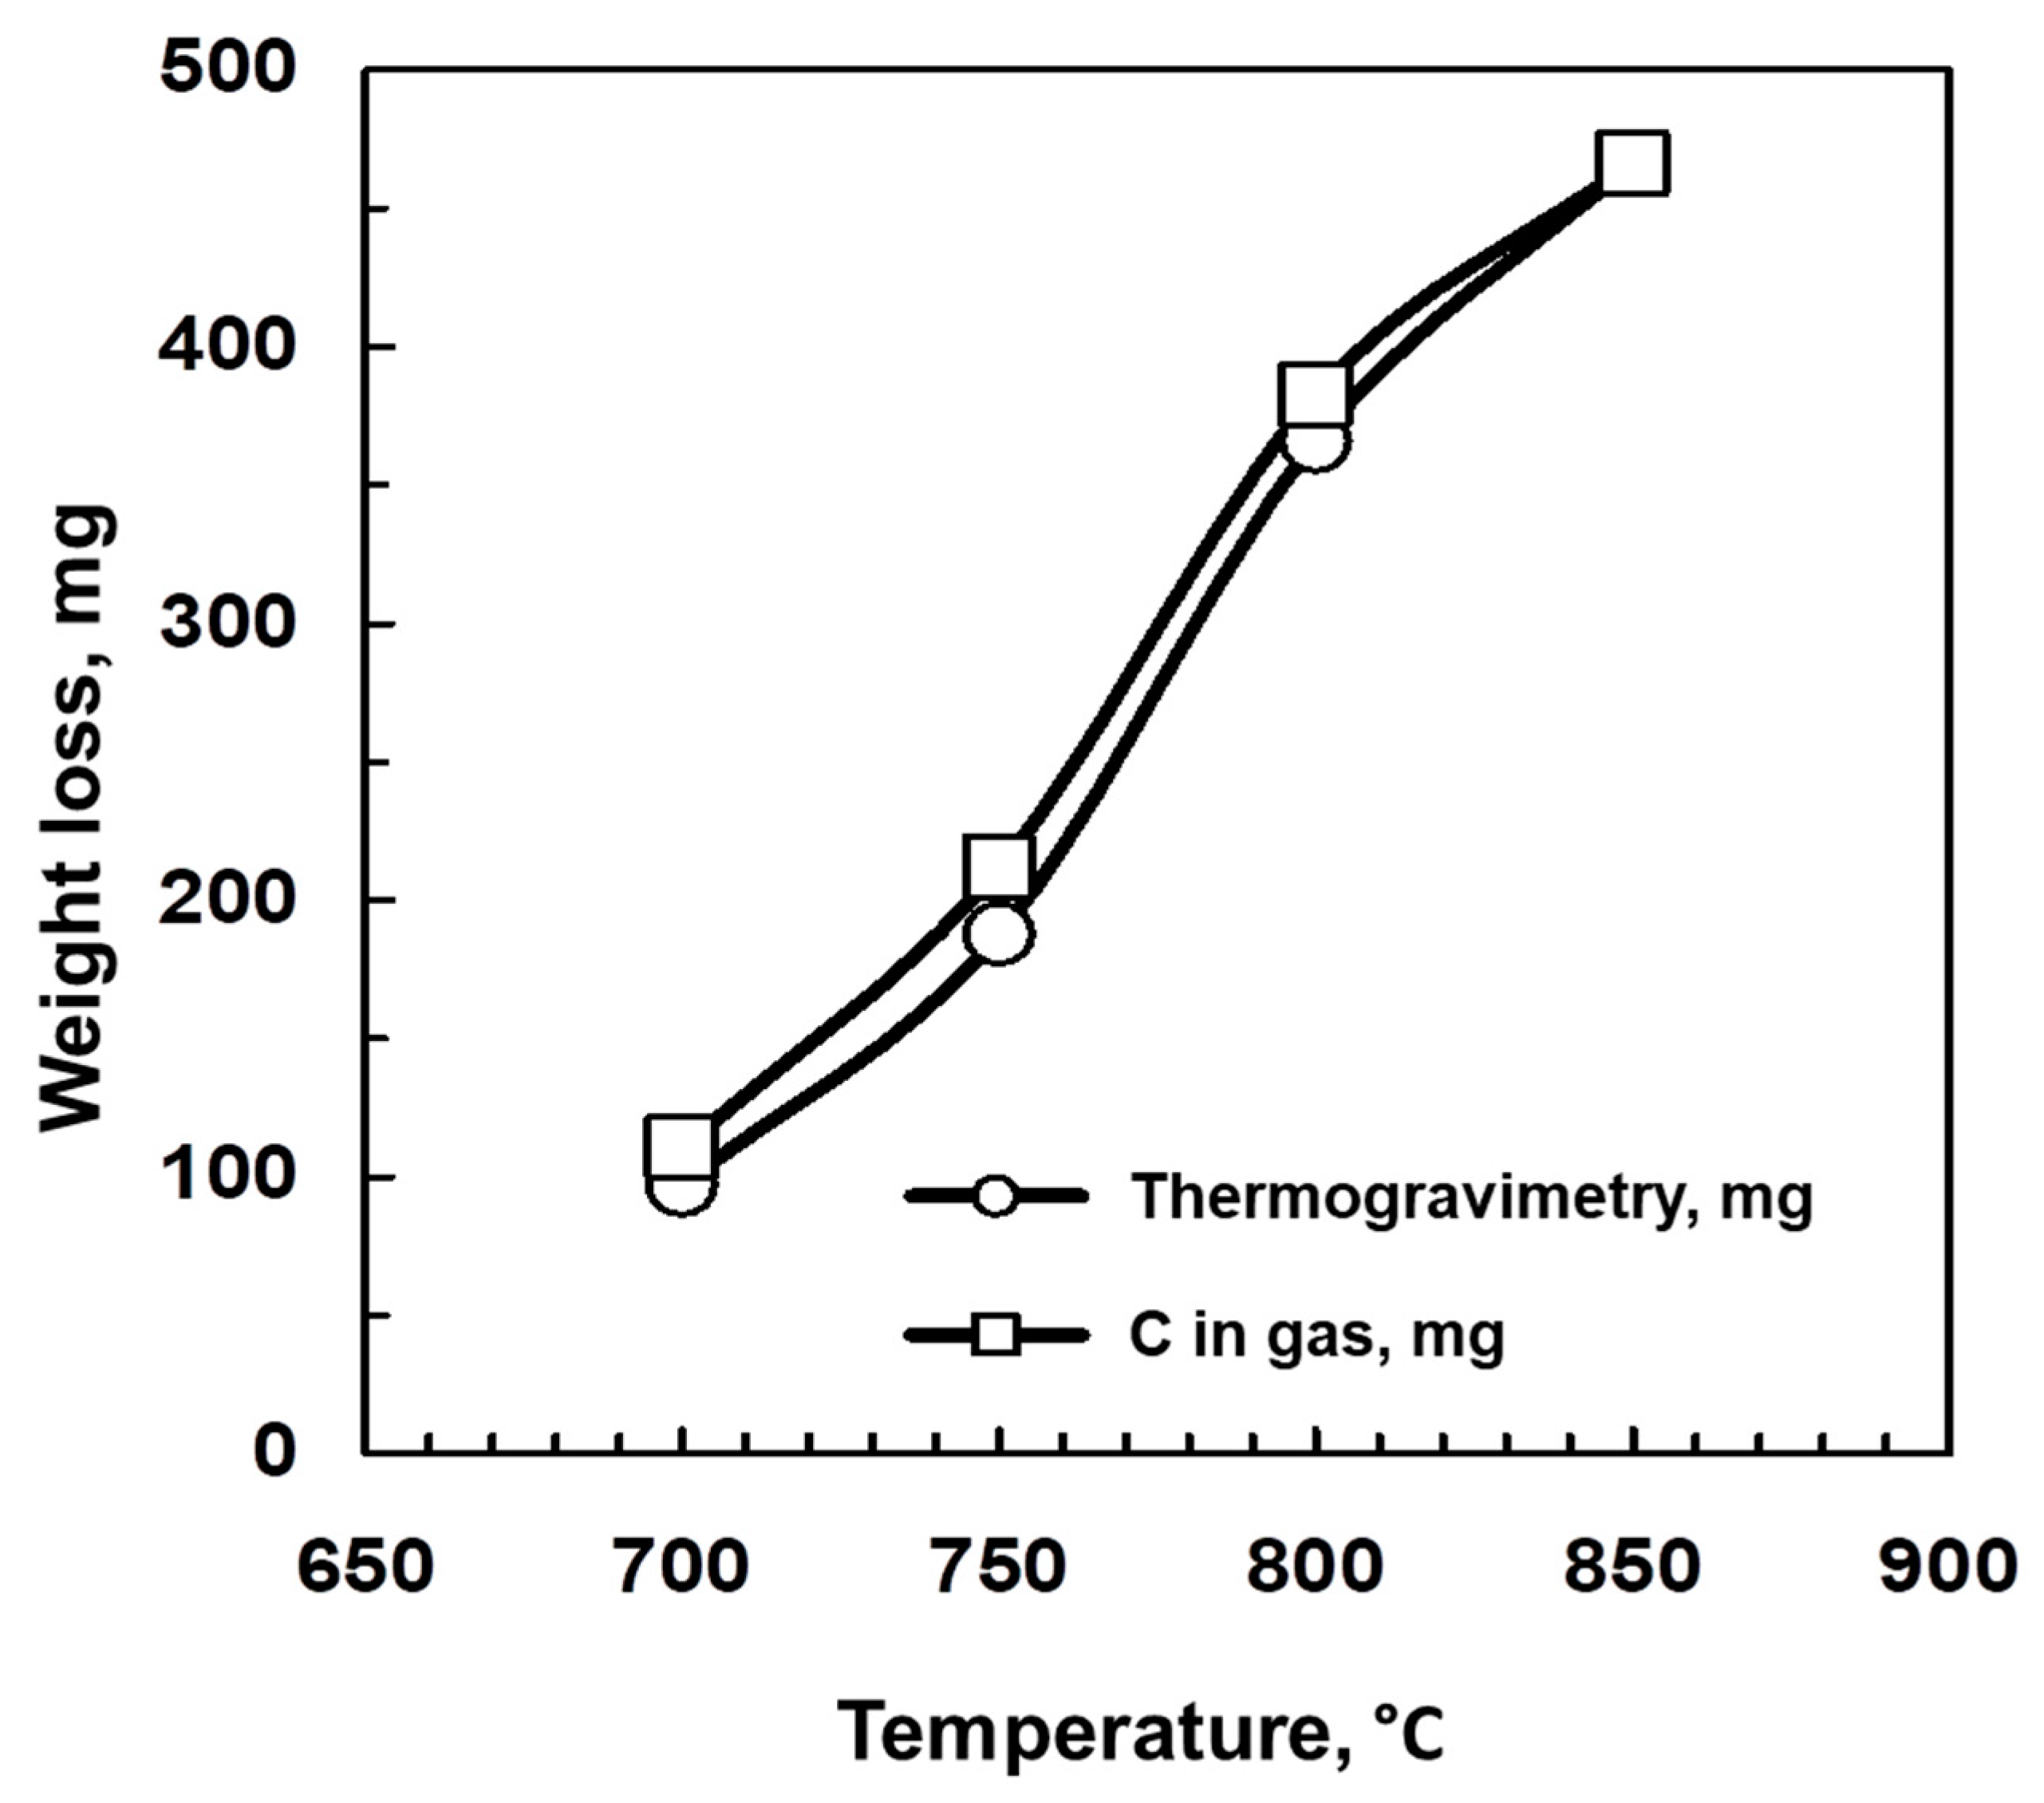
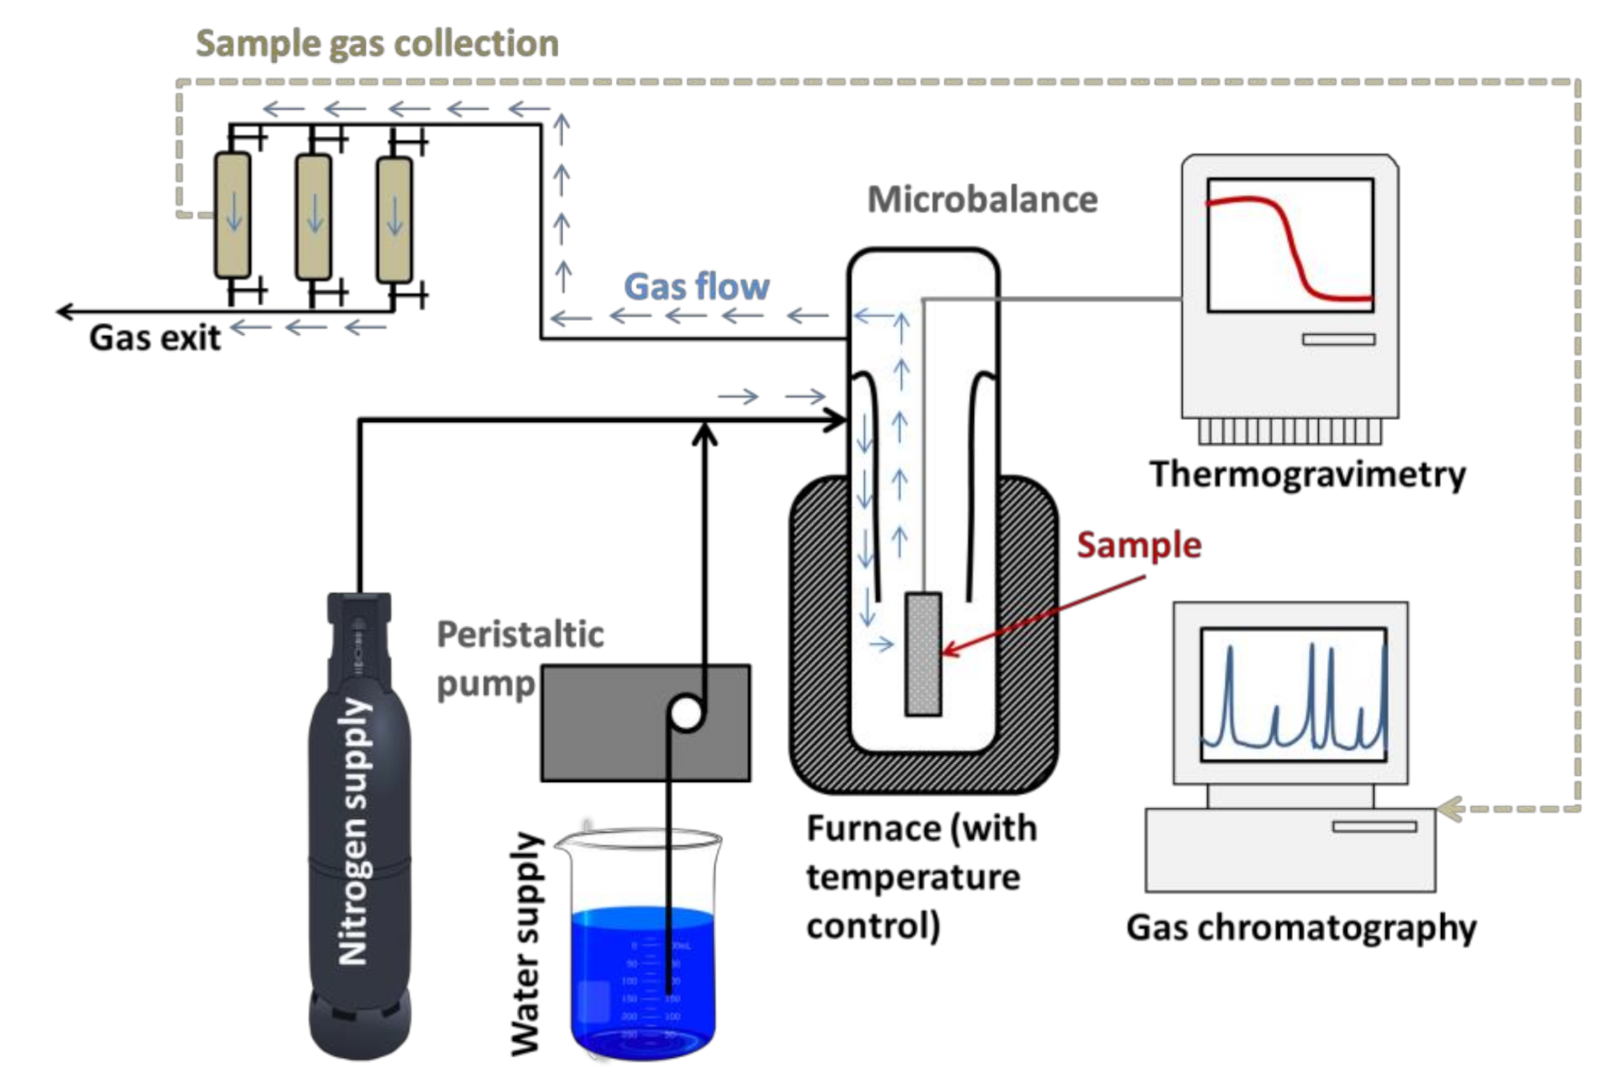
Concerning the influence of temperature on the material balance of the process, this balance can be established taking into account thermogravimetric or gas composition data. Weight loss through thermogravimetry has been calculated as the difference between the initial weight of biochar and its weight at a certain time of reaction. On the other hand, weight loss through gas composition was calculated as follows: Considering that there are no volatile compounds in the initial biochar, its weight loss should be related to the difference between the initial biochar mass and C mass contained in CO and CO2 evolved. Thus, it should be taken into account, for each reaction time, the accumulated moles of CO and CO2 that have been evolved, and determine the mass of C contained in these moles. These amounts can be determined at different reaction times through gas chromatography. In Figure 3, a comparison between both data sets is shown. As it can be noted, the balance was fulfilled for all the temperature values, and both curves almost overlapped.

2.4. Influence of Catalyst Concentration

Five experiments were carried out, using sodium carbonate as a catalyst, at different concentrations (from 2.5 to 10% w/w). The reaction temperature was kept at 800 °C, and the steam partial pressure was 0.51 atm. Table 5 shows the gas generation at the end of the experiment and the corresponding material balance.
After considering the results in Table 5, a positive effect of catalyst concentration was observed up to 5%. For the experiments carried out at 7% and 10%, lower values were obtained. In effect, a saturation effect could have taken place, due to the pore obstruction by the catalyst, making the access of steam to biochar difficult and, subsequently, decreasing the reaction rate [12,13]. As a consequence, for this study, it was assumed that the optimum catalyst concentration was 5%, choosing this value to carry out further experiments. Notwithstanding the above, the catalyst effect was positive in all cases, exceeding the moles generated in the control sample (non-catalyzed). Concerning the gas balance, it was reasonably fulfilled in all cases; even in the most unfavorable conditions (catalyst concentration of 7.5 and 10%) the errors did not exceed 6 or 7%.

2.5. Influence of Steam Partial Pressure

Four experiments with different steam partial pressures (from 0.23 to 0.58 atm) were carried out. These steam partial pressureswere achieved by mixing known water and nitrogen flows, which were vaporized. Nitrogen flow was for all cases 50 mL/min, whereas steam flow was variable (15–50 mL·min−1), depending on the partial pressure of the experiment. In any case, the maximum pressure of the gasifier was 1 atm, as the system was open to the atmosphere (as it can be seen in Figure 4).The reaction temperature was 800 °C, using sodium carbonate (5% concentration) as a catalyst.
As expected, steam partial pressure had a positive effect on conversion and, therefore, in gas generation. In Table 6 the mole generation for H2, CO and CO2 at the end of the experiment is shown. Also, the results of the mole balance obtained by using Equation (5) are shown. Thus, an increase in mole generation was observed with steam partial pressure. This increase was different depending on the gas used.CO mole generation considerably increased at low steam partial pressures, stabilizing at high values, whereas the increase in CO2 generation was steady with steam partial pressure. This fact points out the growing importance of Reaction (2) (water gas shift) as steam partial pressure rose. Regarding mole balance, it can be observed that it is fulfilled in all cases, not exceeding an error of 3%. As a consequence, Reactions (1) and (2) were, again, involved in the process. In both reactions, water acts as a reagent and, therefore, an increase in its partial pressure makes that the reaction shifts toward product generation, i.e., H2 production is increased.
Table 7 shows the data corresponding to the influence of steam partial pressure. As can be seen, a considerable increase in conversion and gas yield was produced with steam partial pressure when the biochar fed was considered. The result is logical, and it is in accordance with the increase in reaction rate when the concentration of one of the reactants is increased (steam in this case). When converted biochar is considered, the differences are not significant and this fact can be due to the slight changes observed for the evolved gas.
Concerning the high heating values (again, in dry basis and nitrogen-free conditions), a behavior similar to the experiments about the influence of temperature was observed. Thus, when the calculation basis was 1 m3N, the values were very similar, which points out that gas composition hardly changed with steam partial pressure. When biochar fed was considered to be the basis, the changes in HHV were significant and it was due to the higher gas generation, i.e., the higher conversion of the process. Finally, compared to a kg of biochar converted, the differences were not excessively significant.
The mass balance obtained by weight loss (through thermogravimetry) and by the carbon mass from the evolved gases (CO and CO2) was fulfilled, showing characteristics that were similar to those inferred from the experiments about the influence of temperature.

2.6. Kinetic Study of the Process

Gasification is usually considered to be an irreversible reaction. When it comes to solids with high ash content it can be assumed, as a first approximation that the particle size remains constant during the process. Under this circumstance (constant particle size), two models are usually applied: the shrinking core model and the uniform conversion model. On the other hand, in very porous solids or with low ash content, the particle volume decreases during the reaction, giving rise the shrinking particle model (leaching) [28,29]. Table 8 shows the equations for these models (Equations (6)–(10)), pointing out the main stage and the meaning of the slope. As it can be seen, only two of them (Shrinking core model with prevalence of the chemical reaction, Equation (7) and the uniform conversion model with prevalence of the chemical reaction, Equation (9)) corresponded to real kinetic constants. In the rest of cases, the parameter in the presenting expressions was the mass transfer coefficient, kg, (Equations (6) and (10)) or diffusivity, De, (Equation (8)). Also, as it can be observed, catalyst concentration was included in all the equations, with an order of reaction “n”. As one of the aims of this study was to determine the real kinetic constants and compare them with the obtained ones through the use of the real model that is proposed later, Equations (7) and (9) would be especially considered.
The above-mentioned equations were ideal models that imply the presence of individual particles in contact with the reagent gas. However, in order to use the most suitable model, it should be taken into account both the nature of the raw material and the reactor used to determine the way of contact in the gas-solid reaction. For this reason, in the present research work, another model has been used, taking into account these circumstances and checking its results in previous studies [
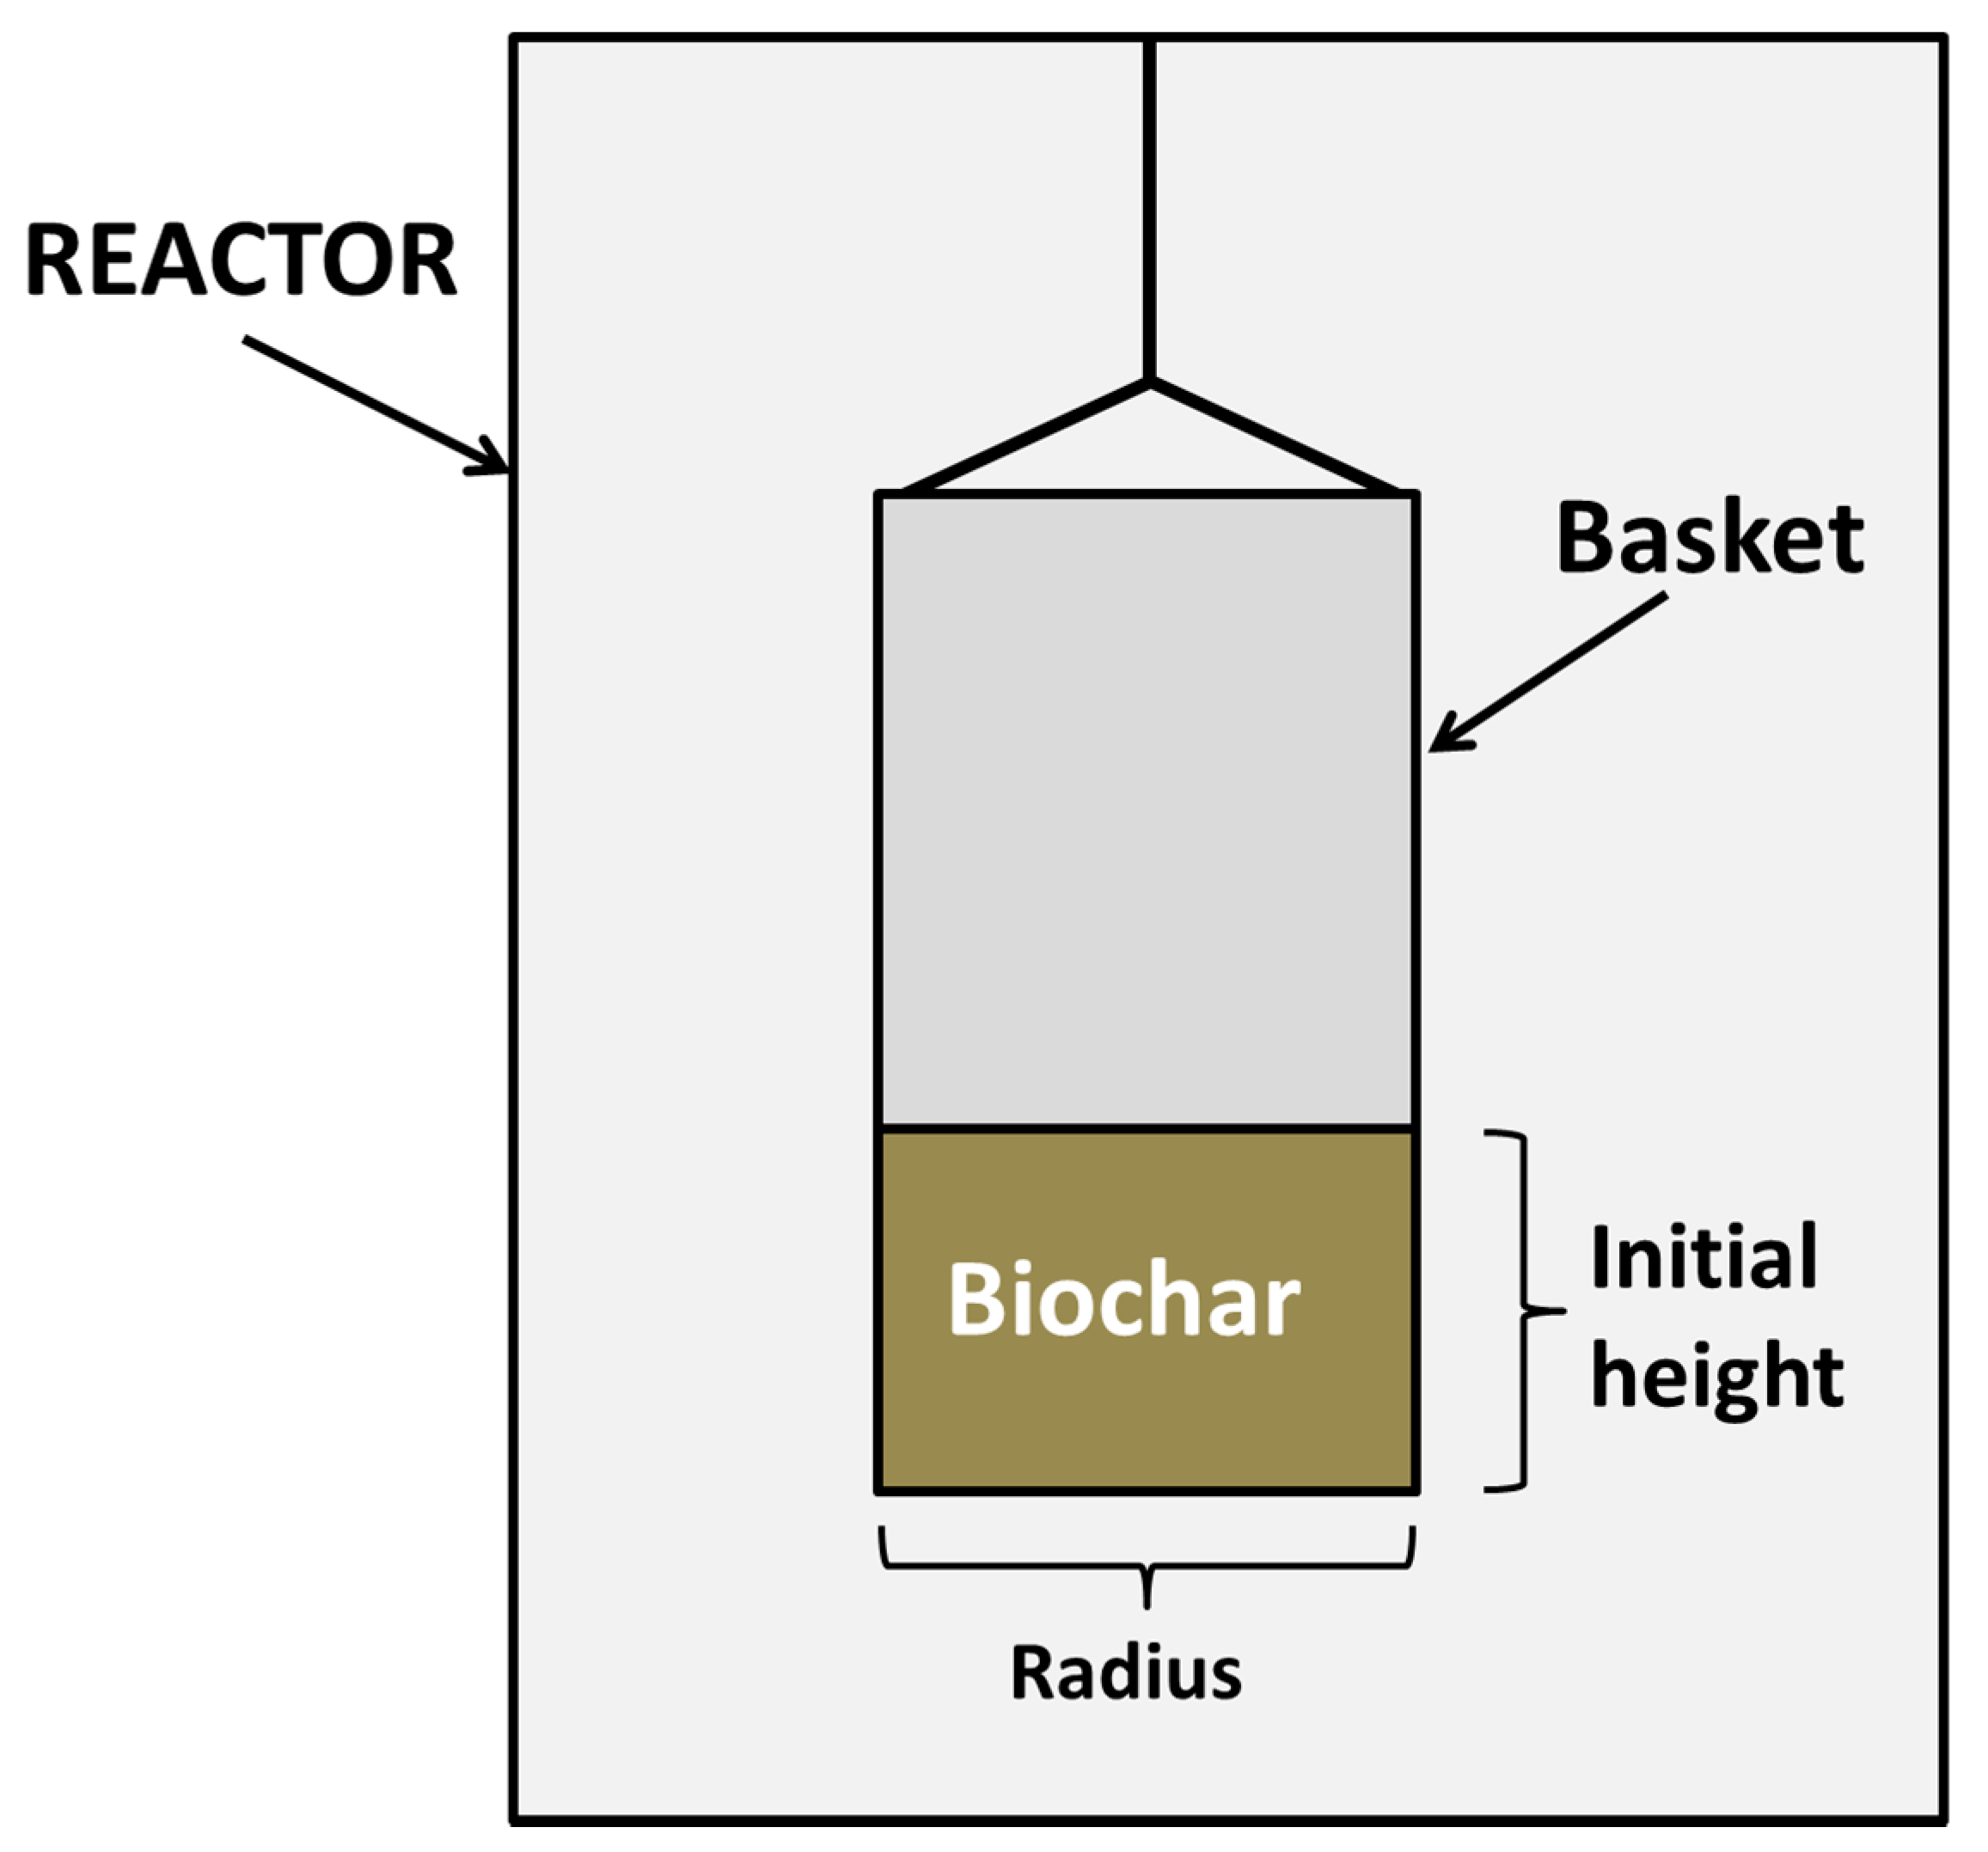
23]. This model assumes that the particle bed behaves like a macro-particle and that the reaction mainly takes place in the surface of the bed. This model is represented in Equation (11), where XB is the conversion of the solid, t is reaction time, τ is the time for a complete conversion, and ξ is a dimensionless parameter that represents the relationship between the initial height of the bed and its radius, as it was indicated in the literature [23] and in Figure 4.
l n 1 ξ 1 ξ X B = l n 1 + ξ τ t    
Down below, the most representative results obtained by the use of these models are commented.

2.6.1. Ideal Models of Gas-Solid Reaction

The ideal reaction models specified in Table 8 were applied to all the experiments. To sum up, Table 9 shows the slopes of the lines obtained by least squares adjustment for the data with different temperature values. As previously commented, data corresponding to 900 °C were ruled out due to the problems related to catalyst decomposition. Similarly, the results corresponding to the shrinking core model with prevalence of diffusion in ashes were removed due to the poor correlation coefficients obtained. Also, the average correlation coefficient was determined. According to these data, the shrinking core model with prevalence of the chemical reaction or the shrinking particle model with prevalence of the chemical reaction (Equation (7)), along with the uniform conversion model with prevalence of the chemical reaction (Equation (10)) seemed to offer the poorest results.
As it was pointed out in Table 8, only for the models that imply control of the chemical reaction can establish a relationship between the slope and the corresponding kinetic constants.For the remaining cases, the constants implied were mass transfer coefficients, diffusivities, etc. When it comes to kinetic coefficients, their evolution with temperature should adjust to the Arrhenius equation, whereas for the mass transfer and diffusivity coefficients that adjustment would not be possible. To check that assumption, Table 10 shows the results about the adjustment to the Arrhenius equation for the experiments corresponding to Table 9. Paradoxically, in all cases a good adjustment was found, according to the correlation coefficients. On the other hand, the activation energies for chemical reaction control models, showed order of reaction values that were typical of a chemical reaction.
The use of ideal models for the experiments where steam partial pressure changed did not offer any remarkable results. In general, data adjustment offered increasing slopes with partial pressure and correlation coefficients around the unit in all cases. From experimental data it can be said that the order of reaction for steam was the unit.
Also, the ideal models were applied to the experiments with different catalyst concentrations. The adjustment of the lines confirmed the results commented in the study of the influence of operating variables. Thus, the slopes increased up to a catalyst concentration of 5%, i.e., the limit from which a saturation effect was observed. This fact makes the determination of the order of reaction for the catalyst was difficult, as few experimental points can be effectively used for least squares adjustment.

2.6.2. Proposed Model

The ideal models for gas-solid reaction imply the presence of individual particles in contact with the reagent gas. This situation is different from the one taking place in the gas-solid reactor used in this study. For this reason, we have proposed a model, obtaining Equation (11) which might adapt to the real situation taking place in the reactor. According to this equation, a depiction of it should imply lines passing through the origin, with a slope that equals to –ln(1 + ξ)/τ. Table 11 show the results obtained by least squares, for the experiments with different reaction temperatures. As observed, considering the correlation coefficients, data fit the proposed model.
The relationship between the slope of the obtained lines (in absolute value) and the kinetic parameters of the system is given by Equation (12), a model which was previously used for other wastes like eucalyptus char, offering good results [23]:
ln 1 + ξ τ = b k s C A g n C a t n 0 ρ B r 2 = A k s C a t n 0    
where b is a stoichiometric coefficient, ks is the kinetic coefficient, CAg is steam concentration, n is the order of reaction for steam, ρB is the molar density of carbon in rockrose biochar, r is the radius of the small basket and [Cat]nc is the catalyst concentration with an order of reaction “n.c”.
When the process was controlled by the chemical reaction, ks is a real kinetic constant and therefore Equation (13) can be used. Replacing Equation (13) in Equation (12), and using napierian logarithms, Equation (14) was obtained, whose representation allows calculating the activation energy of the process. For the latter equation, all the constants in Equation (12) were grouped in A, along with all the variables that were kept constant in this experimental set.
k s = k s 0 e E / R T
l n ln 1 + ξ τ = l n A k s 0   E R 1 T  
Once the corresponding adjustments to Equation (14) were carried out for the experiments with temperature changes, the results obtained were the following: slope, 15,855; intercept: 10.38; correlation coefficient, 0.986. Thus, an activation energy of 131.2 kJ/mol was obtained. This value could be considered, along with those obtained by the ideal models, logical and typical for a chemical reaction.
The use of the proposed model for the experiments depending on steam partial pressure pointed out its good verification, obtaining lines with excellent correlation coefficients. From the corresponding slopes it was possible to obtain the order of reaction for steam. For this determination, Equation (12) was modified taking into account that for these experiments ks was constant (because temperature was kept constant) and that there was proportionality between steam concentration and its partial pressure. This way, Equation (15) was obtained, where k is a constant that groups other constants and P is the steam partial pressure.
ln 1 + ξ τ = b k s C A g n C a t n 0 ρ B r / 2 = k P A g n
Through the representation of Equation (15), the order of reaction calculated for steam was 1.2, i.e., slightly higher than the unit.
The use of the proposed model in the experiments where catalyst concentration changed showed similar results to those obtained by using the ideal models. Indeed, with the corresponding adjustments, the slopes of the lines obtained increased up to a catalyst concentration of 5%. Afterwards, these slopes, as a consequence of the obstruction effect, decreased. The adjustment by napierian (or natural) logarithms (both for the slope and catalyst concentration) allowed to obtain the order of reaction (that is, 1.22).

3. Materials and Methods

3.1. Apparatus and Procedure

The experimental facility used in this study (a cylindrical gasifier with an independent steam generator) was described in previous research works [30] and basically corresponds to a downdraft gasifier. It consisted of a microbalance (CI Electronic Limited MK-2) and a vertical tubular furnace with the corresponding heating and temperature control systems. The microbalance was connected to a computer through an RS-232 interface, in order to store weight loss data and to control temperature with a thermocouple type K, an analog/digital converter (PC-ADDA-12) and a power unit. The feed system for steam consisted of a peristaltic pump that fed water to a steam generator (a thermostatic bath with a serpentine where water vaporized). The steam current was mixed with a nitrogen flow, obtaining the desired steam partial pressure, and it was introduced to the quartz reactor of the microbalance through a cooper pipe which was externally heated to avoid condensation.
All the experiments were carried out by using dehydrated samples, prepared as it was indicated in the following section, placing the samples in a small stainless steel basket, with a mesh size of 0.4 mm, hanging on the balance beam.
Once the temperature of the experiment and the nitrogen flow were established, the system was stabilized to remove moisture and volatile compounds, i.e., until the weight of the sample was constant. Once the steady state was achieved, the experiment started by introducing steam with the corresponding flow. Weight loss data during gasification were recorded every 10 s for 60 min. These data were used to obtain TG and different kinetic parameters of the process. Also, from these data it is possible to determine the conversion of the process, defined as (m0 − mt)/(m0 − ma), where mois the initial mass, mtthe mass at a time t and mathe ash mass.
Gas evolved during gasification were analyzed in a gas chromatograph (Varian 3900, Palo Alto, CA, USA), coupled to a thermal conductivity detector (TCD), supplied with a packed column (Carboxen 1000, Sigma Aldrich, St. Louis, MO, USA),60/80 mesh 15 ft length and 1/8 in. internal diameter. Argon was used as a carrier gas, and the column temperature varied from 100 to 200 °C. Based on gas composition, it is possible to calculate the heating value (HHV), taking into account the heat of combustion of each gas. It should be taken into account that HHV is only influenced by two gases: H2and CO. Thus, once the moles evolved for each gas are determined, HHV is given by the following expression:
HHVgases = Nº moles of H2·ΔHCH2 + Nº moles of CO·ΔHCCO
where ΔHCH2 and ΔHCCO are heat combustions of H2 and CO, respectively. Since HHV was determined for different basis, the number of moles is referred to the moles contained in1 m3 N of gas, the moles obtained per kg of biochar fed or the moles obtained per kg of biochar converted.
The quantitative determination of the gases generated has allowed us to calculate the gas yield. This yield is the relationship between the mas of gas evolved (H2, CO and CO2) and the mass of biochar fed or the mass of biochar converted.
The experimental design for this experience was included in Figure 5.

3.2. Rockrose Biochar Production

As it was indicated, the raw material used for all the experiments was biochar from rockrose (CistusLadanifer). These biochars were prepared by pyrolysis of rockrose wood, previously grinded and sieved. The experimental facility for pyrolysis is described in previous research works [31]. Basically, it consisted of a cylindrical stainless steel reactor, designed to work at atmospheric pressure and with all the accessories to control and monitor temperature, gas feed and sampling. Temperature for pyrolysis was in all cases 900 °C and the reaction time was 30 min. This time, according to previous studies, was enough to guarantee the volatile removal for the subsequent gasification experiments. The biochar generated was stored in a desiccator before gasification.

3.3. Catalyst Addition

For the sample preparation through impregnation, aqueous solutions of the corresponding salts (sodium, potassium, calcium, and magnesium carbonates in order to determine the effect of cation; and sodium carbonate, chloride, nitrate, sulfate, and fluoride in order to determine the effect of the anion) were used, using in all cases a reagent of analytical quality. A suitable amount of the corresponding salt was weighted, diluting to 25 mL with distilled water. This solution (or suspension or mixture, depending on the solubility of the salt) was mixed with the suitable amount of biochar for 24 h, through stirring. Afterwards, the solution was evaporated at 80 °C for 24 h. Finally, temperature increased to 110 °C for 12 h and then the impregnated biochar was collected and stored in a desiccator for its subsequent use.
For the sample preparation through mixing, the suitable amounts of biochar and salt were mechanically mixed, storing the resulting mixture in a desiccator.
In both cases, catalyst concentration was expressed in grams of catalyst per 100 g of biochar. To sum up, Figure 6 shows the main experiments carried out for this research study.

4. Conclusions

Concerning the steam gasification of CistusLadaniferbiochar, we found the following:
  • The main product of steam gasification of rockrose biochar consisted of a mixture of gases (H2, CO and CO2, with H2being the majority gas), presenting a high heating value of 10 MJ/m3N.
  • For catalytic steam gasification of rockrose biochar, impregnation was more effective than the simple mixture of biochar and catalyst.
  • The catalytic activity of the different cations used (always used as carbonates) was the following:
    K+>Na+>Ca2+>Mg2+ = Control experiment
  • The catalytic activity of the anions (always as sodium salts) was the following:
    CO3=>F>SO4=>NO3>CH3COO>Cl= Control experiment
  • The catalyst concentration had a positive effect, up to 5%. Above that value, a saturation effect was observed, possibly due to the pore obstruction of the coal by the catalyst.
  • The use of ideal models for the catalytic steam gasification of rockrose biochar showed, in general, good results. From these data, and varying temperature, it was possible to calculate the activation energy of the process (between 136.1 and 158.7 kJ/mol). It was also possible to determine the reaction order regarding steam, showing values close to one, and the reaction order regarding the catalyst was equally close to one.
  • The use of the proposed model for catalytic steam gasification showed good results for all the series carried out. The activation energy obtained in this case was 131.2 kJ/mol and the reaction orders for steam and catalyst was 1.2 in both cases.

Author Contributions

Conceptualization, J.M.E. and J.F.G.; methodology, J.M.E.; validation, J.M.E., J.F.G. and S.N.-D.; formal analysis, J.M.E.; investigation, J.M.E. and S.N.-D.; resources, J.M.E. and J.F.G.; data curation, S.N.-D.; writing—original draft preparation, S.N.-D.; writing—review and editing, J.M.E. and S.N.-D.; visualization, J.M.E., J.F.G. and S.N.-D.; supervision, J.M.E. and J.F.G.; project administration, J.M.E. and J.F.G.; funding acquisition, J.M.E. and J.F.G. All authors have read and agreed to the published version of the manuscript.

Funding

This research was funded by JUNTA DE EXTREMADURA, grant number IPR00A077.

Acknowledgments

We would like to thank the Junta de Extremadura for the financial support.

Conflicts of Interest

The authors declare no conflict of interest.

References

  1. Demirbas, A. Progress and recent trends in biofuels. Prog. Energy Combust. Sci. 2007, 33, 1–18. [Google Scholar]
  2. Singh Siwal, S.; Zhang, Q.; Sun, C.; Thakur, S.; Kumar Gupta, V.; Kumar Thakur, V. Energy production from steam gasification processes and parameters that contemplate in biomass gasifier—A review. Bioresour. Technol. 2020, 297, 122481. [Google Scholar]
  3. Maniatis, K.; Millich, E. Energy from biomass and waste: The contribution of utility scale biomass gasification plants. Biomass Bioenergy 1998, 15, 195–200. [Google Scholar]
  4. Franco, C.; Pinto, F.; Gulyurtlu, I.; Cabrita, I. The study of reactions influencing the biomass steam gasification process☆. Fuel 2003, 82, 835–842. [Google Scholar]
  5. Ramos, M.; Dias, A.P.S.; Puna, J.F.; Gomes, J.; Bordado, J.C. Biodiesel production processes and sustainable raw materials. Energies 2019, 12. [Google Scholar]
  6. Gaurav, N.; Sivasankari, S.; Kiran, G.S.; Ninawe, A.; Selvin, J. Utilization of bioresources for sustainable biofuels: A Review. Renew. Sustain. Energy Rev. 2017, 73, 205–214. [Google Scholar]
  7. Dong, Y.; Borgwardt, R.H. Biomass reactivity in gasification by the hynol process. Energy Fuels 1998, 12, 479–484. [Google Scholar]
  8. Rensfelt, E.; Blomkvist, G.; Eastrom, C.; Engstrom, S.; Esperas, B.G.; Liinanki, L. Basic gasification studies for development of biomass medium-btu gasification processes. Energy From Biomass Wastes 1978, 3, 14–18. [Google Scholar]
  9. Bartocci, P.; Zampilli, M.; Bidini, G.; Fantozzi, F. Hydrogen-rich gas production through steam gasification of charcoal pellet. Appl. Therm. Eng. 2018, 132, 817–823. [Google Scholar]
  10. Dodds, P.E.; Staffell, I.; Hawkes, A.D.; Li, F.; Grünewald, P.; McDowall, W.; Ekins, P. Hydrogen and fuel cell technologies for heating: A review. Int. J. Hydrog. Energy 2015, 40, 2065–2083. [Google Scholar]
  11. Meijer, R.; Kapteijn, F.; Moulijn, J. Kinetics of the alkali-carbonate catalysed gasification of carbon: 3. H2O gasification. Fuel 1994, 73, 723–730. [Google Scholar]
  12. Chin, G.; Guifen, L.; Qushi, D. New approach for gasification of coal char. Fuel 1987, 66, 859–863. [Google Scholar]
  13. Byung Ho Song; Sang Done Kim Catalytic activity of alkali and iron salt mixtures for steam-char gasification. Fuel 1993, 72, 797–803.
  14. Pütün, A.E.; Koçkar, Ö.M.; Yorgun, S.; Gerçel, H.F.; Andresen, J.; Snape, C.E.; Pütün, E. Fixed-bed pyrolysis and hydropyrolysis of sunflower bagasse: Product yields and compositions. Fuel Process. Technol. 1996, 46, 49–62. [Google Scholar]
  15. Gominho, J.; Curt, M.D.; Lourenço, A.; Fernández, J.; Pereira, H. Cynara cardunculus L. as a biomass and multi-purpose crop: A review of 30 years of research. Biomass Bioenergy 2018, 109, 257–275. [Google Scholar]
  16. González, J.F.; Román, S.; Encinar, J.M.; Martínez, G. Pyrolysis of various biomass residues and char utilization for the production of activated carbons. J. Anal. Appl. Pyrolysis 2009, 85, 134–141. [Google Scholar]
  17. He, Q.; McNutt, J.; Yang, J. Utilization of the residual glycerol from biodiesel production for renewable energy generation. Renew. Sustain. Energy Rev. 2017, 71, 63–76. [Google Scholar]
  18. Benjelloun-Mlayah, B.; De Lopez, S.; Delmas, M. Oil and paper pulp from Cynara cardunculus: Preliminary results. Ind. Crops Prod. 1997, 6, 233–236. [Google Scholar]
  19. Barros, L.; Dueñas, M.; Alves, C.T.; Silva, S.; Henriques, M.; Santos-Buelga, C.; Ferreira, I.C.F.R. Antifungal activity and detailed chemical characterization of Cistus ladanifer phenolic extracts. Ind. Crops Prod. 2013, 41, 41–45. [Google Scholar]
  20. Upadhyay, N.; Singh, V.K.; Dwivedy, A.K.; Das, S.; Chaudhari, A.K.; Dubey, N.K. Cistus ladanifer L. essential oil as a plant based preservative against molds infesting oil seeds, aflatoxin B1 secretion, oxidative deterioration and methylglyoxal biosynthesis. Lwt 2018, 92, 395–403. [Google Scholar]
  21. Benali, T.; Bouyahya, A.; Habbadi, K.; Zengin, G.; Khabbach, A.; Achbani, E.H.; Hammani, K. Chemical composition and antibacterial activity of the essential oil and extracts of Cistus ladaniferus subsp. ladanifer and Mentha suaveolens against phytopathogenic bacteria and their ecofriendly management of phytopathogenic bacteria. Biocatal. Agric. Biotechnol. 2020, 28, 101696. [Google Scholar]
  22. Tavares, C.S.; Martins, A.; Miguel, M.G.; Carvalheiro, F.; Duarte, L.C.; Gameiro, J.A.; Figueiredo, A.C.; Roseiro, L.B. Bioproducts from forest biomass II. Bioactive compounds from the steam-distillation by-products of Cupressus lusitanica Mill. and Cistus ladanifer L. wastes. Ind. Crops Prod. 2020, 158, 112991. [Google Scholar]
  23. Encinar, J.M.; González, J.F.; Rodrı́guez, J.J.; Ramiro, M.J. Catalysed and uncatalysed steam gasification of eucalyptus char: Influence of variables and kinetic study. Fuel 2001, 80, 2025–2036. [Google Scholar]
  24. Encinar, J.; González, J.; González, J. Steam gasification of Cynara cardunculus L.: Influence of variables. Fuel Process. Technol. 2002, 75, 27–43. [Google Scholar]
  25. González, J.F.; Ramiro, A.; Sabio, E.; Encinar, J.M.; González, C.M. Hydrogasification of Almond Shell Chars. Influence of Operating Variables and Kinetic Study. Ind. Eng. Chem. Res. 2002, 41, 3557–3565. [Google Scholar]
  26. Wen, W.-Y. Mechanisms of alkali metal catalysis in the gasification of coal, char, or graphite. Catal. Rev. 1980, 22, 1–28. [Google Scholar]
  27. Ostsuka, Y.; Tomita, A. Calcium Yallourn catalysed steam gasif ication of brown coal. Fuel 1986, 65, 1653–1657. [Google Scholar]
  28. Levenspiel, O. Chemical Reaction Engineering, 2nd ed.; Willey: New York, NY, USA, 1973; Volume 19, ISBN 978-0-471-25424-9. [Google Scholar]
  29. Shufen, L.; Ruizheng, S. Kinetic studies of a lignite char pressurized gasification with CO2, H2 and steam. Fuel 1994, 73, 413–416. [Google Scholar]
  30. Encinar, J.M.; Beltrán, F.J.; Ramiro, A.; González, J.F.; Bernalte, A. Combustion kinetics of agricultural wastes. J. Chem. Technol. Biotechnol. 1995, 64, 181–187. [Google Scholar]
  31. Encinar, J.M.; Beltrán, F.J.; Ramiro, A.; González, J.F. Catalyzed pyrolysis of grape and olive bagasse. Influence of catalyst type and chemical treatment. Ind. Eng. Chem. Res. 1997, 36, 4176–4183. [Google Scholar]
Figure 1. Influence of the cationic part of the catalyst (anion used: carbonate; temperature: 800 °C; steam partial pressure: 0.51 atm; catalyst concentration: 5%). Conversion defined as (m0 − mt)/(m0 − ma), where mo is the initial mass, mt the mass at a time t and ma the ash mass.
Catalysts 10 01430 g001
Figure 2. Influence of the anionic part of the catalyst (cation used: sodium; temperature: 800 °C; steam partial pressure: 0.51 atm; catalyst concentration: 5%). Conversion defined as (m0 − mt)/(m0 − ma), where mo is the initial mass, mt the mass at a time t min and ma the ash mass.
Catalysts 10 01430 g002
Figure 3. Material balance of the process. Influence of temperature. Comparison between weight loss through thermogravimetry and according to the carbon content in the gas evolved.
Catalysts 10 01430 g003
Figure 4. Representation of the basket and the biochar sample in the reactor [23].
Catalysts 10 01430 g004
Figure 5. Experimental arrangement.
Catalysts 10 01430 g005
Figure 6. Experimental design of the research.
Catalysts 10 01430 g006
Table 1. Gas mole generation at 60 min of reaction. Influence of the cationic part of the catalyst (initial mass of biochar: 500 mg; anion used: carbonate; temperature: 800 °C; steam partial pressure: 0.51atm; catalyst concentration: 5%).
Catalyst(H2Moles)·1000(CO Moles)·1000(CO2Moles)·1000
Without catalyst (control)21.926.638.00
Na37.0225.786.10
K41.7125.647.68
Ca28.3112.247.76
Mg20.108.215.80
Table 2. Gas mole generation at 60 min of reaction. Influence of the anionic part of the catalyst (initial mass of biochar: 500 mg; cation used: sodium; temperature: 800 °C; steam partial pressure: 0.51atm; catalyst concentration: 5%).
Catalyst(H2Moles)·1000(CO Moles)·1000(CO2Moles)·1000
Without catalyst (control)21.926.638.00
Carbonate37.0225.786.10
Chloride19.649.165.10
Nitrate34.0714.084.34
Sulfate26.5415.825.47
Fluoride35.6923.696.08
Acetate20.4913.024.38
Table 3. Mole generation and the subsequent balance. Influence of temperature (initial mass of biochar: 500 mg; catalyst: sodium carbonate; steam partial pressure: 0.51atm; catalyst concentration: 5%).
T, °C(H2Moles)·1000(CO Moles)·1000(CO2Moles)·1000ΔH2
70012.704.534.66−1.15
75023.7911.156.51−0.38
80037.0225.786.10−0.96
85050.0229.569.281.90
90031.1919.395.850.1
Table 4. Conversions, yields and heating values of the gases obtained in catalytic gasification. Influence of temperature.
Parameter700 °C750 °C800 °C850 °C
Conversion (%)20.039.478.295.3
Gas yield0.681.252.092.51
(kg/kg biochar fed)
Gas yield *3.683.442.912.86
(kg/kg biochar converted)
High heating value10.0110.7111.5711.38
(MJ/m3 N)
High heating value9.3119.2135.1342.54
(MJ/kg biochar fed)
High heating value50.55348.8248.55
(MJ/kg biochar converted)
Notes: Reaction time: 60 min. Initial mass of biochar: 500 mg. Conversion defined as (m0 − mt)/(m0 − ma), where mo is the initial mass, mt the mass at a time t and ma the ash mass. Heating values calculated in dry basis and nitrogen-free conditions. * This value represents the amount of gas that could be obtained for 100% conversion.
Table 5. Gas moles generation and the corresponding balance. Influence of catalyst concentration (initial mass of biochar: 500 mg; catalyst: sodium carbonate; steam partial pressure: 0.51 atm; temperature: 800 °C).
Catalyst Concentration (%)(H2Moles)·1000(CO Moles)·1000(CO2Moles)·1000ΔH2
021.926.638.00−0.70
2.525.7216.005.04−0.36
5.037.0225.786.10−0.96
7.530.3721.775.49−2.38
10.028.3120.894.83−2.24
Table 6. Moles generated and their corresponding balance.Influence of steam partial pressure (initial mass of biochar: 500 mg; catalyst: sodium carbonate, 5% at 800 °C).
PH2O, atm(H2Moles)·1000(CO Moles)·1000(CO2Moles)·1000ΔH2
0.2318.5611.323.520.2
0.4430.9621.524.86−0.28
0.5137.0225.786.10−0.96
0.5837.9122.588.19−1.05
Table 7. Conversions, yields and heating values obtained for the catalytic gasification of rockrose biochar. Influence of steam partial pressure.
Parameter0.23 atm0.44 atm0.51 atm0.58 atm
Conversion (%)35.7062.0078.2077.44
Gas yield (kg/kg biochar fed)1.031.682.092.05
Gas yield (kg/kg biochar converted)3.152.942.912.87
High heating value (MJ/m3 N)11.3611.6211.5711.19
High heating value (MJ/kg biochar fed)17.2528.4935.1332.95
High heating value (MJ/kg biochar converted)52.5649.9748.8246.26
Notes: Reaction time: 60 min. Conversion defined as (m0 − mt)/(m0 − ma), where mo is the initial mass, mt the mass at a time t min and ma the ash mass. Heating values calculated in dry basis and nitrogen-free conditions.
Table 8. Ideal models of reaction. Kinetic equations for gas-solid reactions [28,29].
ModelEquation Slope
Shrinking core model. Prevalence of gaseous diffusion. X = t τ (6) 1 τ = 3 b k g C A g C a t n ρ B R
Shrinking core model. Prevalence of chemical reaction. 1 1 X 1 3 = t τ (7) 1 τ = b k s C A g C a t n ρ B R
Shrinking particle model (leaching). Prevalence of chemical reaction.
Shrinking core model. Prevalence of diffusion in ashes. 1 3 1 X 2 3 + 2 1 X = t τ (8) 1 τ = 6 b D e C A g C a t n ρ B R 2
Uniform conversion model. Prevalence of chemical reaction. ln 1 X = k v P A n t (9) k v P A n C a t n
Shrinking particle model (leaching). Prevalence of gaseous diffusion. 1 1 X 2 3 = t τ (10) 1 τ = 2 b k g C A g C a t n ρ B R *
* Assuming Stokes’ law (kg depending on particle size). CAg is the concentration of reactant A in gas phase; τ is the time required for the complete reaction of the particle; kg is the coefficient of mass transfer between the fluid and the particle; ρB is the molar density of reactant B in the solid; [Cat] is catalyst concentration; n is the reaction order with respect to the catalyst; X is conversion, t is reaction time, kS is the first order kinetic constant for the surface reaction; De is the diffusivity of the gaseous reactant; kV is the kinetic constant for the reaction for the whole volume; PA is the partial pressure of A in gas.
Table 9. Verification of the ideal models for gas-solid reaction. Influence of temperature.
EquationSlope at Different Temperatures *Average R2
700 °C750 °C800 °C850 °C900 °C
(6)3.472 × 10−35.976 × 10−312.78 × 10−317.24 × 10⁻³-0.995
(9)3.832 × 10−37.411 × 10−322.92 × 10−349.33 × 10⁻³-0.955
(7)1.236 × 10−32.296 × 10−36.213 × 10−310.91 × 10⁻³-0.979
(10)2.391 × 10−34.274 × 10−310.23 × 10−315.44 × 10⁻³-0.992
*The slopes have been obtained by representing the first part of Equations (6), (7), (9) and (10) over time and adjusting by least squares method.
Table 10. Ideal models for gas-solid reaction. Least squares adjustment of the Arrhenius equation. Activation energy determination.
ModelSlope **InterceptCorrelation CoefficientEa, kJ/mol *
Shrinking core model. Prevalence of gaseous diffusion. (Equation (6))−12,2076.880.982
Shrinking core model. Prevalence of chemical reaction. (Equation (7))−16,45010.150.988136.1
Uniform conversion model. Prevalence of chemical reaction. (Equation (9))−19,17514.030.986158.7
Shrinking particle model (leaching). Prevalence of chemical reaction. (Equation (7))−16,45010.150.988136.1
Shrinking particle model (leaching). Prevalence of gaseous diffusion. (Equation (10))−14,1558.480.986
* Activation energy was only determined for those models where real kinetic constants are implied. For these models, the kinetic constant is related with temperature through the Arrhenius equation (k = k0·e−E/RT). ** The slopes were obtained by linearization of the slopes given in Table 9, prior replacement of the kinetics constants by Arrhenius equation. A posterior adjustment to 1/T provides the rest of parameters observed in this table.
Table 11. Verification of the proposed model. Influence of temperature.
T, °CSlope, −ln(1 + ξ)/τ, min−1InterceptCorrelation Coefficient
7002.839 × 10−30.00940.990
7505.283 × 10−3−0.00580.986
80014.07 × 10−30.00760.994
85022.97 × 10−30.00760.994
Publisher’s Note: MDPI stays neutral with regard to jurisdictional claims in published maps and institutional affiliations.

