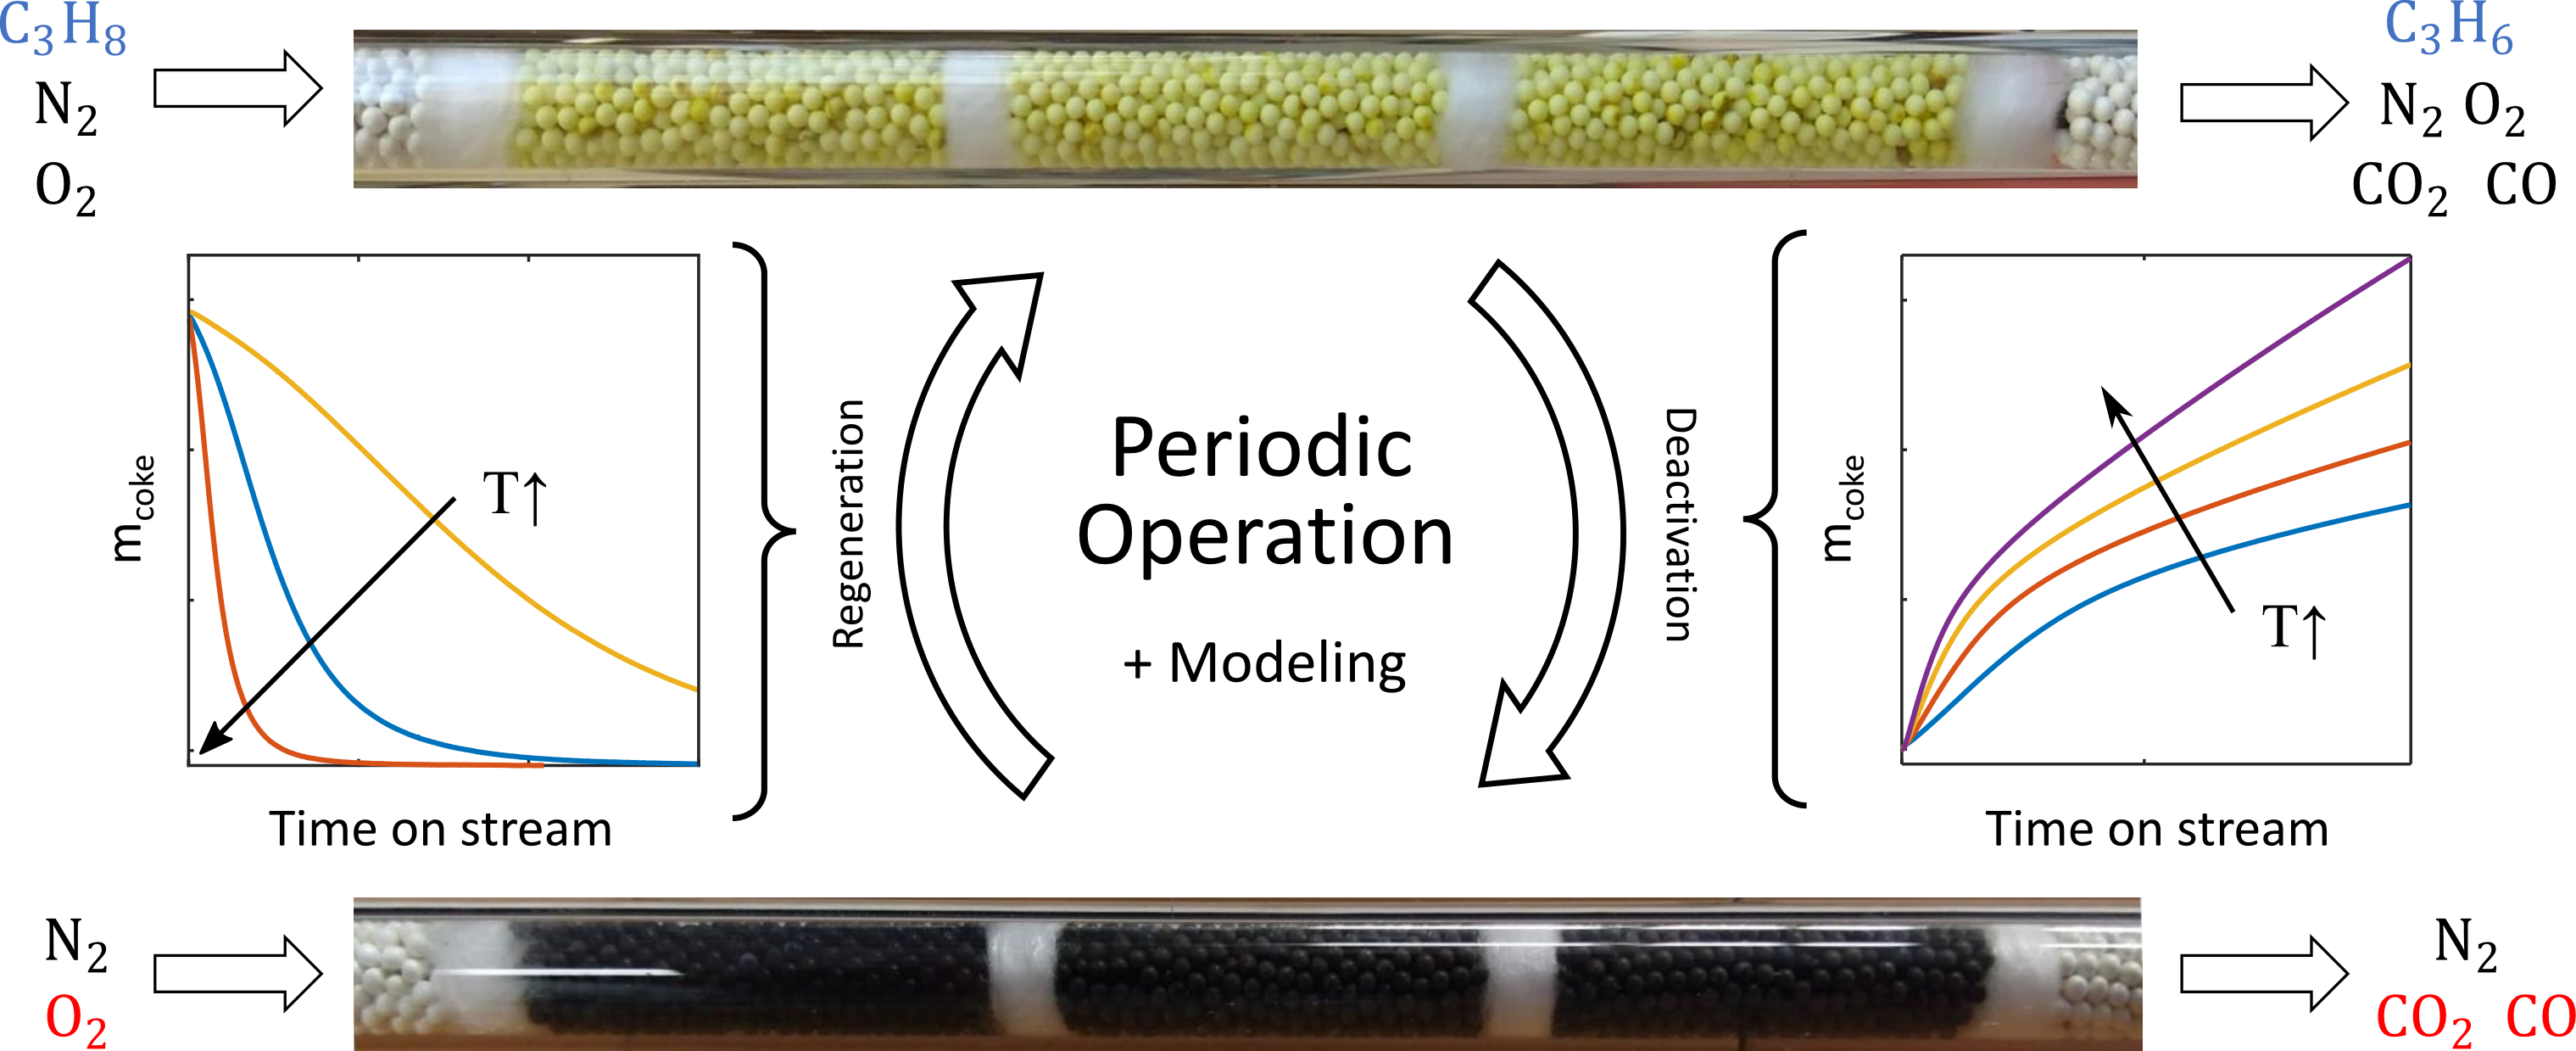
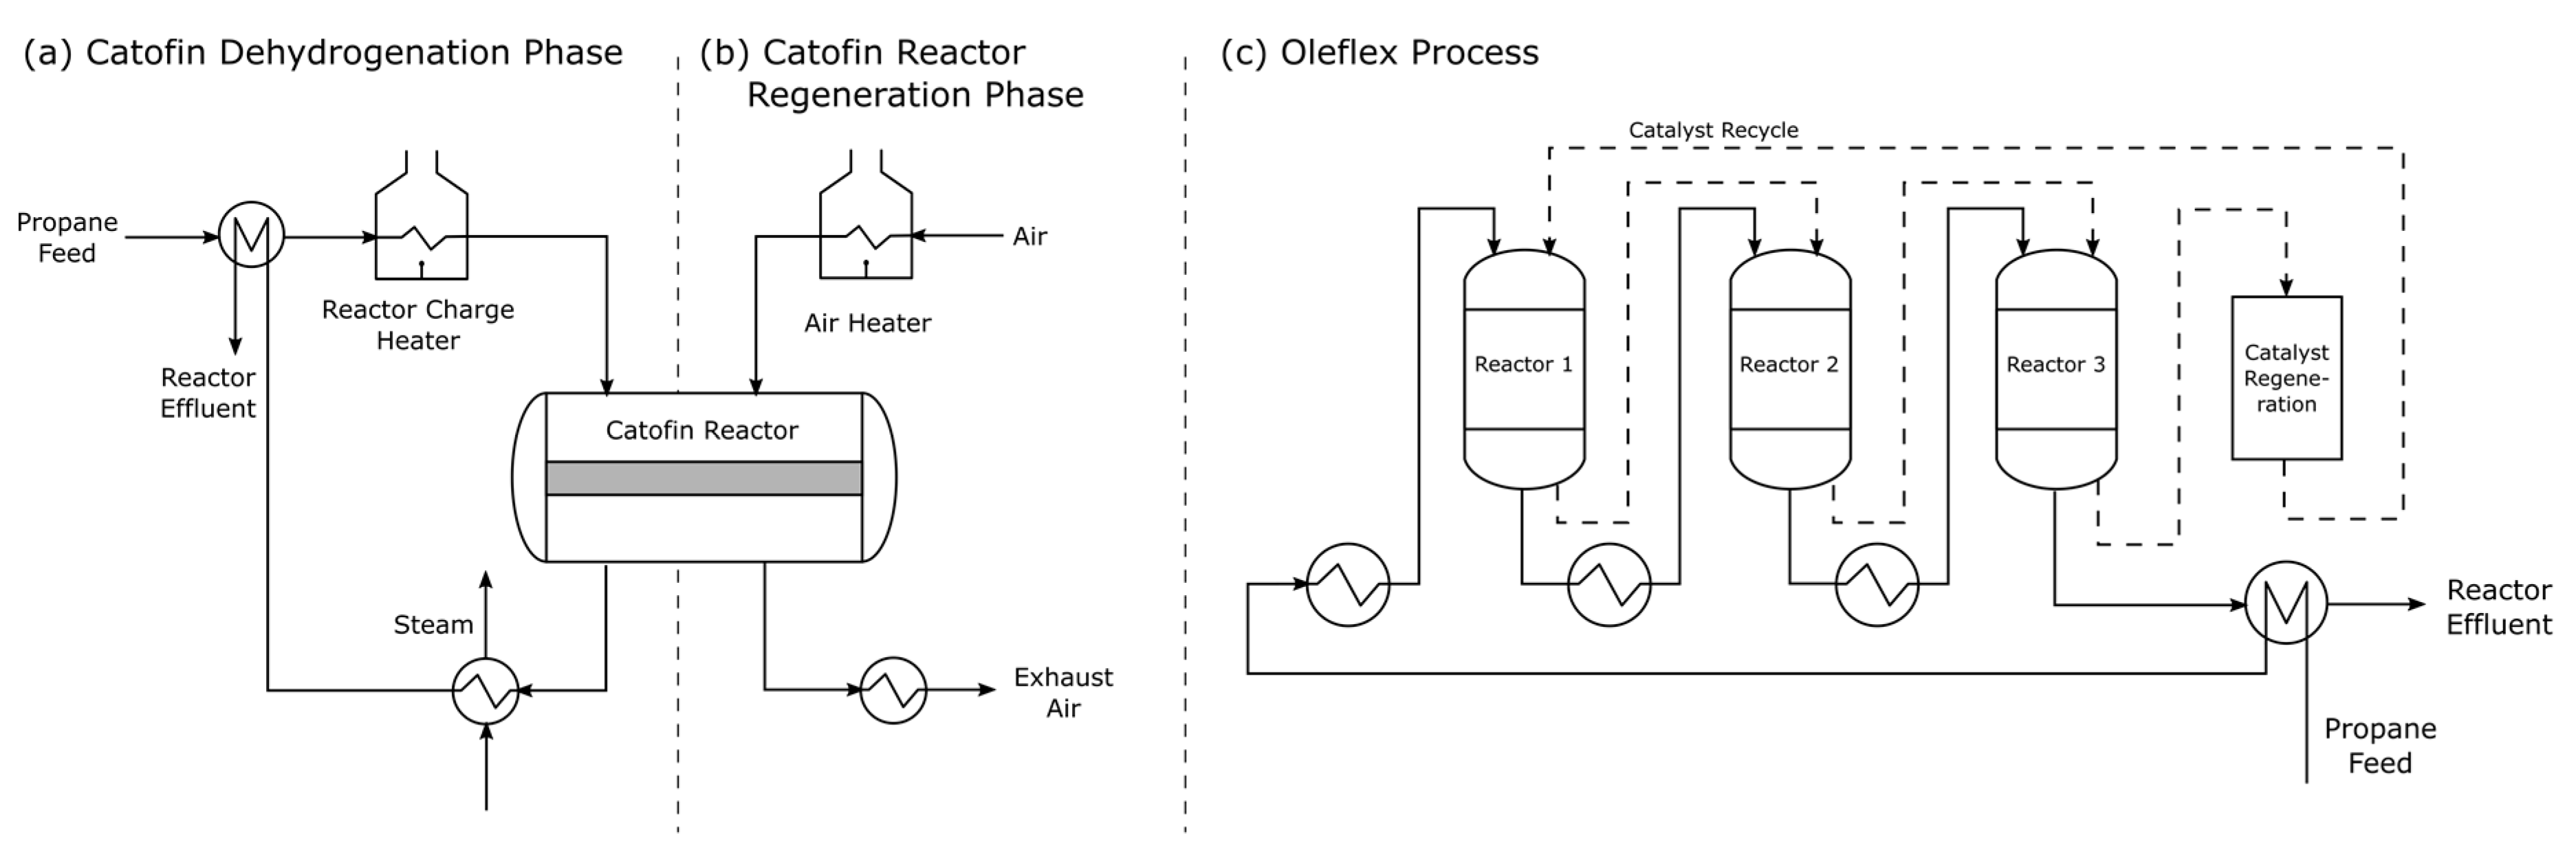
Figure 1.
Simplified flow sheets of commercialized dehydrogenation processes: (
a) Catofin process during production phase, (
b) Catofin process during regeneration phase, (
c) Oleflex process [
6,
7,
8].
Figure 1.
Simplified flow sheets of commercialized dehydrogenation processes: (
a) Catofin process during production phase, (
b) Catofin process during regeneration phase, (
c) Oleflex process [
6,
7,
8].
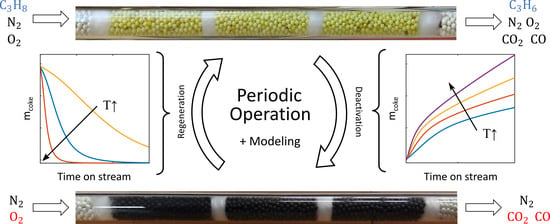
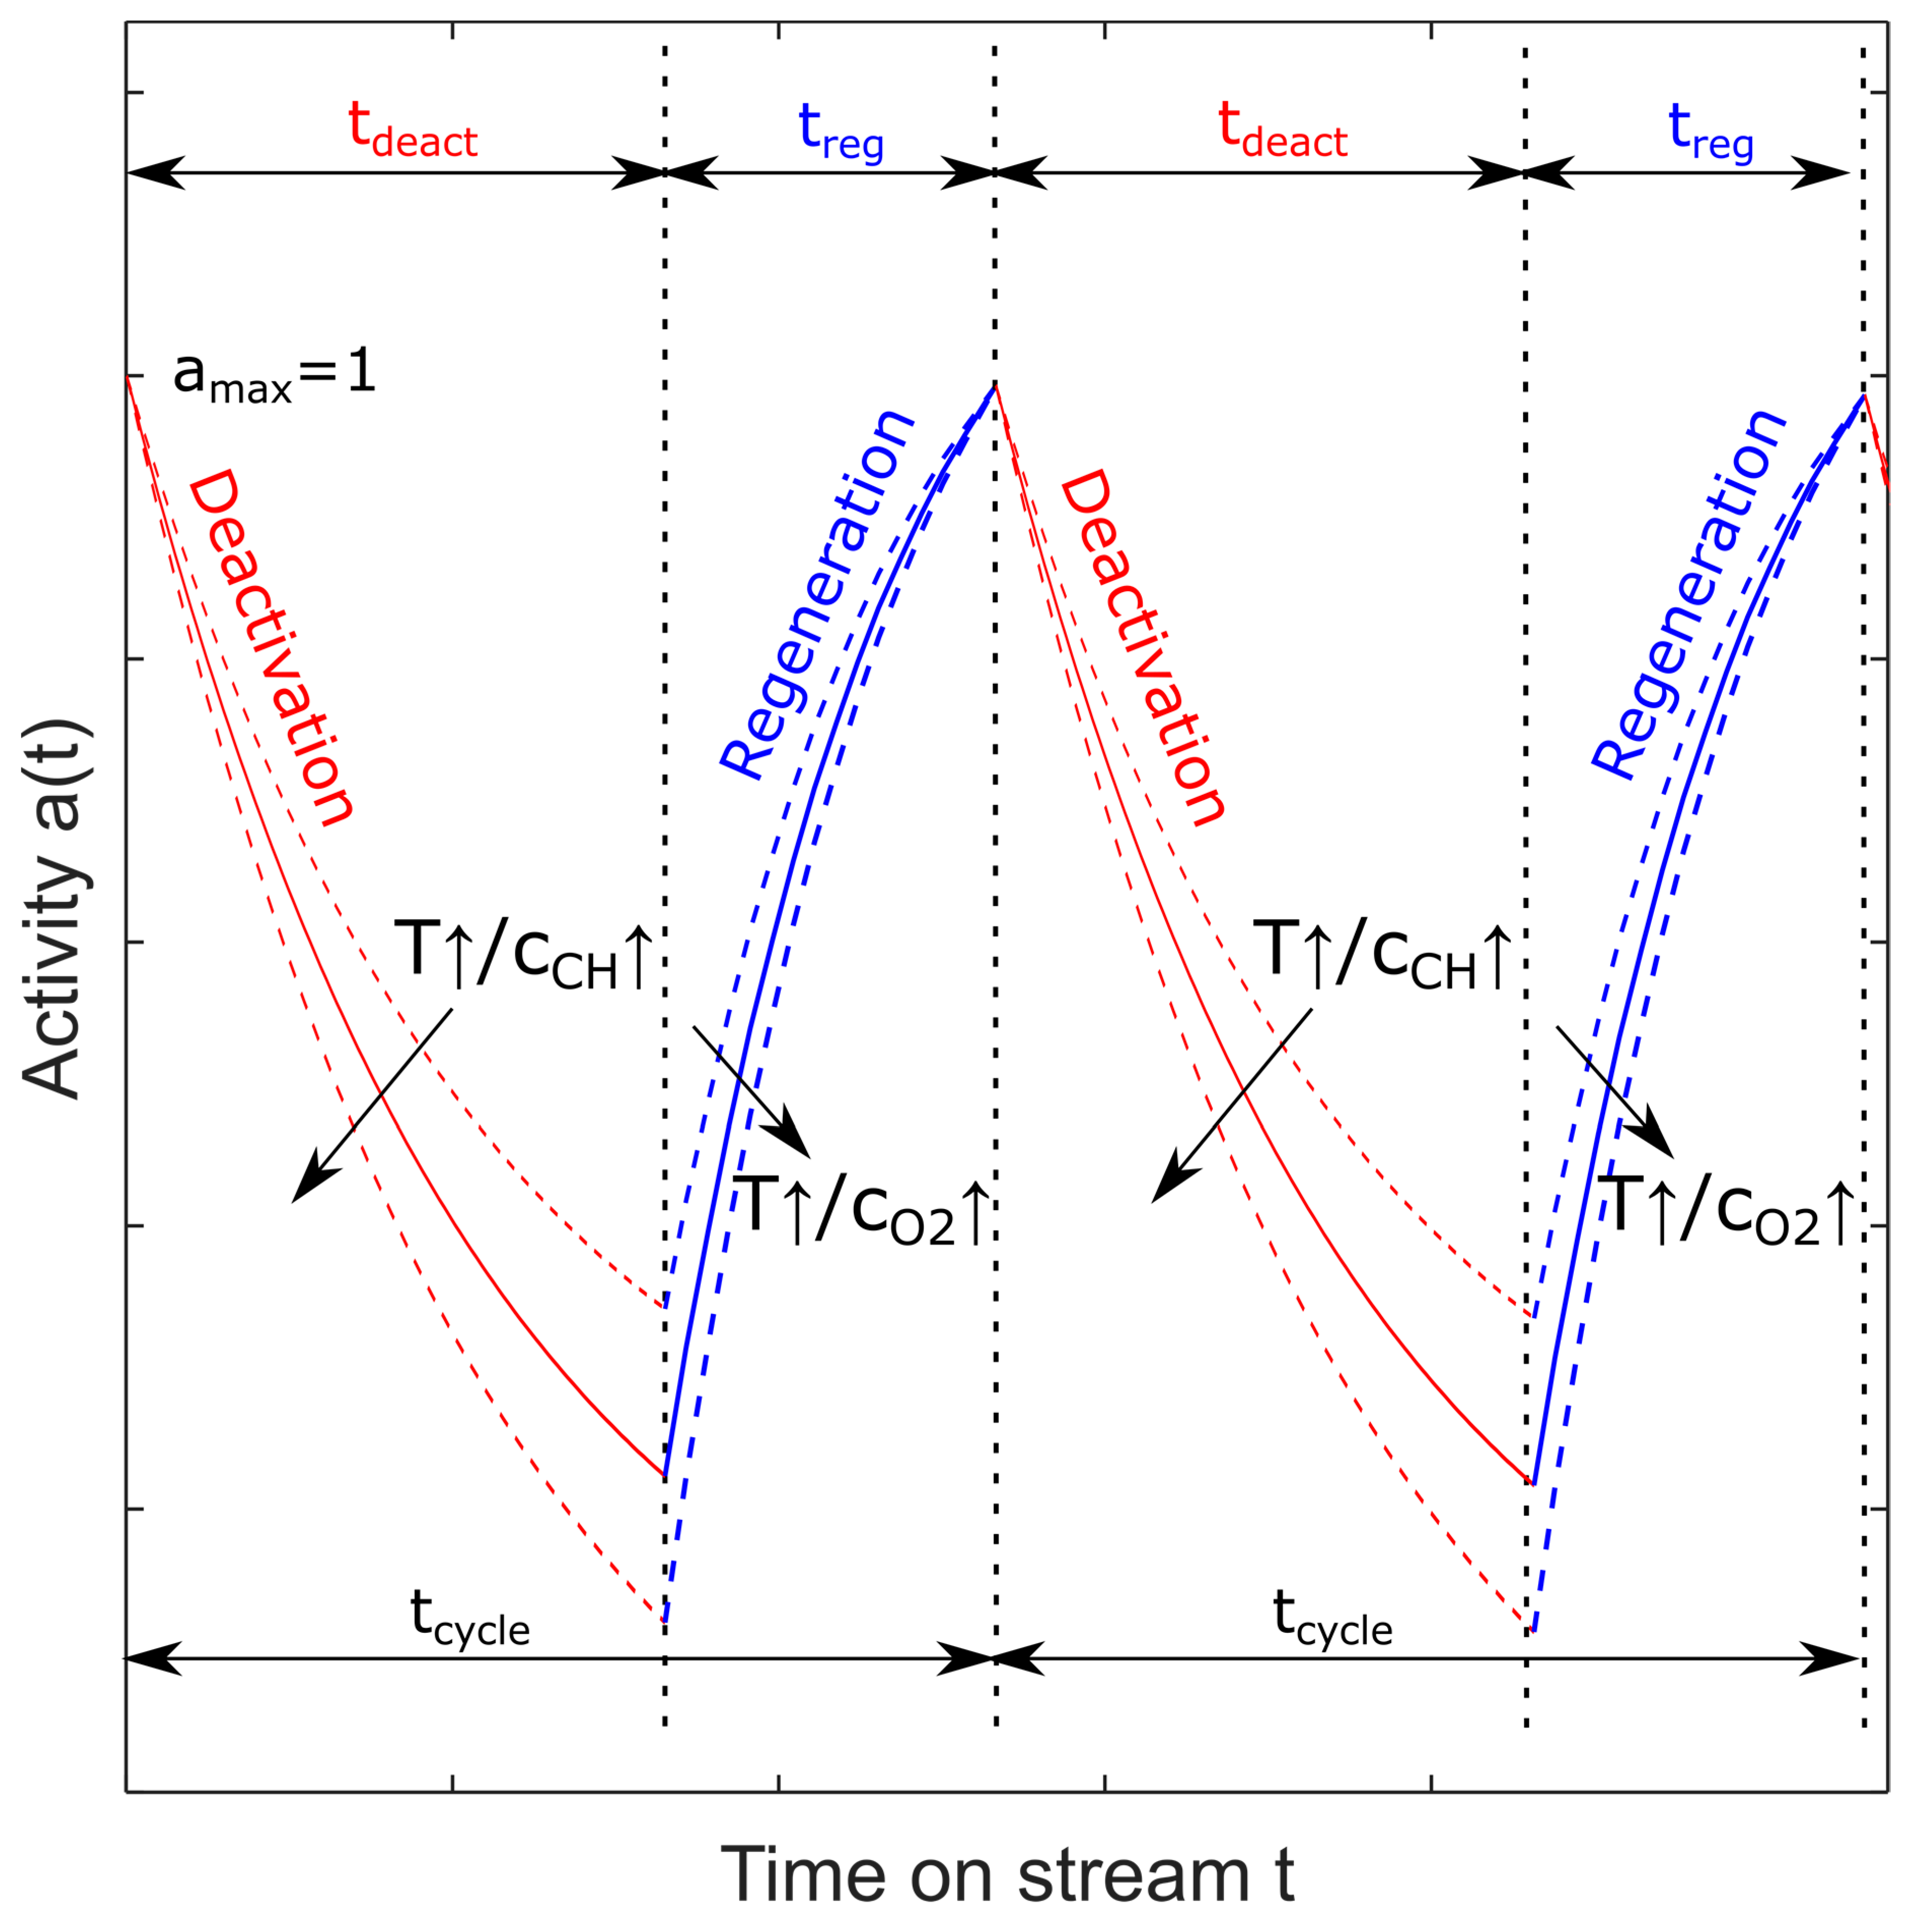
Figure 2.
Schematic of periodic operation of a reactor switching between deactivation and regeneration phases.
Figure 2.
Schematic of periodic operation of a reactor switching between deactivation and regeneration phases.
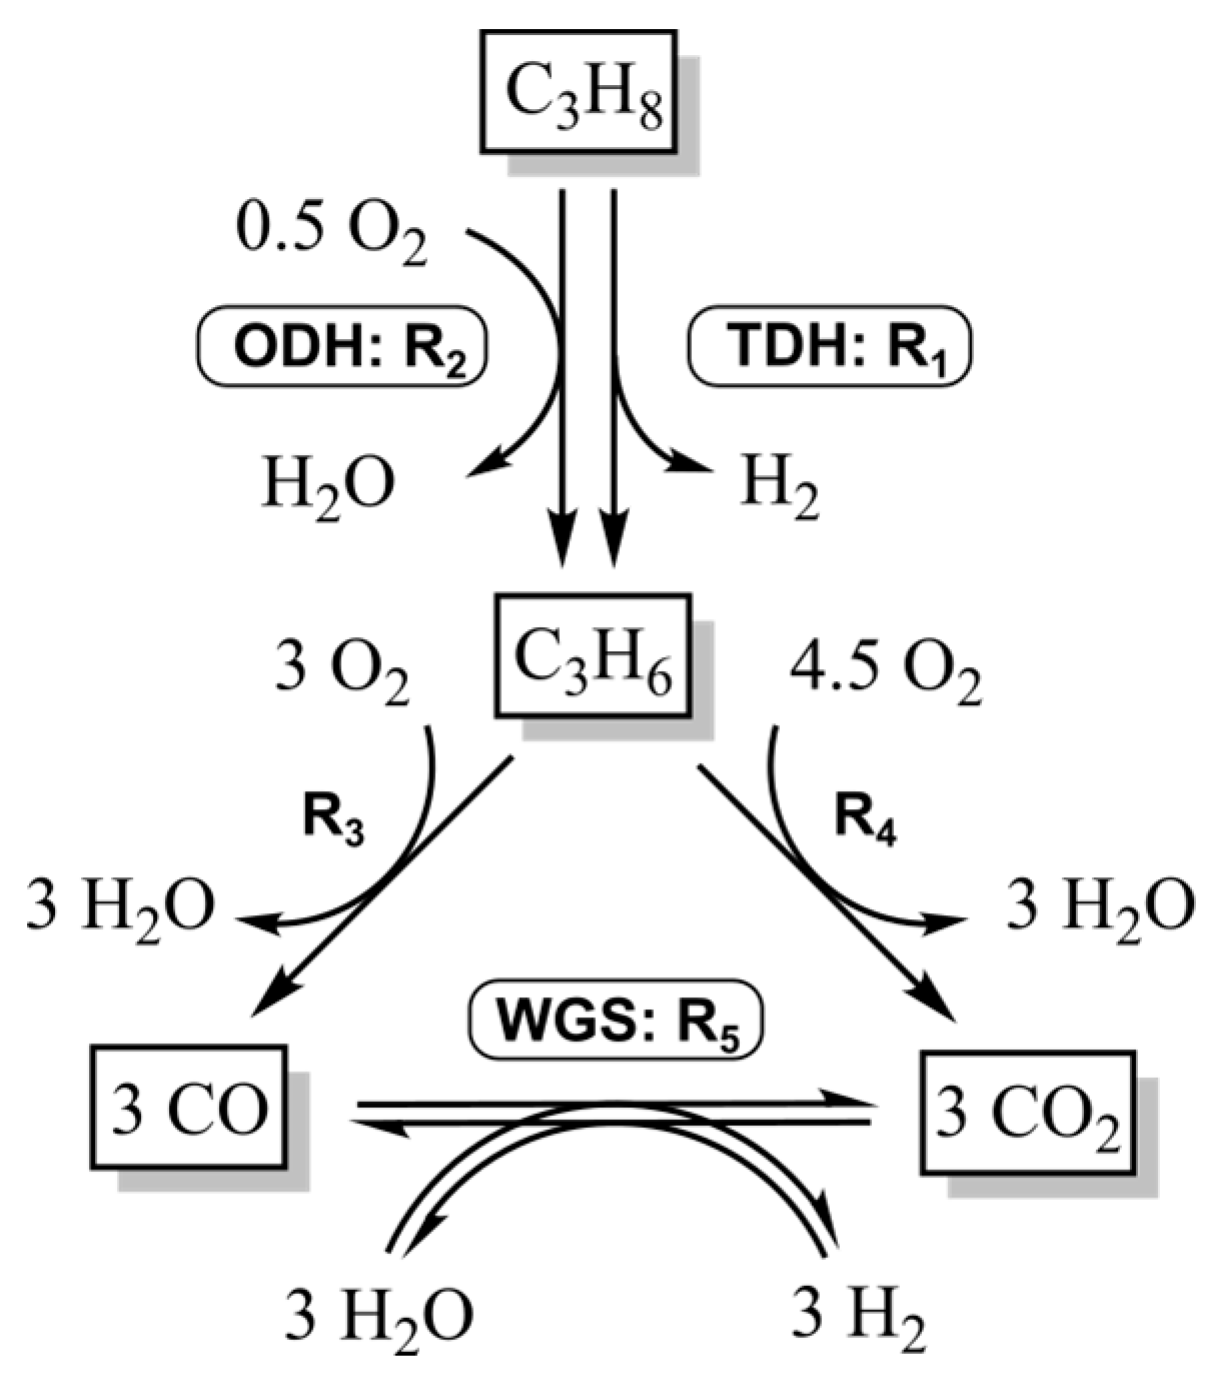
Figure 3.
Reaction network of the dehydrogenation of propane on a VOx catalyst.
Figure 3.
Reaction network of the dehydrogenation of propane on a VOx catalyst.
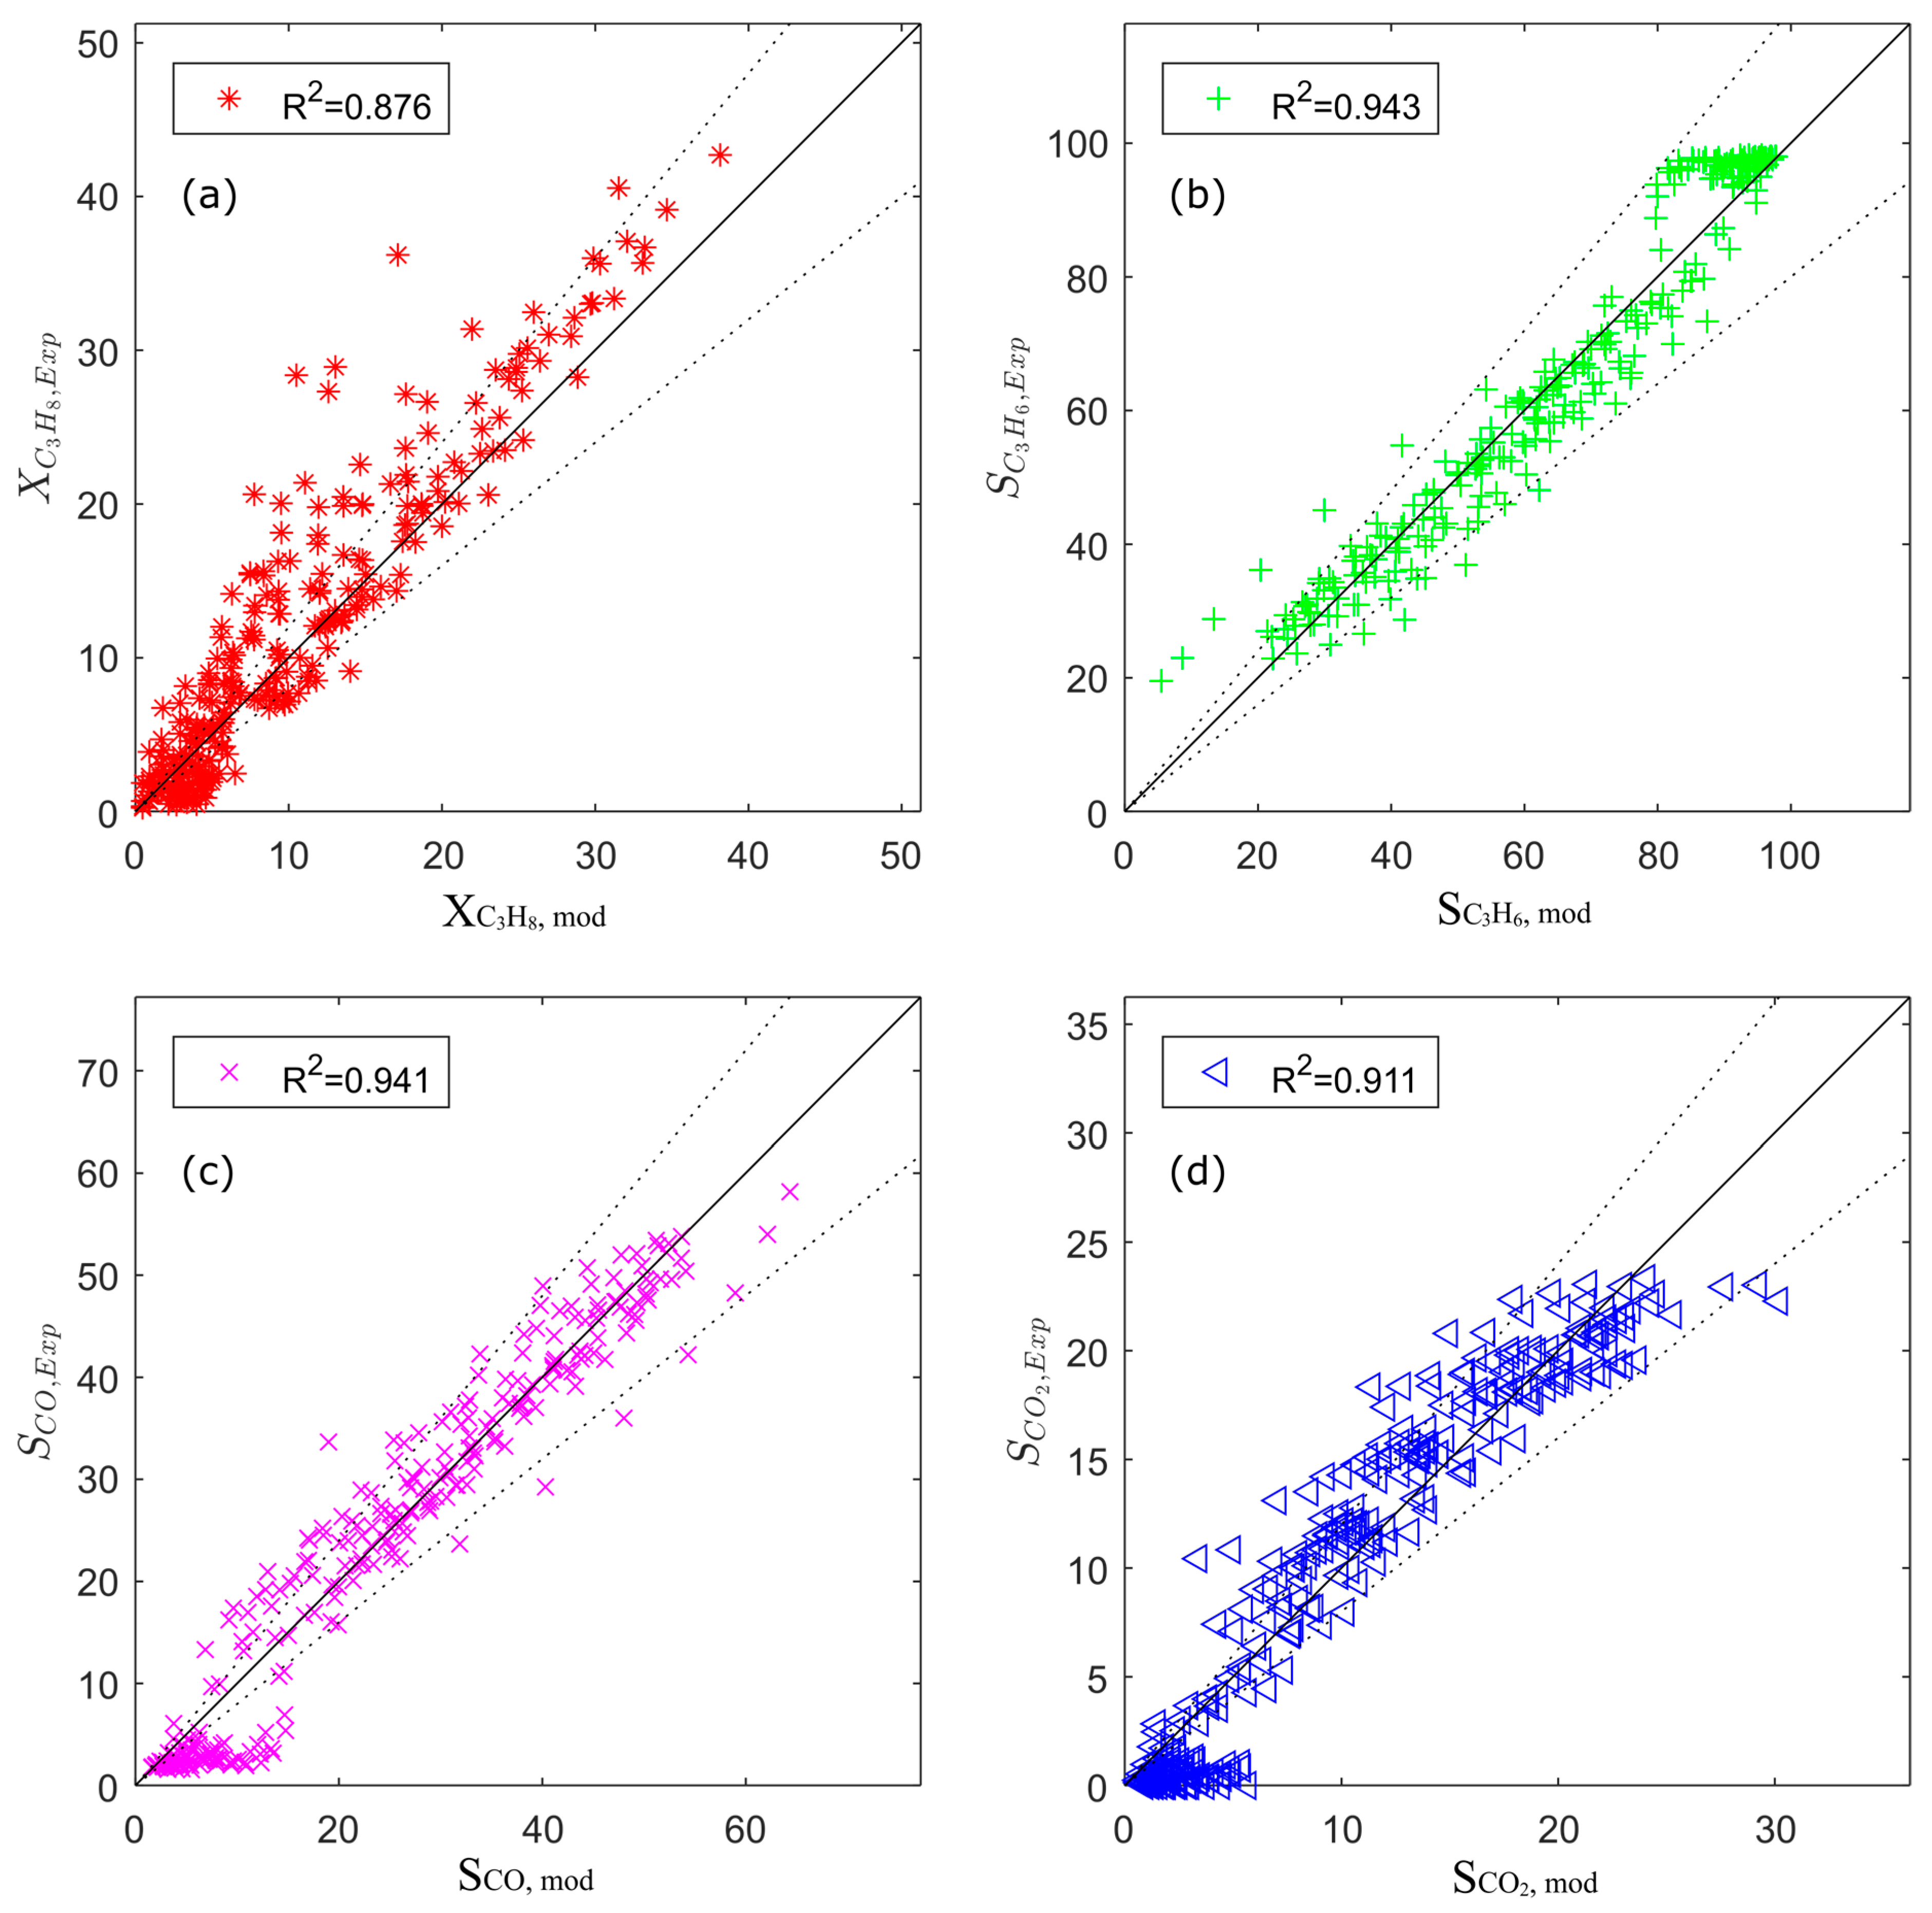
Figure 4.
Parity plots for the estimated kinetic model: (a) conversion of propane; (b) selectivity of propene; (c) selectivity of CO; (d) selectivity of CO2.
Figure 4.
Parity plots for the estimated kinetic model: (a) conversion of propane; (b) selectivity of propene; (c) selectivity of CO; (d) selectivity of CO2.
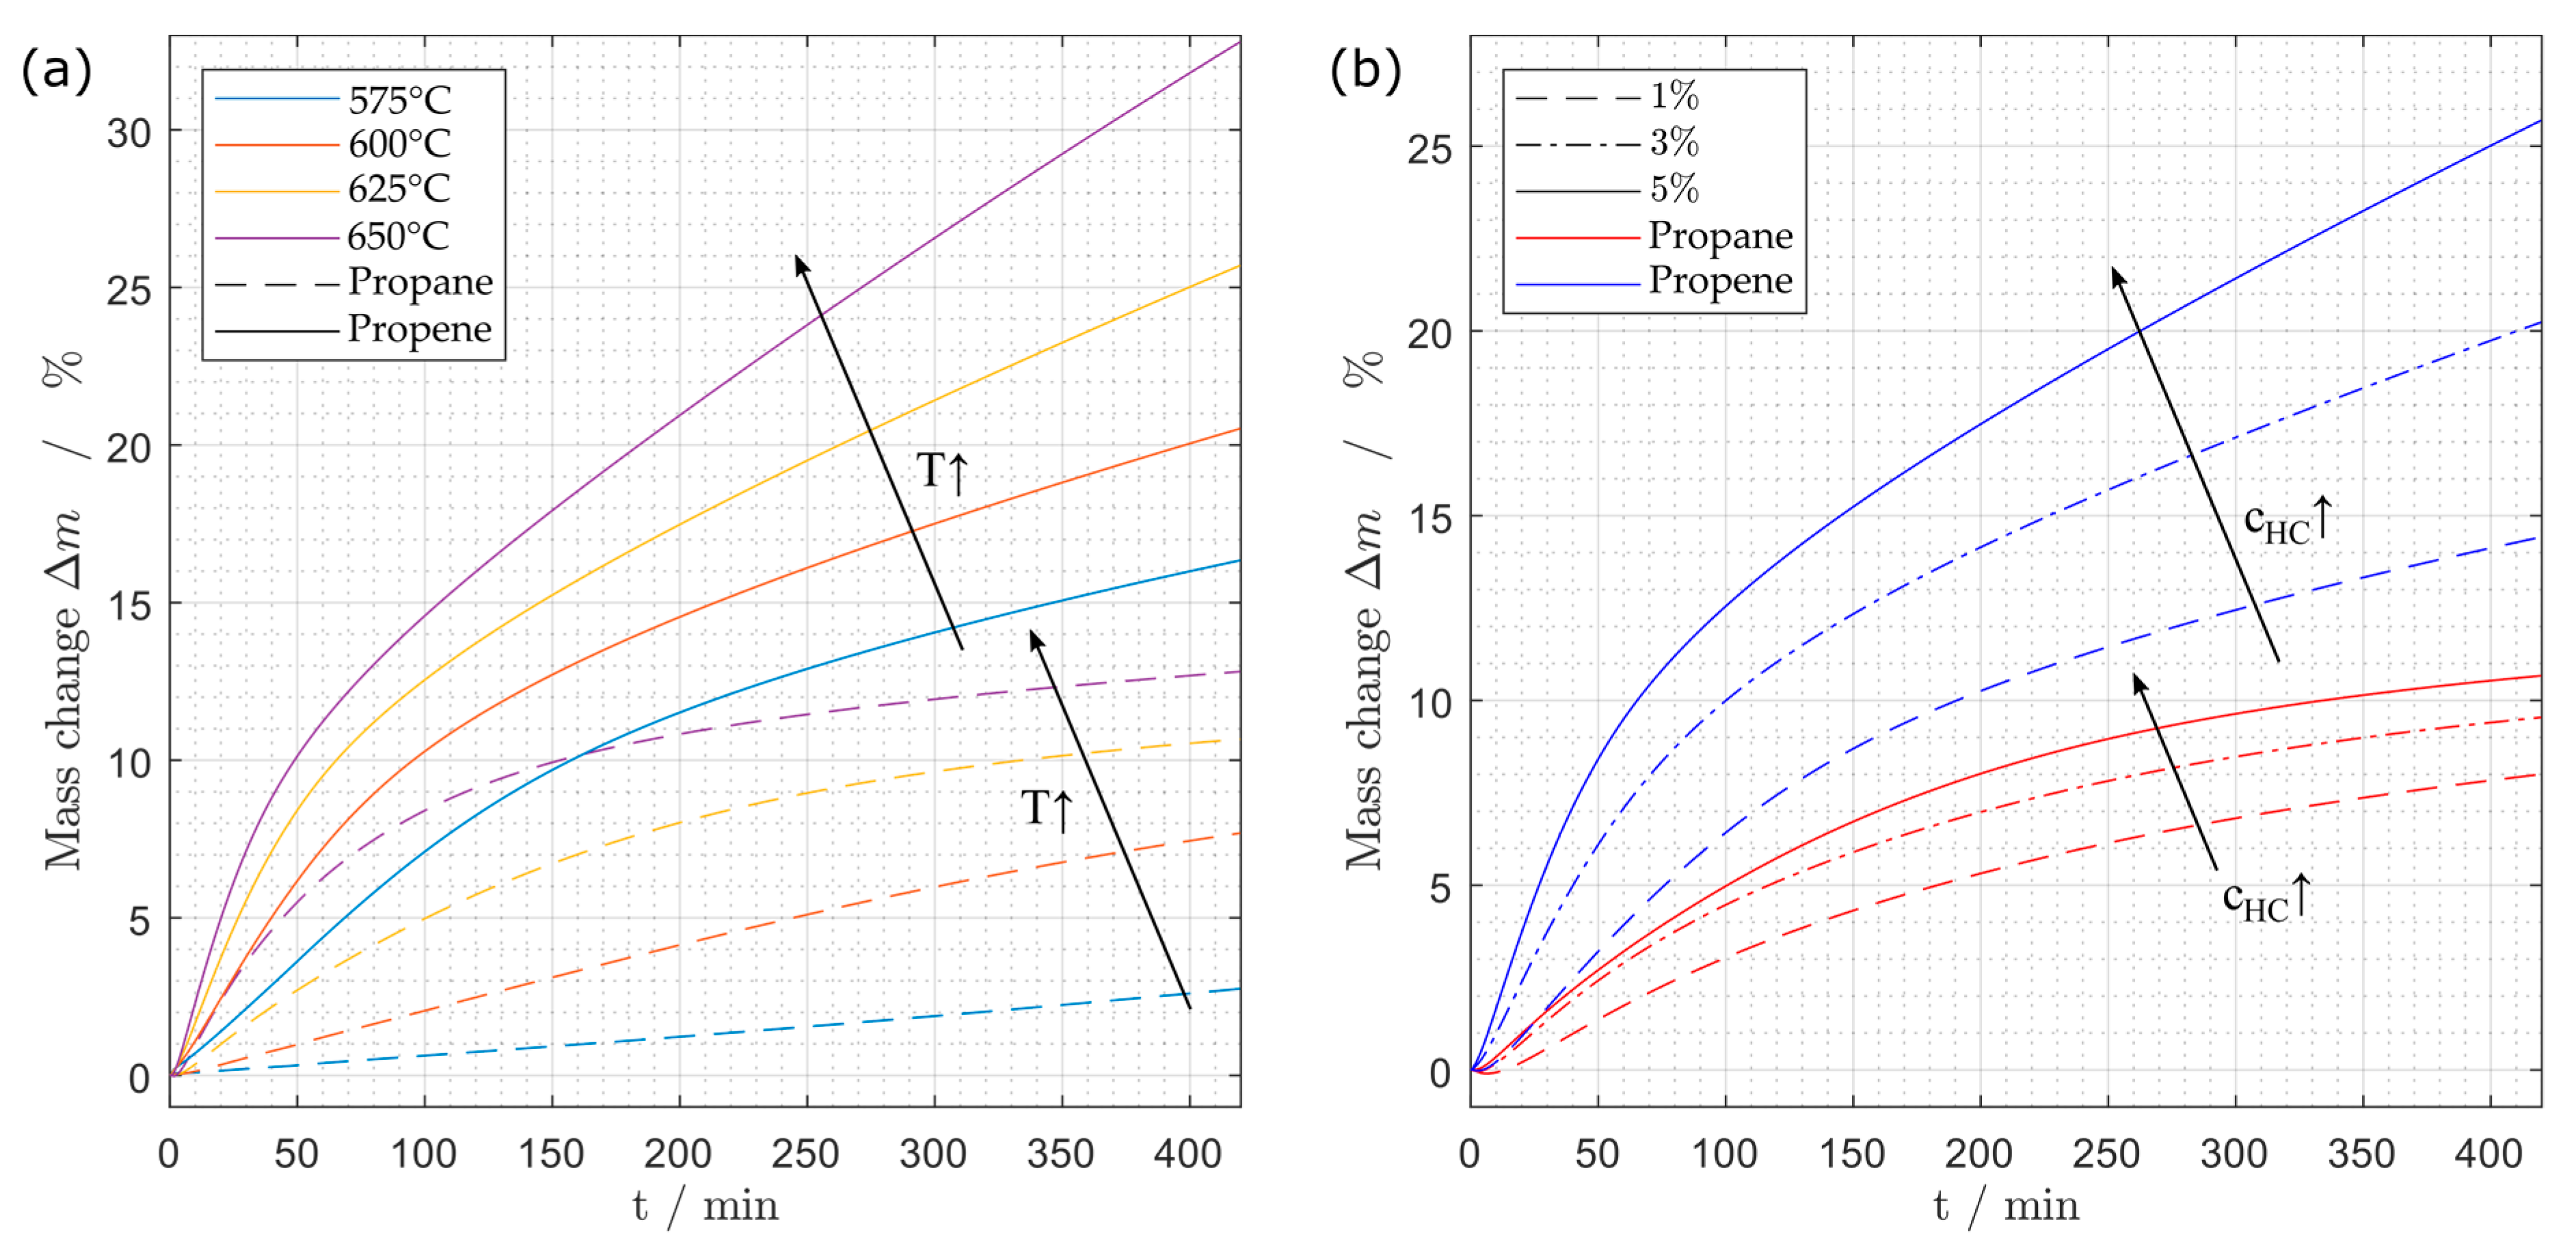
Figure 5.
Comparison of the coking behavior of the catalyst using different precursors at (a) different temperatures and a concentration of 5% of propane or propene respectively and (b) a temperature of 625 °C and varying hydrocarbon concentrations.
Figure 5.
Comparison of the coking behavior of the catalyst using different precursors at (a) different temperatures and a concentration of 5% of propane or propene respectively and (b) a temperature of 625 °C and varying hydrocarbon concentrations.
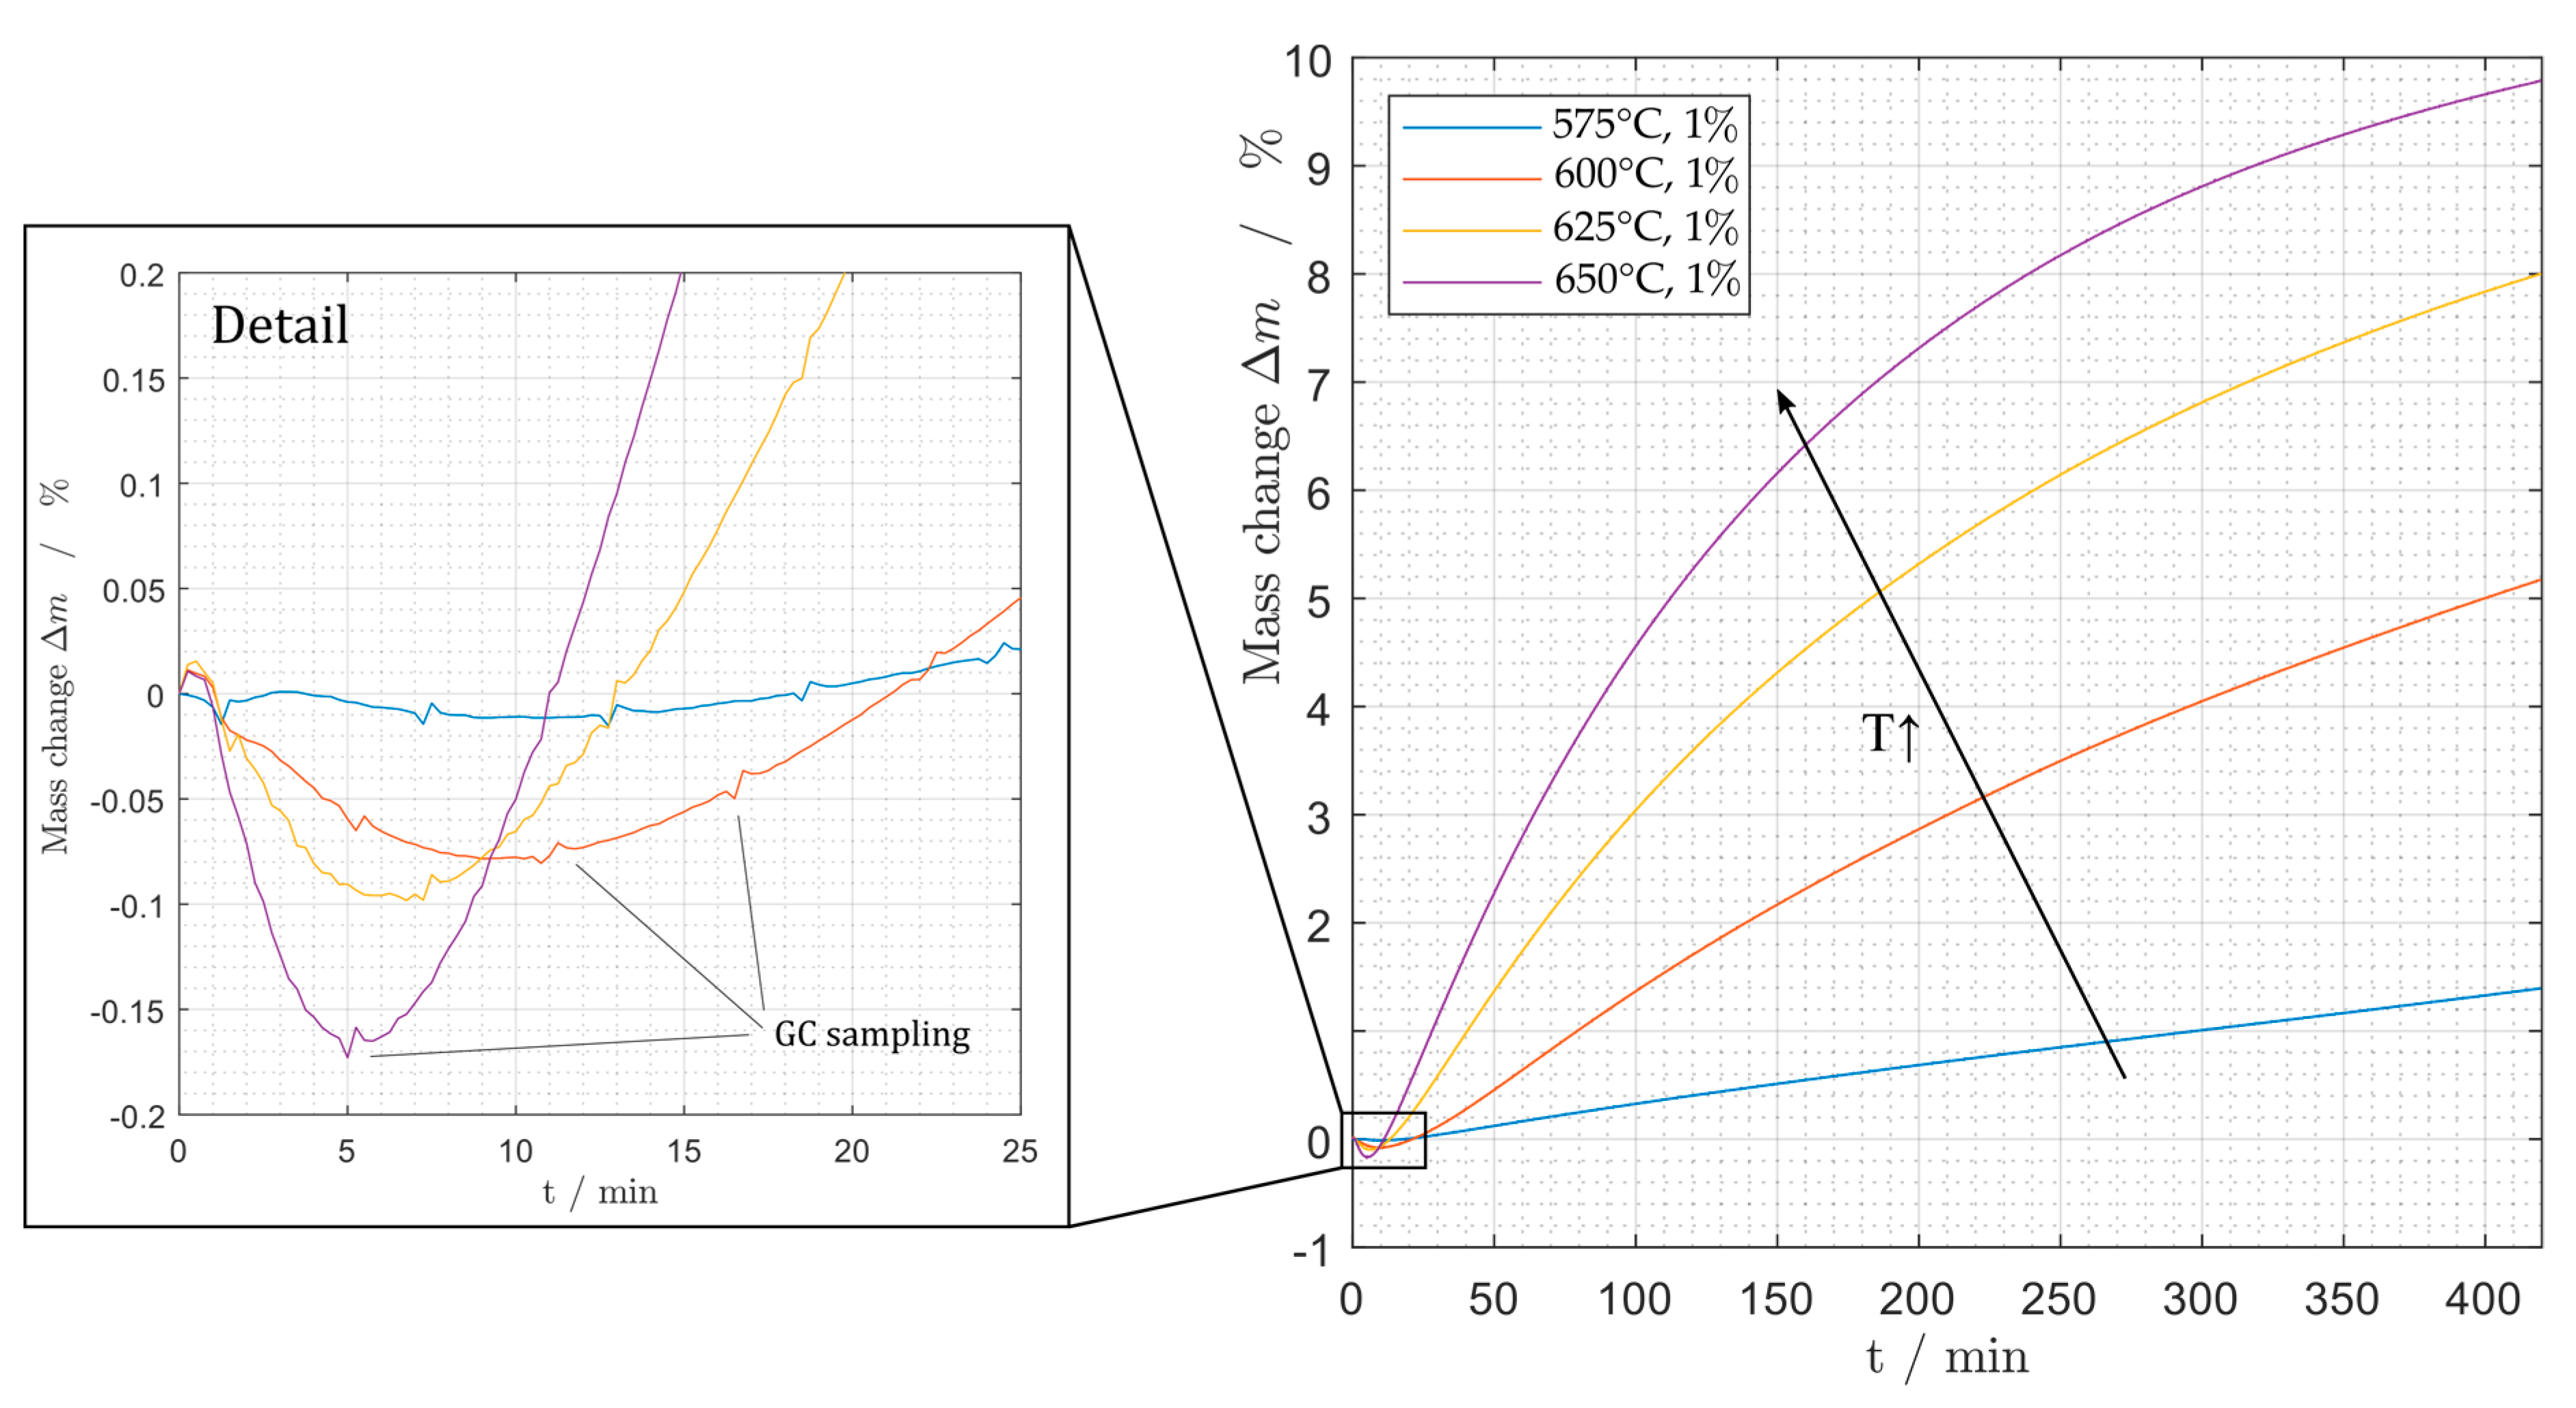
Figure 6.
Mass change during deactivation at different temperatures and 1% propane.
Figure 6.
Mass change during deactivation at different temperatures and 1% propane.
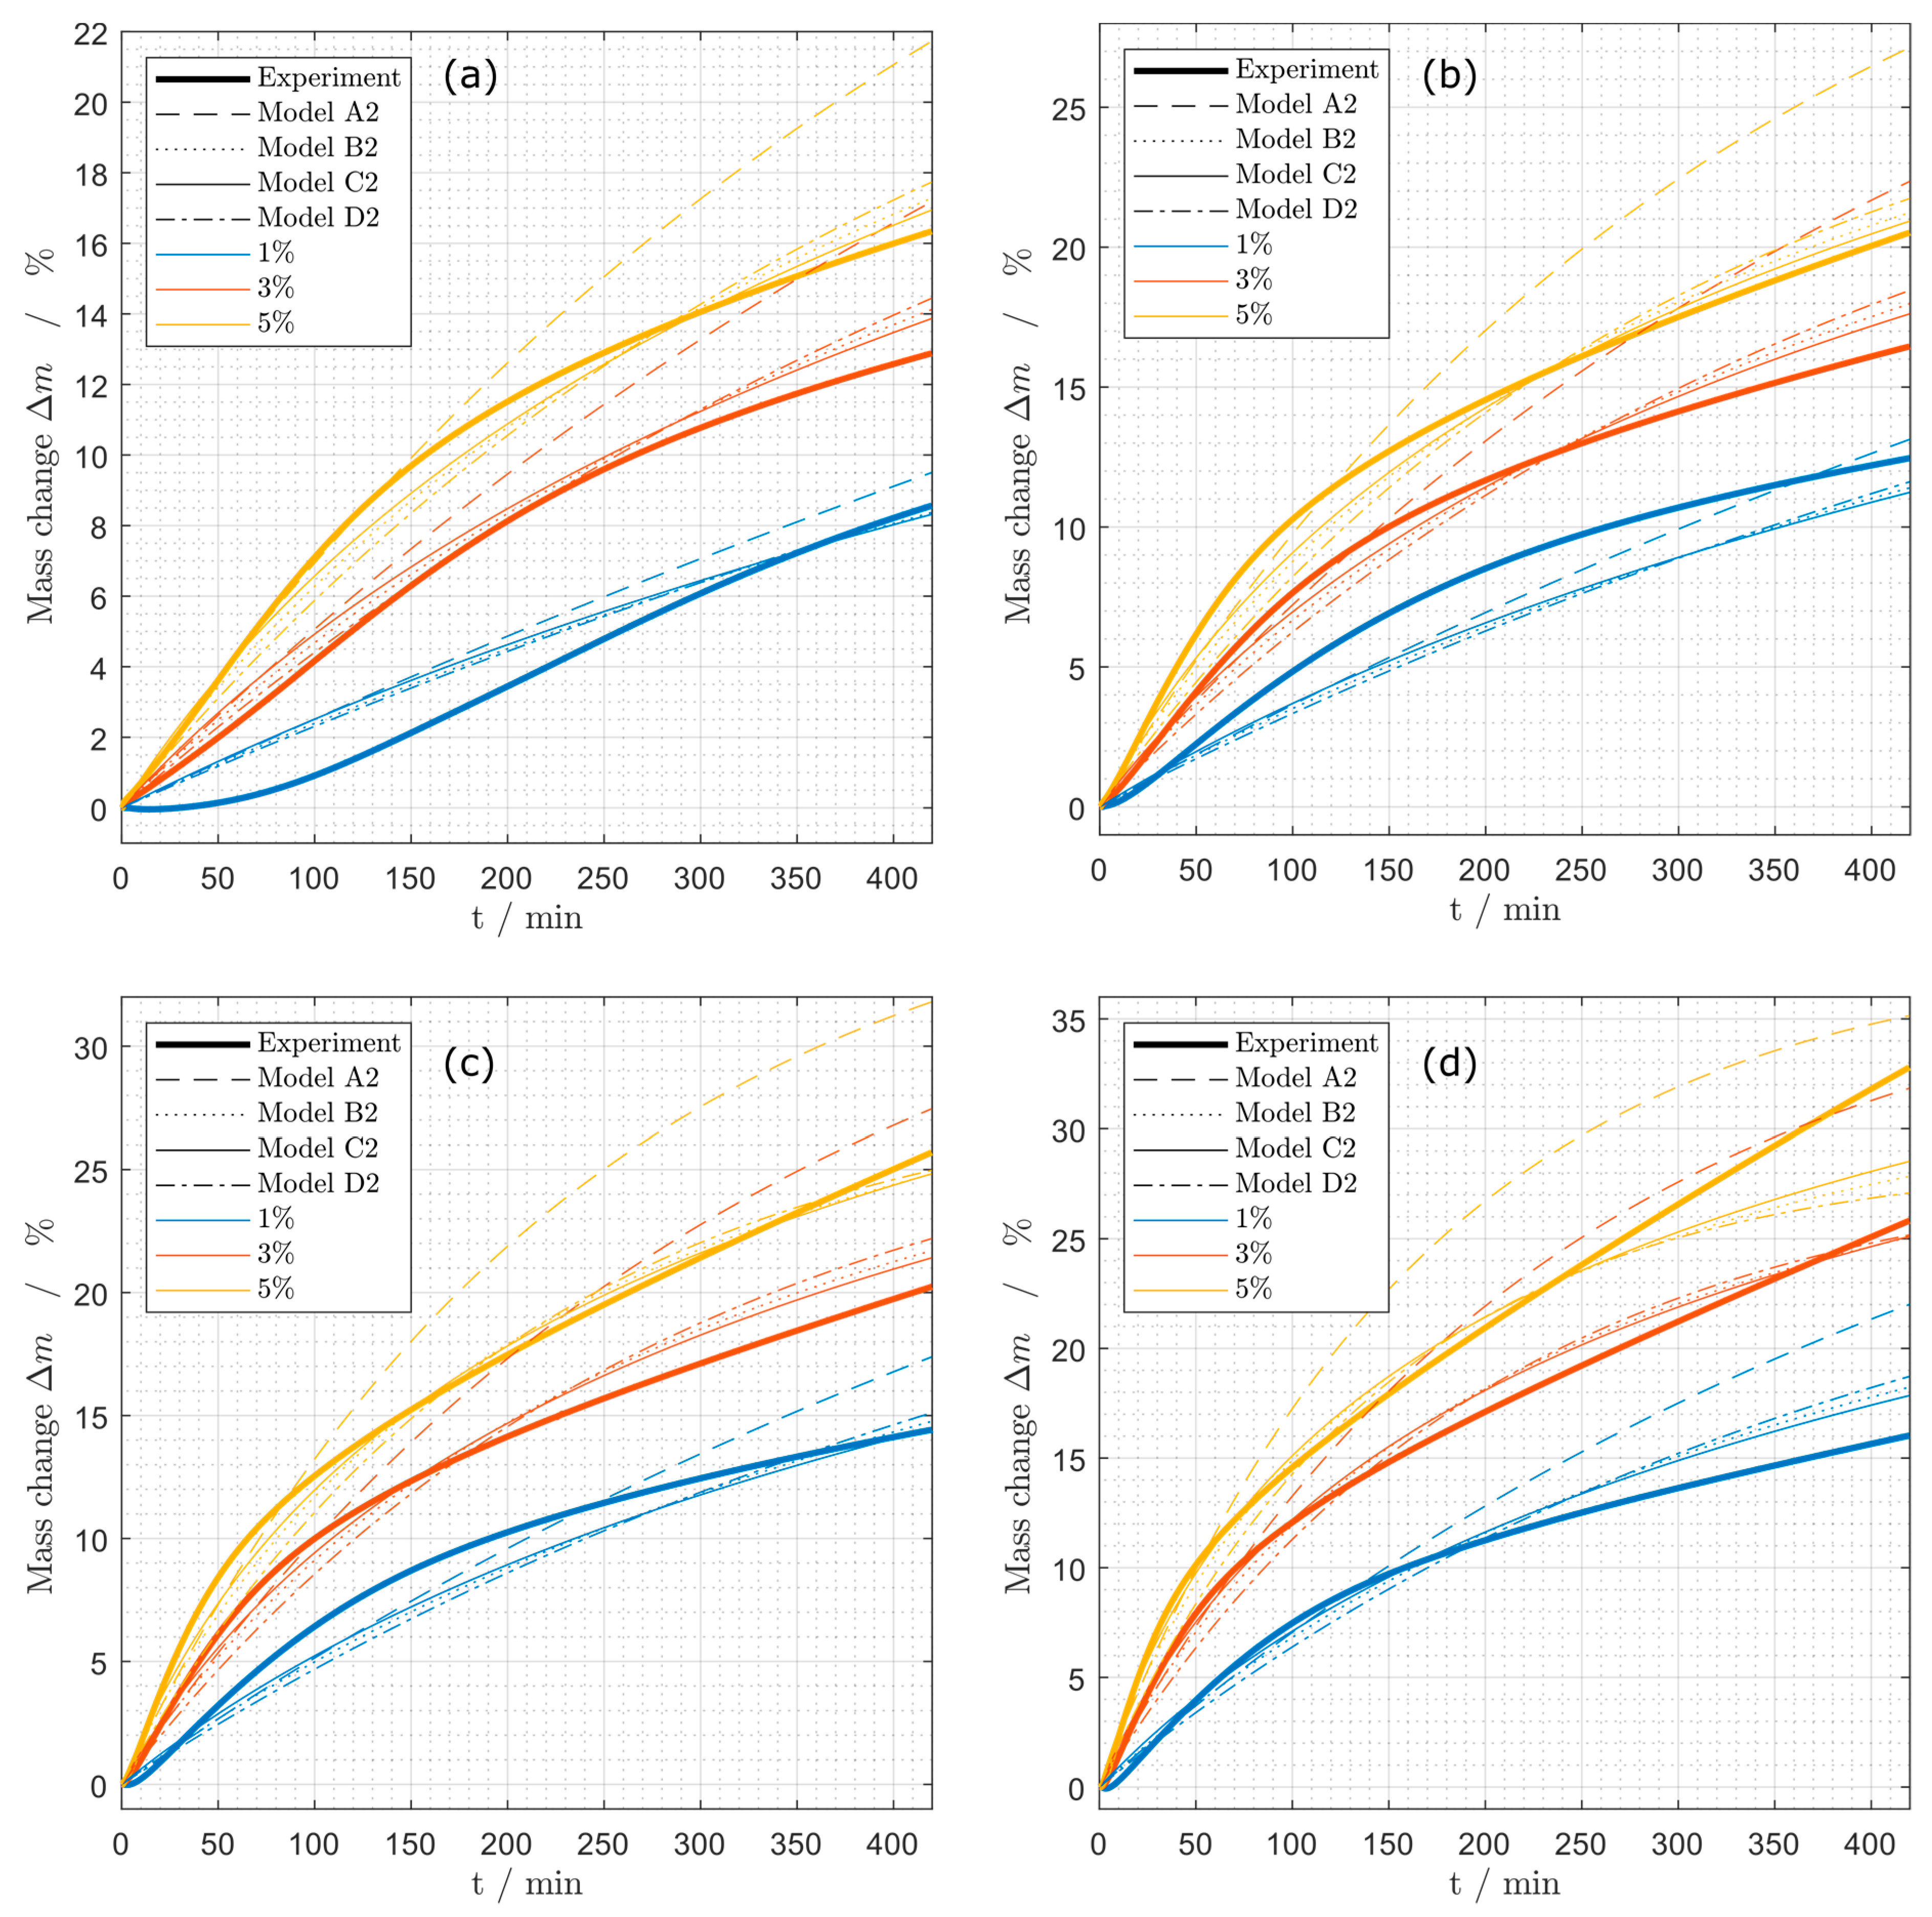
Figure 7.
Mass change during coking experiments at different propene concentrations (1%, 3%, 5%) at (a) 575 °C, (b) 600 °C, (c) 625 °C and (d) 650 °C for the models (A2), (B2), (C2) and (D2).
Figure 7.
Mass change during coking experiments at different propene concentrations (1%, 3%, 5%) at (a) 575 °C, (b) 600 °C, (c) 625 °C and (d) 650 °C for the models (A2), (B2), (C2) and (D2).
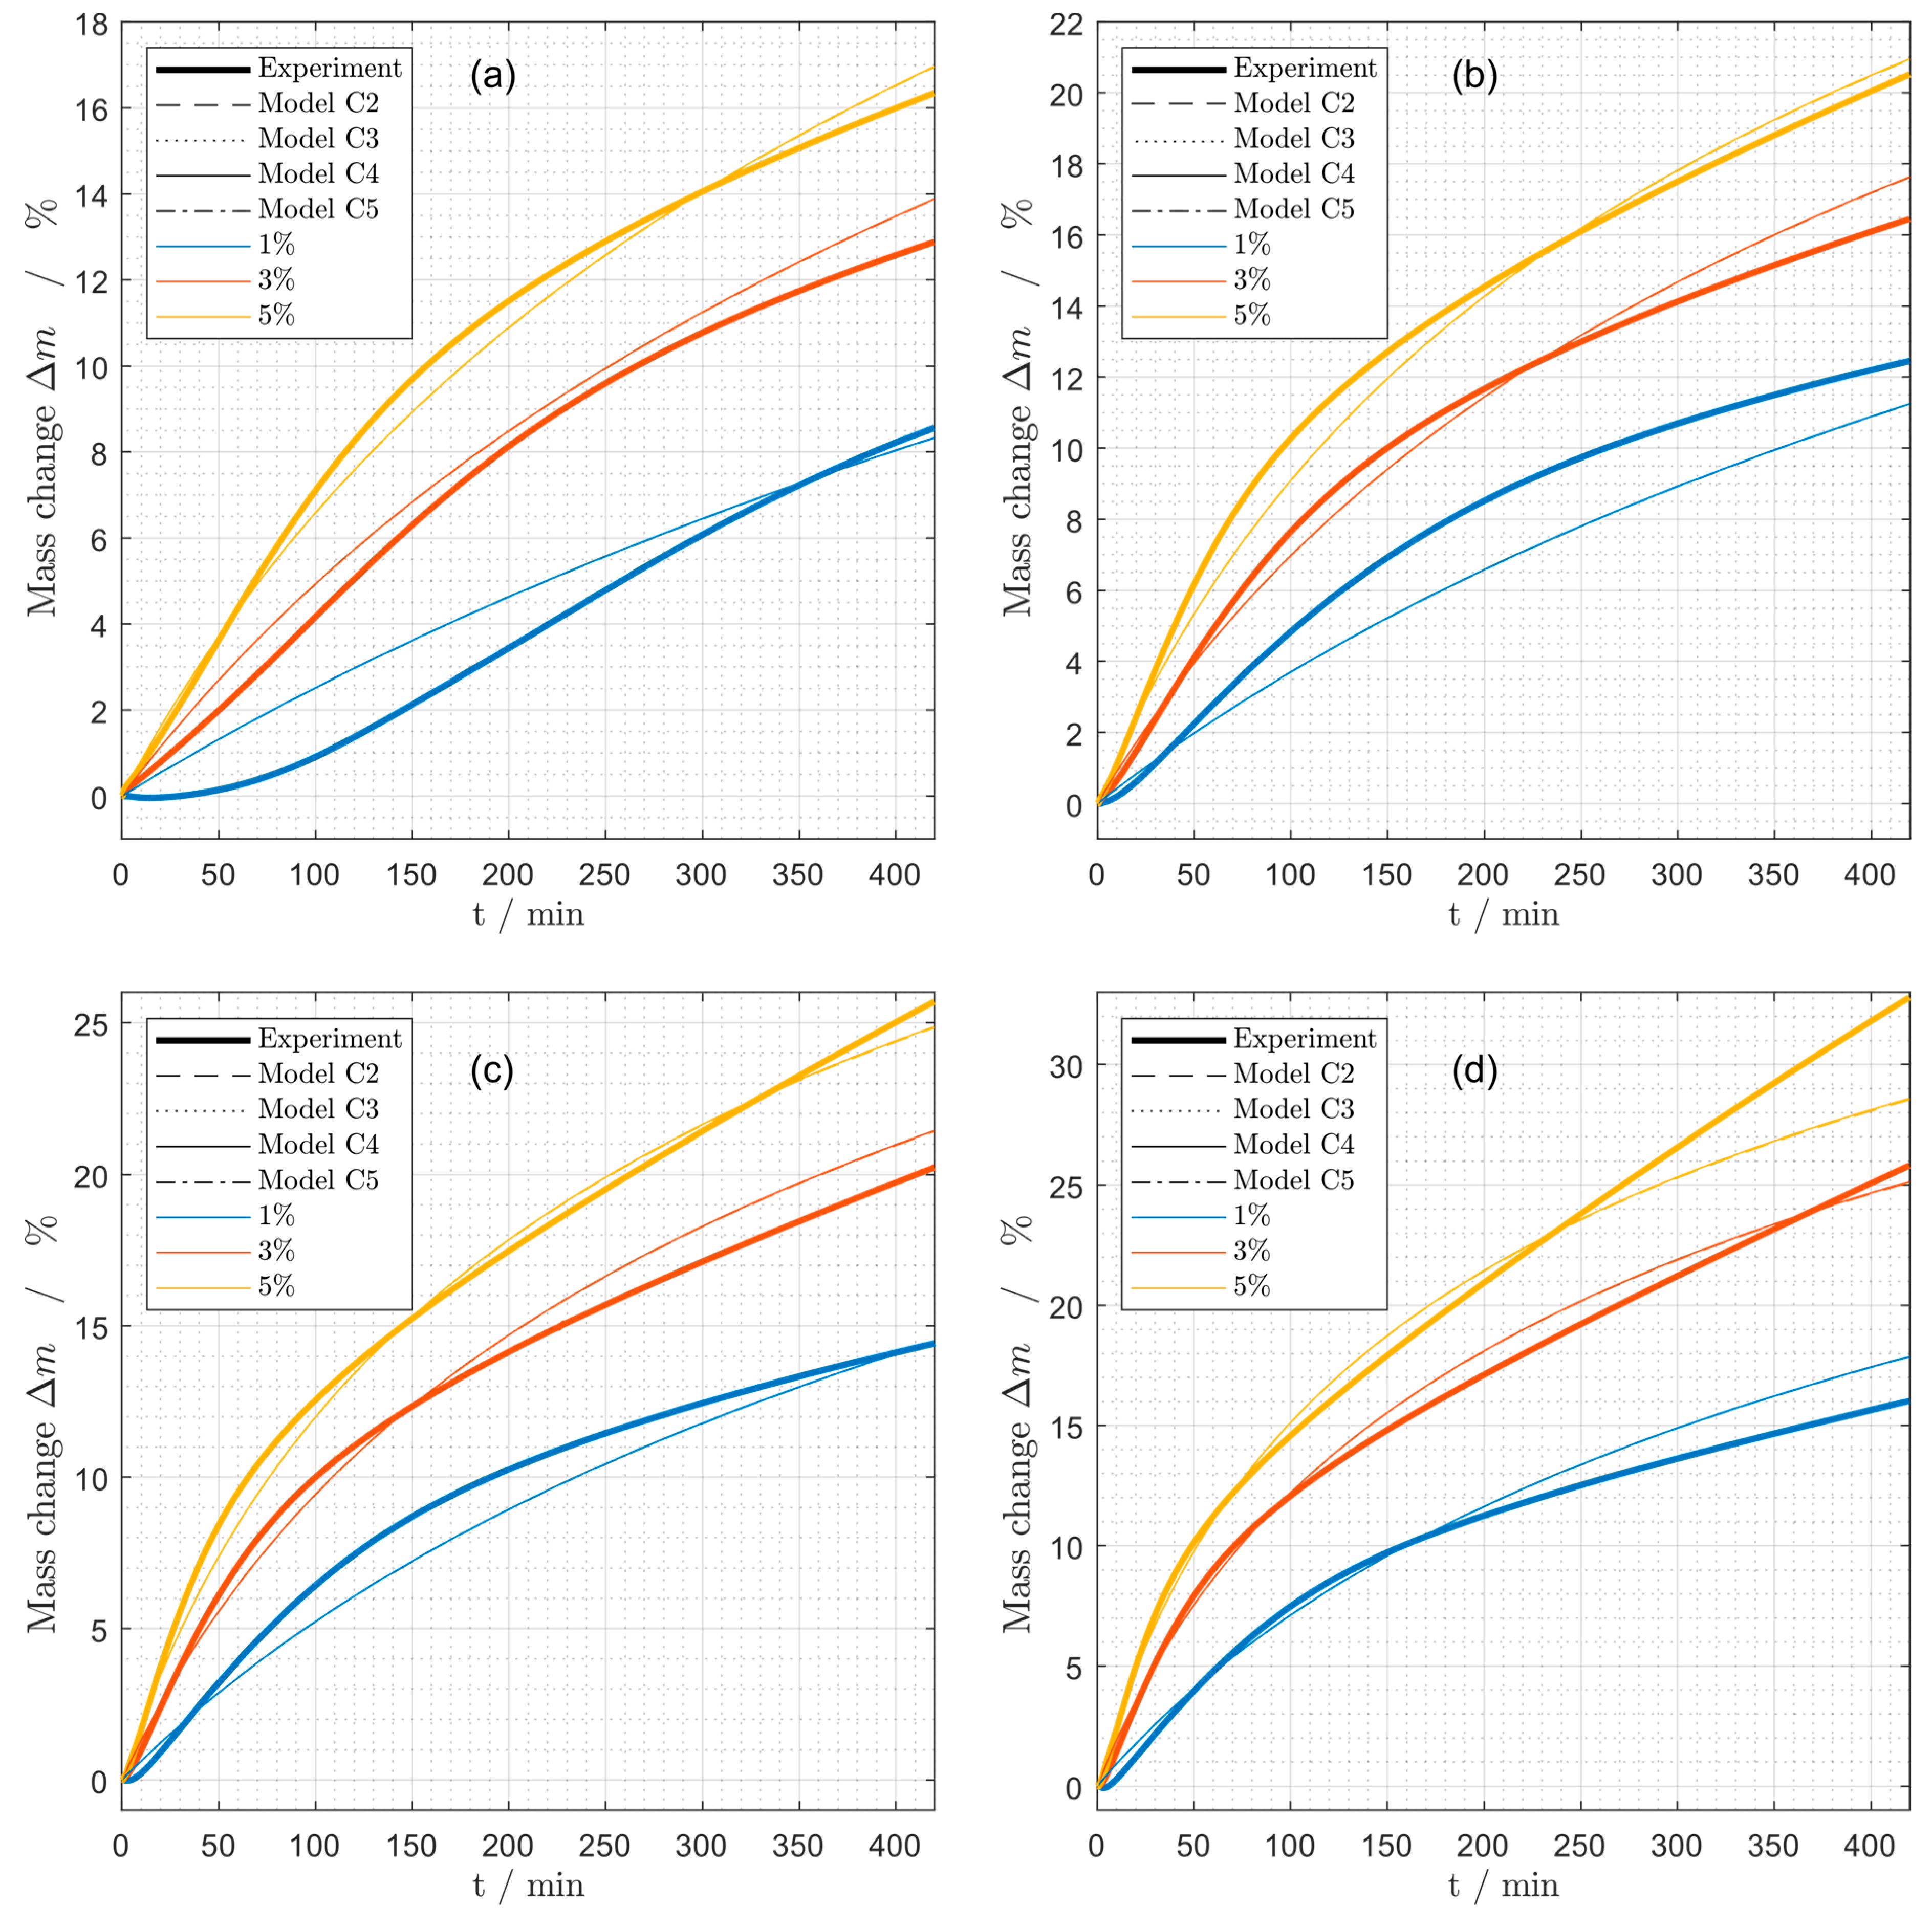
Figure 8.
Mass change during coking experiments at different propene concentrations (1%, 3%, 5%) at (a) 575 °C, (b) 600 °C, (c) 625 °C and (d) 650 °C for the models (C2), (C3), (C4) and (C5).
Figure 8.
Mass change during coking experiments at different propene concentrations (1%, 3%, 5%) at (a) 575 °C, (b) 600 °C, (c) 625 °C and (d) 650 °C for the models (C2), (C3), (C4) and (C5).
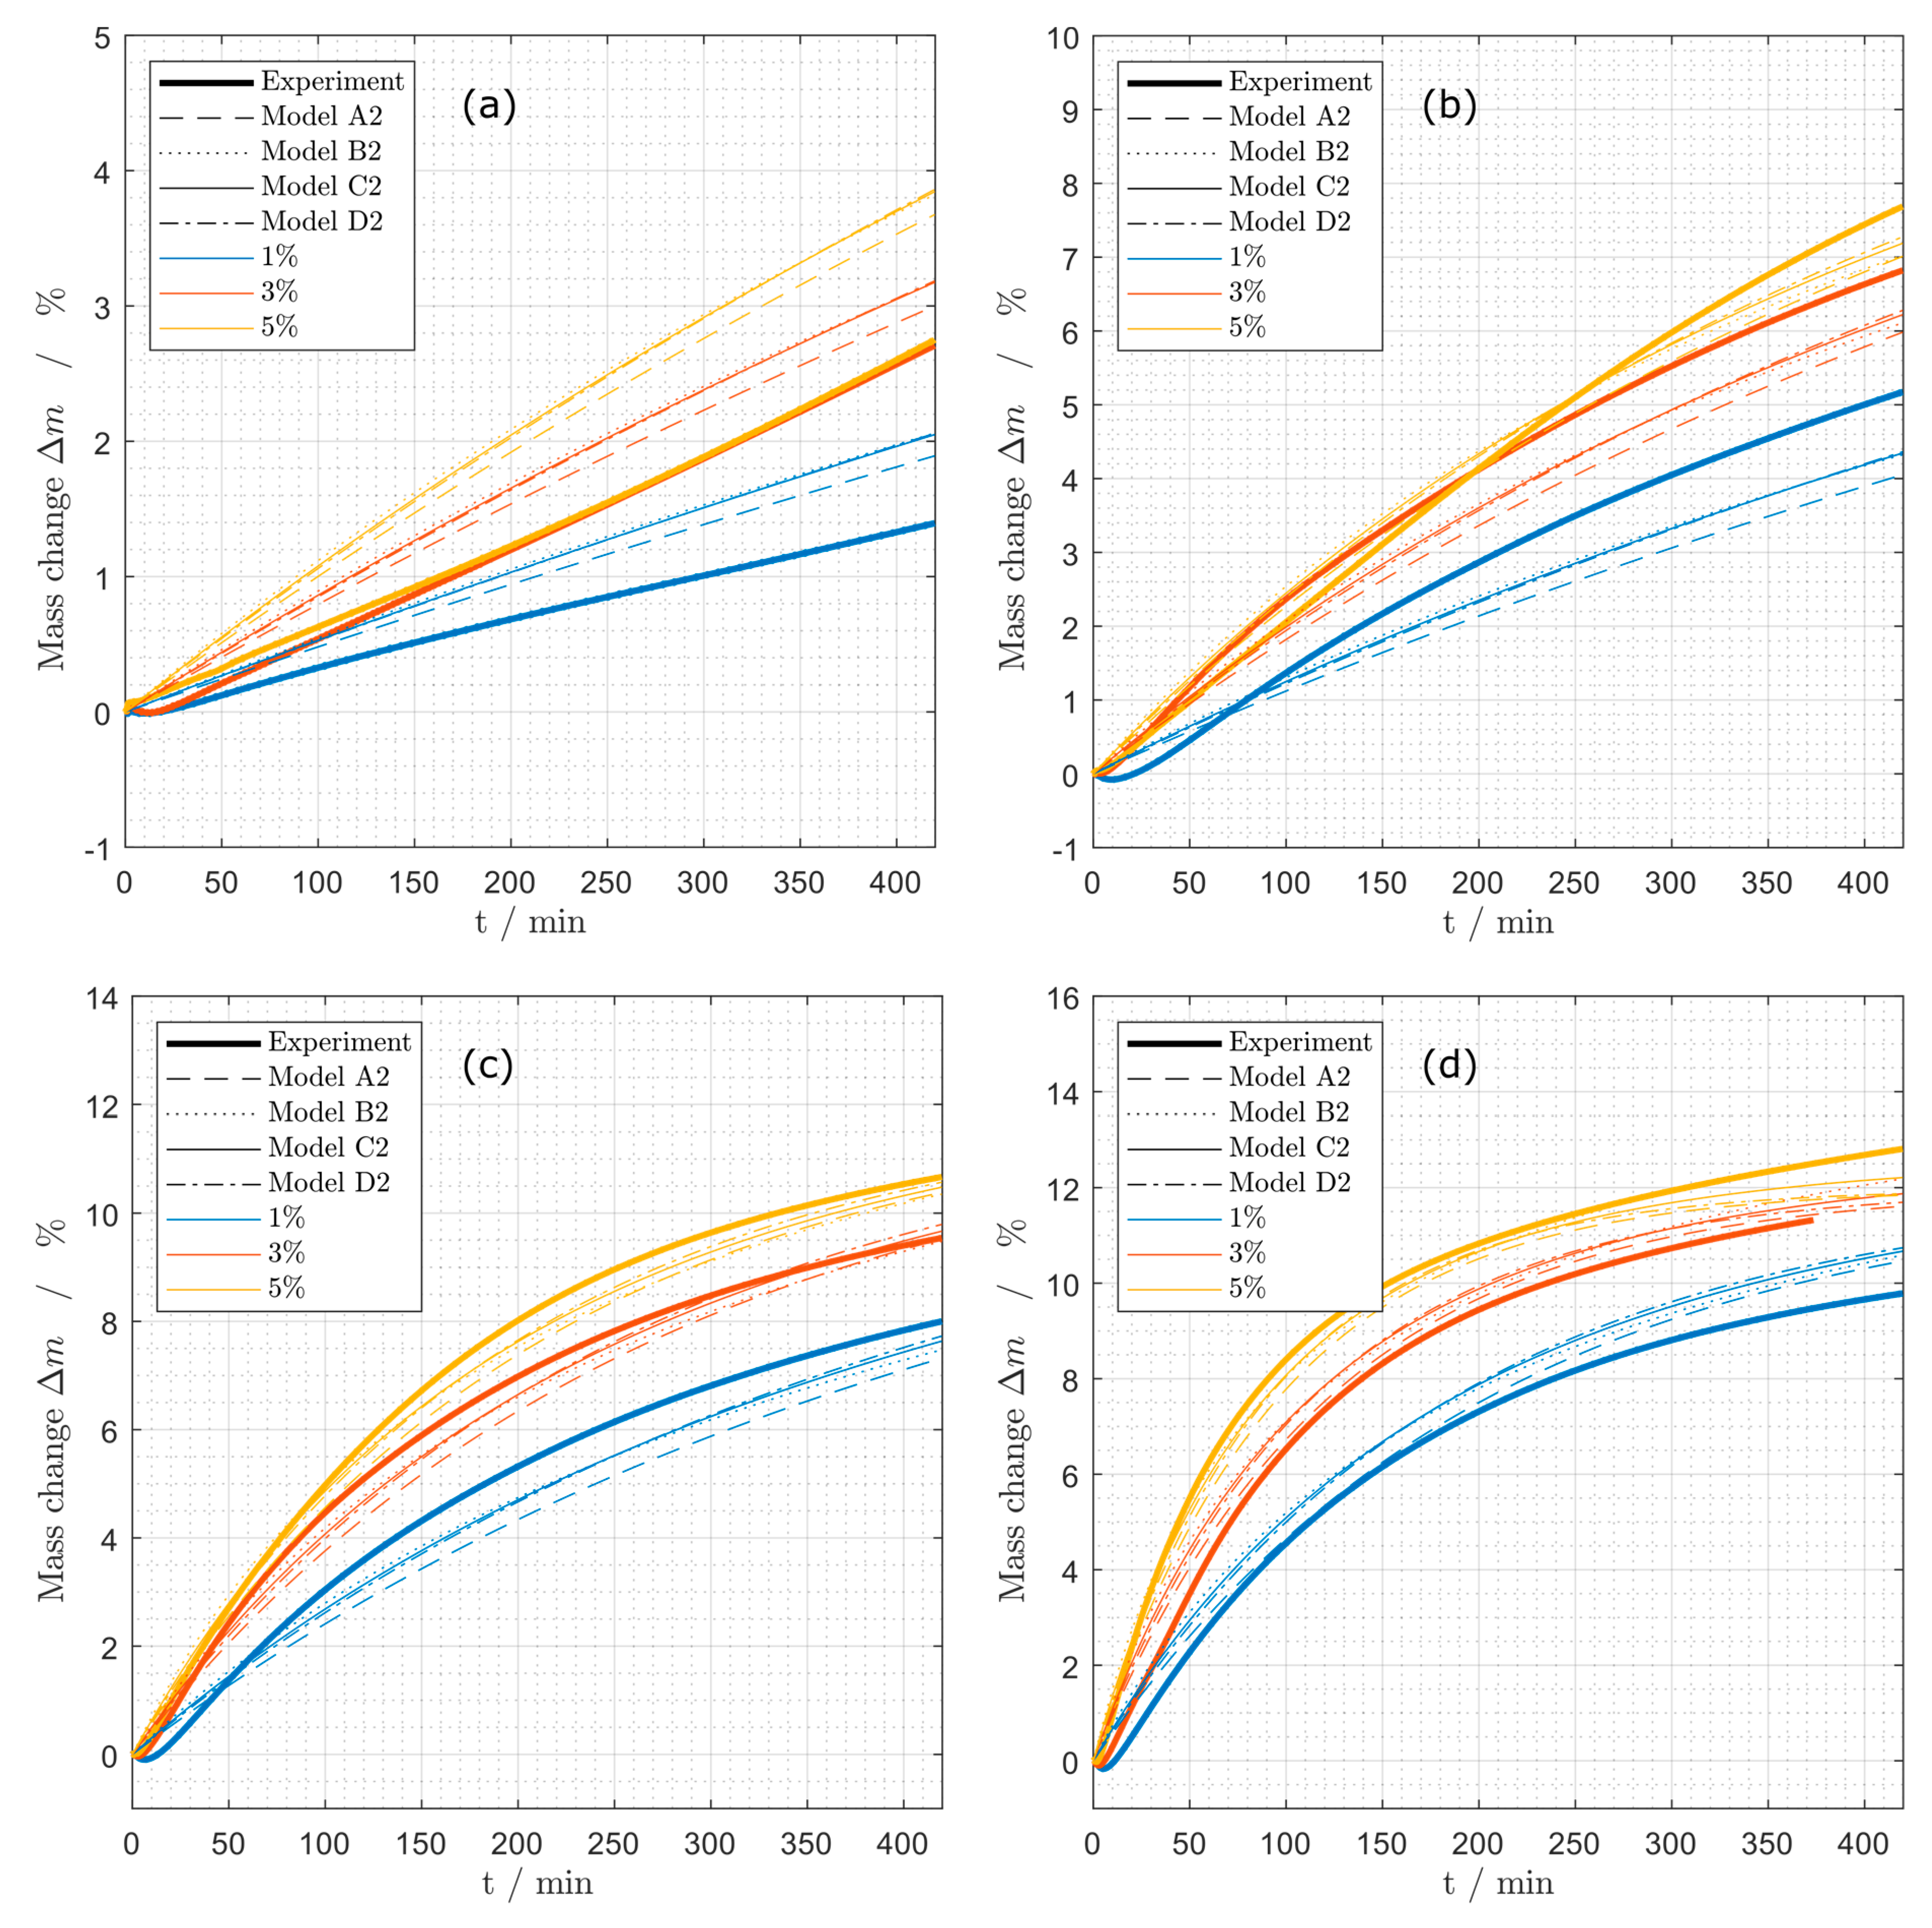
Figure 9.
Mass change during coking experiments at different propane concentrations (1%, 3%, 5%) at (
a) 575 °C, (
b) 600 °C, (
c) 625 °C and (
d) 650 °C for the models (A2), (B2), (C2) and (D2) as used for coking from propene (
Table 2).
Figure 9.
Mass change during coking experiments at different propane concentrations (1%, 3%, 5%) at (
a) 575 °C, (
b) 600 °C, (
c) 625 °C and (
d) 650 °C for the models (A2), (B2), (C2) and (D2) as used for coking from propene (
Table 2).
Figure 10.
Mass change during coking experiments at different propane concentrations (1%, 3%, 5%) at (a) 575 °C, (b) 600 °C, (c) 625 °C and (d) 650 °C for the models (C2), (C3), (C4) and (C5) as used for coking from propene.
Figure 10.
Mass change during coking experiments at different propane concentrations (1%, 3%, 5%) at (a) 575 °C, (b) 600 °C, (c) 625 °C and (d) 650 °C for the models (C2), (C3), (C4) and (C5) as used for coking from propene.
Figure 11.
Regeneration behavior for samples from different catalyst segments in the lab scale fixed bed reactor at (A) constant oxygen concentration and (B) constant temperature and varied oxygen concentration for catalyst deactivated at deactivation condition 1.
Figure 11.
Regeneration behavior for samples from different catalyst segments in the lab scale fixed bed reactor at (A) constant oxygen concentration and (B) constant temperature and varied oxygen concentration for catalyst deactivated at deactivation condition 1.
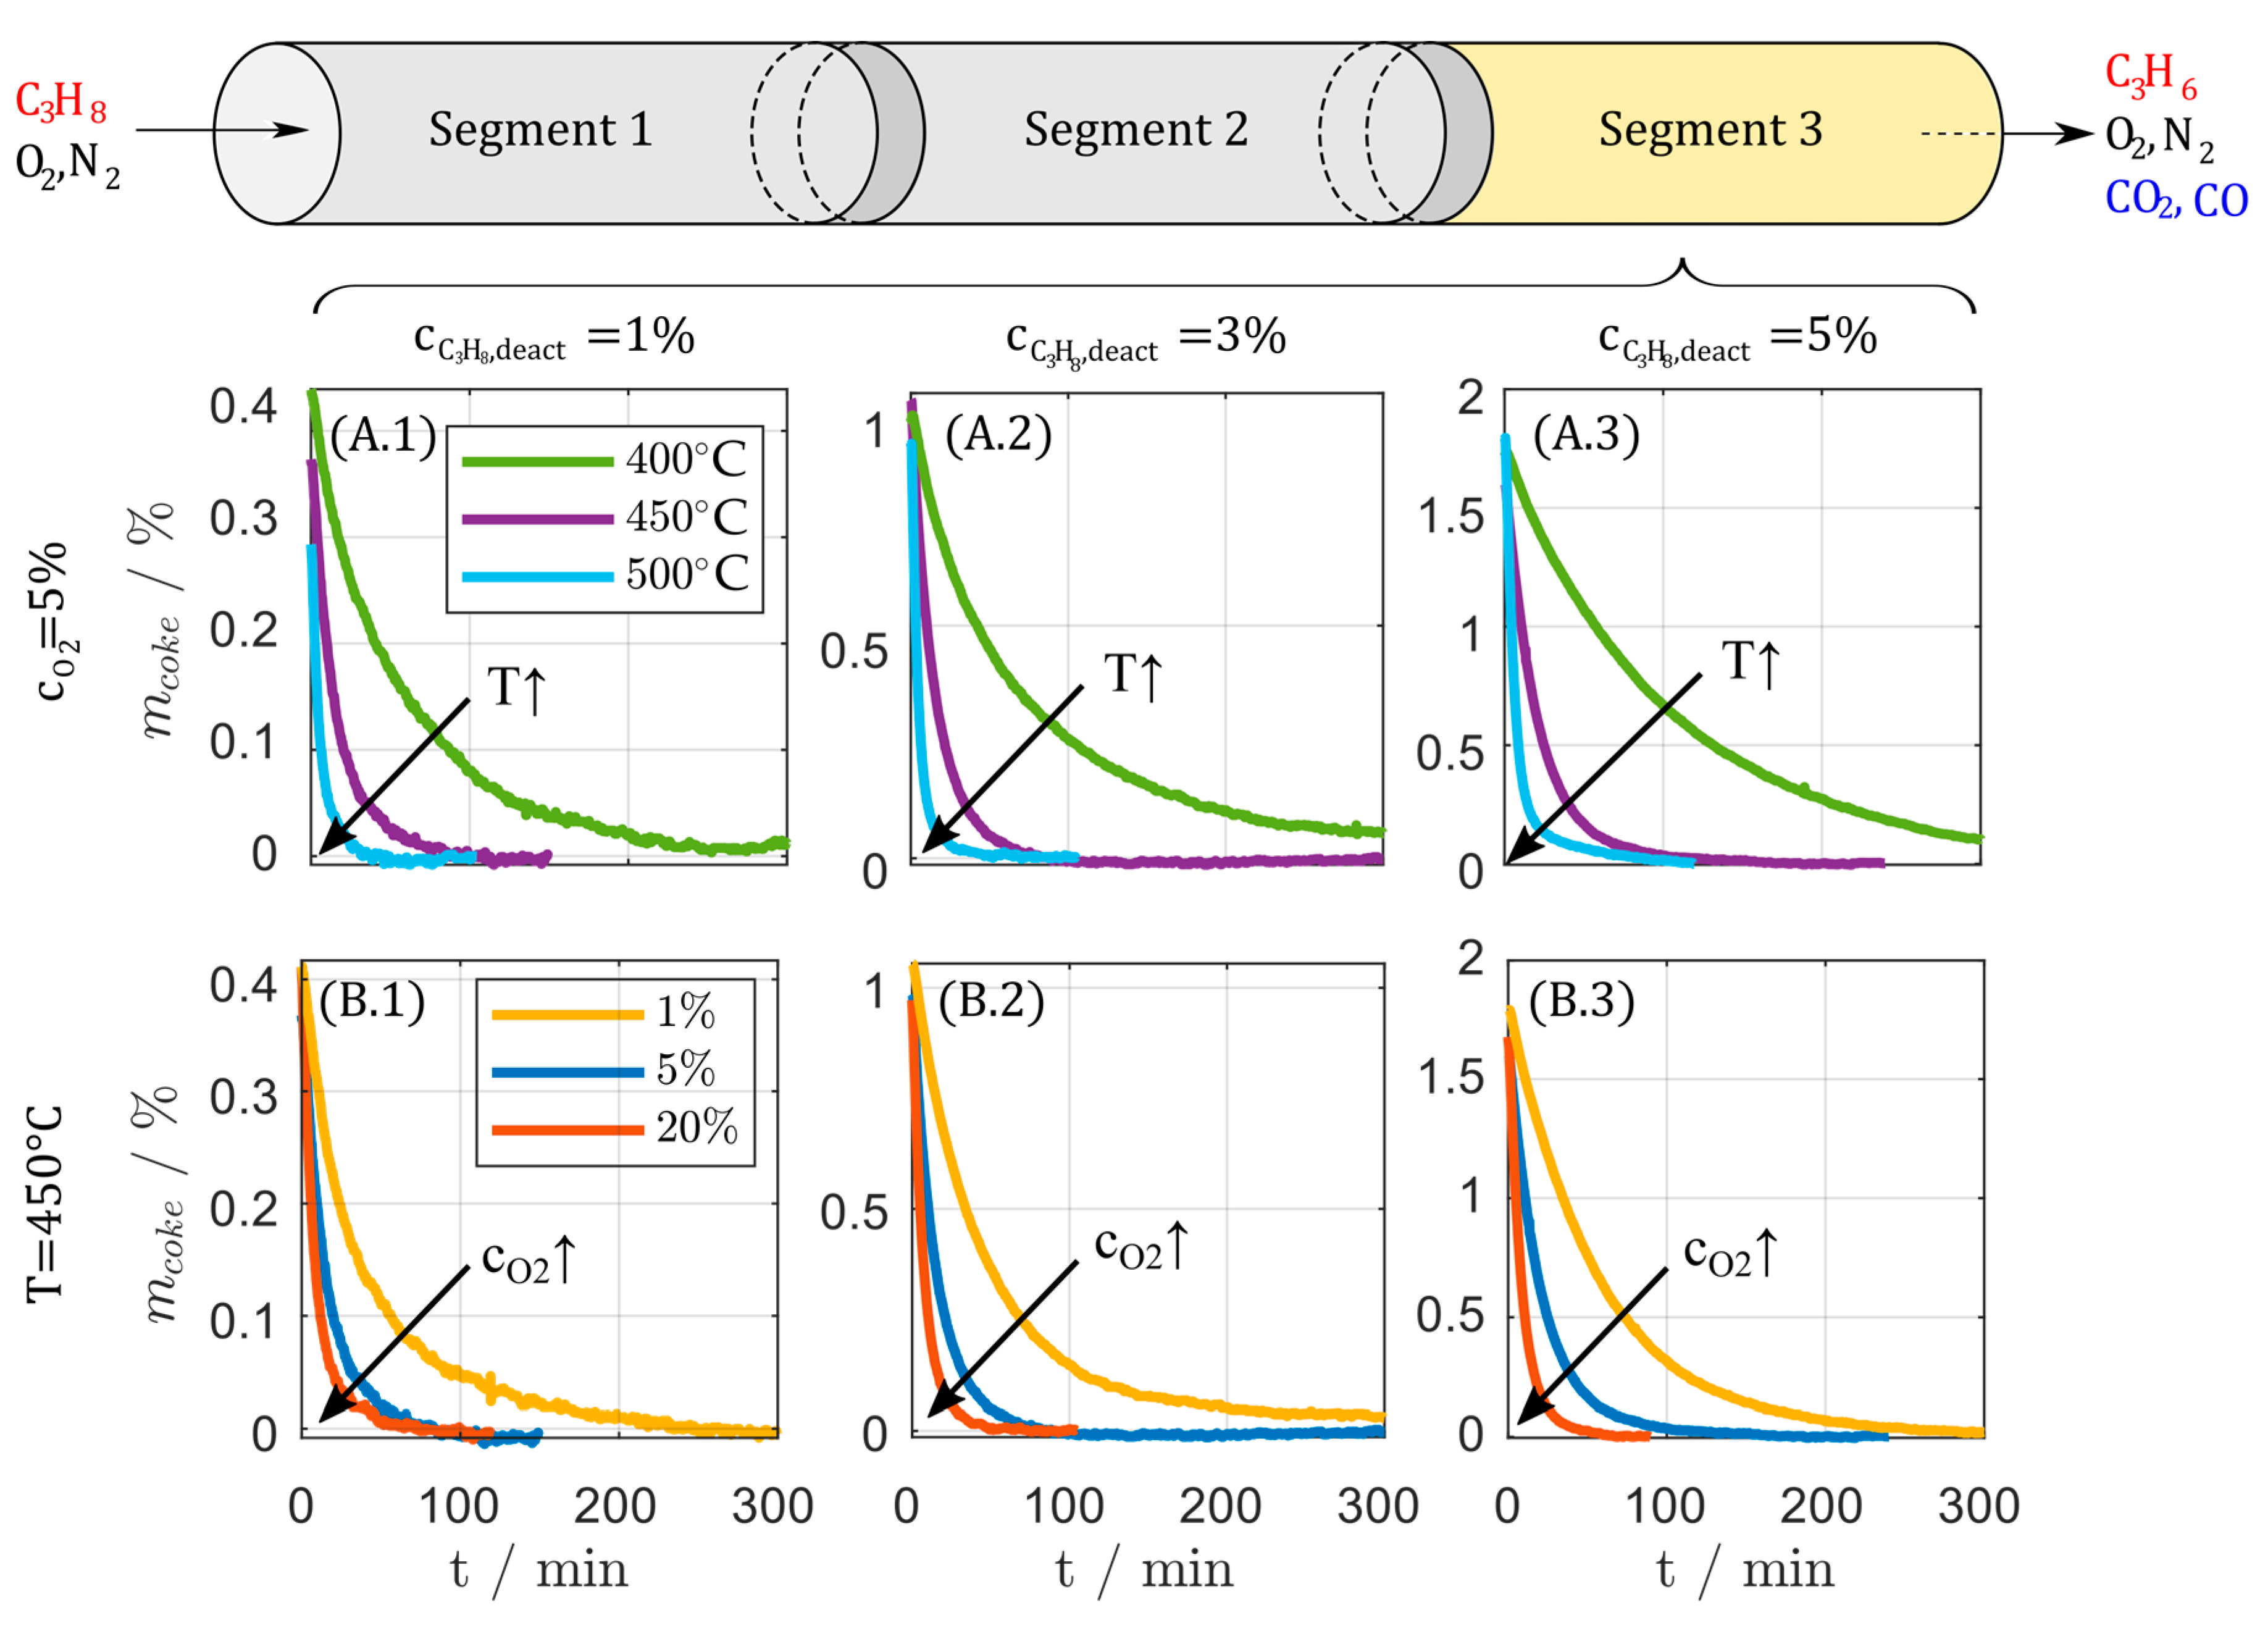
Figure 12.
Regeneration behavior for samples from catalyst bed segment 3 in the lab scale fixed bed reactor at (A) constant oxygen concentration and (B) constant temperature and varied oxygen concentration for catalyst deactivated at deactivation condition 2.
Figure 12.
Regeneration behavior for samples from catalyst bed segment 3 in the lab scale fixed bed reactor at (A) constant oxygen concentration and (B) constant temperature and varied oxygen concentration for catalyst deactivated at deactivation condition 2.
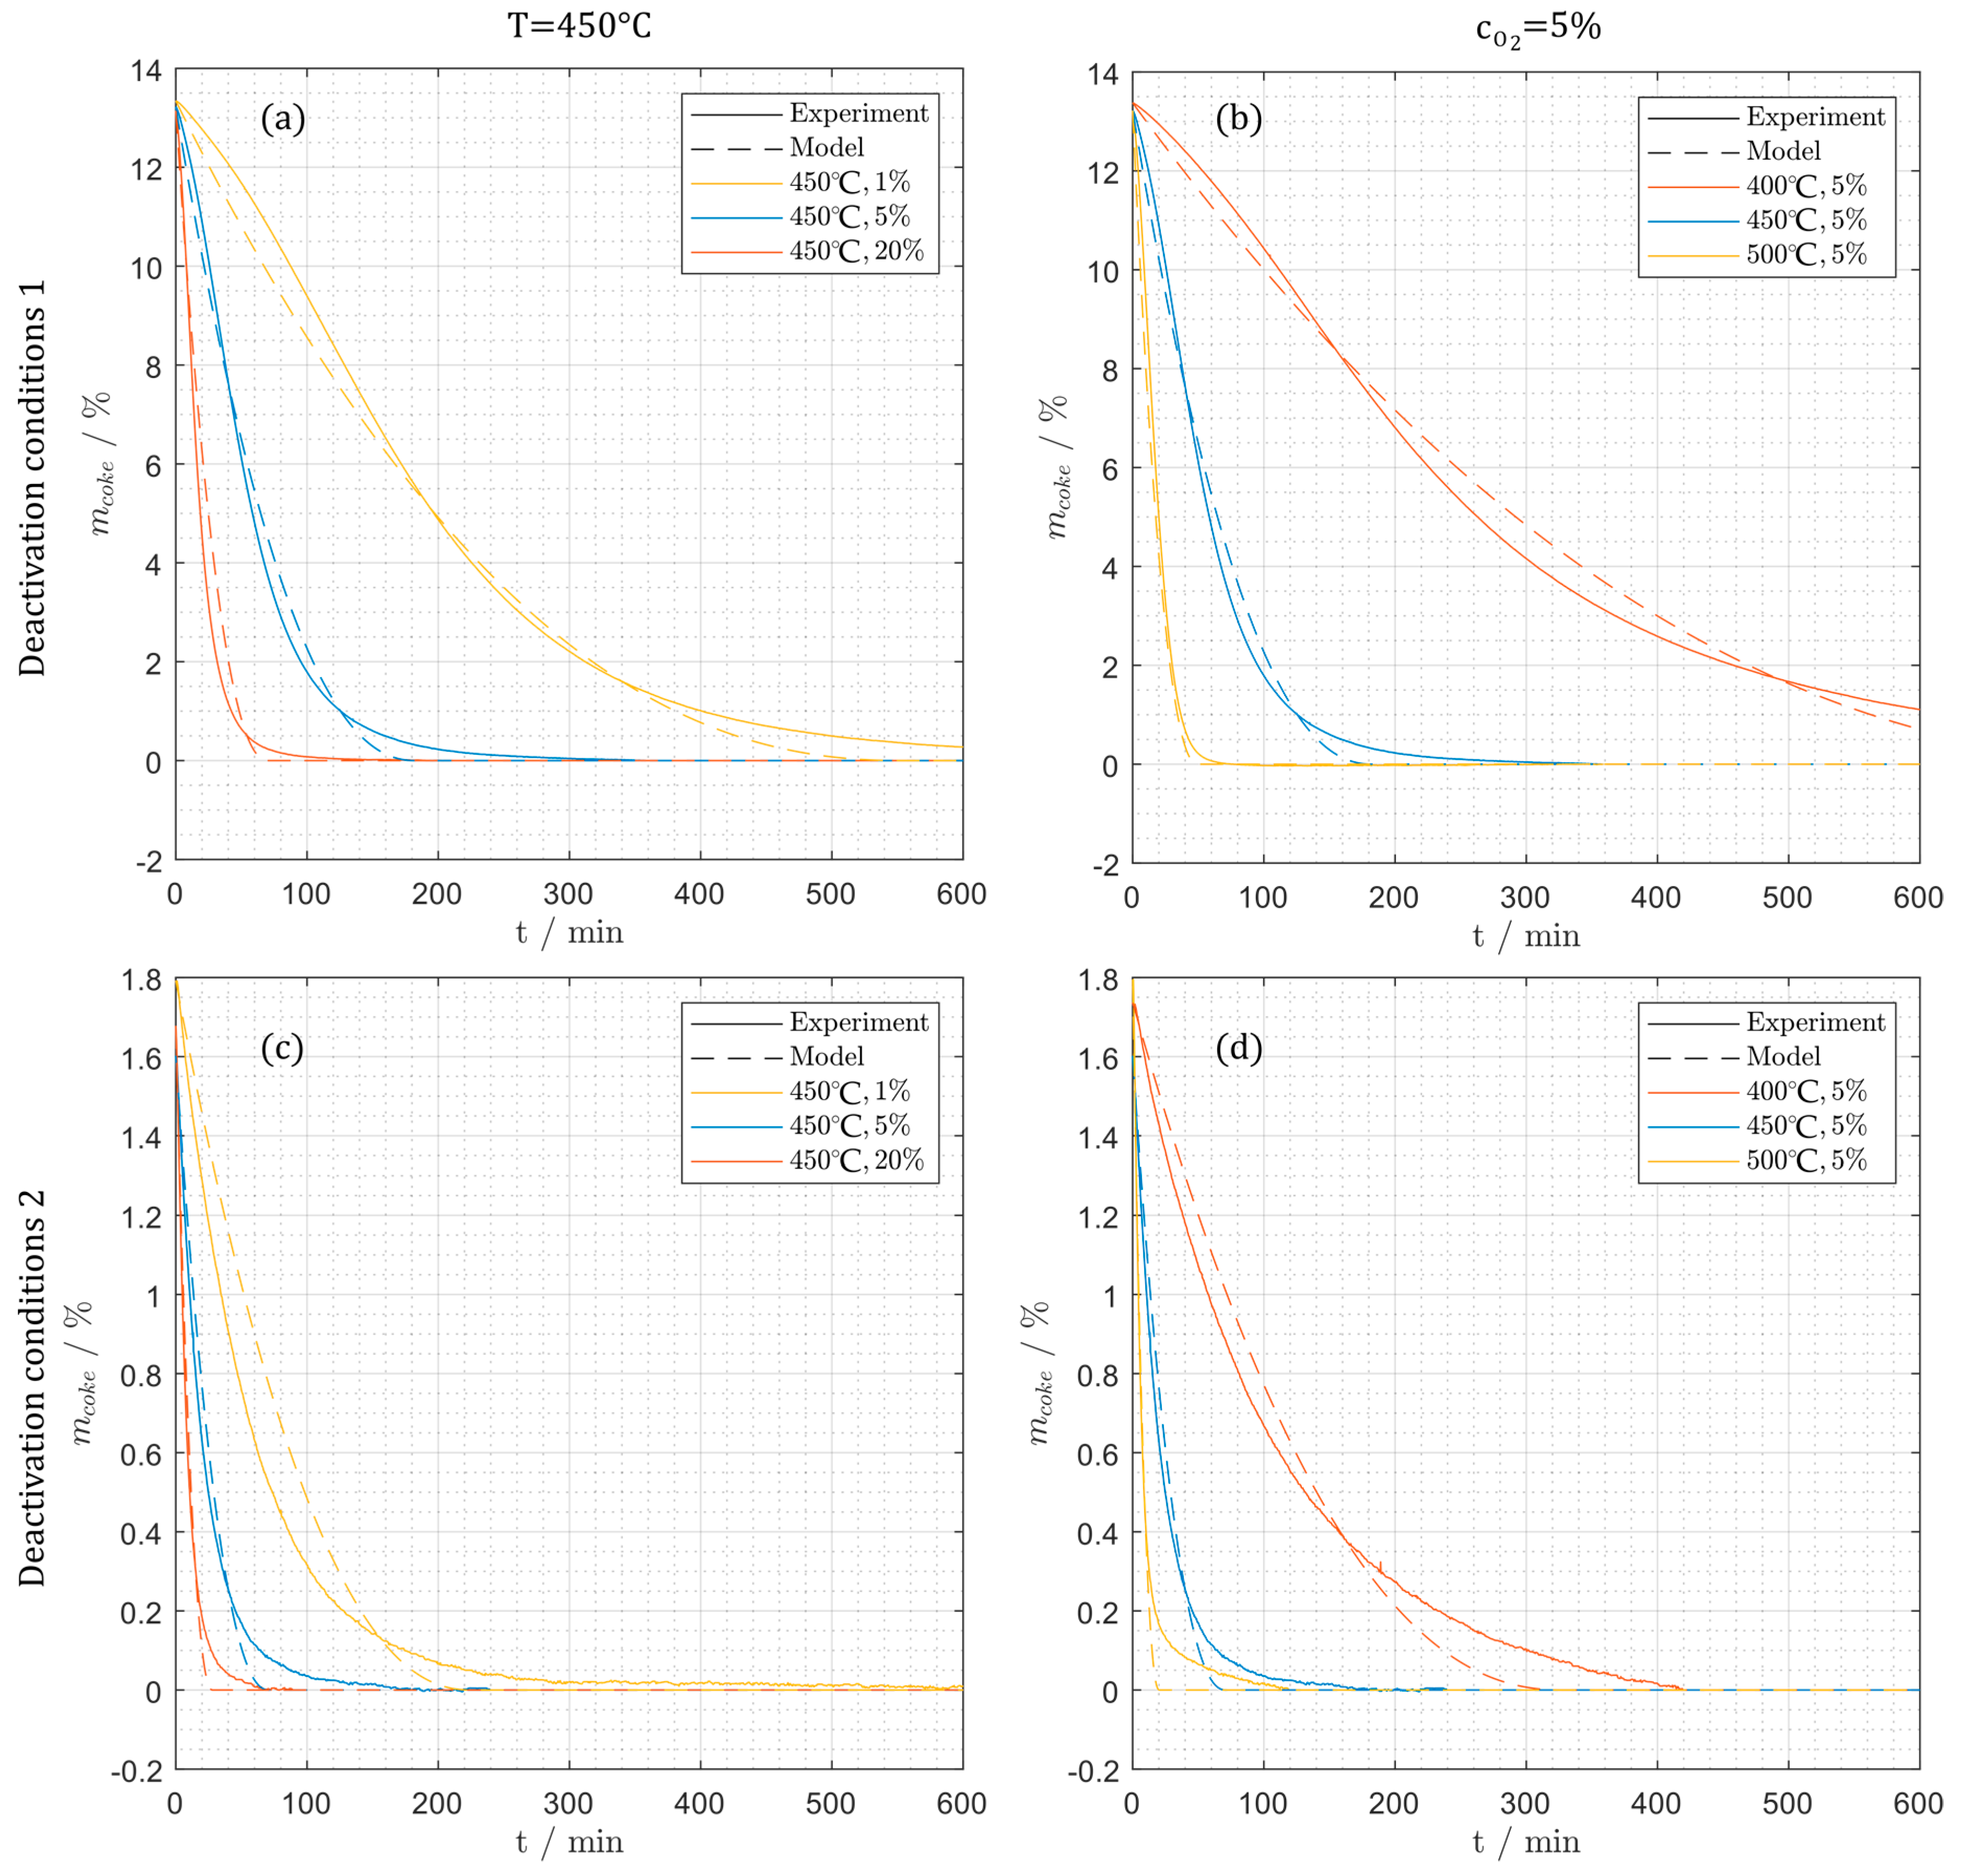
Figure 13.
Comparison between the simulation and the experimental mass changes during regeneration for (a) deactivation condition 1 at varying oxygen concentration (1%, 5%, 20%), (b) deactivation condition 1 at different temperatures (400 °C, 450 °C, 500 °C), (c) deactivation condition 2 at different oxygen concentrations, (d) deactivation condition 2 at different temperatures.
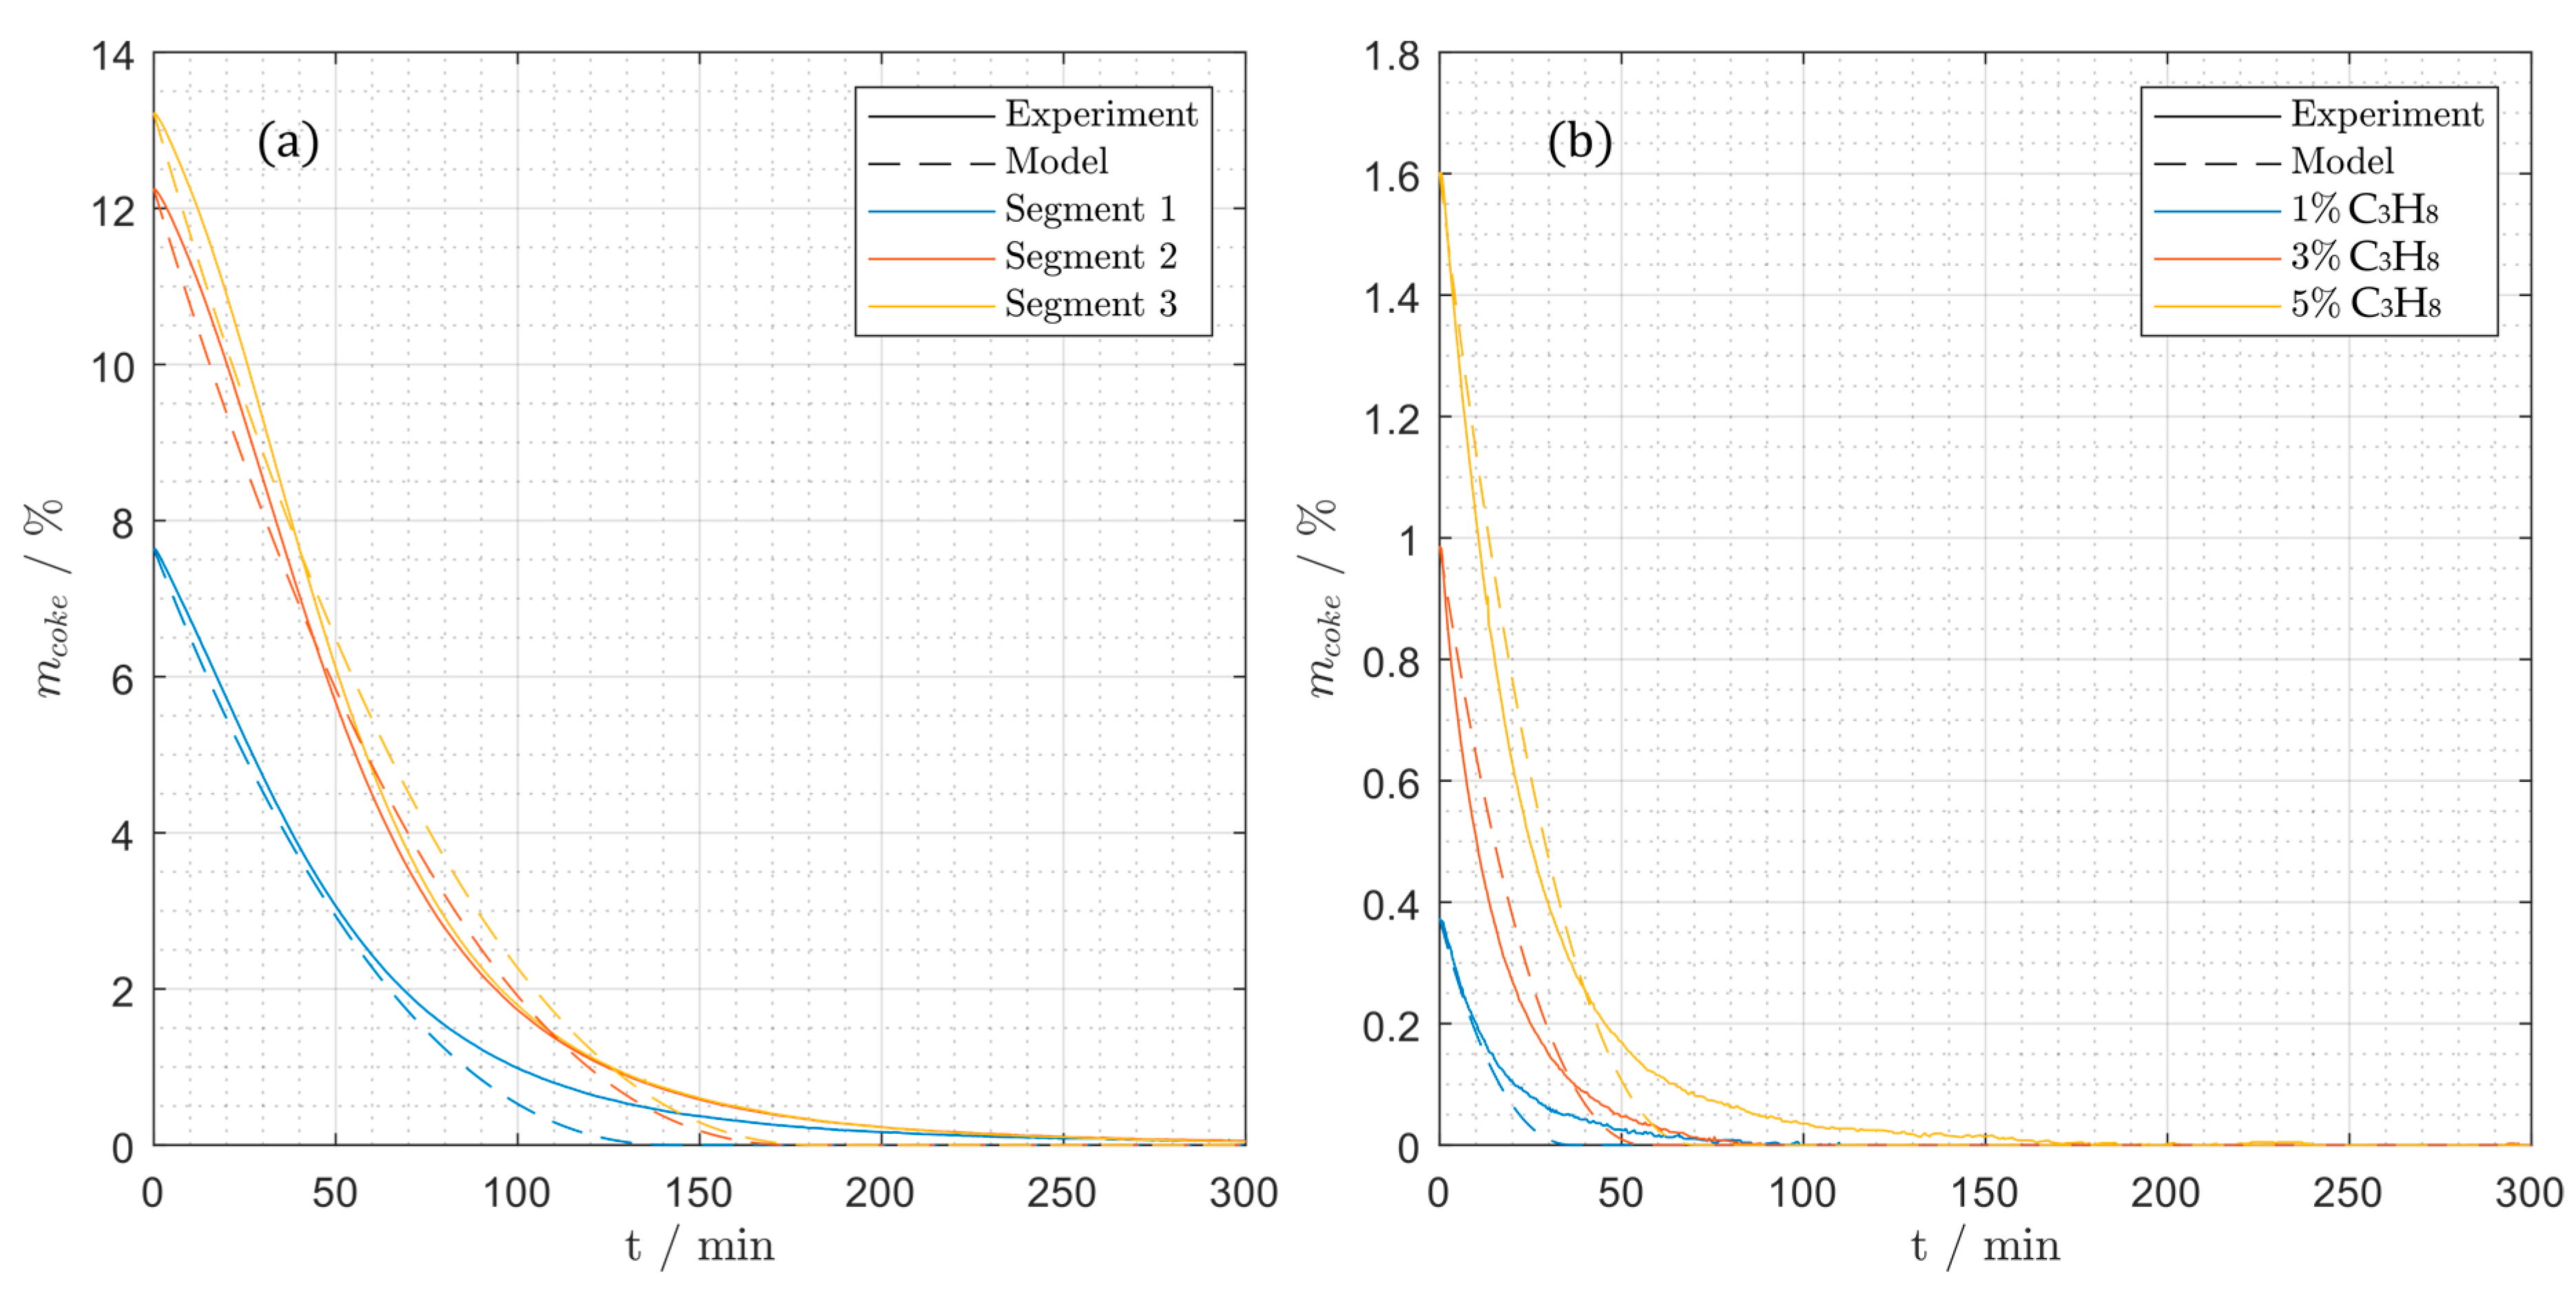
Figure 14.
(a) Comparison of the regeneration of different segments of the catalyst packing deactivated at deactivation condition 1, (b) influence of propane concentration (1%, 5%, 20%) on coke loading in segment 3 (deact. condition 2).
Figure 14.
(a) Comparison of the regeneration of different segments of the catalyst packing deactivated at deactivation condition 1, (b) influence of propane concentration (1%, 5%, 20%) on coke loading in segment 3 (deact. condition 2).
Figure 15.
Measurements during periodic experiments: (a) mass changes (TGA) and temperature, (b) oxygen and propane concentrations, (c) CO, CO2, ethene and ethane concentrations for periodic experiment (1).
Figure 15.
Measurements during periodic experiments: (a) mass changes (TGA) and temperature, (b) oxygen and propane concentrations, (c) CO, CO2, ethene and ethane concentrations for periodic experiment (1).
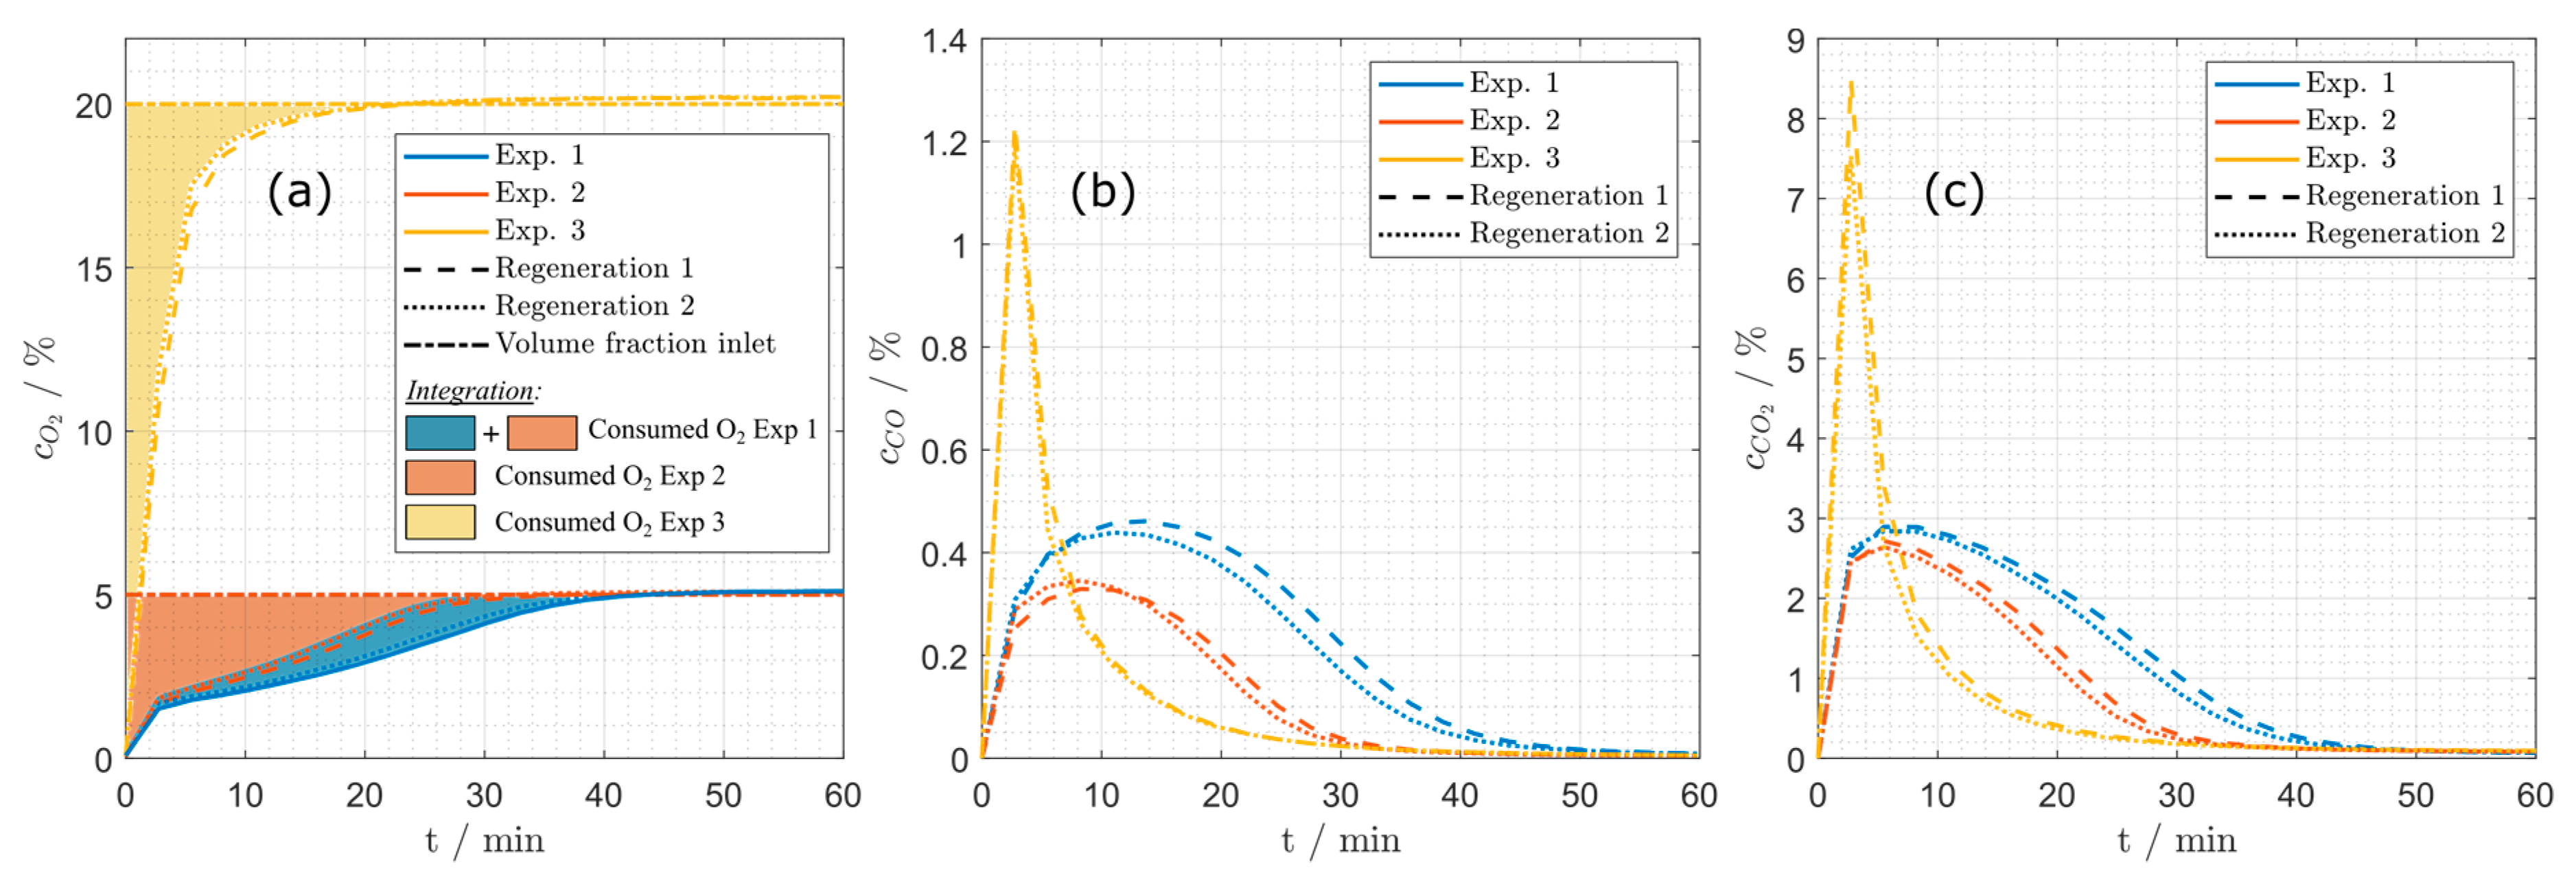
Figure 16.
Comparison of measured concentrations during all regeneration phases: (a) oxygen, (b) CO, (c) CO2 (for experimental conditions see Table 15).
Figure 16.
Comparison of measured concentrations during all regeneration phases: (a) oxygen, (b) CO, (c) CO2 (for experimental conditions see Table 15).
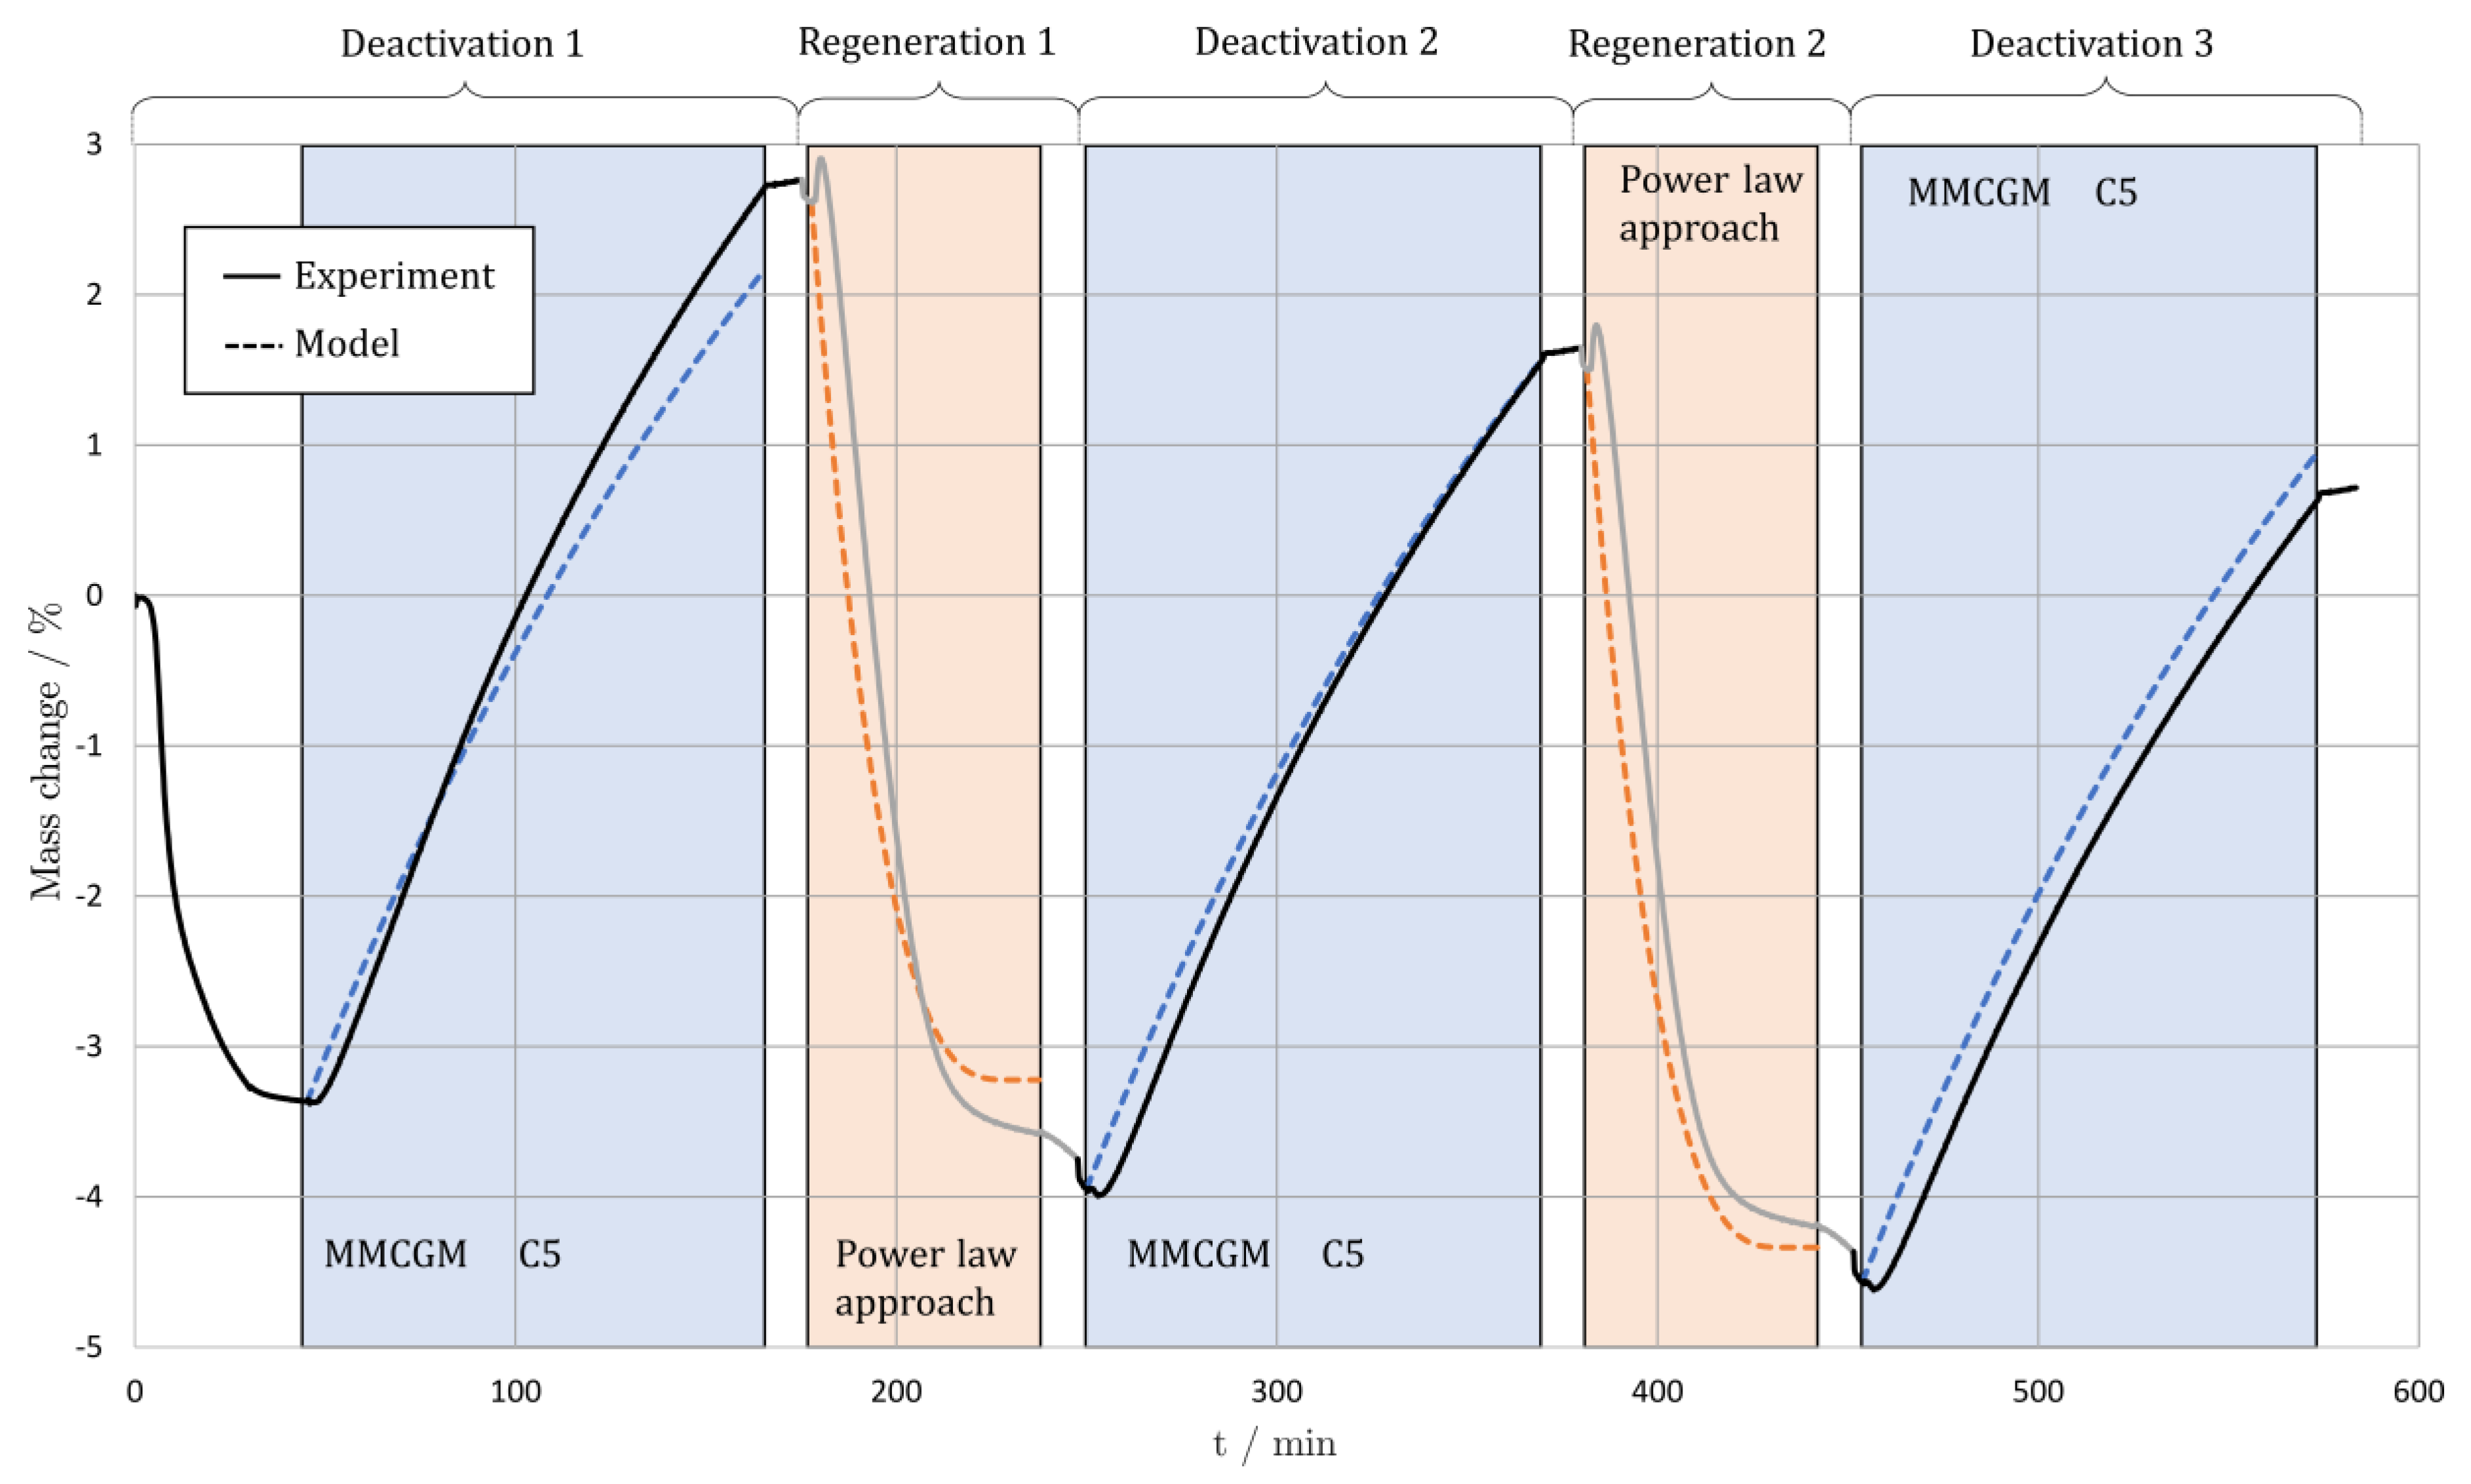
Figure 17.
Experimental (TGA) and simulated mass changes during periodic experiment 1 (for experimental conditions see Table 15).
Figure 17.
Experimental (TGA) and simulated mass changes during periodic experiment 1 (for experimental conditions see Table 15).
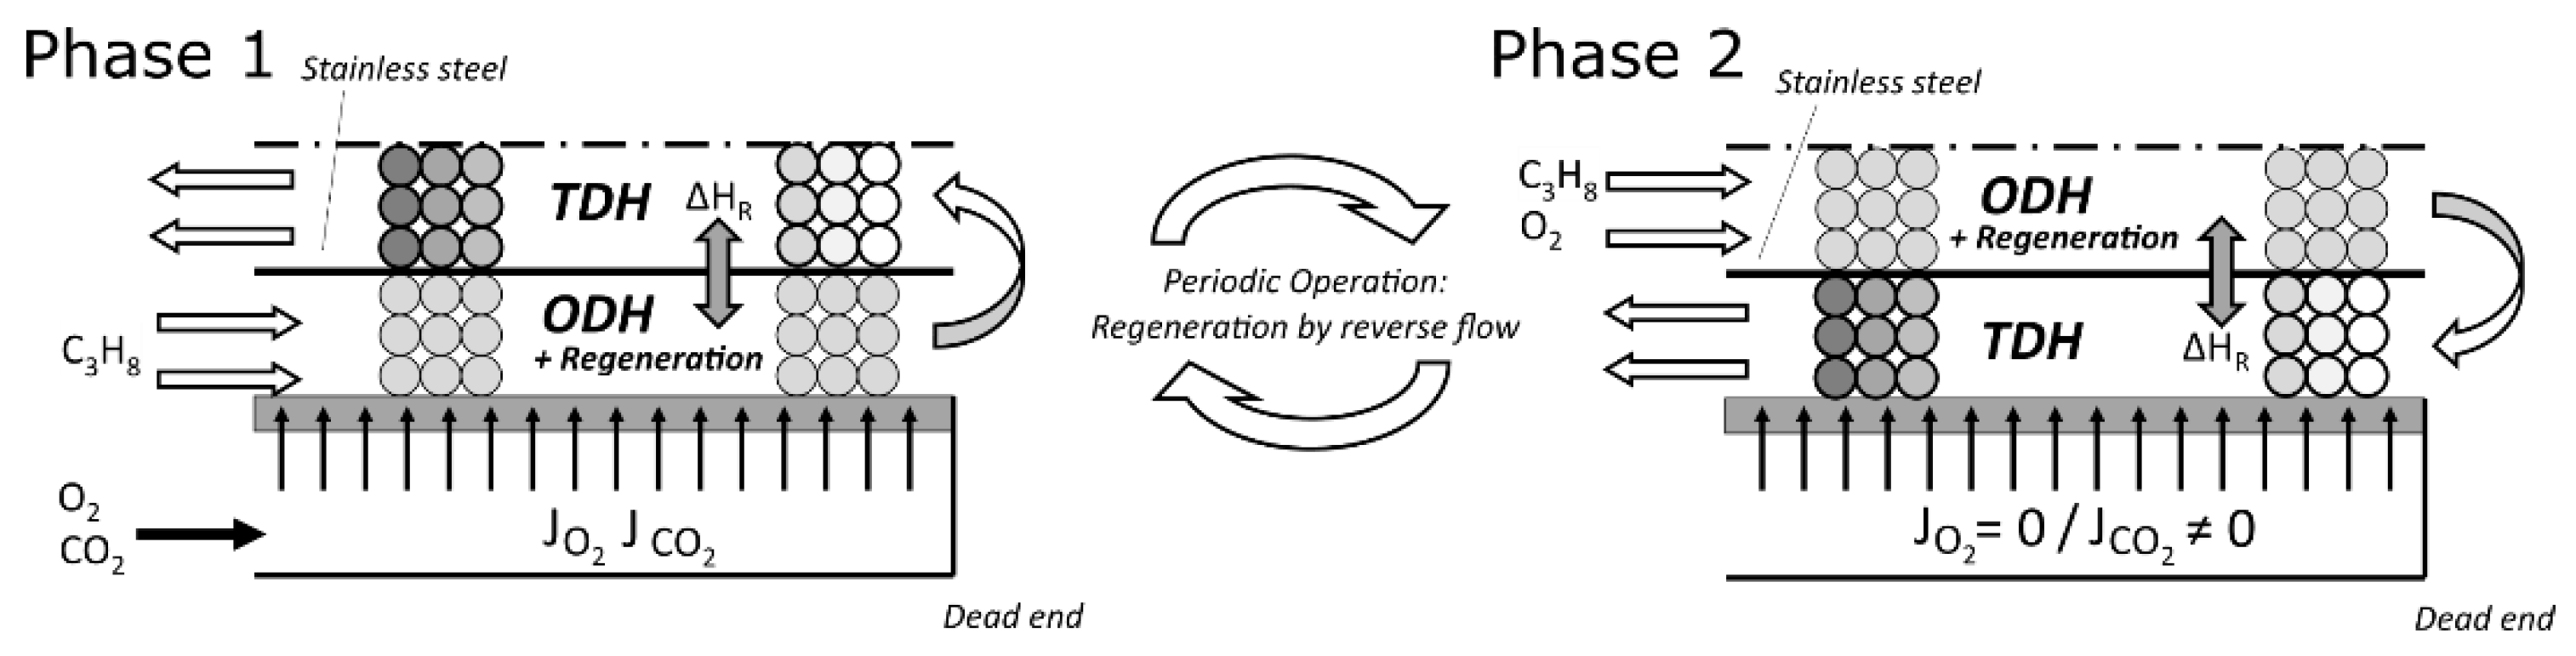
Figure 18.
Integrated membrane reactor concept for periodic operation of the reactor including operando regeneration by flow reversal.
Figure 18.
Integrated membrane reactor concept for periodic operation of the reactor including operando regeneration by flow reversal.
Table 1.
Integrated form of the multilayer-monolayer coke growth model (MMCGM, Equations (14)–(16)) for different reaction orders.
Table 1.
Integrated form of the multilayer-monolayer coke growth model (MMCGM, Equations (14)–(16)) for different reaction orders.
| (A1) | | | | | (17) |
| (B1) | | | | | (18) |
| (C1) 1 | | | | | (19) |
| (D1) | | | | | (20) |
Table 2.
Integrated form of the multilayer-monolayer coke growth model (MMCGM, Equations (14), (16) and (21)) for different reaction orders extended by a precursor concentration dependent term.
Table 2.
Integrated form of the multilayer-monolayer coke growth model (MMCGM, Equations (14), (16) and (21)) for different reaction orders extended by a precursor concentration dependent term.
| (A2) | | | | | (22) |
| (B2) | | | | | (23) |
| (C2) 1 | | | | | (24) |
| (D2) | | | | | (25) |
Table 3.
Information criteria and comparison of the models (A2), (B2), (C2) and (D2) for deactivation experiments using propene.
Table 3.
Information criteria and comparison of the models (A2), (B2), (C2) and (D2) for deactivation experiments using propene.
| - | A2 | B2 | C2 | D2 |
|---|
| 31,483 | 22,259 | 17,241 | 31,483 |
| 6 | 6 | 7 | 6 |
| 66,209.7 | 59,220.4 | 54,072.2 | 66,209.7 |
| 0.00% | 0.00% | 100.00% | 0.00% |
Table 4.
Information criteria and comparison of the models (C2), (C3), (C4) and (C5) for deactivation using propene.
Table 4.
Information criteria and comparison of the models (C2), (C3), (C4) and (C5) for deactivation using propene.
| - | C2 | C3 | C4 | C5 |
|---|
| 17,240.8 | 17,164.9 | 17,166.9 | 17,166.7 |
| 7 | 5 | 9 | 7 |
| 54,072 | 53,979 | 53,990 | 53,985 |
| 0.00% | 95.19% | 0.52% | 4.29% |
Table 5.
Optimized parameters of model C3 to describe the coking behavior of the VOx catalyst.
Table 5.
Optimized parameters of model C3 to describe the coking behavior of the VOx catalyst.
| Parameter | Opt. Value | Confidence Intervals | Unit |
|---|
| | | | |
| | | | - |
| | | | |
| | | | |
| | | | - |
Table 6.
Information criteria and comparison of the models (A2), (B2), (C2) and (D2) for the deactivation of VOx catalyst with propane.
Table 6.
Information criteria and comparison of the models (A2), (B2), (C2) and (D2) for the deactivation of VOx catalyst with propane.
| - | A2 | B2 | C2 | D2 |
|---|
| 4889.5 | 5078.9 | 4783.5 | 4889.4 |
| 6 | 6 | 7 | 6 |
| 28,665 | 29,431 | 28,225 | 28,664 |
| 0.00% | 0.00% | 100.00% | 0.00% |
Table 7.
Information criteria and comparison of the models (C2), (C3), (C4) and (C5) for deactivation using propane.
Table 7.
Information criteria and comparison of the models (C2), (C3), (C4) and (C5) for deactivation using propane.
| - | C2 | C3 | C4 | C5 |
|---|
| 4783.5 | 5509.6 | 3631.6 | 3631.6 |
| 7 | 5 | 9 | 7 |
| 28,225 | 31,070 | 22,675 | 22,671 |
| 0.00% | 0.00% | 11.92% | 88.08% |
Table 8.
Optimized parameters of model C5 to describe the coking behavior of the VOx catalyst using propene.
Table 8.
Optimized parameters of model C5 to describe the coking behavior of the VOx catalyst using propene.
| Parameter | Opt. Value | Confidence Intervals | Unit |
|---|
| | | | |
| | | | - |
| | | | |
| | | | |
| | | | - |
| | | | |
| | | | |
Table 9.
Optimal parameter for the regeneration model (Equation (29)).
Table 9.
Optimal parameter for the regeneration model (Equation (29)).
| Parameter | Opt. Value | Unit |
|---|
| | | |
| | | |
| | | - |
| | | - |
Table 10.
Comparison between gasified carbon and mass loss recorded by the TGA (for experimental conditions see Table 15).
Table 10.
Comparison between gasified carbon and mass loss recorded by the TGA (for experimental conditions see Table 15).
| - | - | Exp 1 | Exp 2 | Exp 3 |
|---|
| - | - | Reg 1 | Reg 2 | Reg 1 | Reg 2 | Reg 1 | Reg 2 |
|---|
| GC | Mass carbon (combustion products)/mg | 43.41 | 40.49 | 30.25 | 28.19 | 30.16 | 26.43 |
| TGA | Total mass change/mg | 42.07 | 39.29 | 27.27 | 25.55 | 28.44 | 25.11 |
| - | Deviation carbon content: GC vs. TGA | 3.18% | 3.06% | 10.93% | 10.33% | 6.05% | 5.24% |
Table 11.
Data set for kinetic analysis of the deactivation kinetics of the catalyst (PA: propane; PE propene; ✓: tested; 🗶: not tested).
Table 11.
Data set for kinetic analysis of the deactivation kinetics of the catalyst (PA: propane; PE propene; ✓: tested; 🗶: not tested).
| - | 575 °C | 600 °C | 625 °C | 650 °C |
|---|
| - | PA/PE | PA/PE | PA/PE | PA/PE |
|---|
| 1% | ✓/✓ | ✓/✓ | ✓/✓ | ✓/✓ |
| 3% | ✓/✓ | ✓/✓ | ✓/✓ | 🗶/✓ |
| 5% | ✓/✓ | ✓/✓ | ✓/✓ | ✓/✓ |
Table 12.
Deactivation conditions of the samples used in regeneration experiments.
Table 12.
Deactivation conditions of the samples used in regeneration experiments.
| - | Deactivation Condition 1 | Deactivation Condition 2 |
|---|
| Temperature | 600 °C | 500 °C |
| Propane concentration | 5% | 1%, 3%, 5% |
| Oxygen concentration | 0% | 0% |
| Deactivation time | 48 h | 96 h |
| WHSV | 400 | 400 |
| Tested segment | 1, 2, 3 | 3 |
Table 13.
Deactivation conditions of the samples used in regeneration experiments.
Table 13.
Deactivation conditions of the samples used in regeneration experiments.
| - | - | Activation Condition |
|---|
| - | - | 450 °C,
5% Oxygen | 450 °C,
20% Oxygen | 400 °C,
5% Oxygen | 450 °C,
1% Oxygen | 500 °C,
5% Oxygen |
|---|
| Deactivation condition 1 | Segment 1 | ✓ | ✓ | ✓ | 🗶 | 🗶 |
| Segment 2 | ✓ | ✓ | ✓ | ✓ | 🗶 |
| Segment 3 | ✓ | ✓ | ✓ | ✓ | ✓ |
| Deactivation condition 2 | 1% propane | ✓ | ✓ | ✓ | ✓ | ✓ |
| 3% propane | ✓ | ✓ | ✓ | ✓ | ✓ |
| 5% propane | ✓ | ✓ | ✓ | ✓ | ✓ |
Table 14.
Regeneration times for different regeneration conditions.
Table 14.
Regeneration times for different regeneration conditions.
| - | | | |
|---|
| 400 °C | - | 24.5 h | - |
| 450 °C | 18.5 h | 6.5 h | 3 h |
| 500 °C | - | 2.5 h | - |
Table 15.
Experimental conditions of the deactivation and regeneration phase of the periodic experiments.
Table 15.
Experimental conditions of the deactivation and regeneration phase of the periodic experiments.
| - | Deactivation | Regeneration |
|---|
| Exp | T/°C | t/min | /mL/min | /% | T/°C | t/min | /mL/min | /% |
| (1) | 625 | 120 | 5 | 5 | 500 | 60 | 24 | 5 |
| (2) | 625 | 120 | 1 | 1 | 500 | 60 | 24 | 5 |
| (3) | 625 | 120 | 1 | 1 | 450 | 60 | 95 | 20 |


