1. Introduction
Molecular beam methods are important means of analyzing the surface reactivity and structure of single crystal surfaces. By using a molecular beam to supply the crystal continuously with new reaction mixture, it is possible to measure reactions under steady-state conditions, which is not possible by ARTPD (angle-resolved temperature programmed desorption), since, due to the temperature ramping, it is essentially a non-steady-state kind of experiment. Recent, elegant work on CO oxidation on Pt{111} for example has shown two channels for reaction, on terrace and step edges, which may be distinguished by the desorption characteristics of CO
2 [
1]. In this paper, we report data for the adsorption, desorption and reaction of CO and oxygen on the {110} surface of platinum using a new design of a molecular beam apparatus. The CO oxidation was measured in angle-resolved mode under steady-state conditions.
The reconstructed clean Pt{110}-(1 × 2) surface has a missing-row type structure [
2,
3,
4]. The Pt atoms build close-packed rows along the
direction with every second row missing. Due to these missing rows, there is a series of troughs between the close packed rows. The walls of the troughs can be described as {111} microfacets.
Adsorption of CO is known to lift the reconstruction of the missing-row structure. Above an exposure of 1 L, single Pt atoms of the first layer diffuse out of the
atomic rows and occupy lattice sites being out of phase with regard to the (1 × 2) periodicity [
5]. This happens even at temperatures as low as 250 K [
6]. The lifting of the reconstruction leads to a (1 × 1) low energy electron diffraction (LEED) pattern at CO coverages of about 0.6 ML [
7]. This is not due to a bulk-truncated structure but because of a random distribution of top layer Pt atoms on the bulk layer underneath which has a (1 × 1) periodicity [
8]. Oertzen et al. mentioned that the phase transition starts at a CO coverage of 0.2 ML and is completed at 0.5 ML [
9]. At 300 K, CO adsorbs exclusively at on-top sites up to a coverage of 0.5 ML. Above this coverage, a small amount of CO also adsorbs on bridge sites [
10]. The room-temperature saturation coverage of CO is 0.88 ML (1 ML = 9.22 × 10
14 molecules cm
−2) [
11].
In contrast, the adsorption of O
2 does not lift the Pt{110}-(1 × 2) missing-row structure [
12]. Performing quantitative X-ray photoelectron spectroscopy (XPS) and work function studies, Freyer et al. found a saturation coverage for room temperature adsorption onto the (1 × 2) reconstructed surface of 0.35 ML [
7]. This value is quite low in comparison to other authors. Walker et al. measured a saturation coverage of close to 1 ML for room temperature adsorption [
13]. Below 0.25 ML, oxygen is adsorbed in a state where it fluctuates across ridge bridge sites. Between 0.25 and 0.5 ML, oxygen is pinned at fcc sites on the walls of the {111} microfacets. Due to lateral interactions, only every other site along the row can be occupied at these coverages. As shown by Walker et al., above 0.5 ML, oxygen produces a coverage-dependent variable unit mesh structure [
13], and this results in a change from second- to first-order behavior for the oxygen desorption above this coverage.
The activation energy for diffusion of CO on a Pt{110}-(1 × 2) surface was measured by Oertzen et al. to be about 9–13 kcal/mol, while the activation energy of diffusion for O
2 is 30 kcal/mol for low coverages and 40 kcal/mol for high coverages [
9]. This means that the diffusion of O
2 is negligible in comparison to the CO diffusion. The CO oxidation will therefore take place nearly exclusively on the surface sites that are occupied by oxygen, with CO diffusing to these sites for reaction. Oertzen et al. also found a great anisotropy for O
2 diffusion, with diffusion occurring only parallel to the crystallographic
direction. This is consistent with the observation that O
2 forms rows in the troughs of the Pt{110}-(1 × 2) surface [
9].
Using an ultrathin Pt{110} single crystal, Wartnaby et al. measured the excess energy of desorbing CO
2 molecules in comparison to thermally accommodated molecules [
14]. They found that, when CO is dosed onto a saturated oxygen overlayer, the excess energy is 9 ± 17 kJ/mol, while the excess energy was 52 ± 21 kJ/mol for oxygen dosed onto a CO overlayer. They explained this behavior by a drop of the reaction activation energy with increasing oxygen coverage and the formation of “hot” oxygen atoms. The “hot” oxygen atoms could react with CO before thermal accommodation to the surface and therefore carry their excess energy over to the product CO
2.
The reaction mechanism of the CO oxidation reaction was found to be mainly of Langmuir–Hinshelwood type on Pt surfaces, excluding any reaction via the direct collision of gas phase CO with oxygen adatoms [
15,
16]. On the other hand, Bonzel and Ku predicted that the reaction on a Pt{110}-(1 × 2) surface takes place via a Langmuir–Hinshelwood mechanism at conditions where CO was pre-adsorbed on the surface while with O
2 pre-adsorbed on the surface, it shifts to an Eley–Rideal mechanism [
17].
Using a cross-correlation time-of-flight method combined with non-steady-state angle-resolved thermal desorption (ARTPD), Matsushima et al. measured the angular and velocity distributions of CO
2 desorbing from a Pt{110}-(1 × 2) surface [
18,
19,
20]. They found that the CO
2 desorption is collimated at angles of ±25° off the surface normal. At these angles, the translational temperature of desorbing CO
2 also reaches a maximum. The difference between the facet angles of the {111} facet normals of about ±35.2°, and the measured values have been explained by the “smoothing effect” of conducting electrons and surface distortions, the latter reducing the facet angle to about ±30° as found by LEED and TOF-SARS (time of flight scattering and recoiling spectrometry) investigations [
21,
22].
Relatively few angle-resolved measurements under steady-state conditions have been performed on the CO oxidation reaction on Pt surfaces. Cao et al. performed such an investigation on a Pt{113} surface, finding two desorption peaks at angles of −20 ± 2° and at +22 ± 2° off the surface normal [
23]. They assigned these results to reactions to the {001} and the {111} facets of this surface, with facet normals of −25.2° and +29.5°, respectively. On Pt{110}-(1 × 2), CO
2 formation dynamics was probed with angular and velocity resolution at relatively high O
2 pressures of 1 × 10
−7–1 × 10
−4 Torr and found that reactions are dominated by the (1 × 2) regions of the surface giving hyperthermal desorption directed at 25° from the surface normal [
24]. These were attributed to reactions occurring on the facets.
There has been a great deal of work on the kinetics, light-off and the spatiotemporal oscillations of CO oxidation [
25,
26,
27,
28,
29,
30] including Ertl’s Nobel Prize-winning work [
31,
32], and the work described above [
18,
19,
20]. To the best of our knowledge, there have been no continuous angle-resolved measurements under steady-state conditions combining the advantages of molecular beams to access sticking, trapping, uptake and desorption in the CO oxidation reaction on a Pt{110}-(1 × 2) surface. Mullins et al. did this for the reaction at 90 K surface temperature on Pt{111} and found a cos
12 dependence of the scattered flux. However, they used non-thermal and separate sources of O
2 (from a microwave source) and supersonic CO [
33]. Similarly, in the ground-breaking work of Neugebohren et al., discussed below, high source pressure beams were used [
1]. Near ambient pressure XPS experiments have shown how local structure and oxide formation on Pt{110} influence CO oxidation and provide motivation to continue to develop in-situ tools to probe catalytic reactivity in response to surface nanostructural changes [
34].
The aim of this study was to gain a further understanding of the oxidation of CO on a Pt{110}-(1 × 2) surface, with continuous thermal beams. By performing the experiments under steady-state conditions, we were able to observe the reaction at much higher temperatures than possible with ARTPD. We used a recently-designed molecular beam machine that can perform fast angle-resolved measurements even in steady-state mode in a continuous manner.
2. Results and Discussion
2.1. Inert Gas Scattering
To investigate the scattering behavior of Pt{110}-(1 × 2), experiments with helium and argon were carried out. The results are shown in
Figure 1. For helium, an intense sharp peak was observed at an angle of 101 ± 3° and a small peak at 37 ± 3° (the beam enters the chamber at 45° and the angle-resolved MS is at 90°). In contrast, the scattering curve for argon shows a rather broad and featureless distribution, although the signal maximum is also positioned at around 101°. A specularly reflected He beam from a flat Pd{111} surface shows a sharp maximum at 67.5° (see
Figure S2). For a sample with facets a specularly reflected beam should arise when the facet normal is held at 67.5° and thus specular peaks are expected at ± the facet angle which is ±35° for {111} micro facets on {110} yielding peaks expected at 32.5 and 102.5° in our geometry. The experimentally measured angles suggest the facets are slightly less steep than ±35°.
For comparison with the experiment, we simulated the scattering at the surface. The Pt{110}-(1 × 2) surface was modeled by assuming a cosine-shaped hard surface potential (
Figure 2). The size of the scattered atoms has been neglected, and only fully elastic scattering has been assumed (“billiard ball model”). Double scattering on both facets was considered and was of minor influence in the idealized simulation. As the facet angle deviates from the geometrical value of 35.2° for an undistorted surface, an angle of 30° was used, as this value was reported from LEED [
21] and TOF-SARS experiments [
22]. The angle between incident beam and detector was set to 45°, with a detector acceptance angle of ±5°. The result of the simulation is shown in
Figure 2. It exhibits two sharp peaks at angles of 40° and 95°.
For helium, the simulation fits the experimental result quite well except for the lack of intensity of the peak at 37°. The reason for this lies in shadowing effect of the facets in a non-ideal surface which is underestimated in the simulation due to the assumption of dimensionless atoms and a hard surface potential (facet bunches due to local miscuts can shadow the outgoing atoms). Each facet also receives a different proportion of the flux so at ~102° the facet oriented for specular reflection sees the vast majority of the flux, whereas the other facet is at grazing incidence and hence this orientation generates a large signal. At 37°, the beam is at near normal incidence and both facets see similar fluxes so only approximately half of the beam hits the facet aligned for specular reflection, resulting in a smaller signal.
There is some decrease in the transmission function of the system, particularly at high angles where the beam grazes the crystal surface (the mass spectrometer apertures are designed to accept scattered gas from the full width of the sample, but at grazing some beam spill over from the sample edges). Otherwise, the well-reproduced Helium peak positions indicate that the assumed model is adequate for the performed scattering experiment.
In contrast to the simulated scattering, the experimental result for Argon shows no separated peaks, and is due to the fact that Ar scattering is not elastic due to its higher accommodation and a much higher enthalpy of physisorption (~1–2 kJ/mol for He and about 10× that figure for Ar [
35]). A more detailed discussion of these data and fitting of the Ar data is given in the
Supplementary Materials.
2.2. Oxygen Interaction with Pt{110}
The results for the sticking experiments with oxygen are shown in
Figure 3.
The initial sticking probability s0 shows a gradual decrease with increasing surface temperature above 400 K, from 0.34 to 0.27 at 750 K. At lower temperatures, there is a larger decrease from ~0.45 at 130 K to 0.36 at 350 K.
The high uptake at low temperatures, and big decrease up to 350 K, coincides with a low-temperature oxygen desorption peak found by Wilf and Dawson at a temperature of 250 K that extends to 350 K [
12]. A similar observation was made by Walker et al. [
13], although they also found a very sharp peak at approximately 220 K. They attributed this peak to the presence of molecularly chemisorbed oxygen O
2. Sticking probability versus uptake curves at several temperatures are given in the
Supplementary Materials (Figure S3).
The TPD spectra of oxygen are extremely sensitive to the surface structure of a Pt{110} surface. Even a different cooling rate of the crystal after the usual annealing at 970 K results in significantly altered spectra, possibly due to a change in the step density [
22]. O
2 TPD is therefore a good test for the quality of the surface structure.
Desorption traces for oxygen TPD as a function of heating rate and coverage are shown in
Figure 4 and
Figure 5, respectively. For heating rate dependent TPD (
Figure 4), the crystal was dosed with 22.5 L (3 × 10
−5 mbar.s) of oxygen at 420 K.
The relationship between the peak maximum temperature
Tmax and the heating rate
β for a first-order desorption is described by the following equation [
12]:
where
ν1 is the preexponential factor of desorption,
Ed is the desorption energy and
R is the molar gas constant. Using this approach, we calculated a desorption energy of
Ed = 218.6 ± 5.7 kJ/mol and a preexponential factor of
ν1 = 3.6 × 10
15±0.4 s
−1. These values are high in comparison to literature. Wilf and Dawson found a desorption energy for the
β1 state of 134 kJ/mol, with a preexponential factor of 1.7 × 10
9 s
−1 [
12], while Walker et al. measured the adsorption heat of O
2 using microcalorimetry [
13] and found a value of 170 kJ/mol for the
β1 oxygen state. They also calculated the desorption energy using the Redhead formula [
36] (Equation (2)):
They assumed a preexponential factor of ν1 = 1 × 10¹³ s−1 and found a value of Ed = 198 kJ/mol.
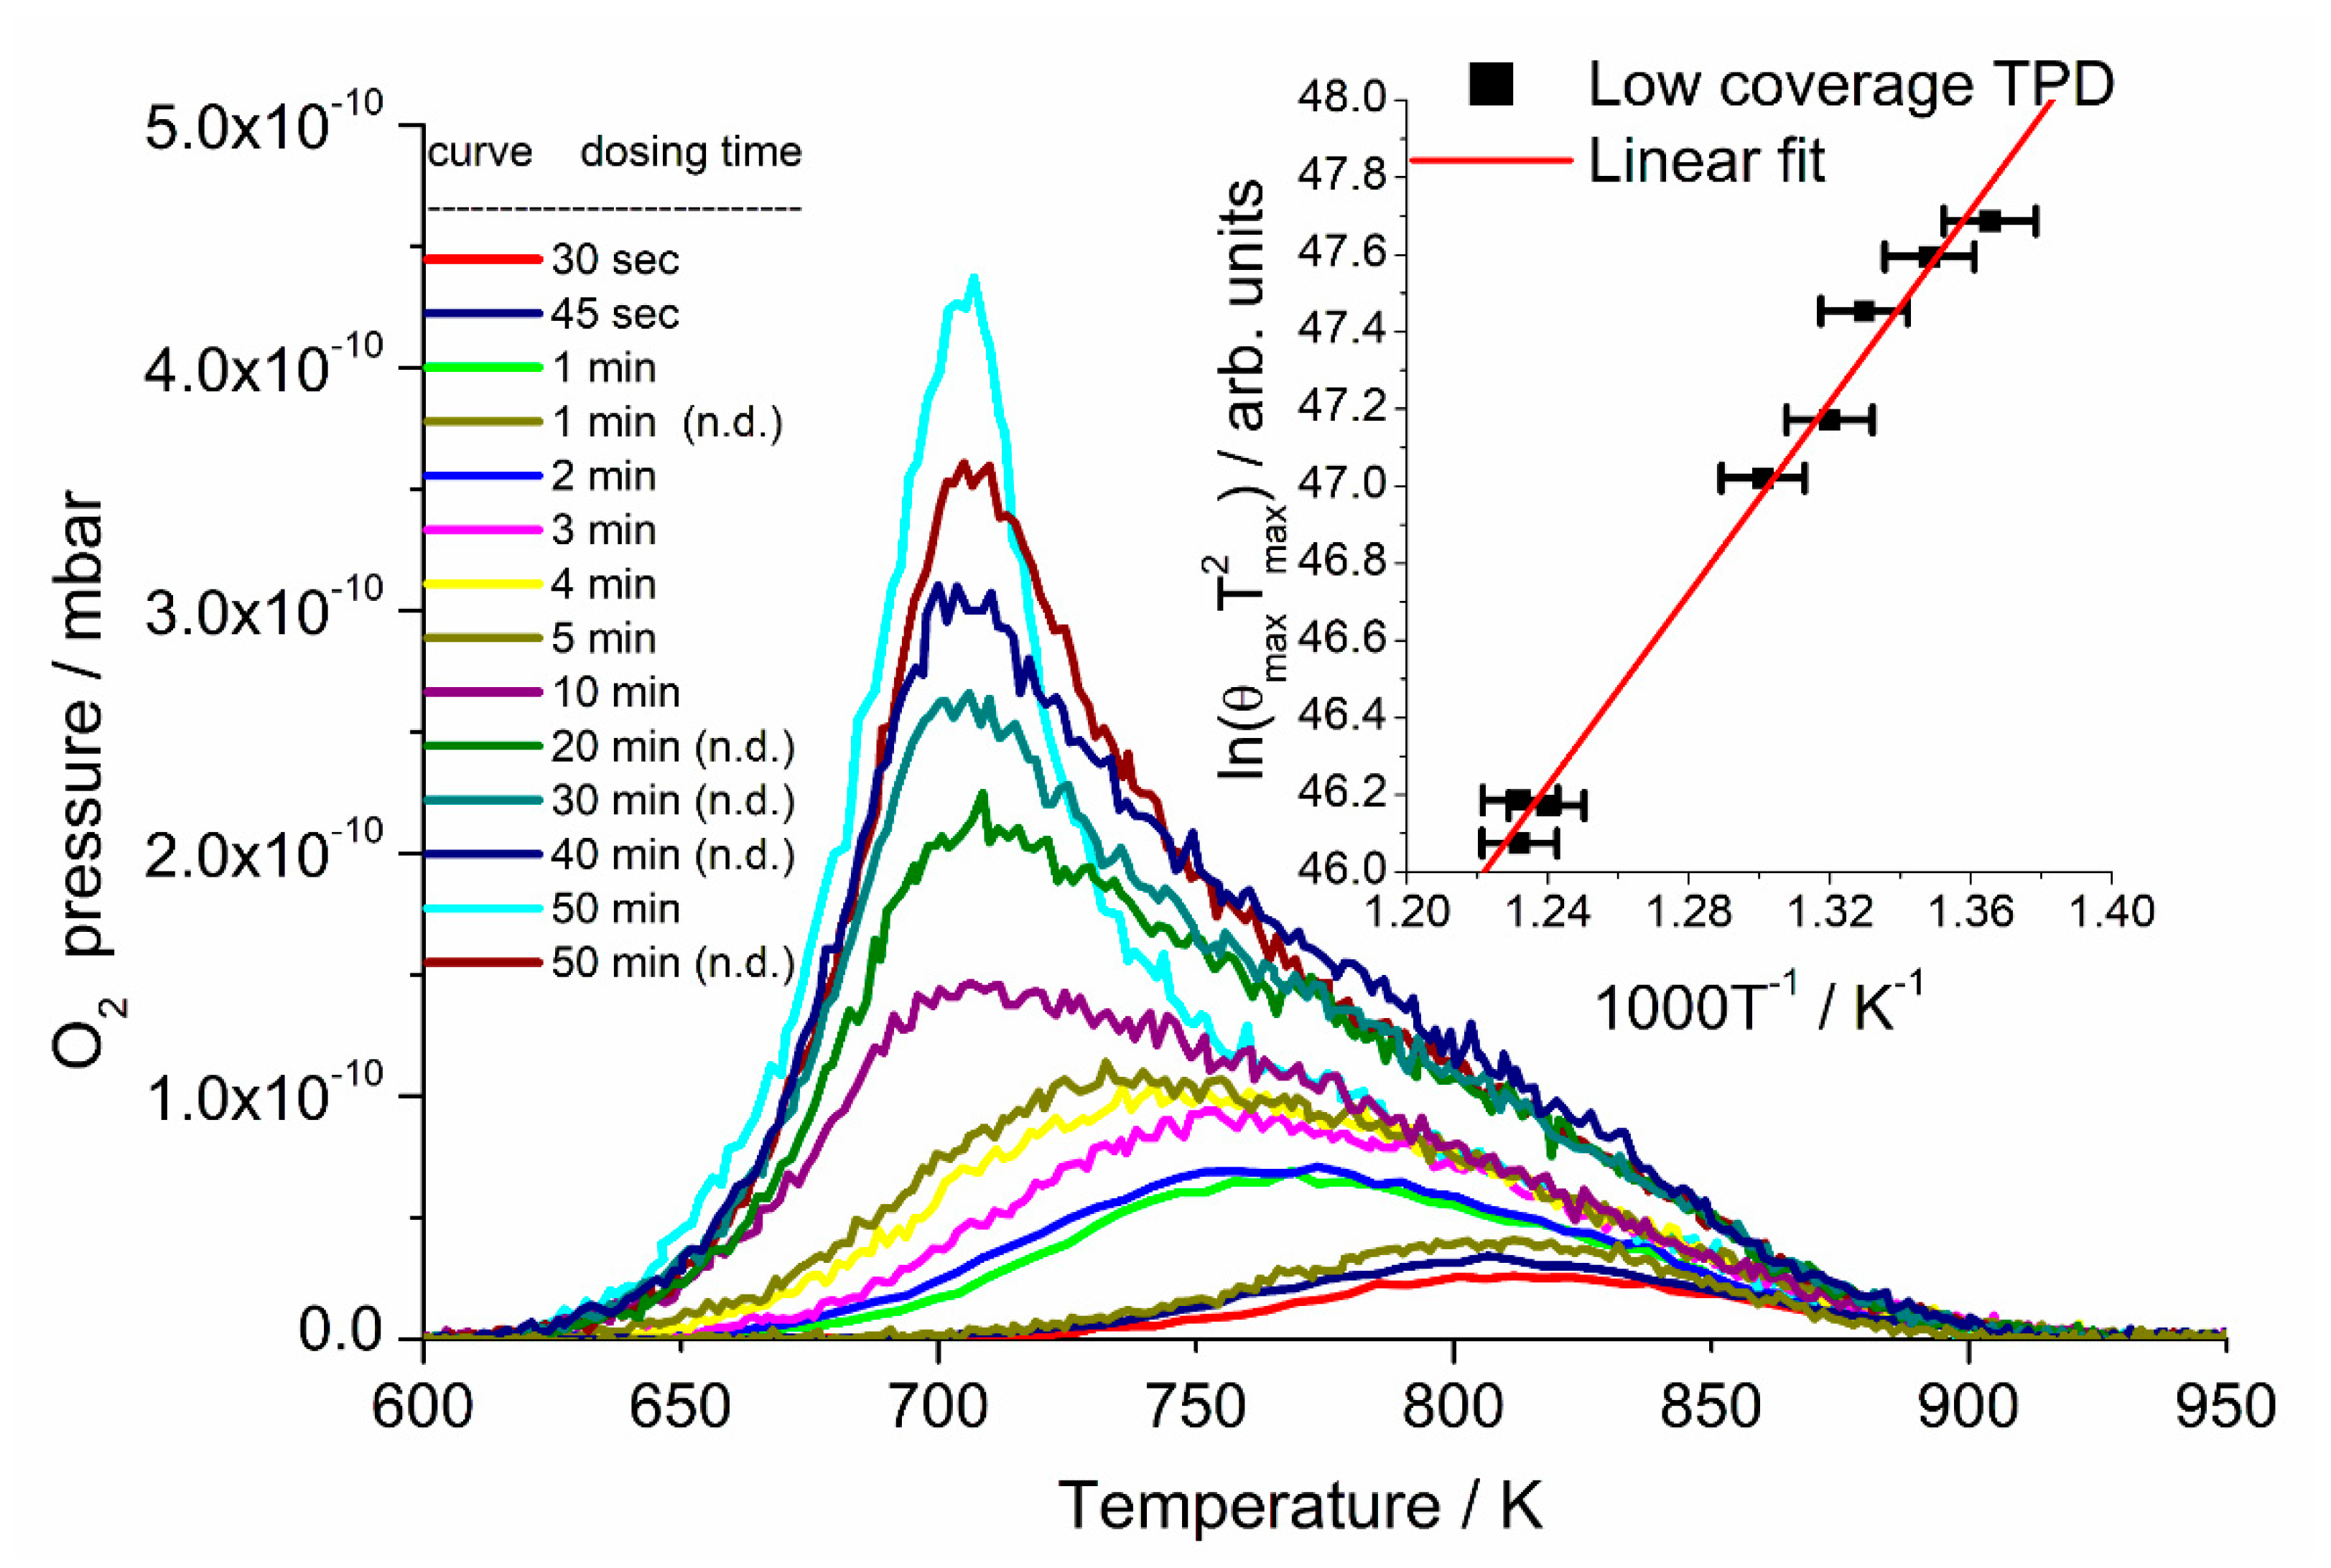
From the coverage-dependent TPD spectra (
Figure 5), we also calculated the desorption energy of the first-order peak using the Redhead equation. With the preexponential factor of
ν1 = 3.6 × 10
15±0.4 s
−1 from the heating rate dependent measurements and the averaged value of the peak maximum temperature of
Tmax = 706.4 ± 0.6 K, we found a desorption energy of
Ed = 219.4 ± 6.6 kJ/mol, in close agreement with the value obtained by our heating rate dependent measurement. Assuming a preexponential factor of 1 × 10
13 s
−1, as used by Walker et al., gives a desorption energy of 184.8 kJ/mol, in good agreement with their value. Finally, assuming a preexponential factor of 1.7 × 10
9 s
−1, as found by Wilf and Dawson, the desorption energy would be 133.8 kJ/mol, in agreement with their value.
For the second-order desorption peak, the data at lowest coverage were analyzed following Equation (3), where the subscript
max indicates values recorded at the maximum in the second-order TPD peak.
We found from the gradient and intercept of the inset in
Figure 5 that the activation energy for desorption is
Ed = 103.2 ± 4.4 kJ/mol and the second-order prefactor
is 4.2 × 10
−9±0.3 cm
2 molecule
−1 s
−1. Wilf and Dawson found an average desorption energy of this
β2 state of 123 kJ/mol, with a preexponential factor of 6.5 × 10
−7 cm
2 molecule
−1 s
−1 [
12].
Although the values for desorption energy and the preexponential factor differ significantly from author to author, the measurements are consistent with each other, as assuming a particular preexponential factor gives consistent values for the desorption energy for all measurements. The large scatter in the values for
ν can be explained by the extreme sensitivity to slightly different peak maximum temperatures that result in a large uncertainty for this parameter. Simulations of the spectra are given in the
Supplementary Materials, using a two-state model, and give reasonable fits to the experimental curves (
Figure S4).
2.3. CO Interaction with Pt{110}
Figure 6 shows a high-temperature first-order desorption peak (
β1) at 490 K for all coverages, with a second peak evolving at 398 K (
β2). This behavior is consistent with literature [
37,
38,
39]. Using the Redhead equation assuming a frequency prefactor of
ν = (4.5 ± 1.5) × 10
14 s
−1 (averaged from values of
ν = 6 × 10
14 s
−1 found by Fair and Madix [
39] and
ν = 3 × 10
14 s
−1 found by Engstrom and Weinberg [
16]), a value of
Ed = 143 (±4) kJ/mol for the desorption activation energy for the
β1 desorption peak in the high-coverage region was obtained. This is in reasonable agreement with their values of
Ed = 148 kJ/mol [
39] and
Ed = 151 (±6) kJ/mol [
16], but is rather different from the value of
Ed = 129 kJ/mol found by Comrie and Lambert [
37] who assumed a frequency prefactor of
ν = 10
13 s
−1. Again, recalculating their experimental results with
ν = 4.5 × 10
14 s
−1 gives a value of
Ed = 144 kJ/mol, which is in perfect agreement with our result. For the low-temperature
β2 desorption peak, a desorption activation energy of
Ed = 102 (±3) kJ/mol was calculated assuming a frequency prefactor of
ν = 10
13 s
−1. This value is in agreement with the values of
Ed = 108 kJ/mol found by Bonzel and Ku [
38] and
Ed = 105 kJ/mol found by Comrie and Lambert [
37].
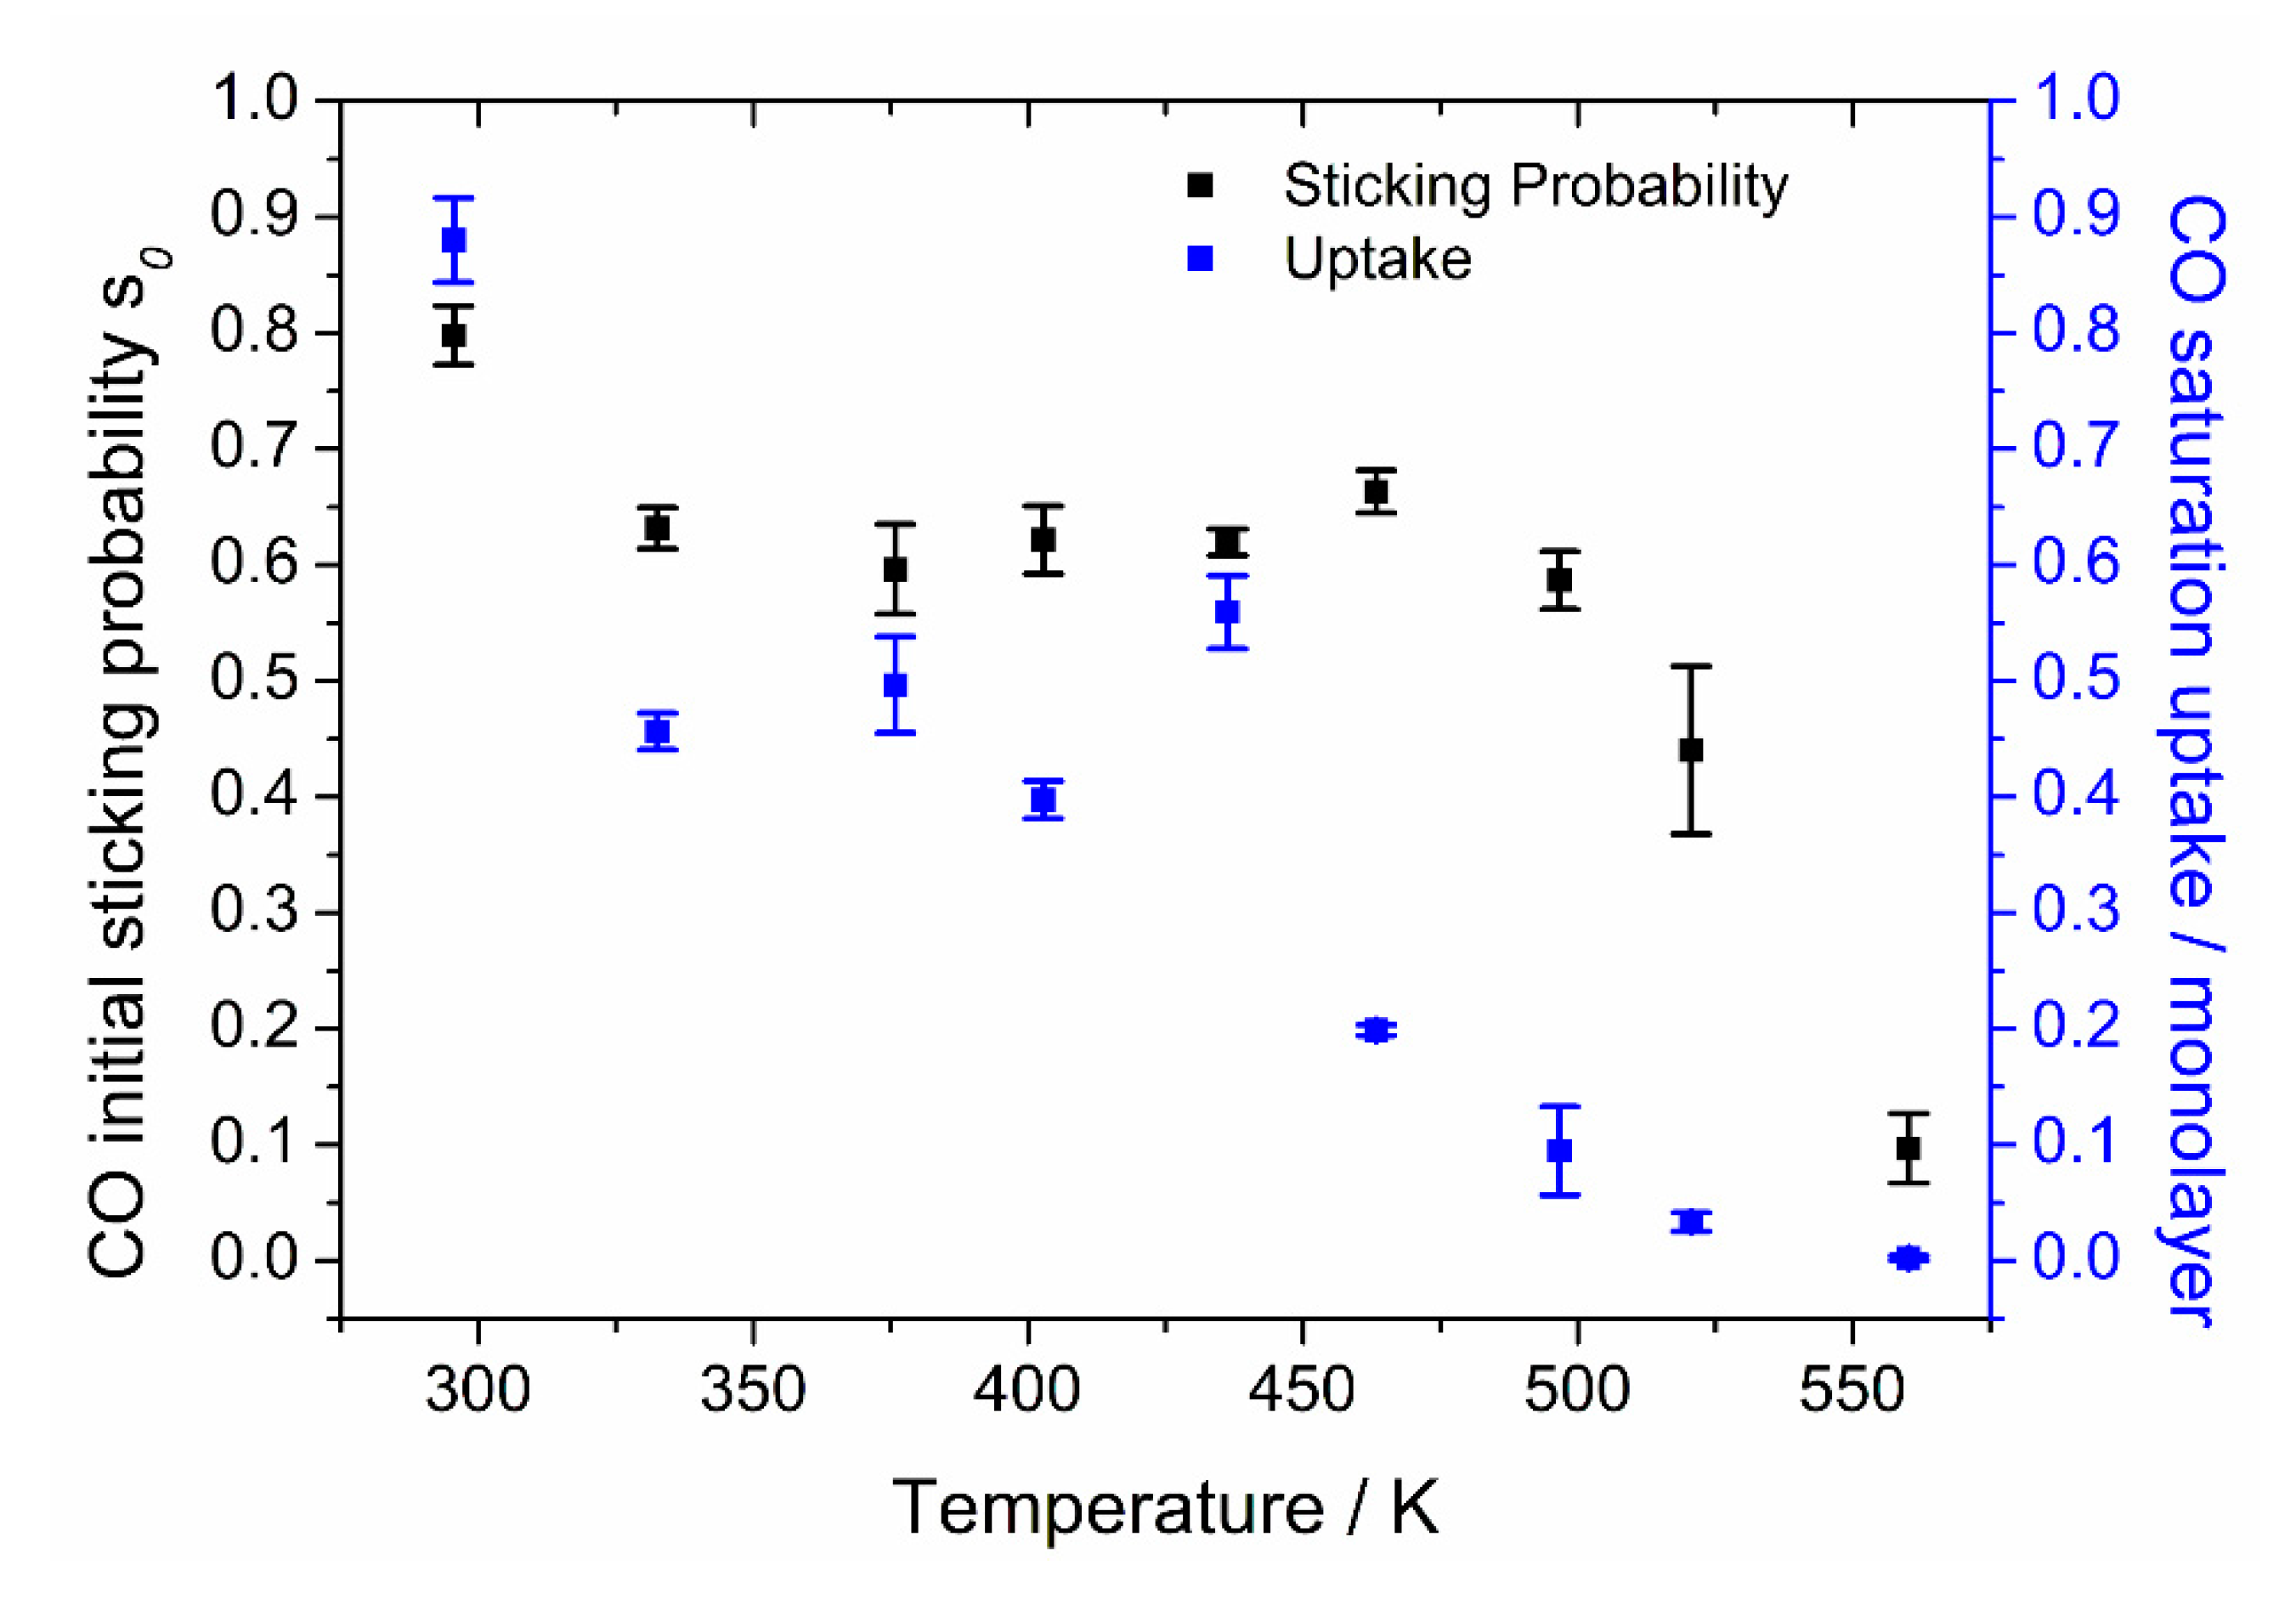
Our results for the initial sticking probability of CO, and its saturation coverage, as a function of crystal temperature, on Pt{110} are shown in
Figure 7.
At 300 K, we found a value of 0.80 ± 0.04, which is in good agreement with the values of 0.8 found by Fair and Madix [
39] and 0.83 found by Wartnaby et al. [
11]. Between 330 and 480 K, the initial sticking probability (
s0) stays almost constant at 0.62 ± 0.04. This is consistent with the conclusion of Fair and Madix [
39] that the initial sticking probability is temperature independent over a wide region, although our values show an earlier decline in
s0 at temperatures above 480 K and the onset of a rise below 320 K. Above 480 K, the initial sticking probability falls steeply to 0 at 570 K, due to entering the tail of the
β1 TPD desorption peak with a peak maximum temperature of 490 K. The behavior of the initial sticking probability confirms the similarity in the
s0 values found for several different noble metal surfaces (Rh{110}, Pd{110}, Rh{111} and Pd{111} have values in the range 0.4–0.7, as seen in [
40] and references therein).
The saturation coverage values of the crystal for different temperatures were obtained from the total CO uptake by normalizing to a saturation coverage of 0.88 ML at 300 K. Saturation coverage declines with increasing temperature up to 490 K, the CO TPD peak maximum temperature. For higher temperatures, it shows a slight drop to very low values, finally reaching zero coverage at 570 K.
The sticking probability curves of CO (an example is shown in
Figure 8) show precursor-mediated adsorption behavior [
11]. CO is trapped into a weakly held mobile precursor state, which can be described as a two-dimensional gas [
39]. This mobility gives the possibility of finding sites for adsorption on the surface even if the arrival site is blocked. Some of our sticking curves have been fitted by the Kisliuk expression [
41], Equation (4).
where
s is the instantaneous sticking probability,
s0 is the initial (zero coverage) sticking probability and
θ is the relative coverage of the crystal surface for a particular temperature, normalized to saturation coverage. The parameter K describes the mobility of the precursor state with small values for a highly mobile precursor and a value of K = 1 for an immobile precursor, which gives rise to the Langmuir adsorption isotherm.
The results for the temperature dependence of K are shown in
Figure 9:
It shows a strong tendency towards higher values and thus less mobile precursors with increasing temperature, due to a shorter lifetime of the precursor state and a reduced number of site visits. The value of K = 0.11 (±0.01) found for 300 K is low compared to the value of 0.25 found by Wartnaby et al. [
11]. In contrast, a value of 0.13 at 327 K for CO adsorption on Pd{110} found by Jones et al. [
38] fits well to our values, again indicating similarity of these surfaces regarding CO adsorption.
2.4. CO Oxidation
Steady-state Temperature Programmed Reaction (TPR) experiments were carried out with different CO/O
2 ratios in the beam. Initially, when introduced to the clean surface at 373 K, the mixed beam produces CO
2 until the surface is covered with CO (
Figure 10). With a high CO/O
2 ratio, the CO
2 evolution stops quickly (after ~25 s of reaction) due to surface poisoning with CO, whereas at a low ratio it seems to reach near steady-state CO
2 evolution.
If the CO poisoned surface is taken to higher temperatures when the CO desorption becomes appreciable, oxygen can adsorb and thus CO oxidation is made possible (
Figure 11). This “light-off” of the steady-state reaction takes place in the temperature region between 460 and 510 K (which is also the
β1 CO desorption temperature range). At low CO/O
2 ratios, the surface is not initially poisoned with CO. The CO
2 production shows therefore a steady decrease with temperature as the coverage of CO decreases with increasing temperature. The highest rate is achieved with the ratio nearest to 1.
Angle-resolved CO oxidation measurements were performed at temperatures of 470–620 K, slightly above the CO desorption temperature to avoid surface poisoning and to keep a steady state of reaction. A high temperature was also necessary to keep the CO equilibrium coverage low, as at temperatures above 250 K and CO coverages of more than 0.2 ML, the phase transition (1 × 2) → (1 × 1) takes place [
9,
42]. Steady-state experiments that were performed at room temperature or below, even at CO/O
2 ratios that should ensure that no surface poisoning occurred, showed too low a signal to noise ratio and therefore could not be evaluated. For the angle-resolved measurements, the CO
2 flux was measured in the
plane. To achieve a high CO
2 signal, a pressure ratio 1:1 of CO/O
2 was used in the beam.
The resulting curves showed a broad distribution over the measured angular range, but, for temperatures above 470 K, three components are clearly visible. The curves were deconvoluted into cosine power functions using a numerical least-square fit (Simplex and Levenberg–Marquardt algorithms) to the function given in Equation (5).
with
I(
θ) the signal intensity for the crystal polar angle
θ,
I0 the baseline height,
I1–
I3 the peak heights,
α1–
α3 their exponents and
x1–
x3 their angular positions. The two extreme temperatures are shown in
Figure 12 and
Figure 13, while the other scattering distributions at 523 and 573 K are given in the
Supplementary Materials (Figure S5a,b). The low temperature distribution is quite different from the other three, which are all fairly similar in shape. The computed best fit parameters for the different temperatures are listed in
Table 1.
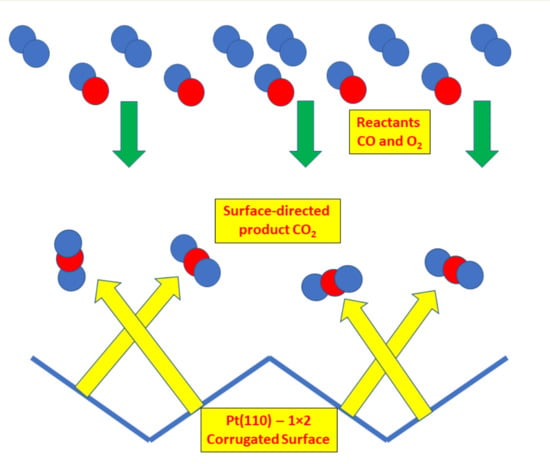
In all four cases two lobes were evident at angles of about ±16° from the Pt{110} surface normal, appearing at approximately 74° and 106°. We could not discriminate a crystal surface normal peak in our data. The inclined angles for product evolution may be attributed to CO2 desorption normal to the reaction sites on the {111} microfacets, and therefore shows sensitivity to the local structure in the reaction, rather than average surface plane dependence. That is, the CO2 is generated at such sites and desorbs directly over the lowest barrier directly into the gas phase in a direction perpendicular to the local potential energy surface.
At the transition state of the reaction, the O-CO complex forms on a highly repulsive potential energy surface with respect to the local facet and the formation of CO2 leads to ejection of the molecule with excess kinetic energy (in comparison to thermal). This kinetic energy leads to a high velocity perpendicular to the reaction site in comparison to lateral thermal motion and hence is characterized by a high exponent in the cosine fits (typically α is 10–20).
The third peak in CO2 evolution that appears with the crystal oriented at ~44° does not correspond to a facet or a surface normal. We believe that this peak is likely to be due to the angle dependence of the absolute amount of produced CO2. The angle integrated mass spectrometer showed a maximum in the CO2 production at the facing beam position, so the third peak can be attributed to this maximum.
In an angle-resolved TPD study, Matsushima et al. found desorption angles of ±25° for a CO
2 formation peak at 310 K and ±23° for a CO
2 formation peak at 410 K [
20]. They explained the difference between facet angles and desorption angles with effects of conducting electrons and surface distortions (see Introduction). Their method to deconvolute the measured curves in single peaks was to fit two peaks to the outer parts of the curves assuming symmetrical behavior and to subtract these two peaks from the measured curve to get a third peak centered at the surface normal. For several reasons, this approach is inappropriate for our data: at very grazing angles between surface and beam, the beam is spread across the face of the crystal and will overspill the edges leading to a dramatic drop in apparent reaction products until at an angle of 135° the beam will only hit the side of the crystal. The steep decrease at high angles is therefore an artificial effect, as described in
Figure S1. This inherent asymmetry in our experimental geometry therefore dictates our analysis approach.
Despite these difficulties, the achieved angles for the lobes are only slightly below the values obtained by Matsushima et al. [
20,
24], but, importantly, we ran a continuous angle-resolved experiment under low coverage
steady-state reaction conditions. At 470 K, there are no obvious peaks in the curve, although the computed best fit also showed two peaks at ~±17° from the surface normal. It may well be that at 470 K the surface coverage of CO is sufficient to initiate a partial (1 × 2) → (1 × 1) phase transition. This would be expected to decrease the amount of CO
2 that desorbs from the {111} microfacets of the Pt{110}-(1 × 2) surface. The newly formed (1 × 1) surface has lower corrugation and so will not show such distinct facet desorption.
Note that Neugebohren et al. [
1] mapped velocity-resolved rates of carbon monoxide at stepped platinum surfaces and found two distinct channels for reaction, being dominated at low temperatures by the more active step sites and at high temperatures by the more abundant terrace sites. The temperature switch between channels is at ~700 K under their supersonic conditions. Our work is in the temperature regime below this, where step sites on an otherwise flat surface might be most active. Of course, in the work here, effectively all sites are step sites on Pt{110}, but the {111}-facetted (1 × 2) surface dominates the distribution of evolving, activated CO
2 molecules.
3. Experimental
The experiments were carried out in an ultra-high vacuum chamber(VG Scientific, East Grinstead, UK) (
Figure 14) pumped by a diffusion pump (Edwards Ltd, Burgess Hill, UK) and an additional titanium sublimation pump (VG) to give a base pressure below 10
−10 mbar.
The Pt{110} crystal was mounted centrally in the chamber on a manipulator capable of moving in the X, Y and Z directions as well as rotating the crystal around its polar and azimuthal axes (
Figure 14). Both axes were equipped with stepper motors (VG) to allow automated angle-resolved experiments by preprograming sequences of temperature ramps and angular movements. The crystal was held by two tungsten wires spot-welded to its side, which were also used for conductive heating. For low-temperature experiments, the crystal could be cooled down to 120 K by liquid nitrogen cooling. The temperature of the crystal was measured by a K-type thermocouple (Goodfellow, Cambridge, UK) spot-welded to the rear face.
Gases could be dosed onto the crystal surface either via leak valves (VG) (background dosing) or using a thermal molecular beam attached to the chamber, normally operated at ~40 mbar source pressure. The beam could be shut off using a computer-controllable shutter inside the beam system and a gold flag in the chamber right between beam nozzle and crystal. The beam was sharply collimated to give a spot of 3-mm diameter. The resulting beam flux was calculated from the sticking measurements with O2 to be F = 1.2 (±0.4) × 1018 molecules m−2 s−1 for a source pressure of 40 mbar. For this calculation, an O2 “saturation” coverage of 0.6 was assumed in the temperature range of 300–400 K.
Angle-integrated experiments could be performed using a quadrupole mass spectrometer (MS, Hiden Analytical, Warrington, UK) built into the main chamber without line of sight of the sample to analyze the background gas. A second quadrupole mass analyzer was situated in a differentially pumped side chamber at an angle of 45° to the molecular beam behind two collimator apertures to allow angle-resolved observations. Both spectrometers ran concurrently and analog inputs on both instruments were used to record sample temperature, orientation and molecular beam pressure synchronized with the MS data.
The chamber was further equipped with an argon ion sputter gun and a LEED/AES unit for crystal cleaning and confirming surface order and cleanliness, respectively. The crystal was cleaned by sputtering with argon ions, followed by heating in oxygen at 700 K and 5 × 10⁻⁸ mbar for 30 min. Finally, the crystal was annealed at 970 K for 10 min. Cleanliness of the surface was checked by LEED (VG) and oxygen TPD measurements. The sample was aligned by hand while viewing the LEED to give datums for azimuth and polar angle motors.
Temperature programmed desorption, and sticking experiments using the King and Wells technique [
25] could be performed in the machine. Temperature programmed reaction (TPR) experiments could also be made on a pseudo-steady-state basis by beaming gases at the crystal surface while ramping surface temperature [
26]. Angle-resolved experiments could be performed under steady-state conditions by beaming gas at the crystal surface while automatically turning the crystal around the polar axis and recording the angle-dependent flux of molecules with the mass spectrometer in the side chamber. Typically, this could be achieve in 200 s. The yield curves were normalized by baseline subtraction and division by the beam source pressure (there is a linear dependency of the beam flux on the source pressure for P < 70 mbar) to obtain comparable values. They were averaged over several experiments for noise reduction. Calibration of the sticking measurements is described in the
Supplementary Materials.


