2. Results
We recruited 198 subjects through an email announcement sent to the University of Trento students who were registered on the website of the Cognitive and Experimental Economics Laboratory of the University of Trento (CEEL). All experiments took place at the dedicated lab facilities of CEEL. No student took part more than once in any of our experiments. A total of 24 subjects (four groups) participated in the control study, 36 subjects (six groups) participated in our control with delay study, 54 (nine groups) participated in our bracelet study, 54 (nine groups) participated in our cardboard study, 30 (five groups) participated in our home object study. The sample was gender balanced.
Summary Statistics
Table 1 shows the descriptive statistics for all our treatments and controls
12. In the control study, the participants proceeded at their own pace and, as soon as everyone had submitted his/her decision, the feedback stage of the game started. The control with delay replicates the timing of the treatment studies by introducing a delay in the submission of the participants’ contribution decisions.
Subjects spent most of their resources in the private good. The tokens were sent with a frequency that varies between 30% (the cardboard) and 50% (the home object). Not shown in
Table 1, in 76% of the cases, the token (cardboard, bracelet or home object) was sent in round 1.
Table 1 shows that, among the treatment studies, contributions to the public good (and hence the payoff, which excludes the show-up fee of 3 euros) are highest in the cardboard study and lowest in the home object study. A two-sample Wilcoxon rank-sum (Mann-Whitney
13) test on the equality of the median contributions in the control studies (864 observations) and all the treatment studies (
bracelet,
cardboard, and
home object, 1944 observations) rejects the null hypothesis (
p less than 0.01). A nonparametric Jonckheere-Terpstra trend test finds that going from the controls to the treatments (with a token) is associated with increasing contributions (
p less than 0.01)
14. It is apparent that our manipulations affected the main variable of interest. A two-sample Wilcoxon rank-sum test finds that the contributions in the two controls are not significantly different
15. The same test finds that contributions in the control with delay study are significantly different from contributions in the cardboard and bracelet studies, but not different compared to contributions in the home object study. The bracelet study and the cardboard study contributions are also significantly different. The comparison between the cardboard and home object study contributions also yields significant differences (
p always below 0.05). All other comparisons yield insignificant results
16.
Table 1 shows that the study where the tokens were sent the least was the cardboard study, i.e., the study that featured the highest contributions to the public good. The tokens circulated the most (above half of the times) in the home object study, i.e., the treatment study where contributions were the lowest.
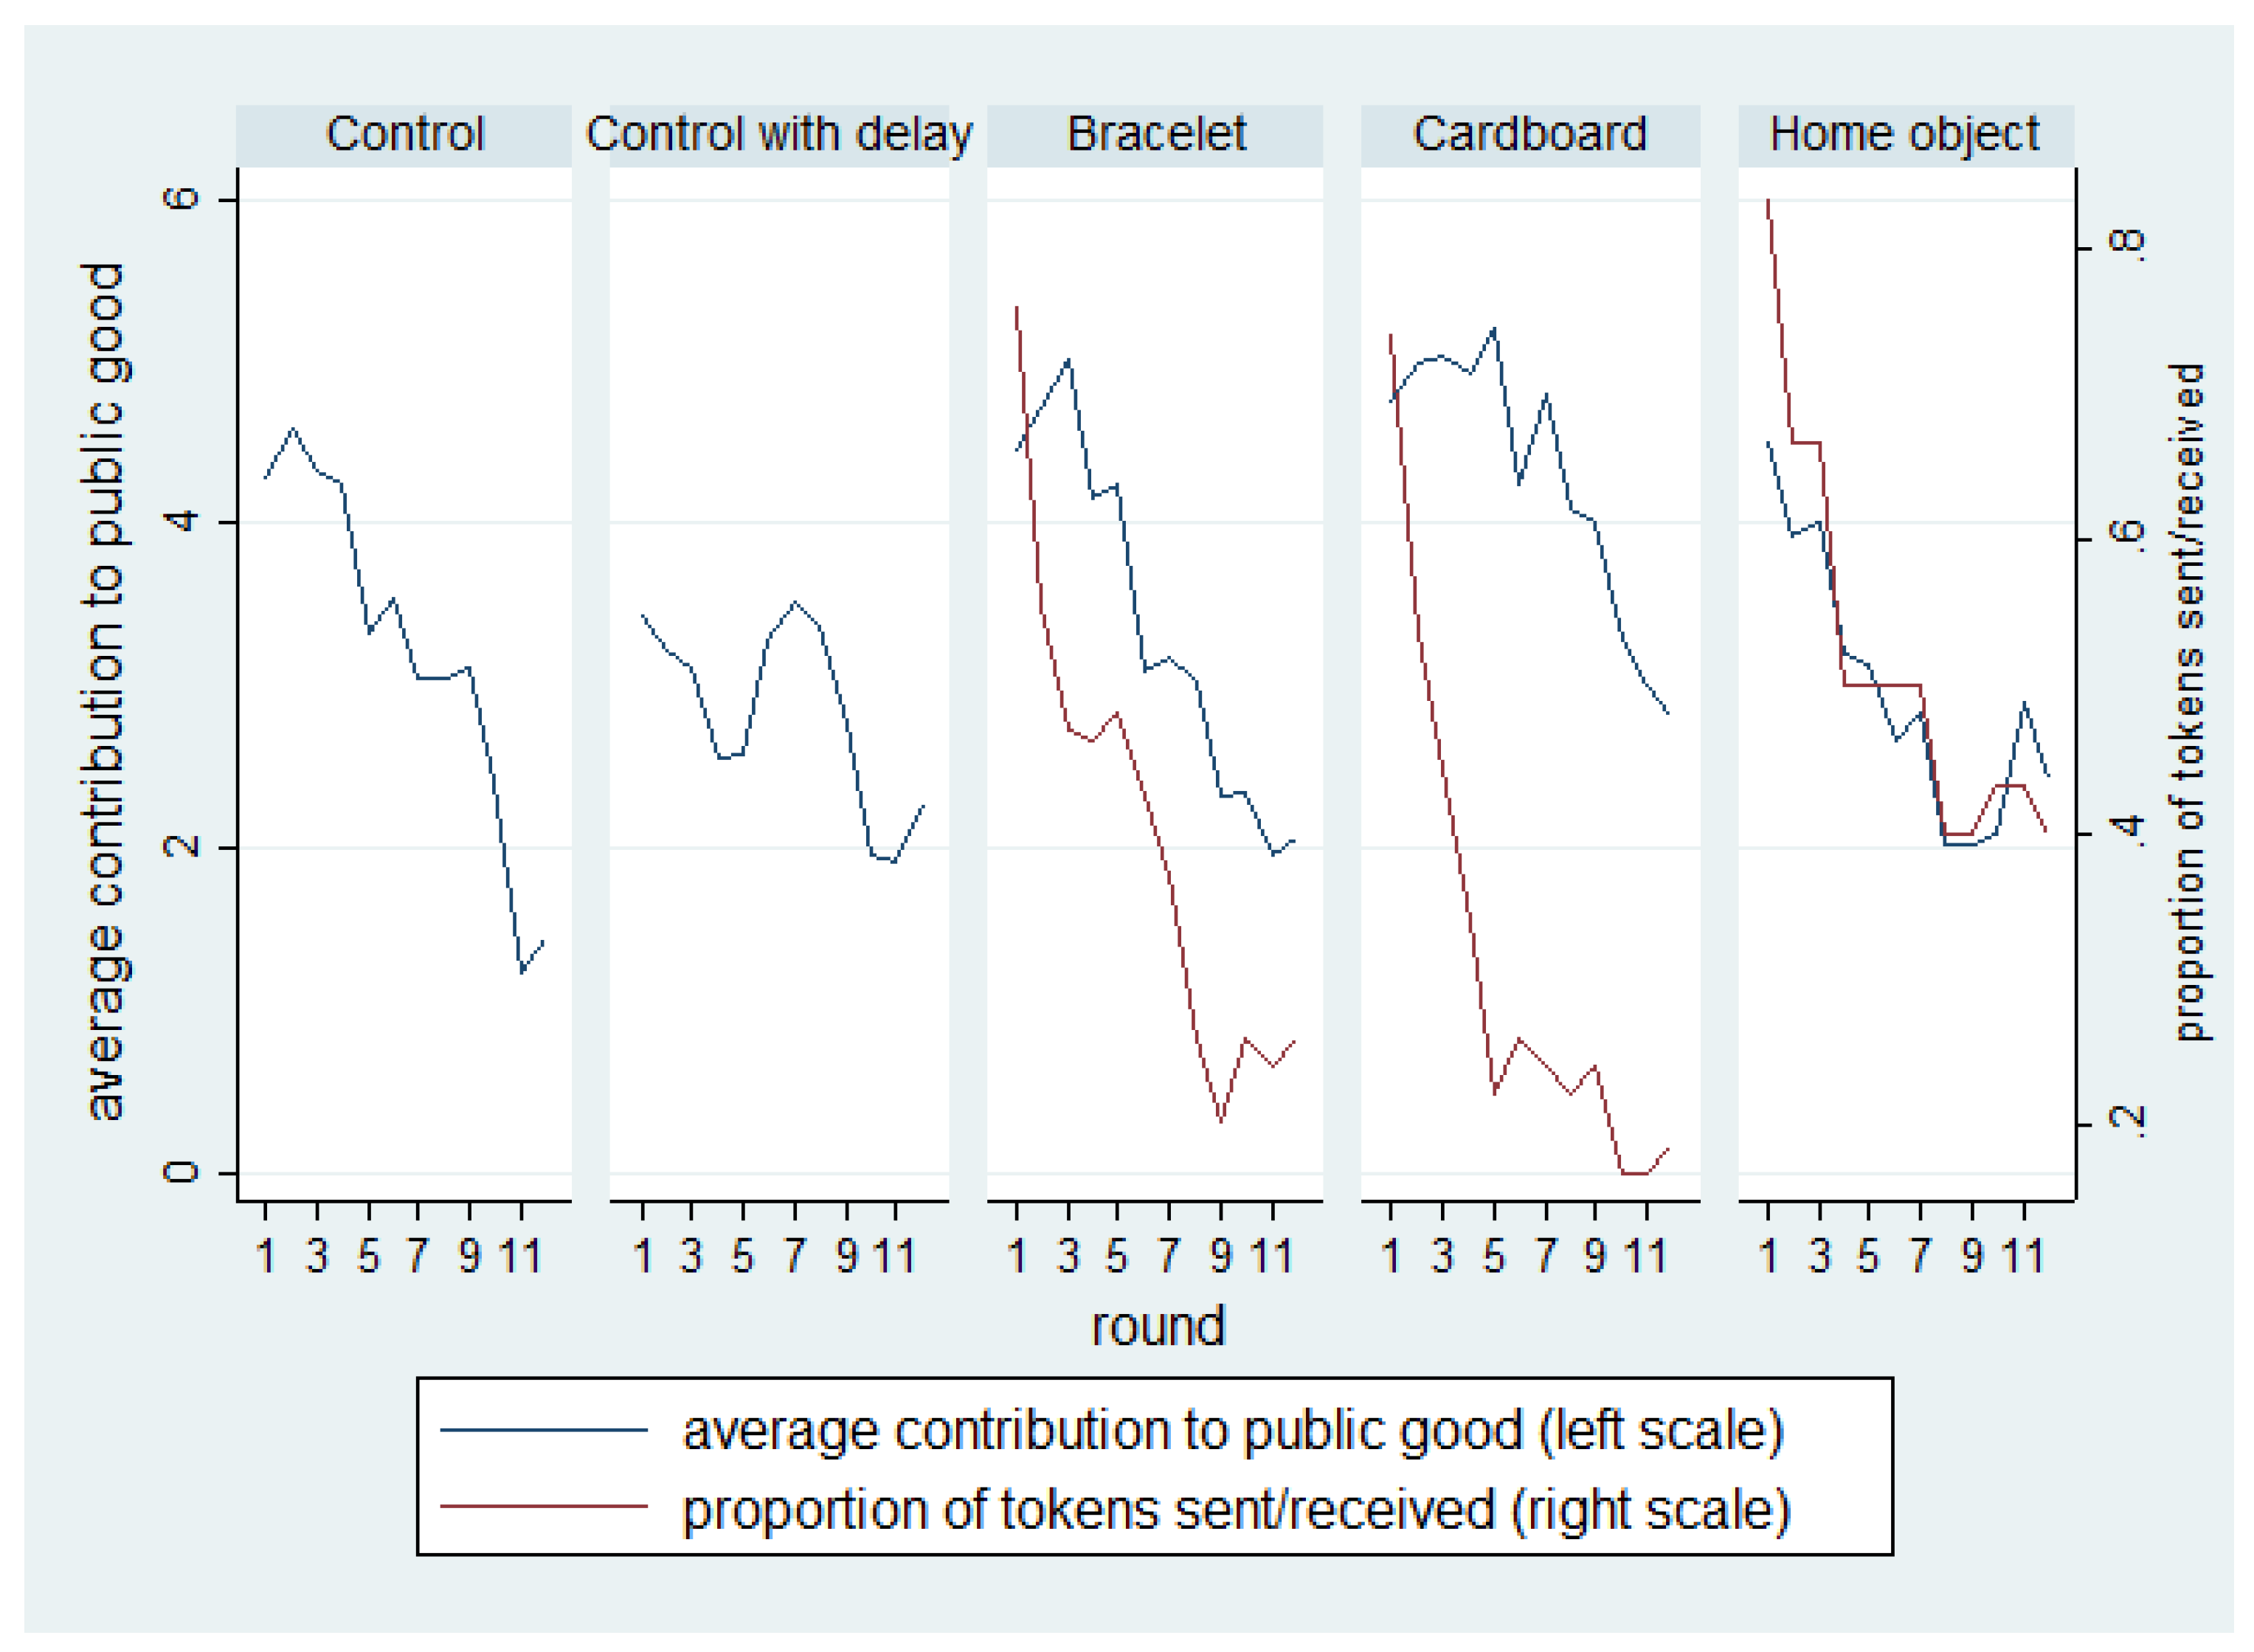
Figure 1 shows the contributions to the public good in each round and the proportion of tokens that were sent (and hence received) in each round.
In all treatments and controls, a decreasing trend in contributions to the public good is visible and is accompanied by occasional attempts to revive contributions. A marked attempt to “boost” contributions occurred around round 5 of our control with delay study
24. The downward trend in contributions is consistent with many previous studies of PGGs
25.
Regarding the tokens, it is clear that by round 5, cardboard pieces were not circulating anymore while the home objects continued to circulate until the end of the experiment in large amounts. Upon visual inspection, the paths of contributions to the public good and the path of tokens look similar. Panel data analysis presented later will help establish a statistical link between the decision to send and receive a token and the contribution choices of each player.
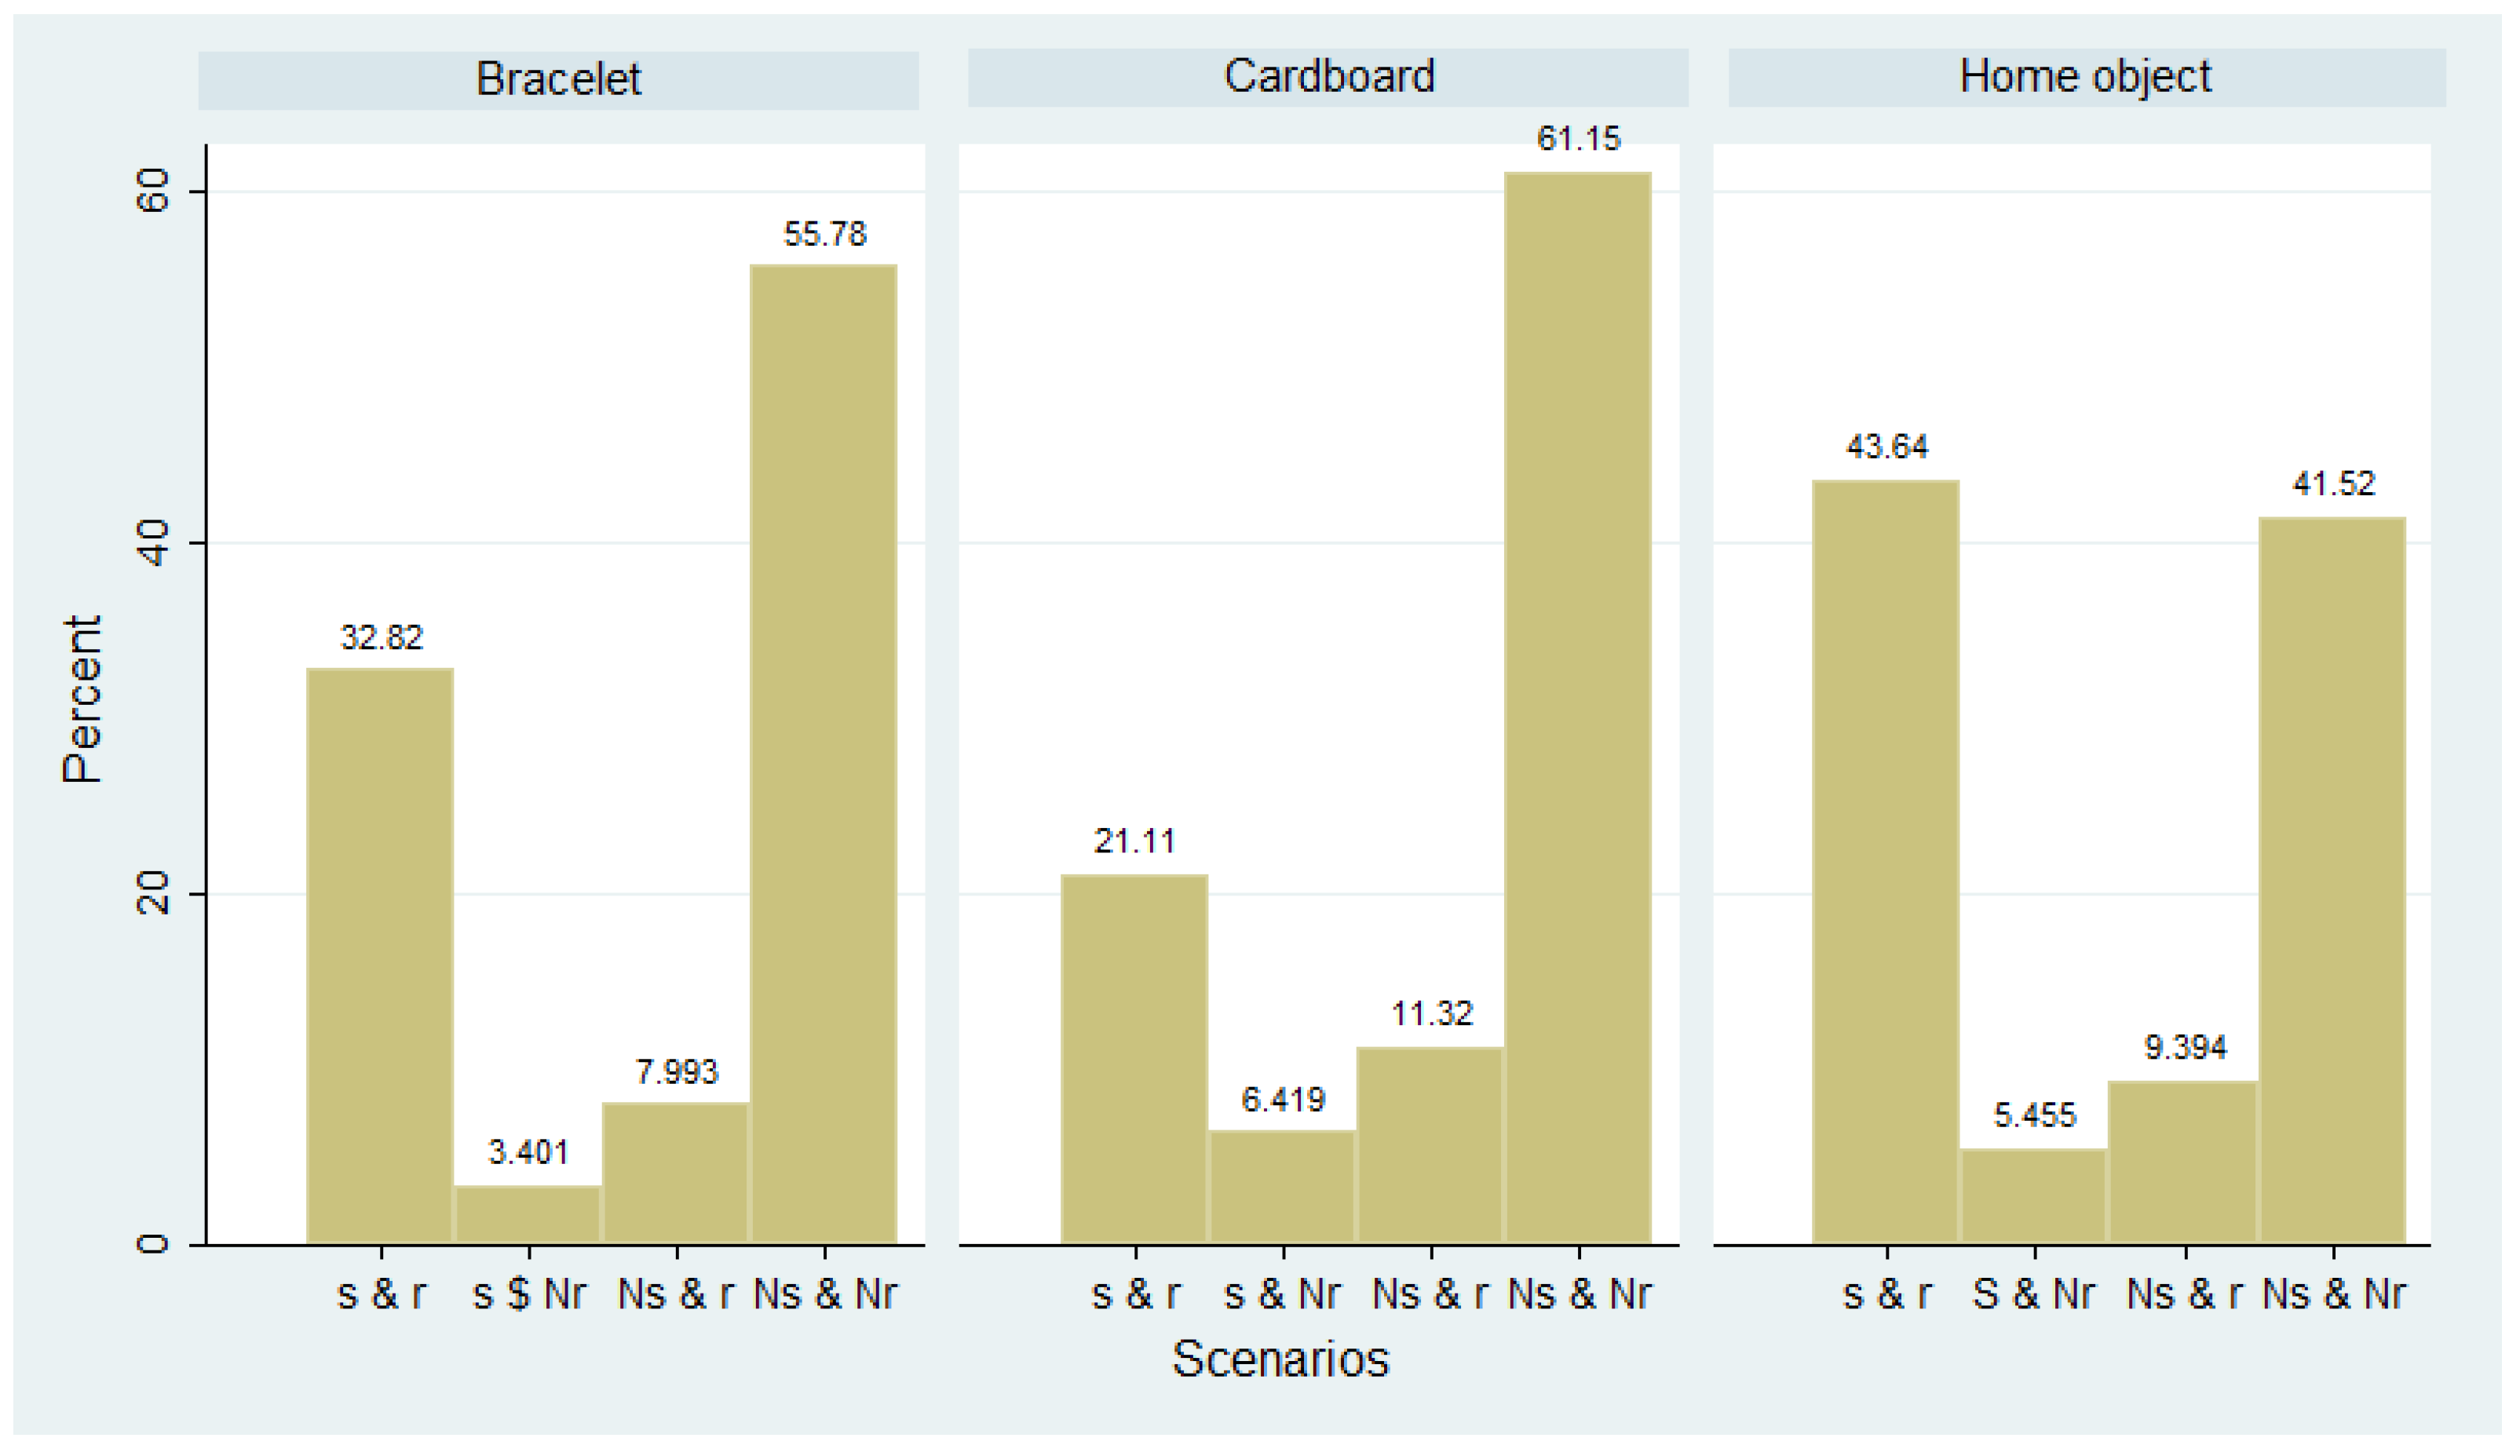
Figure 2 shows four possible scenarios for the tokens. The token might have been sent at round
t and one was received at
t − 1 (scenario
s &
r). The player was, therefore, in a position to send a token at time
t and he/she did so. The token might have been sent at
t, but none was received at
t − 1 (
s &
Nr). In this case, the player sent a token that was previously “stocked,” i.e., not sent. The token might not have been sent at round
t, but one was received at
t − 1 (
Ns &
R). In this case, a stocking choice occurred. Lastly, the token might not have been received at
t − 1 and might not have been sent at
t (
Ns &
Nr). This last case could potentially hide an impossibility to send the token if the subject had not stocked any in the past, which is a question we investigated next.
Across all the studies, a typical scenario was one in which no token was received in the previous period, and no token was sent (Ns & Nr). Given that no direct reciprocation occurred between players, this behavior cannot be the result of a desire to punish the designated sender of the token for his/her failure to send in the previous round. A plausible explanation is that the participants had no token available and, therefore, could not send one. Another possible explanation is that a token was available, but the participant chose not to send it in that particular round possibly to use it later. In the home object study, objects were most often received and sent.
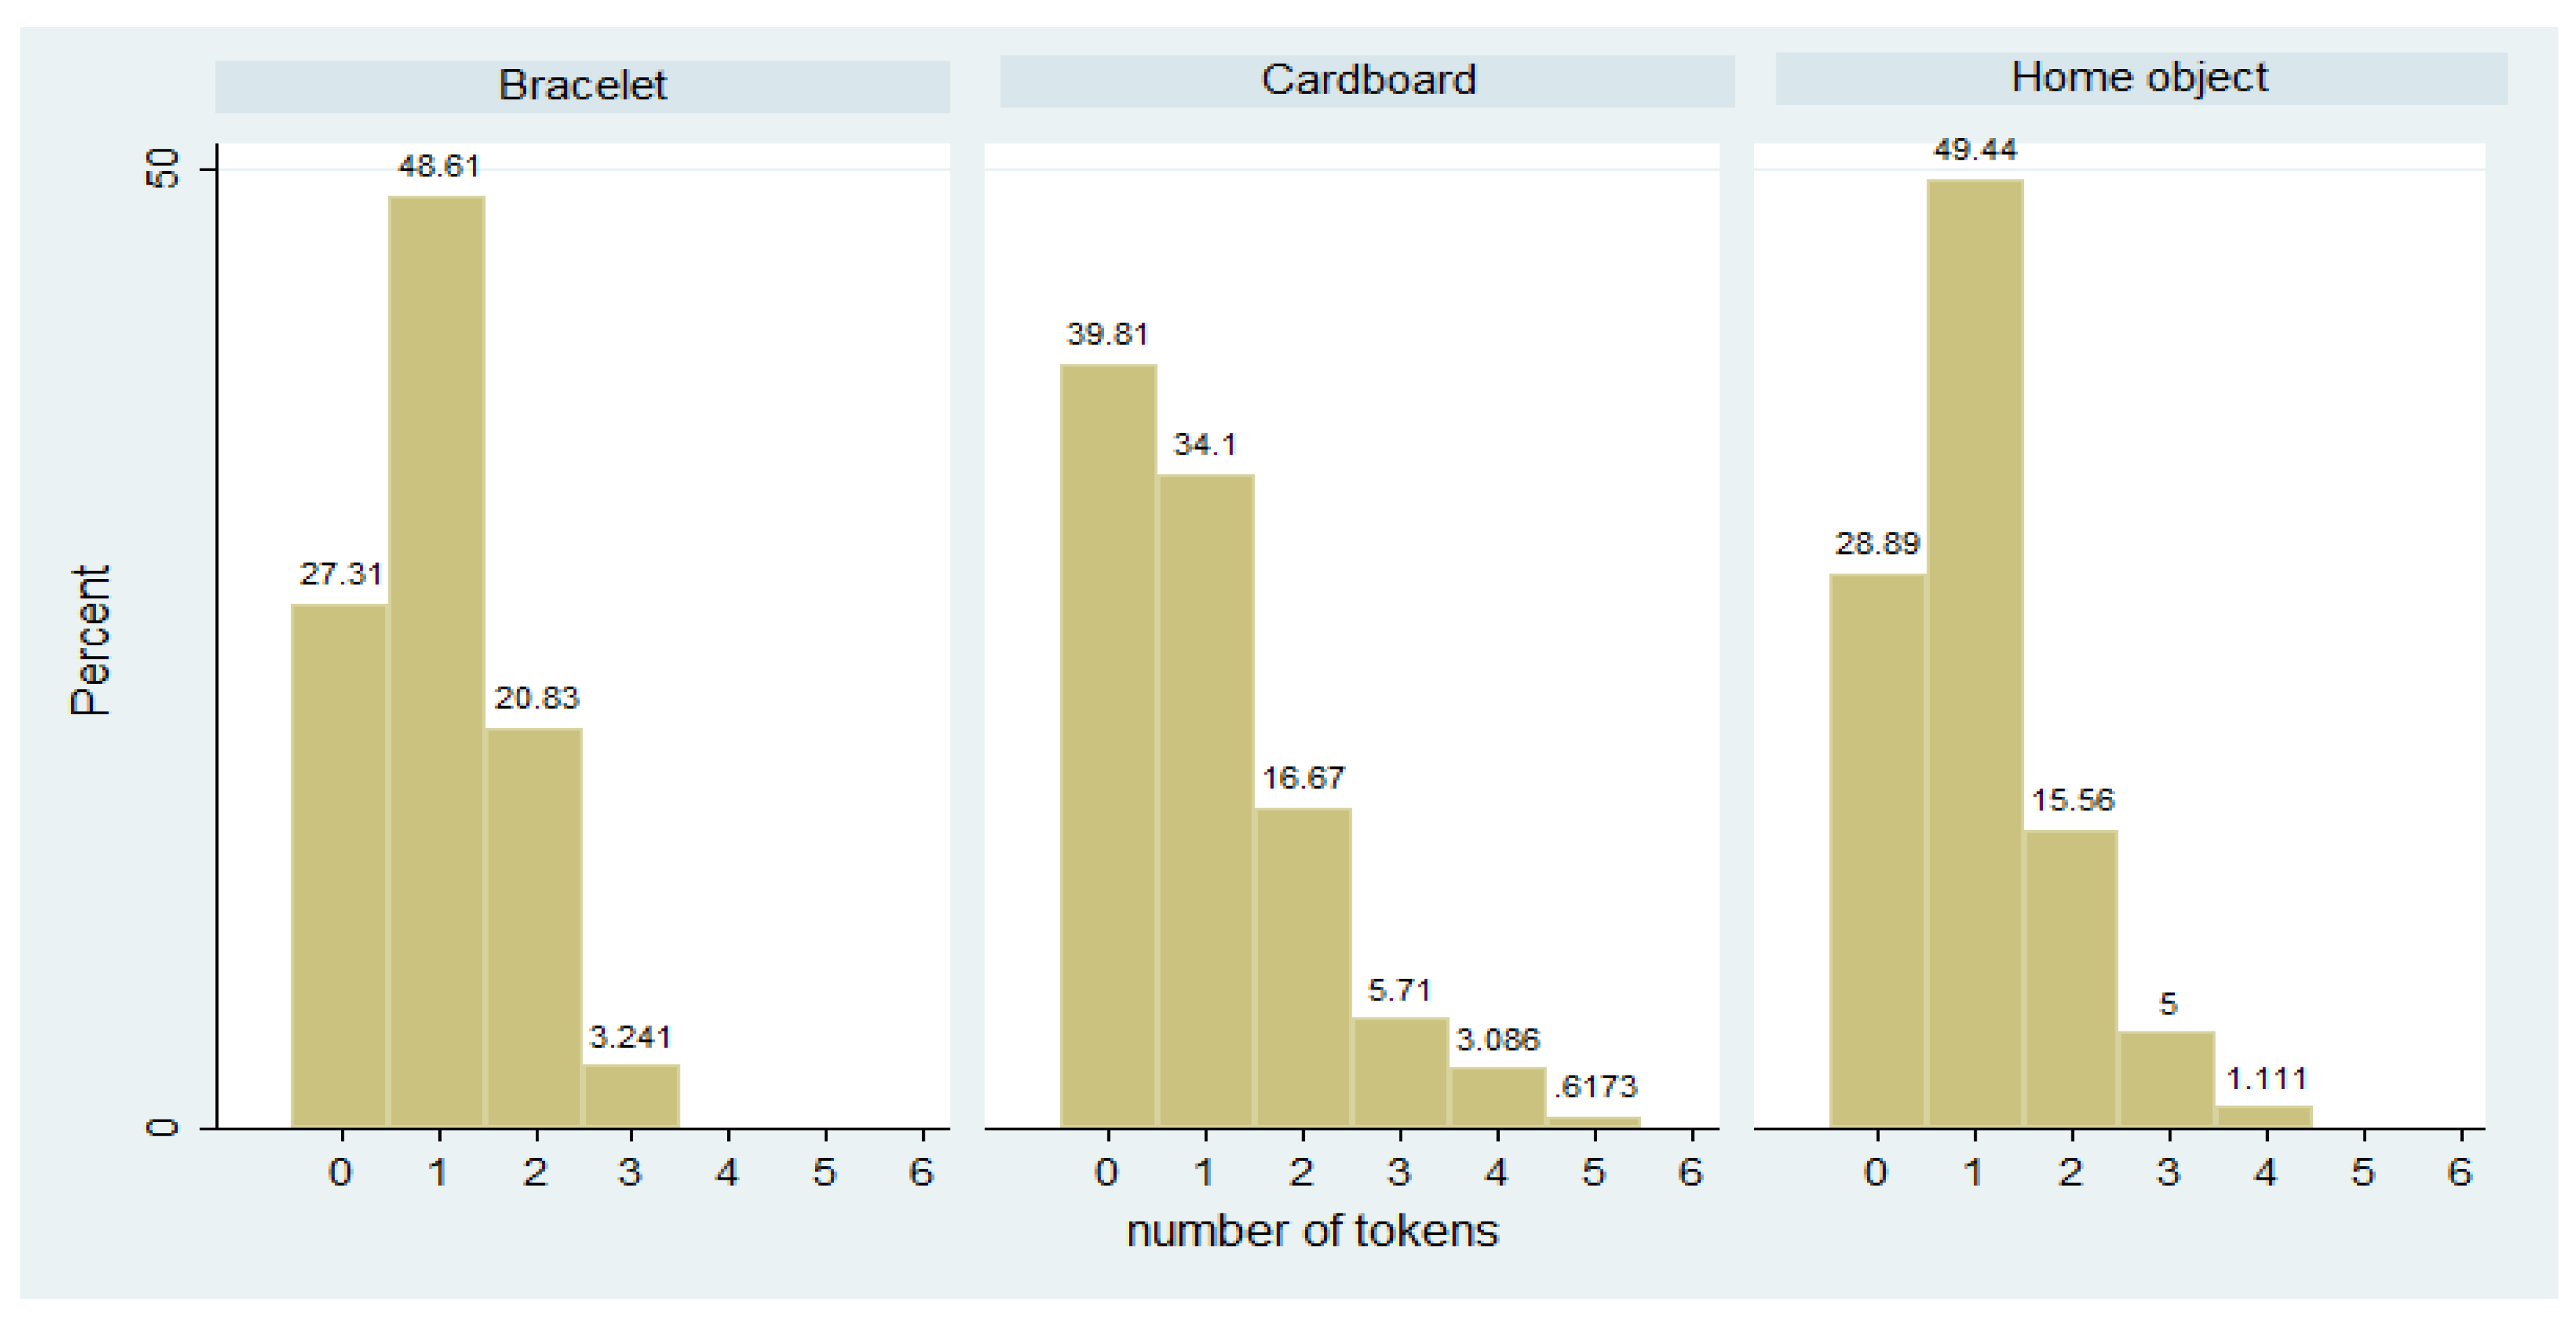
Figure 3 shows the number of tokens that, on average, participants had available before playing the PGG.
In all studies, on average, subjects had at least one token available. In the cardboard study, having no token at all was the mode, which is a sign that there was a group of people who likely stocked up the tokens (cf. also
Figure 2 that shows that, in about 11% of the cases, a stocking up choice occurred in the cardboard study). Having no object at all took place at approximately the same frequency in the home object and bracelet study.
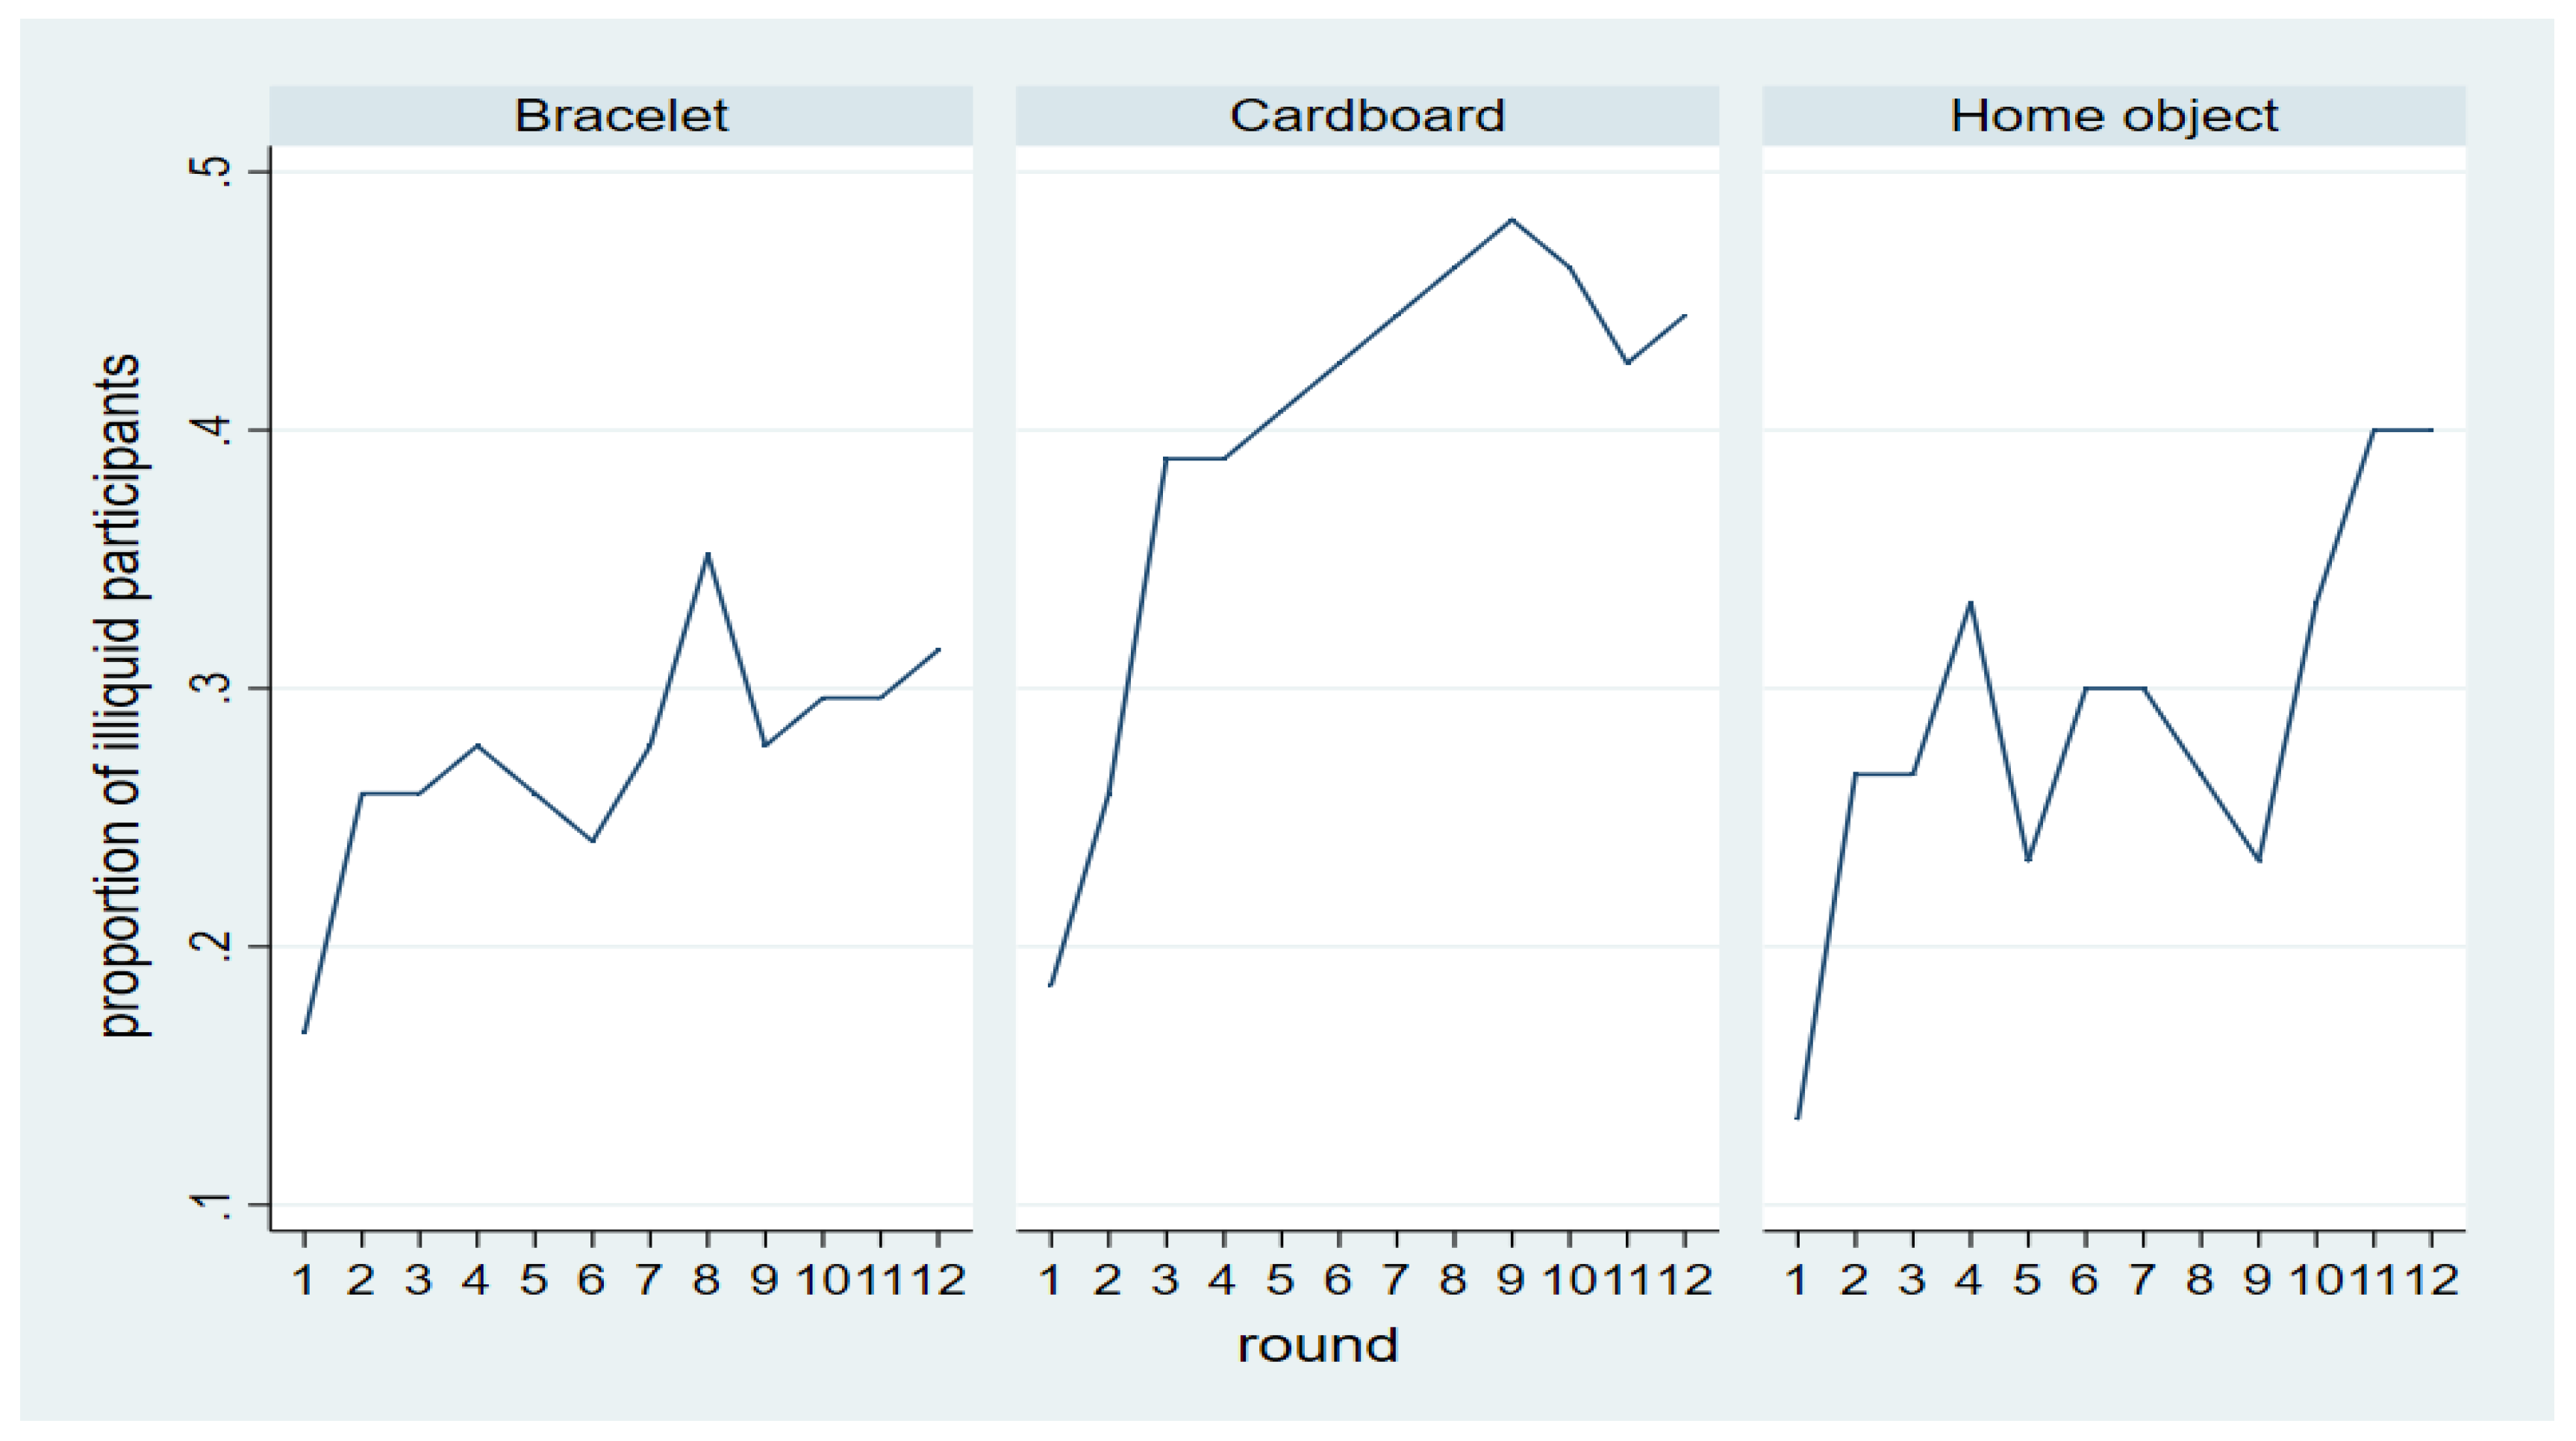
Figure 4 shows the proportion of participants who were “illiquid,” which is a term we borrow from [
26]. These participants had no token available at the end of round
t (i.e., none was received in period
t and no stocked token was available) and could not, therefore, send a token in round
t + 1.
Figure 4 shows that illiquidity was a problem in the cardboard study. In general, an upward trend is apparent in all three studies, which shows that more and more participants became “illiquid” in the course of the experiment. The stockpiling of the cardboard pieces is puzzling. Some subjects might have thought that these objects could be useful in a possible future stage of the game and, therefore, retained the cardboard pieces as a “storage of value,” which is one of the typical functions of money (cf. note 13). This finding has motivated us to run a robustness check with two cardboard pieces discussed below.
Regression Analysis
We have a strongly balanced panel with 198 participants observed over 12 periods. The individual identifier of the panel is the participant and the time identifier is the round. In model 1, we wish to quantify by how much receiving or sending the token increases contributions to the public good. For this analysis, only the data from the treatments are used and, therefore, the cardinality of the personal identifiers is 138 (participants). We regress contributions of player
i to the public good in round
t on a dummy equal to 1 when player
i sent the token in round
t, and a dummy equal to 1 when player
i received the token at round
t. Both sending and receiving the token occurred before the subjects chose how much to contribute in the PGG
26. We also included an interaction term of the two token dummies, and the total amount contributed to the public good by all other members of player
i’s group in round
t − 1. The data generating process is shown in Equation (1).
The
is a participant-specific, time-invariant effect. If one adds the additional strict exogeneity assumptions that
and the error term
are i.i.d., we have the Random Effects (RE) model ([
29], p. 700). An alternative specification of the DGP is the so-called Fixed Effects (FE) model. This model estimates a transformed Equation (1) without
(cf. [
29], p. 750). If the model (2) is correctly specified and the exogeneity assumption holds, RE is both consistent and asymptotically efficient. The FE estimates are always consistent even though FE might not be the most efficient estimator because of the transformation it entails (cf. [
29], pp. 716–717). We estimate the coefficients of interest through both RE and FE. The regression output is shown in
Table 2.
Both models are overall statistically significant. To achieve 80% power with a 5% significance level, with an overall R2 of 0.17, we estimate a required sample size of 64, which is well below the number of participants (138).
A Hausman test fails to find systematic differences in the two sets of estimates (RE and FE models estimated with default standard errors to run the Hausman test, p-value = 0.104). Sending the token increases significant contributions by about a third of a point (out of ten). Sending the token was, therefore, a reliable signal of the player’s increased willingness to contribute. Also, receiving the token had a small impact on contributions, which was significant using FE estimation and marginally insignificant using RE. We also found a positive relation between period t − 1 contributions of the other players and period t contributions of player i.
The regression output in
Table 2 uses only the observations in the panel from the treatment studies where the tokens circulated. Estimating
through RE using only the control sessions in a regression where
is the only regressor yields an estimate of
that is very similar in magnitude to the one in
Table 2 (
.
We now estimate the impact of the different types of token and delay on contribution behavior when compared to the control. We regress contributions in round
t on a dummy for the bracelet study, a dummy for the cardboard study, a dummy for the home object study, and a dummy for delay (equal to one for the control with delay and for all the sessions in which a token was exchanged and equal to 0 only in the control study sessions). For this analysis, we use all our participants. The regression model is shown in Equation (2). The effect of the dummy (time-invariant) variables can only be estimated using the RE model. The regression output is shown in
Table 3.
The model is overall statistically significant. To achieve 80% power with a 5% significance level, with an overall R2 of 0.033, we estimate a required sample size of 377, which is a number above the total number of participants in our studies (198). The low R2 is the clear source of the lack of power. To tackle this problem, we augment regression (2) with a new regressor that we know from earlier analysis plays an important role in explaining period t contributions, i.e., the total amount contributed to the public good by all players −i in round t − 1. This regressor was already used in regression 1. This new regression features a much higher R2 of 0.15 and the sample size required now is 85, which is well below our number of participants. The new regressor is significant, and the magnitude is identical to the one estimated in regression 1. The new estimates are: = 0.715, S.E. (, p < 0.05, = 0.68, S.E. (, p < 0.1, = 0.14, S.E. (, statistically insignificant, = −0.24, S.E. (. The signs of the newly estimated cofficients are the same and the p-values are comparable. The magnitudes of the treatment effects are, however, smaller in the new regression.
The estimation output in
Table 3, coupled with the nonparametric testing presented earlier, establish that the bracelet study features significantly higher contributions compared to the control sessions. Against our expectations, contributions are not higher in the home object study compared to the control. The evidence regarding the effect of the cardboard is less robust and has motivated a follow-up study, which is described next.
Delay is associated with lower contributions in
Table 3, but insignificantly so. A two-sample Mann-Whitney test finds significant differences between the delay sessions and the sessions in which the participants proceeded at their own pace (
p < 0.05). Overall, these results point to a limited role for delay in the participants’ choices.
Robustness Checks
Motivated by the puzzling low number of tokens sent in the cardboard study as well as by the failure of regression analysis to confirm what was apparent in
Table 1, i.e., that contributions were on average higher in the cardboard study compared to all other studies, we ran a robustness study in which every participant was endowed with
two pieces of cardboard at the start of the game. We also designed a longer questionnaire to gain some insights into how the participants viewed the cardboard pieces. The experiment was otherwise equivalent to the cardboard study. We recruited 36 participants from the same subject pool as the other studies excluding previous participants.
Table 4 shows the descriptive statistics for this new study.
Comparing the figures in
Table 4 and
Table 1d, contributions appear very similar, but tokens were sent about 20% more often in the sessions with two tokens. A two-sample Wilcoxon rank-sum (Mann-Whitney) test fails to find any difference in contributions to the public good between the sessions with one cardboard and the sessions with two. The frequency with which tokens (1 or more) were sent is significantly different in the two treatments.
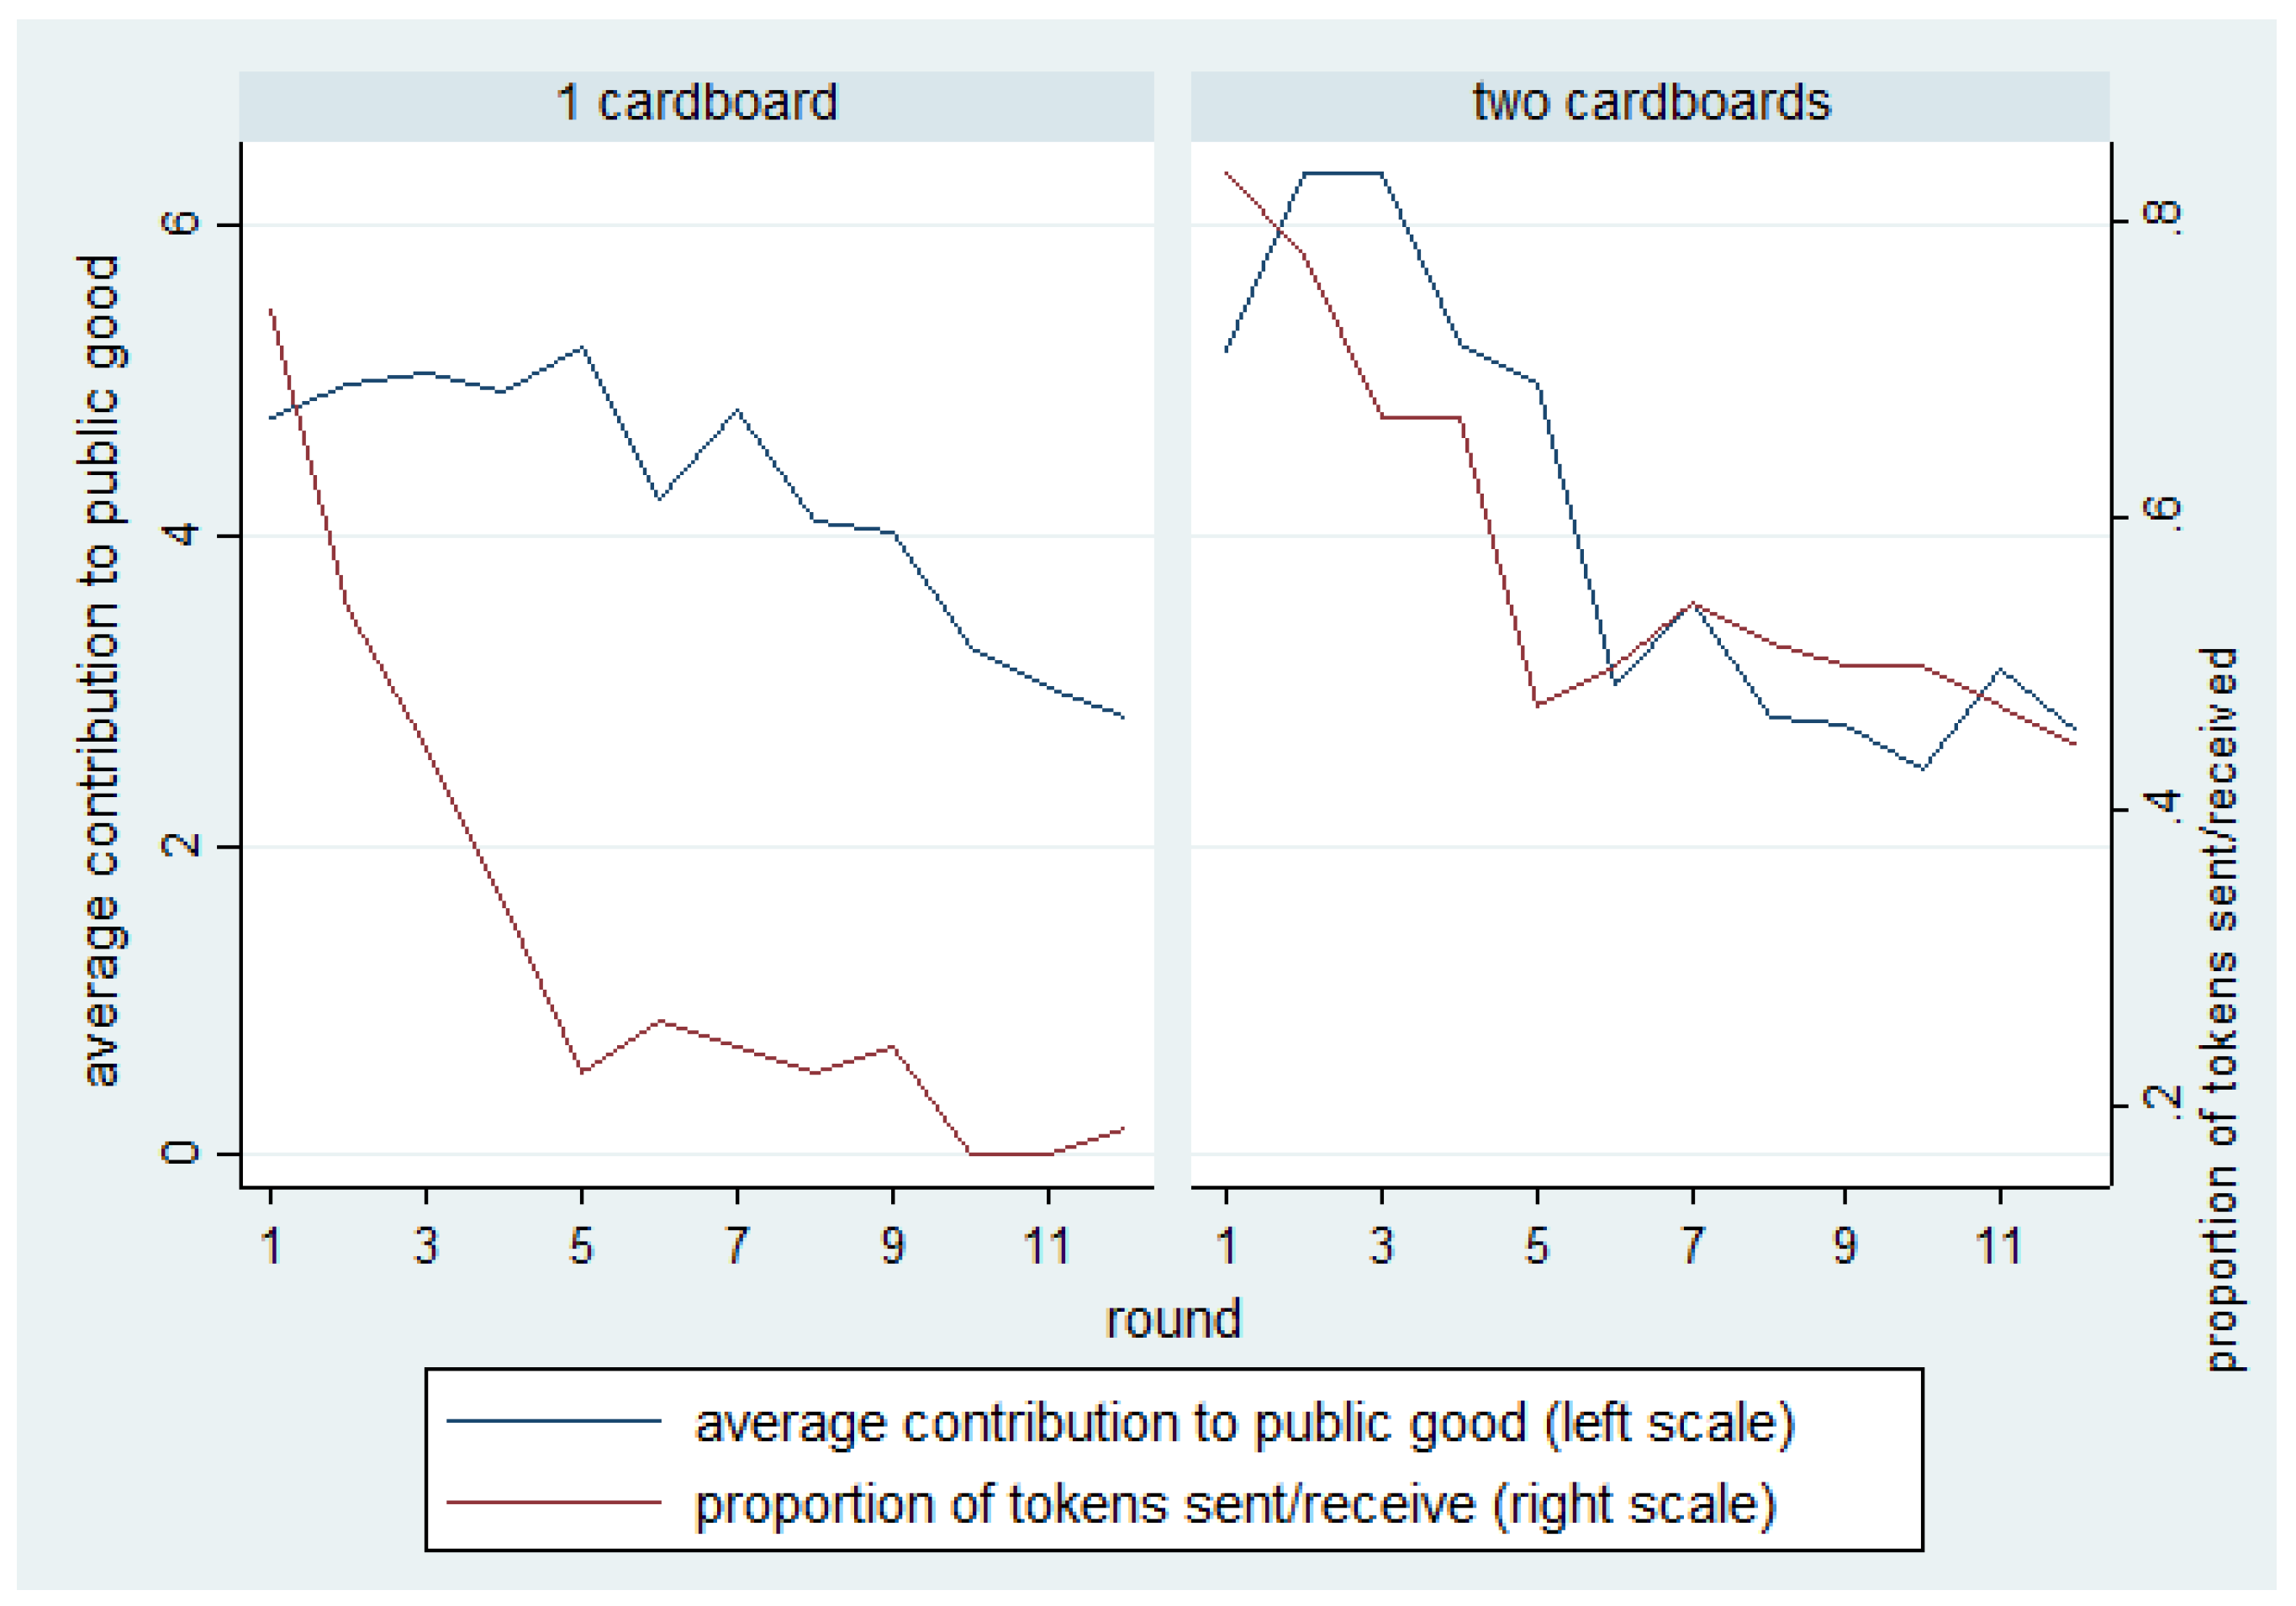
Figure 5 shows that tokens circulated more in the treatment with two cardboards. There was a declining trend both in the proportions of tokens sent/received and in the contributions.
Endowing the participants with two tokens instead of one has relived the liquidity problem participants faced in the treatment with one cardboard. The contribution of this increase in token exchanges to the public good is, however, negligible. Injecting more tokens at the start of the game has confirmed the usefulness of the tokens to increase contributions to the public good but has not modified contributions significantly compared to the case of one cardboard only. Running regression model (1) using only the two-cardboard sessions confirms a positive, significant relationship between receiving a token and the period t − 1 contributions of the other players, and period t contributions (= 0.67, = 0.09, using Random Effects).
Re-running regression model (2) and including a new dummy for the treatment with two cardboards, we find that the marginal effect of one token and two tokens are both significant and comparable (1.3827 and 1.454 tokens, respectively). These results once again speak in favor of a positive effect of the cardboard pieces on contributions.
The three additional questions we asked in the debriefing questionnaire read as follows:
“Do you think the cardboard pieces were valuable?” 42% of participants answered yes.
“Do you think the cardboard pieces were useful?” 32% of participants answered yes.
“Why do you think that some players might have chosen NOT to send the cardboard piece in some rounds?
The options we provided were:
“They thought that, at the end of the experiment, the cardboards could be exchanged for money.” In total, 44% of the participants chose this option.
“They kept the cardboards to use them later” (8%).
“They kept the cardboards because they liked them” (11%).
“They thought that sending the cardboard was useless and therefore they did not send them” (14%).
“They had no cardboard available and, therefore, they could not send any” (20%).
The remaining participants chose “Other/I do not wish to respond.” The reason most commonly identified for not sending the tokens was, therefore, the possible “worth” of the cardboard pieces. We anticipated that some participants might form the belief that the cardboard could be useful in a “follow up” experiment. We deliberately decided, however, not to insert in the instructions a statement explicitly saying that the cardboards were “worthless” since this provision would have trivialized our experimental manipulation. The result of this choice is that about half of the participants thought the cardboard pieces had “value” and could be redeemed for cash at the end of the experiment. The “social positioning” theory of money due to the Tony Lawson posits that “money is constituted where it is accepted throughout a specific community that a thing or stuff of value is positioned as a generalized form of value…” ([
30], p. 12). If this process of acceptance is successful, as it appears to be in our studies, then storing even worthless tokens might be a sound strategy.
3. Discussion
Our experimental design captures some of the elements of the Kula, such as the indirect reciprocation of the gift one received, the public-good nature of the institution of the Kula, and the presence of tokens with no apparent value but endowed with different degrees of attachment to people. Consistently with previous literature ([
23,
31]), we find a positive association between receiving a signal and contributions to the public good. The finding that the past choices of the other players explain current-period contributions is indicative that past actions were carefully taken into consideration by the players. [
31] found that in games such as the PGG in which the competition motives prevail over the cooperation motives, observation of past actions is more effective than cheap talk. Sending the token in our public good game is not a self-committing choice in the language of [
32]. Provided that receiving the token is interpreted as an invitation to contribute to the maximum, the sender’s best response to the receiver’s best response to the message (if trusted upon) is to contribute as little as possible, i.e., free-ride on the other player’s contribution (cf. [
31]). The modest size of the effect of sending and receiving the token on contributions (
Table 2) might be an import of the game that we chose in our study.
In our experiment, the players could freely access information on past contributions to the public good as well as information about the signals. In the Kula, no record of past behavior was available, and it is not surprising that the tokens were carefully accounted for and followed in their keda.
A limitation of our design is that the bracelets and the cardboard pieces featured a high degree of homogeneity unlike in the Kula Ring where the stories that accompanied each object made some tokens more valuable than others. The different degree of desirability of the objects created an elaborate “strategy space” for the players in the sense that choices had to be made not only regarding whether to give but also what one would give and what one would solicit from others. The strategic and ceremonial richness of the Kula is lost in our laboratory environment.
While our results show that contributions in the bracelet and, more tentatively, the cardboard study were higher than in the control study, the results from the home object study were surprising. The concept of “psychological ownership,” i.e., the degree to which something feels “mine” ([
33]), might help us interpret this result. It is hard to imagine any psychological ownership for the cardboard pieces and the bracelets since they all looked very similar. The home object might have induced a higher degree of psychological ownership. Renouncing its ownership, which occurred often, might have “excused” the participants from contributing to the PGG. Rather than both being the expression of the kindness of the player, sending the home object and contributing to the public good might have been substitutes.
Future research might further enlighten the relationship between the total initial supply of tokens and its distribution and contribution levels. As we have shown in our robustness study with two tokens, increasing the initial endowment relives the liquidity problem. On the other hand, the higher availability of tokens decreases the information value of each token, which is a “hyperinflation” phenomenon. This is probably why the extra token available did not change contribution levels. In our experiment, there are two counter-forces at play. On one side, the signal should be “valuable” and not easily reproduced on the spot (to avoid hyperinflation). On the other hand, participants should not be overly penalized if they become illiquid. It is an extant challenge to find objects and designs that strike a balance between these two competing dimensions.
4. Materials and Methods
Our treatment studies (bracelet, cardboard, and home object) are modified repeated public good games. Six players interacted for an undisclosed number of rounds (the game stopped at the end of the 12th round in all our experiments) to avoid end-game effects. In all sessions, there were 12 or 18 participants in the experimental room to maintain the anonymity of the group participants. The choice of the number of players (6) and rounds (12) makes it possible to receive back, possibly even twice, the object one originally “injected” into the circuit.
In part 1 of the bracelet study, subjects were randomly assigned to a computer in the experimental room and given a code with a letter and number. Letters (A, B, or C) identified the group the participant belonged to while the numbers (from 1 to 6) show their ID in each group. The experimenter read the instructions
28. The instructions did not make any reference to the public good as a common project or good that would benefit all (as in the cooperative condition of Cone and Rand ([
34]). The instructions simply stated that the players could choose how much to consume of two goods, one that benefitted them linearly, and one whose fruition depended on the other players’ choices. The instructions are closer to those used in Cone & Rand’s competitive condition, which also referred to the possibility to either keep the money for oneself or to “contribute.” Subjects then completed a comprehension test that was individually checked by the experimenter. Questions were privately answered. Subjects were then asked to build a bracelet using beads and a string provided on each desk. The number of beads given to each participant was approximately 25 and subjects were told they could use any number of beads for their bracelet. Subjects were given a maximum of 10 min to build the bracelet.
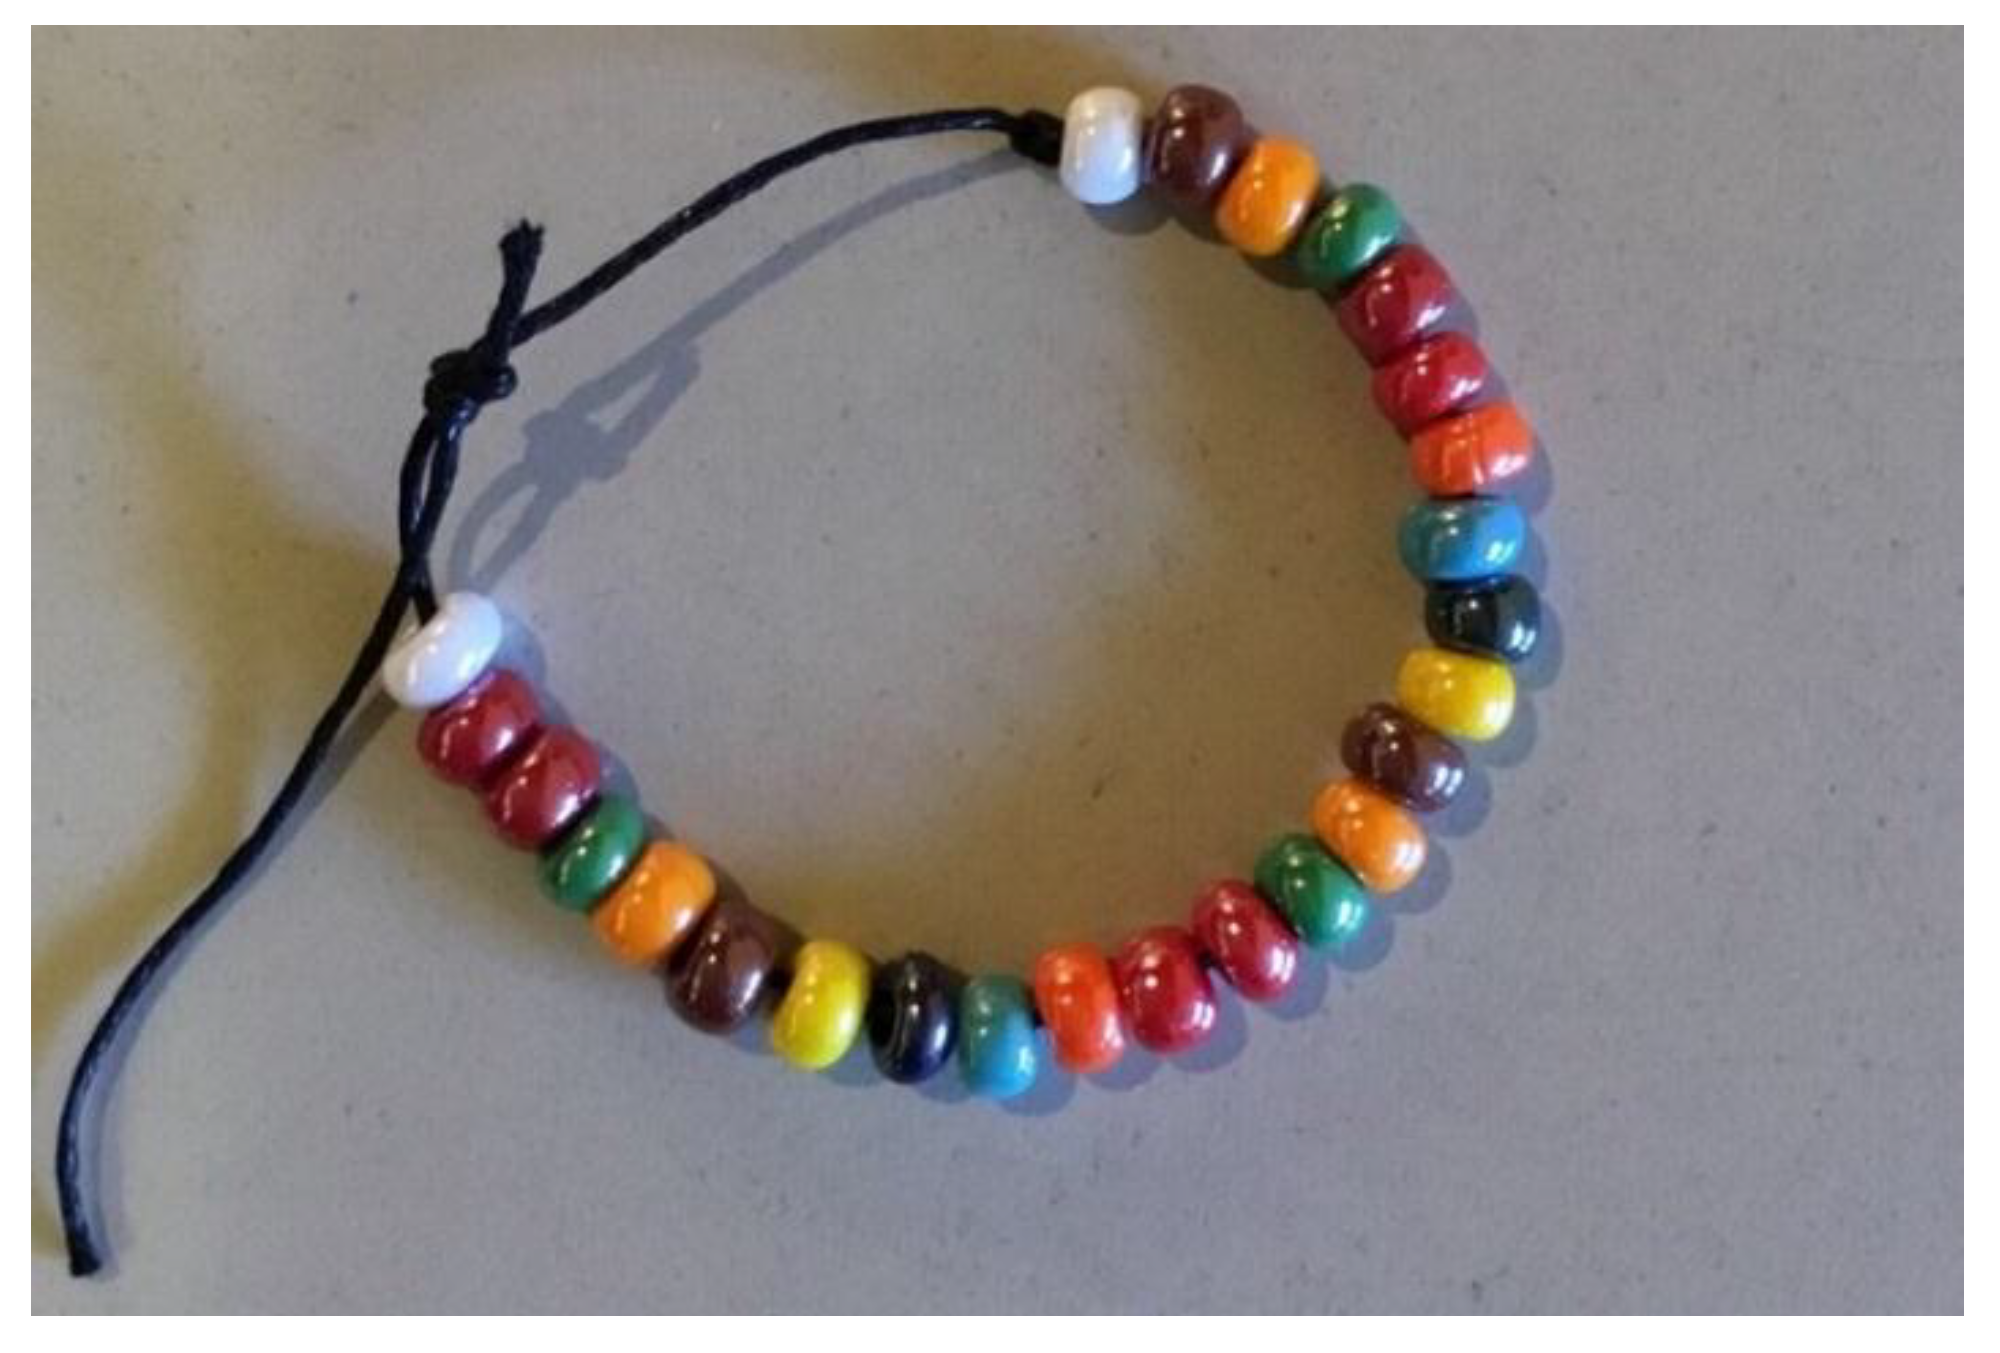
Figure 6 shows a bracelet that was left behind by one of the participants. The choice of the bracelet is inspired by one of the Kula objects, the “armband” (or “armshell” as Malinowski referred to it). We chose to ask the participants to build a bracelet, instead of a necklace (the other Kula token) because bracelets are smaller and easier to assemble.
Part 2 of the experiment then started. Participants decided whether they wished to send the bracelet they had built in Part 1 to another member of their group. The path of the bracelets like the keda of the Kula tokens was fixed. Player A6 always sent the bracelet to A1, A1 to A2, and so on. In our experiment, there was no possibility of direct reciprocation between two players: the reciprocation is, instead, indirect, as in the Kula. Each participant inserted the bracelet in a small tube that had two compartments. The tubes were two film canisters glued together with the two extremes of the tube closed by the canister lids. Subjects were given the option to insert the bracelet into the tube using the side which had been marked with a sticker. The other side of the tube contained a small piece of wood with the experimental ID of each participant. Confederates collected the tubes and brought them to the experimenter. The experimenter checked whether each player had sent the bracelet or not and then replaced each sender’s code with the recipient’s code. For example, the code of player A2 was replaced with A3. A confederate then brought the tube to player A3 and so on for all other participants. Participants were aware that the tubes were delivered regardless of whether there was a bracelet inside or not. The somewhat cumbersome and time-consuming procedure of checking the tubes individually was dictated by the desire to avoid the participants self-reporting whether they had received, or sent, the bracelet. In particular, some participants might have inaccurately reported having sent the bracelet to “save face.”
After the tubes had been delivered, Part 3 of the experiment started. Subjects decided how many points, out of 10, to allocate to a public good. As soon as all players confirmed their choice, each player was shown his/her contribution again, the sum of all group members’ contributions to the public good (not every single opponent’s contribution), one’s share of earnings from the public good, and one’s current-period earnings. The bracelet sending/receiving and the PGG were repeated in sequence 12 times. After the game ended, participants completed a debriefing questionnaire. Then subjects were paid their earnings privately. Participants were instructed that all bracelets in their possession by the end of the experiment were their property or they could leave the bracelet(s) in the lab.
The final payoff was the sum of the payoff in each round of the PGG. The payoff in each round is shown in Equation (3).
is the investment in the private good of player i in round t; 2.4 is the multiplier, 6 the number of players in each group, and the contribution of each group member to the public good in round t with where the period endowment. The exchange rate was set at 5 euro cents per experimental point plus a 3-euro show-up fee. To this monetary payoff, one could add the value of the bracelet(s). If one looks only at the value of the raw materials (beads and string), the value of the bracelet did not exceed a few euro cents. Only a handful of players left the bracelets behind, which is a sign that most players thought it worthwhile to bring the bracelet home.
In the cardboard study, subjects completed Part 1, which is the construction of the bracelet. Bracelets were then collected, placed in an envelope with the participant’s experimental ID, and kept in storage by the experimenter. Participants knew from the instructions that the bracelet would be returned to them at the end of the experiment. In part 2, participants could send through the usual tube a piece of cardboard with a simple marking (a circle, or a line, square) to the next player. The piece of cardboard was placed on each desk before the start of the experiment. Confederates collected the tubes and brought them to the experimenter who registered whether the player had sent the cardboard piece or not and delivered the tubes to their recipients. Part 3 then started the PGG. Part 2 and three were repeated a total of 12 times and undisclosed as usual to the participants. Subjects completed a questionnaire and were then paid their earnings and were given back their bracelets. Subjects were instructed that they could keep the pieces of cardboard or leave them behind. Virtually all subjects left the pieces of cardboard in the lab.
In the home object study, the participants, upon receiving a reminder email the day before the experiment, were asked to bring a small object with them that would fit a small tube. Subjects were given some examples of acceptable objects such as an elastic band, a button, a piece of paper, and an eraser. Subjects were also warned that they might have lost the object in the course of the experiment. On the day of the experiment, we verified in private that the subjects had brought the object. The subjects were then seated in the experimental room. Part 1 then ensued (instructions and bracelet building). In part 2, the subjects decided whether to send the next player the object they had brought from home through the usual tube. As usual, the experimenter recorded whether the object was sent or not and then the objects were delivered. Examples of objects that were sent were erasers, pieces of paper, candies, and elastic bands. Part 3, i.e., the PGG, followed. The questionnaire, payment, and the return of the bracelets concluded the experiment. Participants were told that they could bring the objects in their possession home. Most subjects brought the objects home.
We used different types of objects, bracelets, cardboards, and an object brought from home to artificially create different degrees of proximity between the objects and the participants who remain anonymous throughout the experiment. We hypothesize that the objects that have a link to the participants, the bracelets, and the home objects, should convey more information than the cardboard about strategies to be played in the ensuing PGG.
In the control study, subjects completed Part 1 (instructions and bracelet construction). The experimenter collected the bracelets. Participants played the repeated Public Good Game (Part 3 of the treatment) for an undisclosed number of rounds (12 in all sessions). The experiment ended with the administration of the questionnaire, which was followed by the payment and the return of the bracelets. In the control study, there was no object circulating before each round of the PGG.
In the study control with delay, subjects in Part 3 (the PGG) had 2 min to decide how much to contribute to the public good in each round. During this period, the subjects could change their mind. At the end of the 2 min, an OK button appeared on the screen and subjects confirmed their choices. After everyone had confirmed his/her choice, the usual feedback was provided, and a new round started. The control with delay study was otherwise equivalent to the control study. The control with delay study, as we explain further below, was needed to replicate the time lags of the treatment studies where some time was required to collect the tubes, record their contents, and deliver them to the recipients.
In conclusion, all our studies (treatments and controls) featured a bracelet-construction stage (Part 1) and a repeated PGG (Part 3). In the bracelet, cardboard, and home object studies, Part 3 is preceded by Part 2, which includes the decision about whether to send the token or not. The decision to let participants construct the bracelet in all our studies was dictated by the desire to ensure comparability of the results from the different studies. We do not believe that the construction of the bracelets had any effect on PGG behavior. We hypothesize that any behavioral difference between the treatments and the controls comes from the circulation of the tokens.
We formulate three testable hypotheses. The first concerns the relationship between “token behavior” and “PGG behavior.”
Hypothesis 1. Sending and receiving the token is associated with higher contributions to the public good in the treatments (bracelet, cardboard, and home object studies).
The participants in each period choose their contribution levels after having decided whether to send the token or not and after having observed if another participant sent a token (or not). Participants are likely to condition their PGG behavior on sending and receiving the token. This behavior might be caused by an “experimenter demand” effect, i.e., participants believe that, if before every round they are being asked to choose whether to send the token or not, there must be a link between the tokens and the PGG. Alternatively, as discussed by [
35] (p. 189), participants might condition on the signal received out of a “peer demand effect,” which is a change in expectations about the behavior of others in the PGG conveyed through the token. This effect might be particularly strong for the “conditional cooperators” in the group. While sending the token did not bind the sender in the PGG, sending the signal was in a certain sense “costly” since it deprived the sender of the possibility to send a token in the future unless another player sent him/her a token. The evidence presented in the previous section is consistent with this hypothesis.
The second hypothesis is about the comparative effectiveness of the different tokens in promoting cooperation.
Hypothesis 2. The level of cooperation in treatments is higher than in the control studies. Furthermore, the home object and bracelet are more effective in increasing contributions than the cardboard piece.
The first part of the hypothesis is a claim regarding the effectiveness of our manipulation, i.e., the possibility to send the token. The evidence presented earlier in this paper confirms the validity of our manipulations. The second part concerns the comparative effectiveness of the different types of tokens in increasing contributions.
In the impossibility to associate objects to “famed” individuals in the lab and to generate stories for the different objects, we looked for alternative ways to create a bond between the objects and the participants in our experiment. The bracelet was an artisanal piece built through an actual exercise of effort by each participant. Some effort was also involved in bringing the home objects to the lab room. The participants might have recognized the kitoum aspect of these two objects, i.e., the original owner’s willingness to part with the bracelet or the home object for the sake of the group. The bracelet and the home object continue being signals of good intentions as the objects travel around, but it becomes impossible to know whose object one is sending or receiving. The impossibility to trace objects back to the original owner happens because, unlike in the Kula, the tokens had no name. The signaling aspect and the kitoum aspect are, therefore, both bundled together in the decision to send the token at the beginning of the experiment. In later rounds, the signaling aspect becomes the only possible interpretation.
The piece of cardboard is unassuming, and the participants did not construct it. The signaling aspect is, however, intact. The cardboard is comparable to sending messages in a cheap talk experiment where a payoff-irrelevant “verbal object” is sent. Cheap talk experiments are advantageous in allowing the experimenter to associate labels that will be recognized by all participants to the messages, e.g., “I will cooperate.” In the case of the cardboard, the “common language aspect” might be more complicated and the participants might have been wondering what the use of these objects was. The “kindness” of one’s decision to send the cardboard and the other types of tokens should, however, be apparent.
The evidence presented earlier in the paper confirms the beneficial role for contributions of the bracelet. We did not find support instead for the effectiveness of the home object.
The last hypothesis is about the effect of time on contributions.
Hypothesis 3. Delay in the studies with a token and the control study with a delay, is associated with lower contributions.
In the studies with a token, there was a lapse of 1 to 2 min between the time subjects sent the tube and the time they received another tube back. Subjects could, in the meantime, ruminate on their contribution choices. In the control study, where no token exchange took place, subjects moved from one round to the next as soon as everyone had confirmed his/her choice and everyone had pressed the OK button in the feedback screen. Many papers find that the time delay increases defection rates relative to studies that create a time pressure on the participants ([
34,
36,
37,
38,
39,
40]) but only among people living in cooperative societies ([
41,
42]; cf., however, [
43], finding instead that extreme time pressure increases defection relative to time delay). We fail to find any strong role for delay in our experiments. The likely reason for this departure from the literature is that subjects in the control study proceeded at their own pace and were, therefore, not under time pressure, strictly speaking. Also, the time dimension was never explicitly primed in the course of the experiment.


