3.1. Quantity Competition
In this form of competition, firms set fixed quantities before production takes place, without knowing the realization of the demand shock. That is, a strategy for firm
is a nonnegative quantity of output,
. Firms simultaneously determine their strategies to maximize their expected profits. We say that a pair of quantities
and
constitutes a Nash equilibrium if, for each
with
, the quantity
maximizes the expected profits of firm
i when firm
j sticks to the quantity
. That is, the quantity
solves
Proposition 1. In the studied duopolistic industry with differentiated products and demand uncertainty, there exists a unique symmetric (Cournot) Nash equilibrium in quantities, where each firm chooses the quantity given by Proof. Using Equation (
4) at
, the optimization problem in Equation (
6) can be written as
Differentiating Equation (
8) with respect to
, we obtain the first-order necessary condition
If the strategy pair
is a Nash equilibrium, then
must satisfy the above first-order condition. Moreover, if this equilibrium is symmetric, we must have
. Inserting these into Equation (
9), we obtain
Finally, for the problem in Equation (
8), the second-order sufficient condition holds, as
Thus, the choice of quantities constitutes a Nash equilibrium. ☐
We note that using Equations (4) and (7), we can calculate the equilibrium price at any realization of
as follows:
Accordingly, given any
, the equilibrium profits of each firm become
It follows that the expected equilibrium profits of each firm are given by
Corollary 1. The expected producer profits are always decreasing in β, γ, and c.
Proof. Differentiating Equation (
14) with respect to
, we obtain
as
and
by assumption. Now, differentiating Equation (
14) with respect to
, we obtain
Finally, differentiating Equation (
14) with respect to
c yields
completing the proof. ☐
Now, we consider the welfare of consumers. Using Equations (2), (3), (7), and (12), we can calculate at any
the equilibrium consumer surplus as
Because is independent of the realization of , the expected consumer surplus is equal to .
Corollary 2. The expected consumer surplus is always decreasing in c.
Proof. Because
, we differentiate Equation (
18) with respect to
c to obtain
completing the proof. ☐
The effects of the parameters and on the expected consumer surplus, , are more involved. As we show below, is decreasing (increasing) in and if and only if the value of c, the marginal cost of producing a unit output, is sufficiently small (large).
Corollary 3. The expected consumer surplus is decreasing in β if and only if and is decreasing in γ if and only if .
Proof. Because
, we differentiate Equation (
18) with respect to
to obtain
Clearly,
if and only if
. Now, differentiating Equation (
18) with respect to
, we obtain
Thus, if and only if . ☐
The above corollary implies that the expected consumer surplus is decreasing in if and only if the duopolistic products are substitutes, that is, .
3.2. Supply Function Competition
Here, firms are assumed to simultaneously specify supply functions without observing the realization of the demand shock . The supply function of each firm maps a nonnegative price for its product into a nonnegative quantity of output.
Proposition 2. (Klemperer and Meyer (1989) [2]). In the studied duopolistic industry with differentiated products and demand uncertainty, there exists a unique and symmetric Nash equilibrium in supply functions whereby each firm chooses the supply function given bywhere Proof. For the case of
(or equivalently
), the proof is available in pages 1267–1269 of Klemperer and Meyer (1989) [
2]. This proof is also valid for the case of
(or equivalently
). ☐
We note that given the equilibrium supply functions in Equations (22) and (23) and given any realization of the demand shock
, we can calculate the market clearing price
using the market clearing condition in any market
, that is,
, implying
=
a +
, and further implying
Then, given Equation (
24), it follows from Equation (
22) that under the supply function competition, each firm must produce the equilibrium quantity
Using Equations (24) and (25), the equilibrium profits of each firm can be calculated as
Hence, the expected equilibrium profits of each firm become
On the other hand, using Equations (2), (3), (24), and (25), we can calculate at any
the equilibrium consumer surplus as
and the expected equilibrium consumer surplus as
We observe that under the supply function competition, both the expected producer profits and the expected consumer surplus depend on
. This term can be expressed as
where
We note that
, called the coefficient of variation, is a unitless measure of the size of the demand uncertainty. Keeping
fixed, we observe that the larger the coefficient
, or equivalently
, the greater the expected producer profits in Equation (
27) and the expected consumer surplus in Equation (
29). That is, the size of the demand uncertainty positively affects the expected welfares of both producers and consumers under the supply function competition.
Now, we investigate the welfare effects of the parameter
c measuring the marginal cost of producing a unit output. For this, we have to first find how the slope of the equilibrium supply functions is affected by
c. We note that using
and
, Equation (23) can be rewritten as
Studying Equation (
32), we observe the following.
Lemma 1. The slope of the equilibrium supply function, ξ, is always decreasing in c.
Proof. We note that Equation (
32) implies
Then, we can compute
which is always positive, implying that
is always increasing in
c. Therefore,
is always decreasing in
c. ☐
Using Lemma 1, we can also show that under the supply function competition, the marginal cost of a unit output always has a negative impact on both the expected producer profits and the expected consumer surplus.
Corollary 4. and are always decreasing in c.
Proof. Differentiating Equation (
27) with respect to
c yields
Lemma 1 implies that
. On the other hand, differentiating Equation (
29) yields
Now, Lemma 1 implies that . ☐
As we were not successful in analytically studying the dependence of
and
on
and
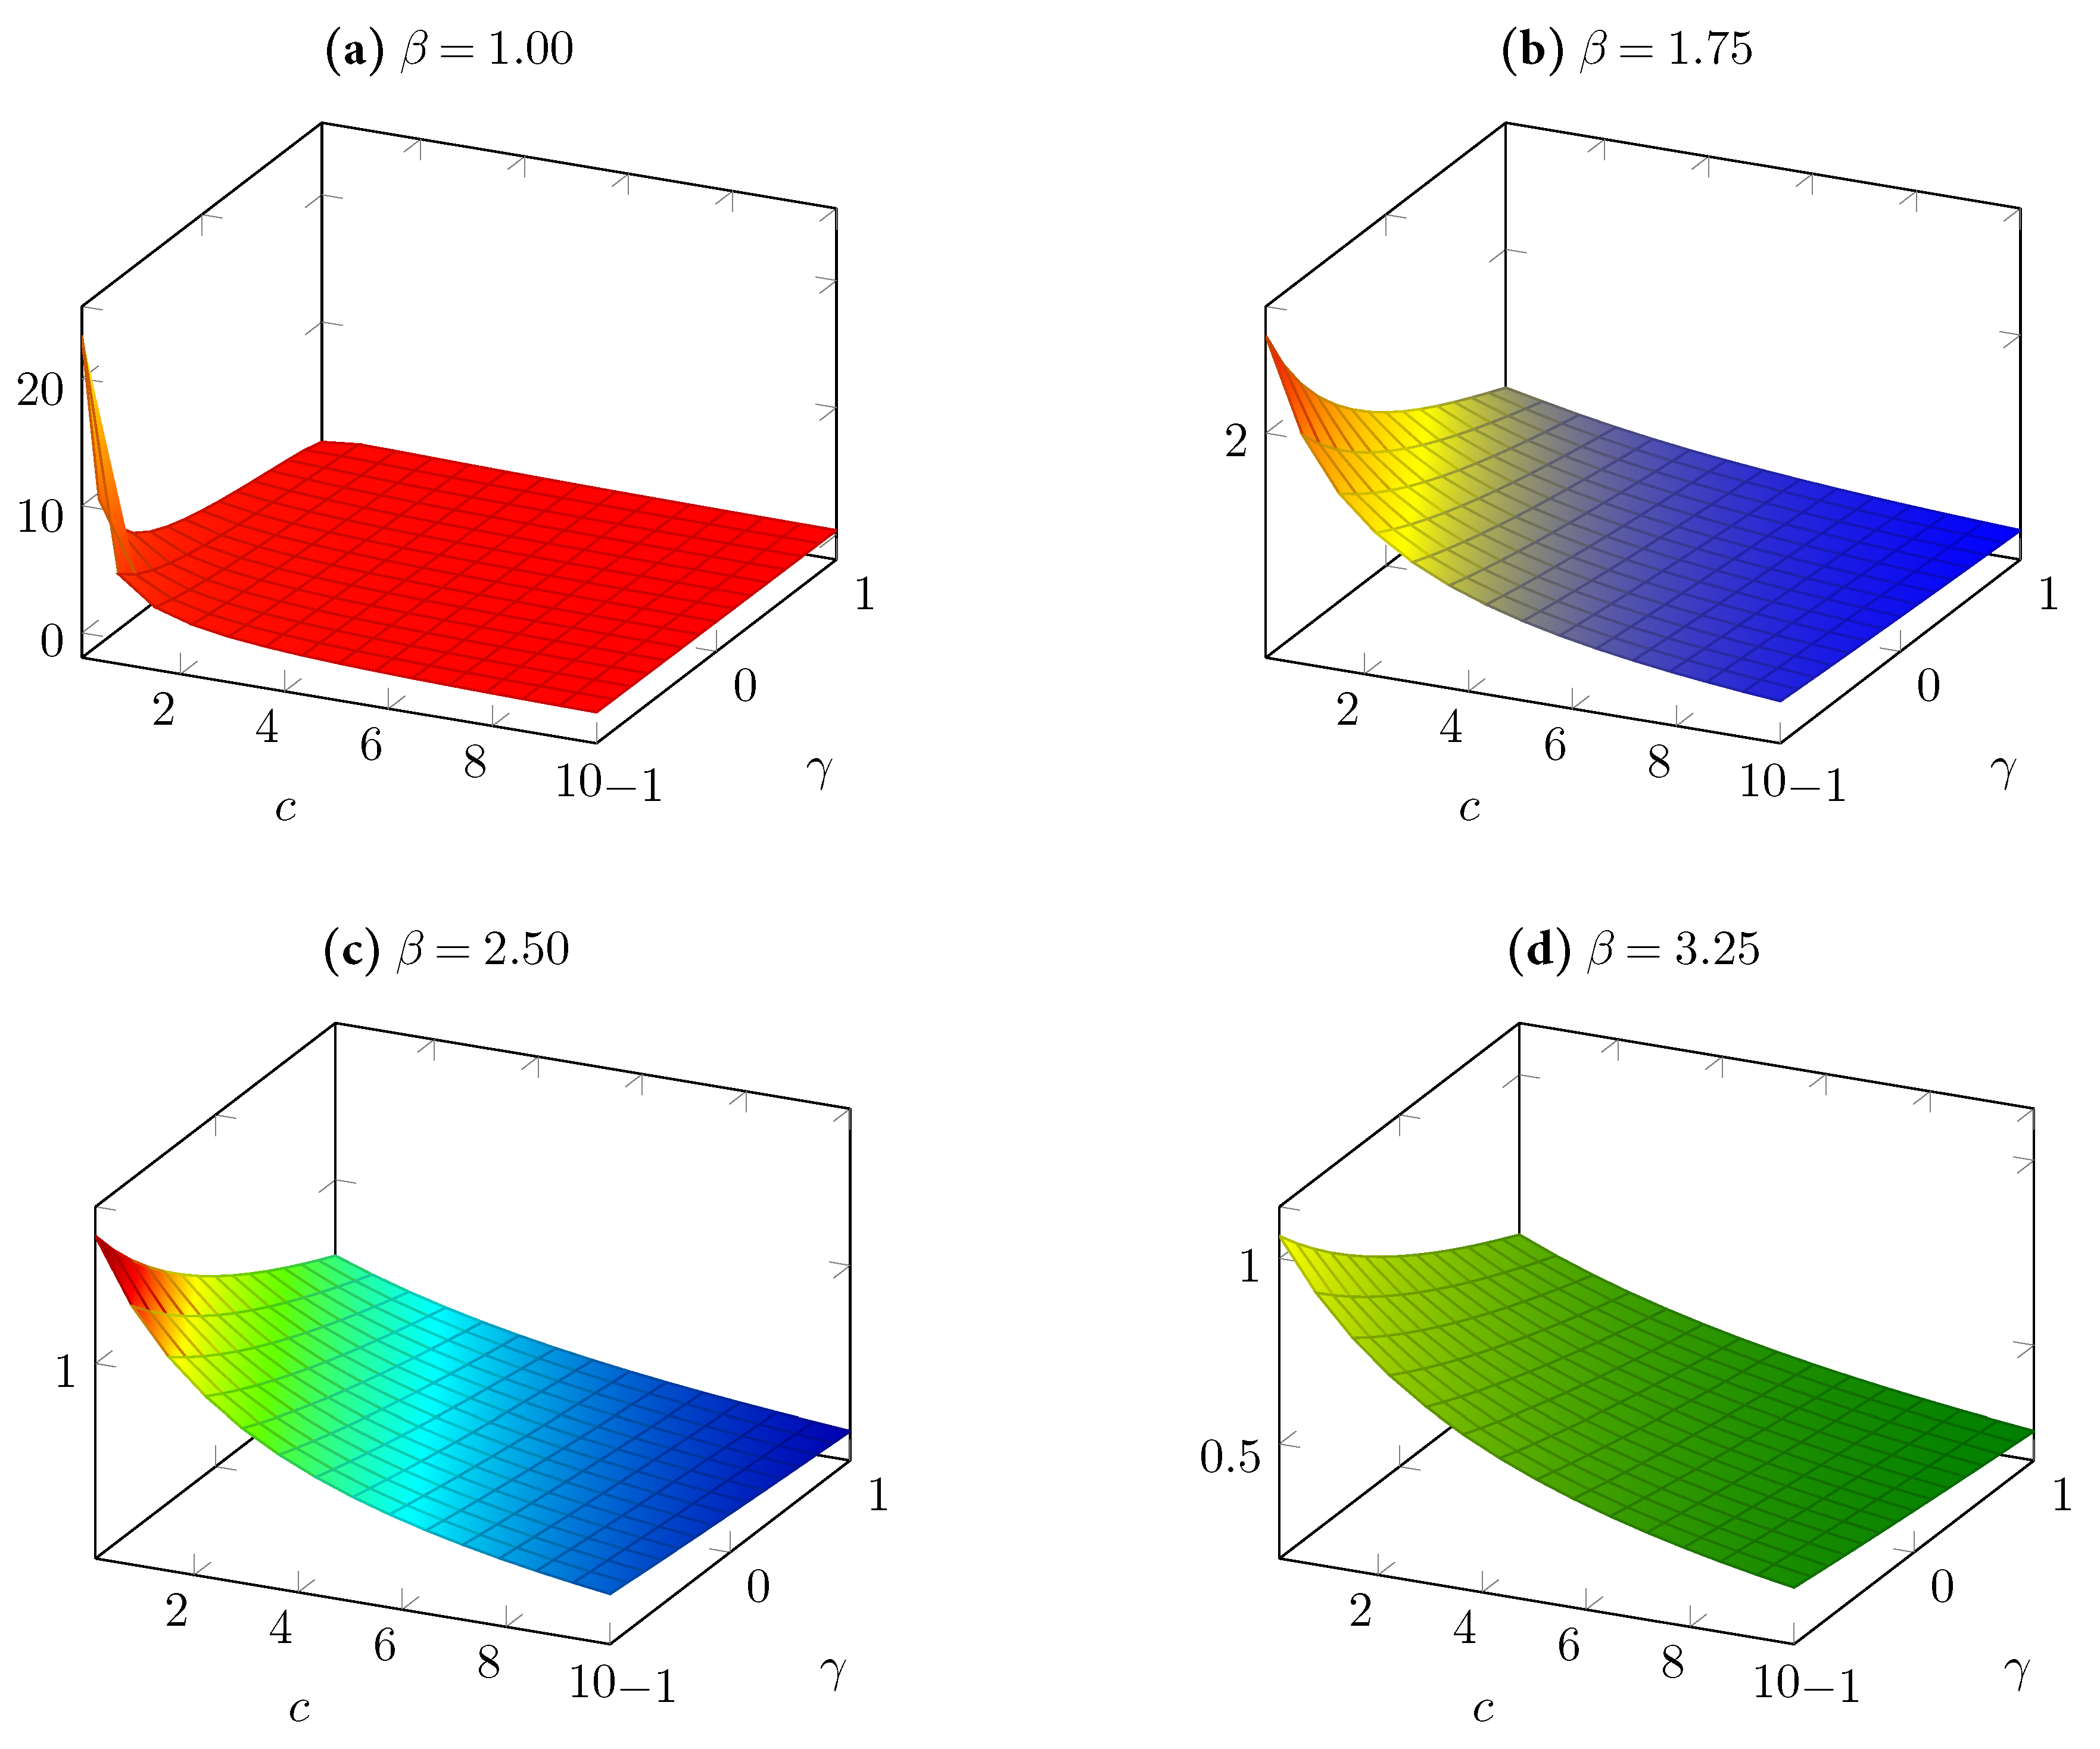
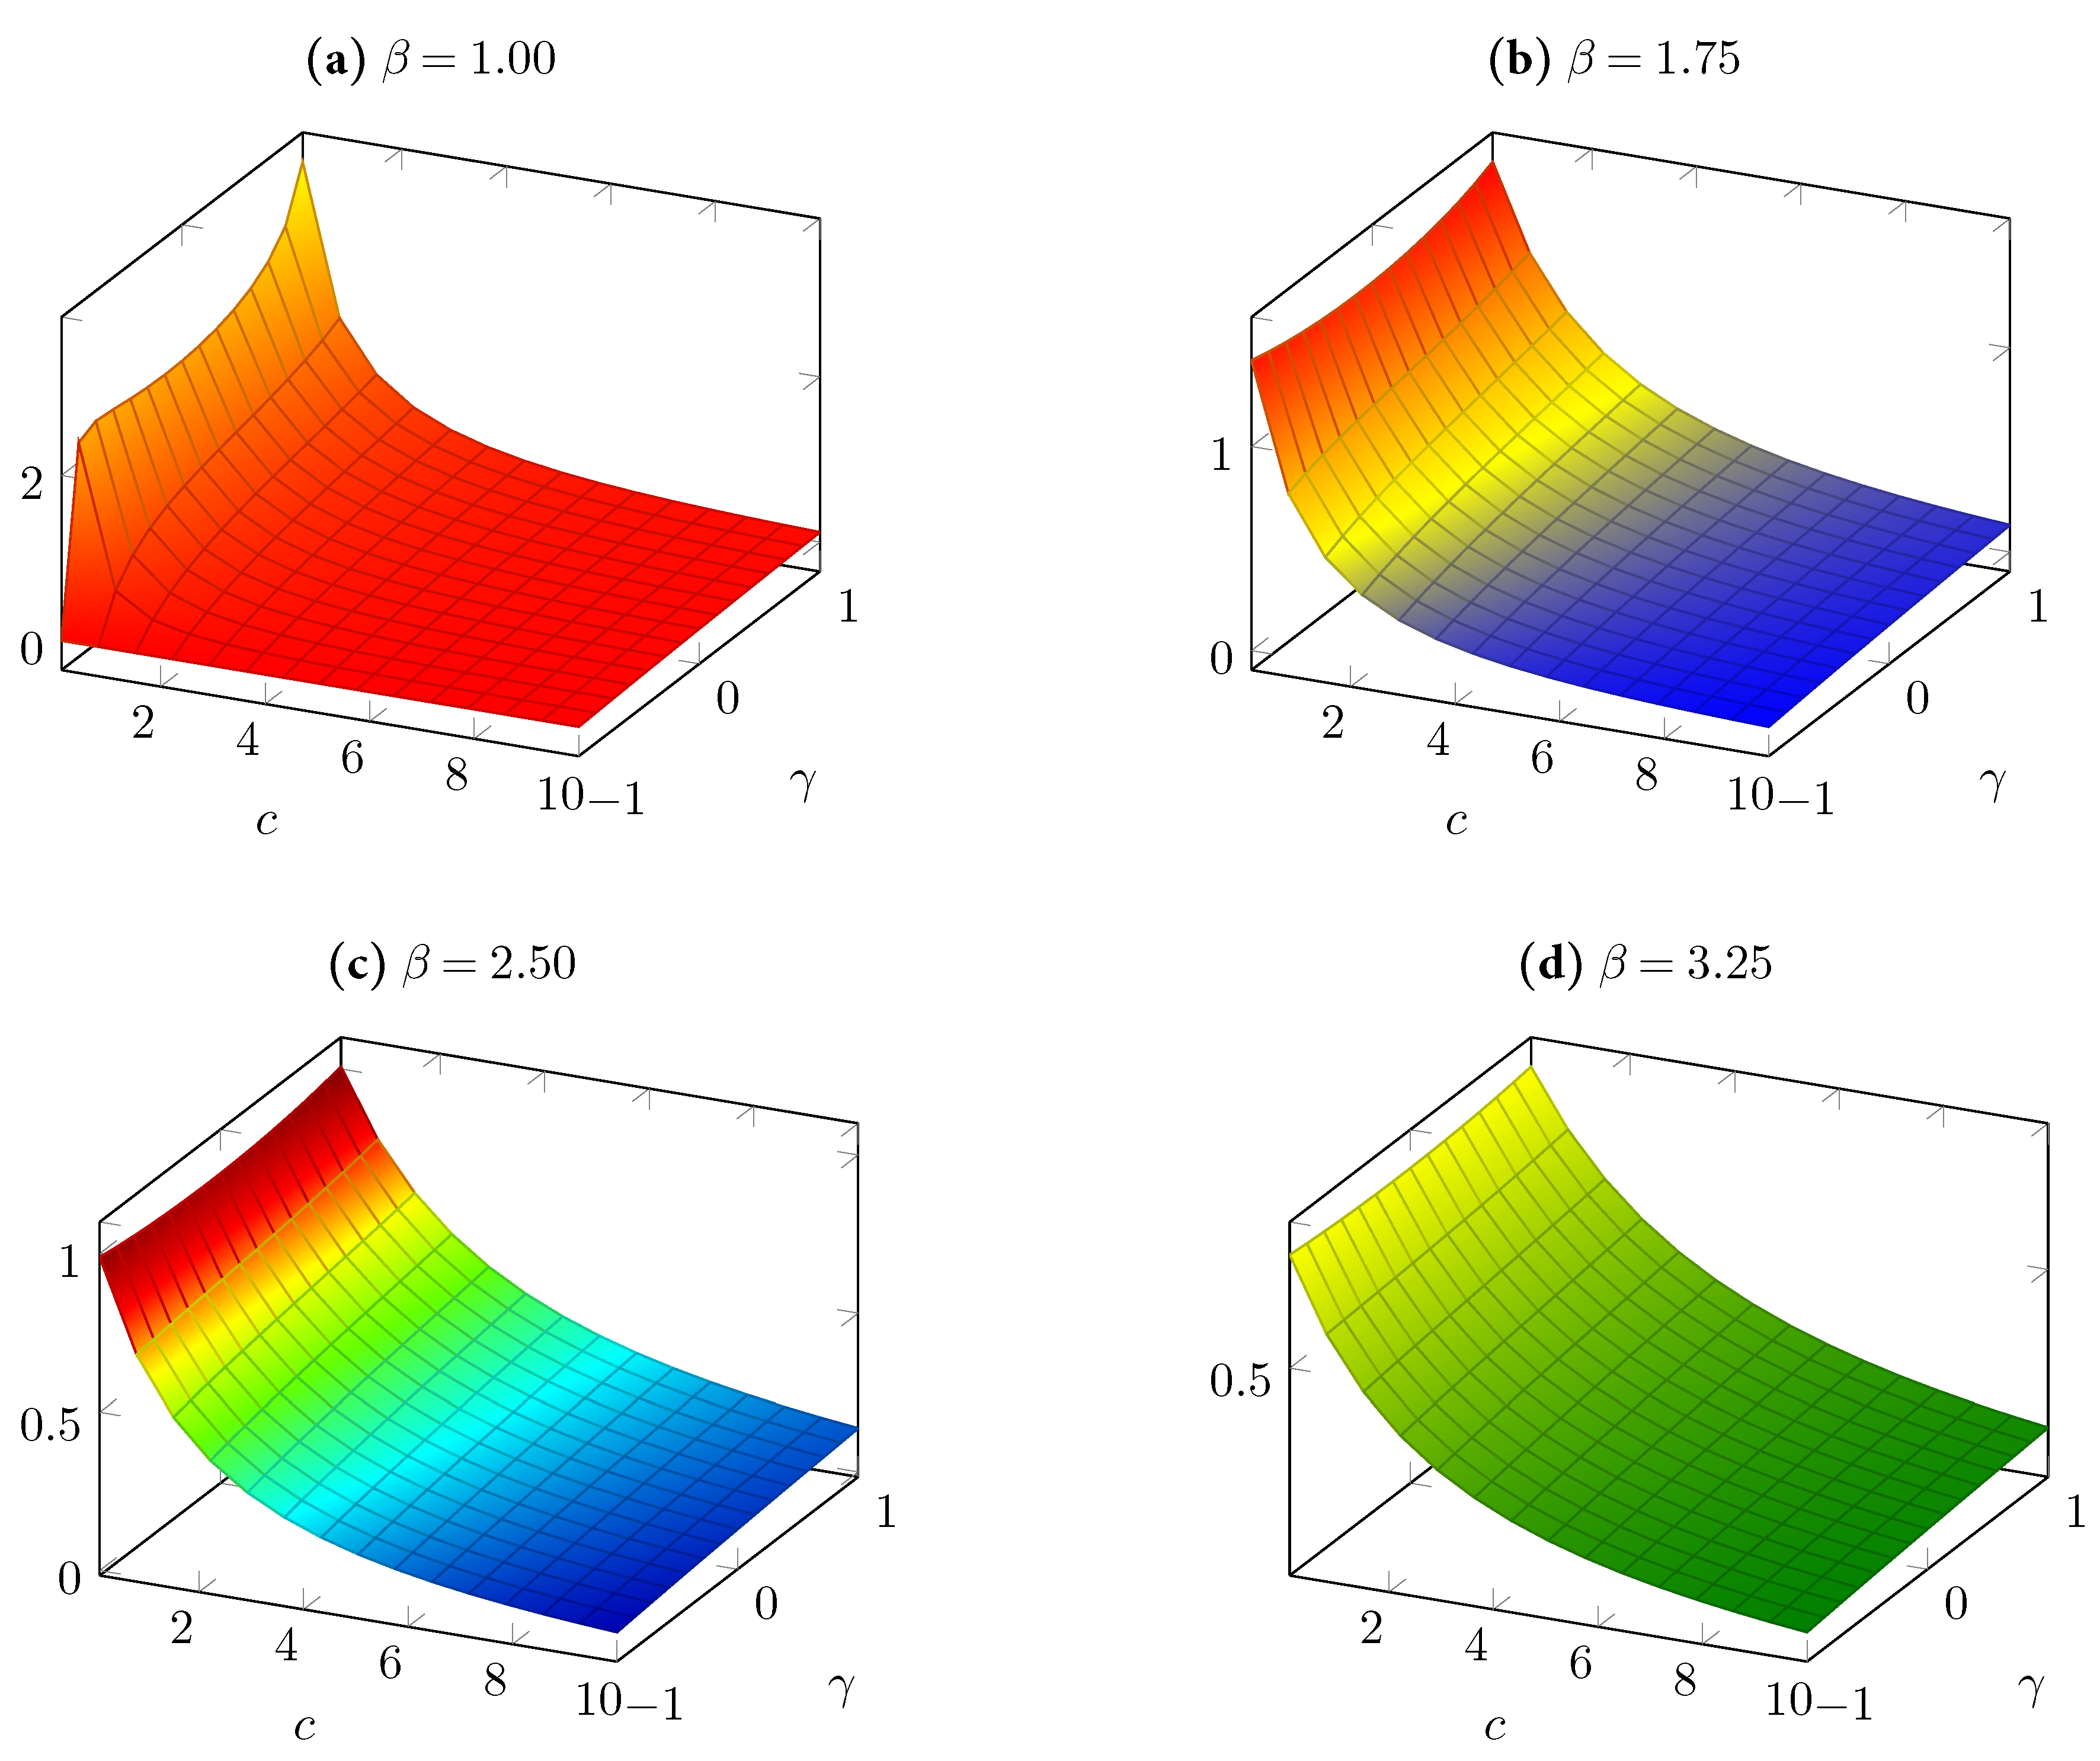
in their defined domains, we tried to infer these dependencies with the help of some numerical simulations, which we illustrate in
Figure 1 and
Figure 2. We note that the four graphs in each figure correspond to the four values of
in the set
. In each of these graphs, we considered 15 sample points for
c between 0.1 and 10.00 and 15 sample points for
between −1.00 and 1.00.
Figure 1 and
Figure 2 show that keeping all other parameters constant, the greater the value of the parameter
, the smaller the expected producer profits and the expected consumer surplus.
3 Moreover, we found that the cost parameter
c had a negative impact on the welfares of both producers and consumers, as theoretically predicted by Corollary 4. On the other hand, the parameter
had asymmetric effects. Fixing all other parameters to be constant,
measured the degree of product differentiation, and an increase in
was found to suggest, especially at low values of
c, a decrease in the expected producer profits (as shown in
Figure 1) and an increase the expected consumer surplus (as shown in
Figure 2).
Figure 1 and
Figure 2 together suggest that the parameter
negatively affects the welfare difference
. We could further investigate whether, for any range of
, the difference between the expected industry welfare and consumer welfare could always become positive or negative, if we kept the other parameters fixed. Here, we note that Equations (27) and (29) together imply that
if and only if
In general, whether the above inequality holds or not depends, in a nontrivial way, on the relative size of
with respect to the other parameters in the model. However, for two extreme cases, we can easily make some predictions. One of these cases occurs when
is arbitrarily close to
, that is, the products are (almost) perfect complements; the other case occurs when
is arbitrarily close to
, that is, the products are (almost) perfect substitutes. First we note that when
is (arbitrarily) close to
, the variable
in Equation (
33) becomes close to
. Using these values, Equation (
37) can be reduced to
We know that the above inequality is always true. This implies that if the degree of product complementarity is sufficiently high, the expected total welfare of the duopolists can become always higher than the expected welfare of the consumers. Now, we consider the opposite case in which
is (arbitrarily) close to
. Then, the variable
becomes close to
, as in the previous case. With these values, Equation (
37) can now be reduced to
which can be shown to be satisfied if and only if
. Thus, we can conclude that when the degree of product substitution is sufficiently high, the expected total welfare of the duopolists can become higher than the expected welfare of the consumers if and only if the marginal cost of a unit output is sufficiently high.
3.3. Welfare Ranking
Now, we investigate whether the supply function competition or the quantity competition can always yield a higher expected welfare to the duopolists or the consumers in the studied industry.
Proposition 3. In the studied duopolistic industry with differentiated products and demand uncertainty, the expected consumer surplus under the supply function competition is always higher than under the quantity competition.
Proof. Comparing Equations (18) and (29) using Equations (30) and (31), we observe that
if and only if
We know that
(as there is demand uncertainty by assumption). First, we assume the limiting case of
. Then Equation (
40) would be equivalent to
, which, from the definition of
in Equation (
32), is equivalent to
. We have
by assumption, implying Equation (
40) when
. Moreover, because the left-hand side of Equation (
40) is increasing in
while its right-hand side is independent of it, Equation (
40) must hold for all
. Thus, it is always true that
. ☐
Now, we can consider a welfare comparison from the viewpoint of the producers. First we note that using Equations (30) and (31), the expected producer profits in Equation (
27) can be rewritten as
If
remains unchanged, the demand uncertainty, measured by
, positively affects the expected profits in Equation (
41) obtained by each duopolist under the supply function competition, while it has no effect on the expected profits in Equation (
14) that each duopolist obtains under the quantity competition. Thus, the profit difference
is increasing in
when
is constant. We let
be the lowest value of demand uncertainty at which this profit difference is nonnegative, that is,
. This value can be calculated using Equations (14) and (41) as follows:
We note that the coefficient of variation is always nonnegative, and when it is above (below) the critical level , the expected producer profits under the supply function competition are higher (lower) than those under the quantity competition.
Now, we investigate how the critical level of demand uncertainty,
, is affected by a change in any of the parameters
,
, or
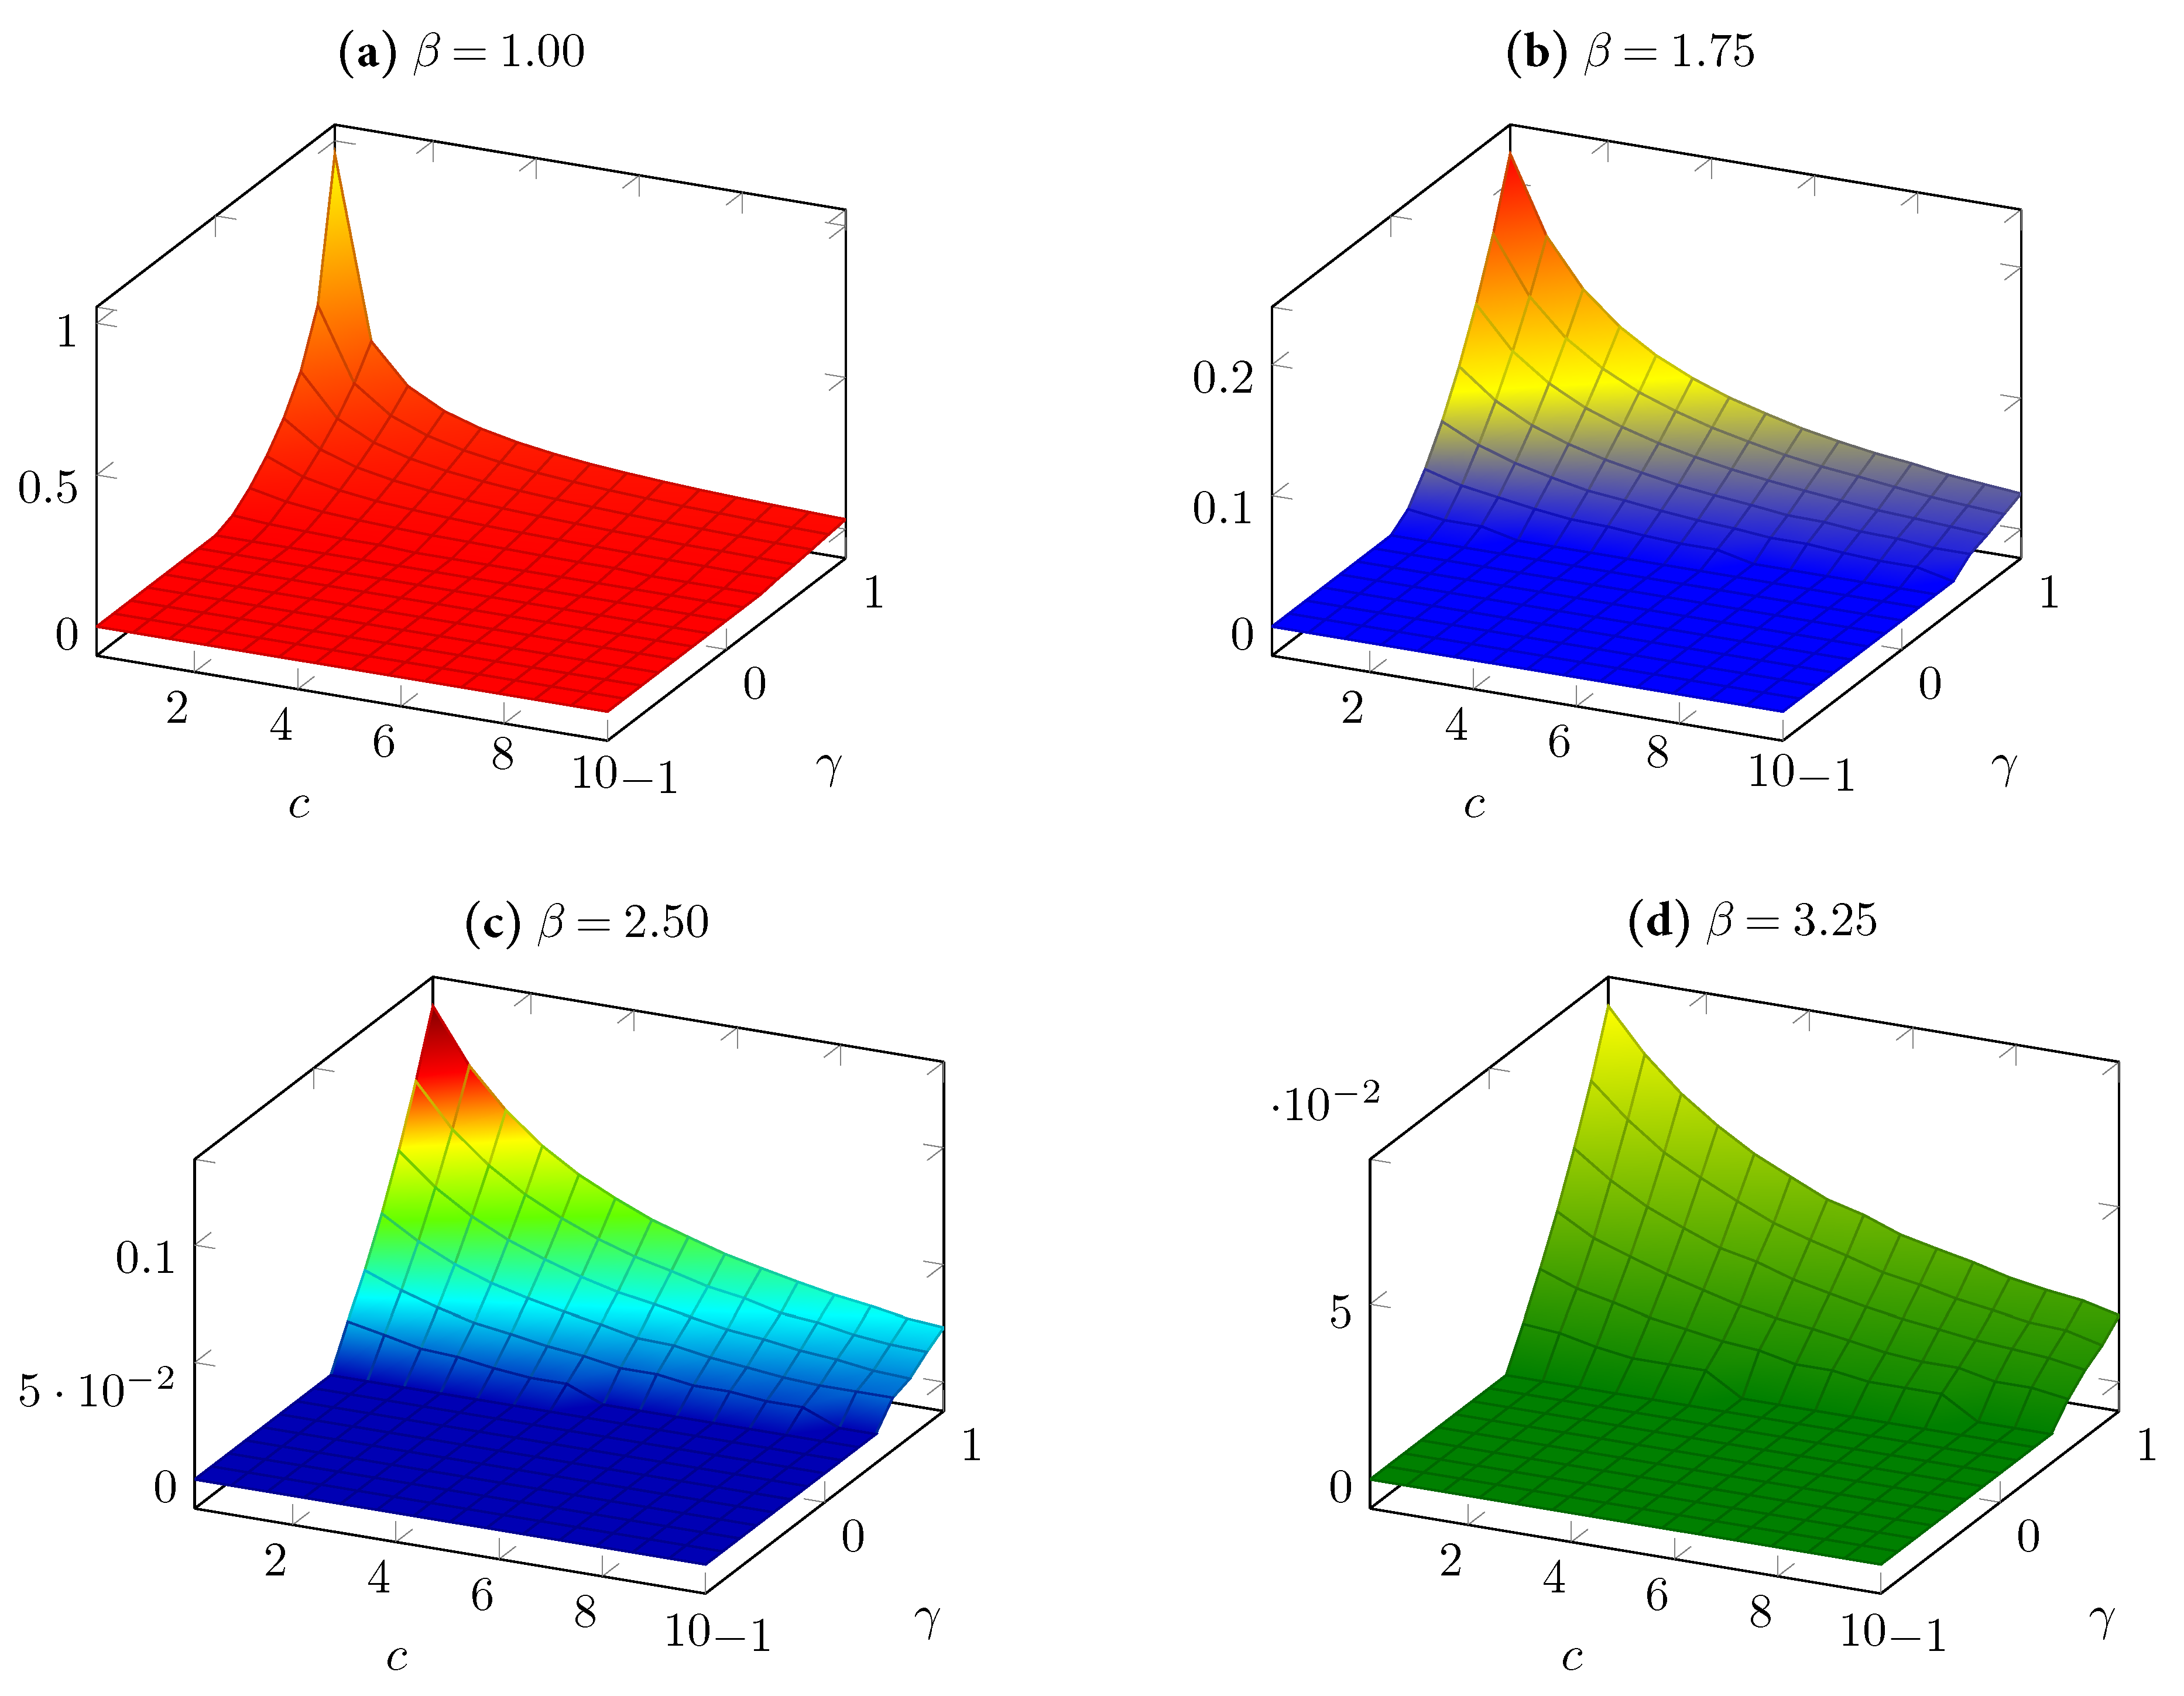
c. However, because of the complexity of Equations (32) and (42), we were able to do this only by numerical simulations. We plot in
Figure 3 the simulated graphs of
. (The ranges of
,
, and
c are as in the previous two figures). Comparing all four graphs in
Figure 3 reveals that for extremely low values of
, the value of
becomes almost zero, implying that at such values of
, the expected producer profits are almost always higher under the supply function competition than under the quantity competition.
Figure 3 also suggests that
is always positive, implying that for sufficiently low values of demand uncertainty, duopolistic firms prefer the quantity competition to the supply function competition. Another finding from
Figure 3 is that an increase in
decreases
at all values
c in its domain when
is not negative (when the products are neither complements nor independent) and is also not low (when the product substitution is high). This implies that if, for each product, the demand becomes smaller as a result of an increase in its own-price sensitivity, then the supply function competition would require a lower amount of uncertainty to dominate the quantity competition from the viewpoint of the duopolists. A similar result is also observed when the marginal cost of producing a unit output,
c, becomes higher. On the other hand, the differentiation parameter
, when it is positive and sufficiently high, has a positive effect on
. That is, as the products in the industry become closer substitutes, then the supply function competition would, in general, require a higher amount of uncertainty to dominate the quantity competition from the viewpoint of the duopolists.


