Experimental Study for Determining the Parameters Required for Detecting ECG and EEG Related Diseases during the Timed-Up and Go Test

 ,
,  ,
,  ,
,  ,
, 
Abstract
1. Introduction
1.1. Background
1.2. Motivation
1.3. Prior Work
1.4. Purpose of the Study
1.5. Structure of the Study
2. Methods
2.1. Study Design and Participants
2.2. Description of the Timed-Up and Go Test and Data Acquisition and Processing
2.3. Statistical Analysis
3. Results
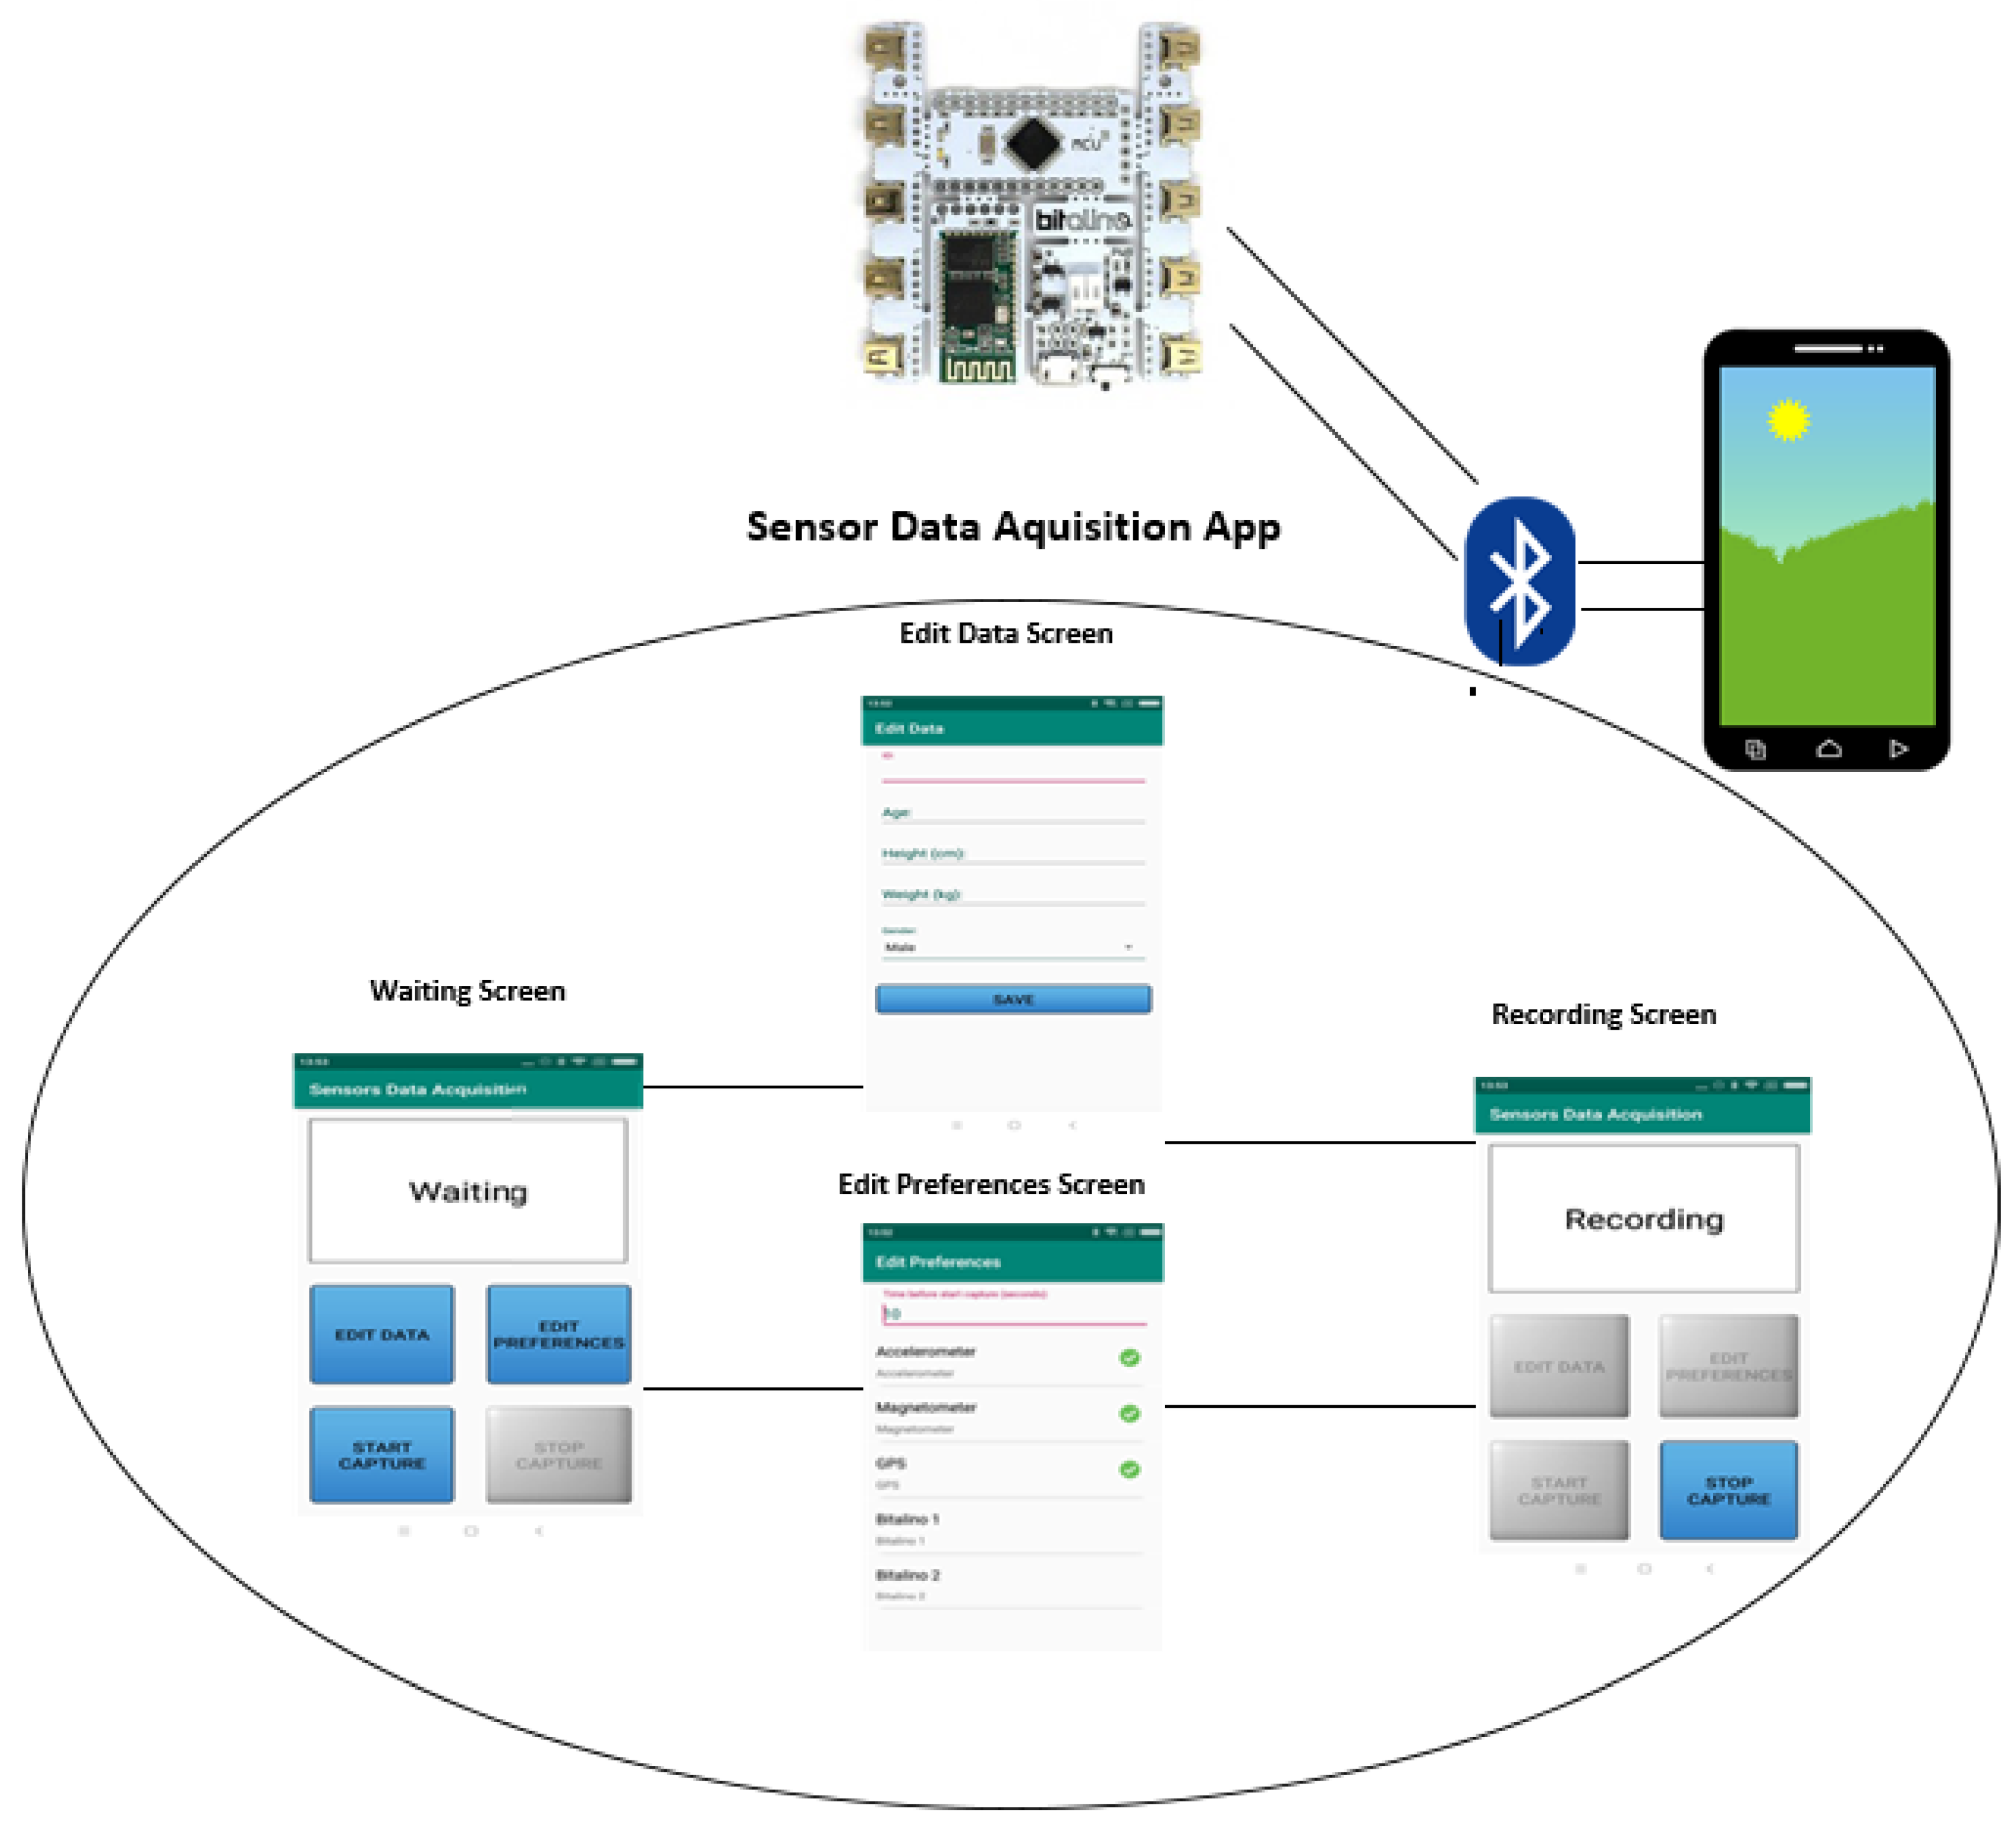
3.1. Data Acquisition
3.2. Requirements
3.3. Validation
- ECG sensor: Heart Rate; Linear Heart Rate Variability; Average of QRS interval; Average of R-R interval; Average of R-S interval.
- EEG sensor: Frequency; Variability.
3.3.1. Results by Age
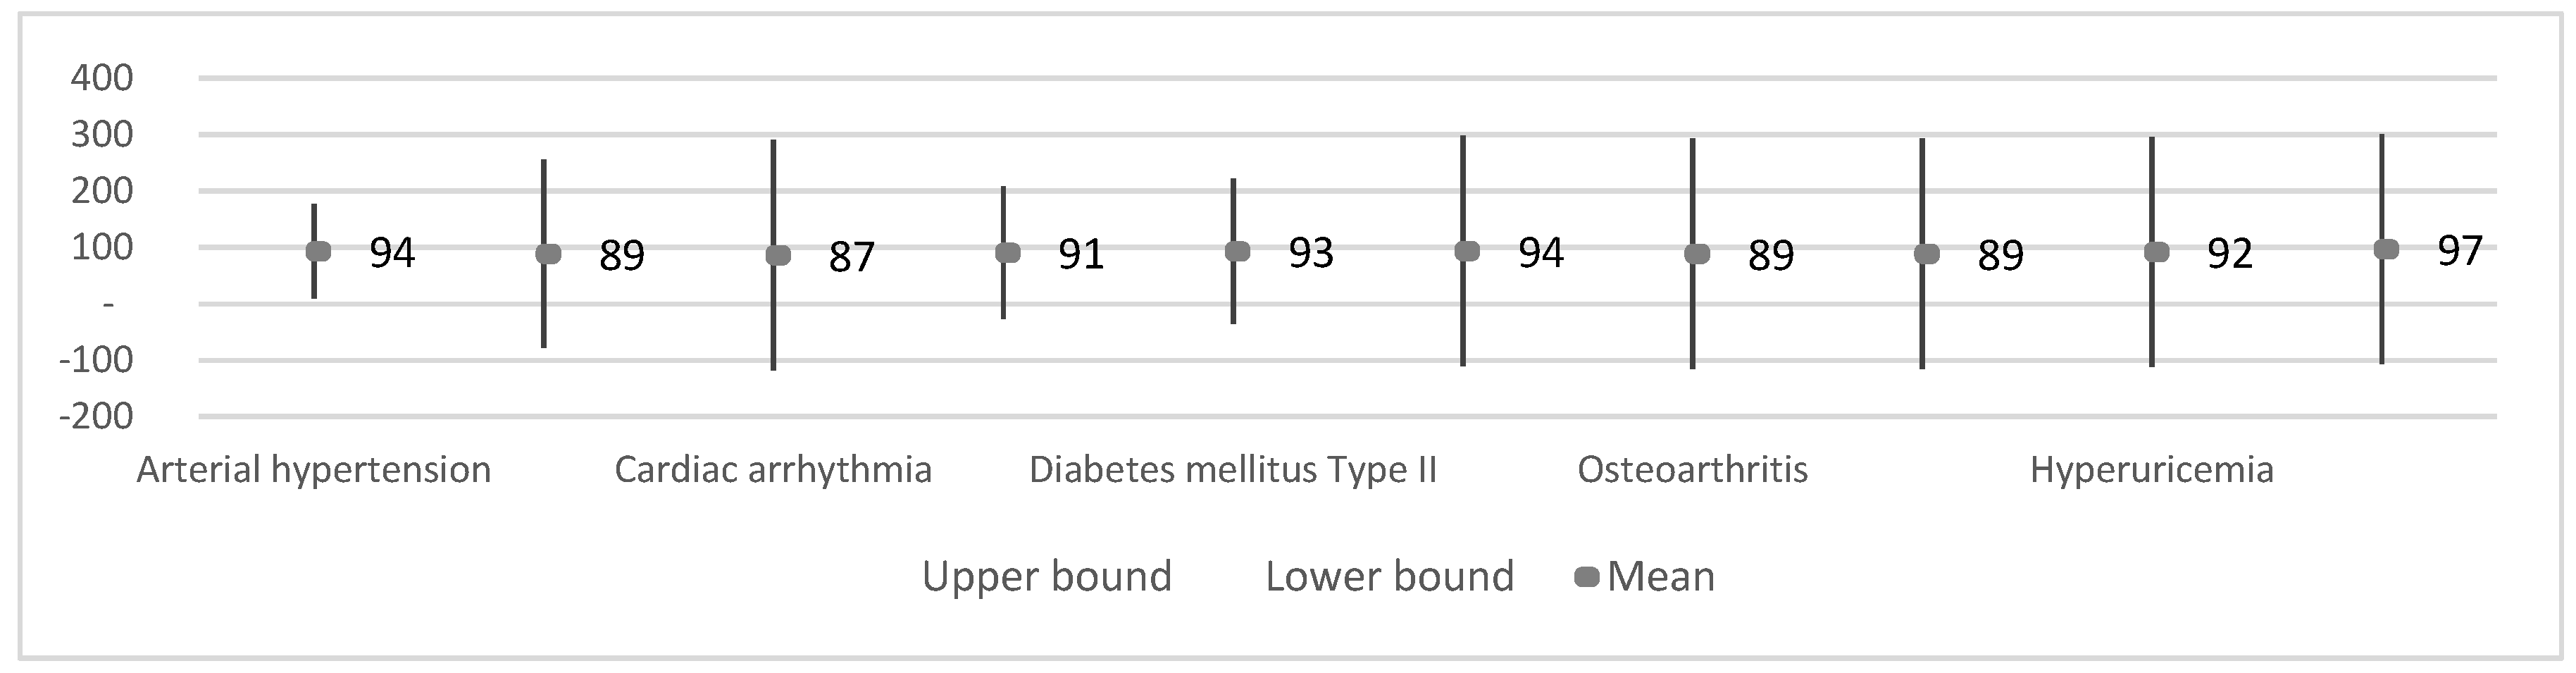
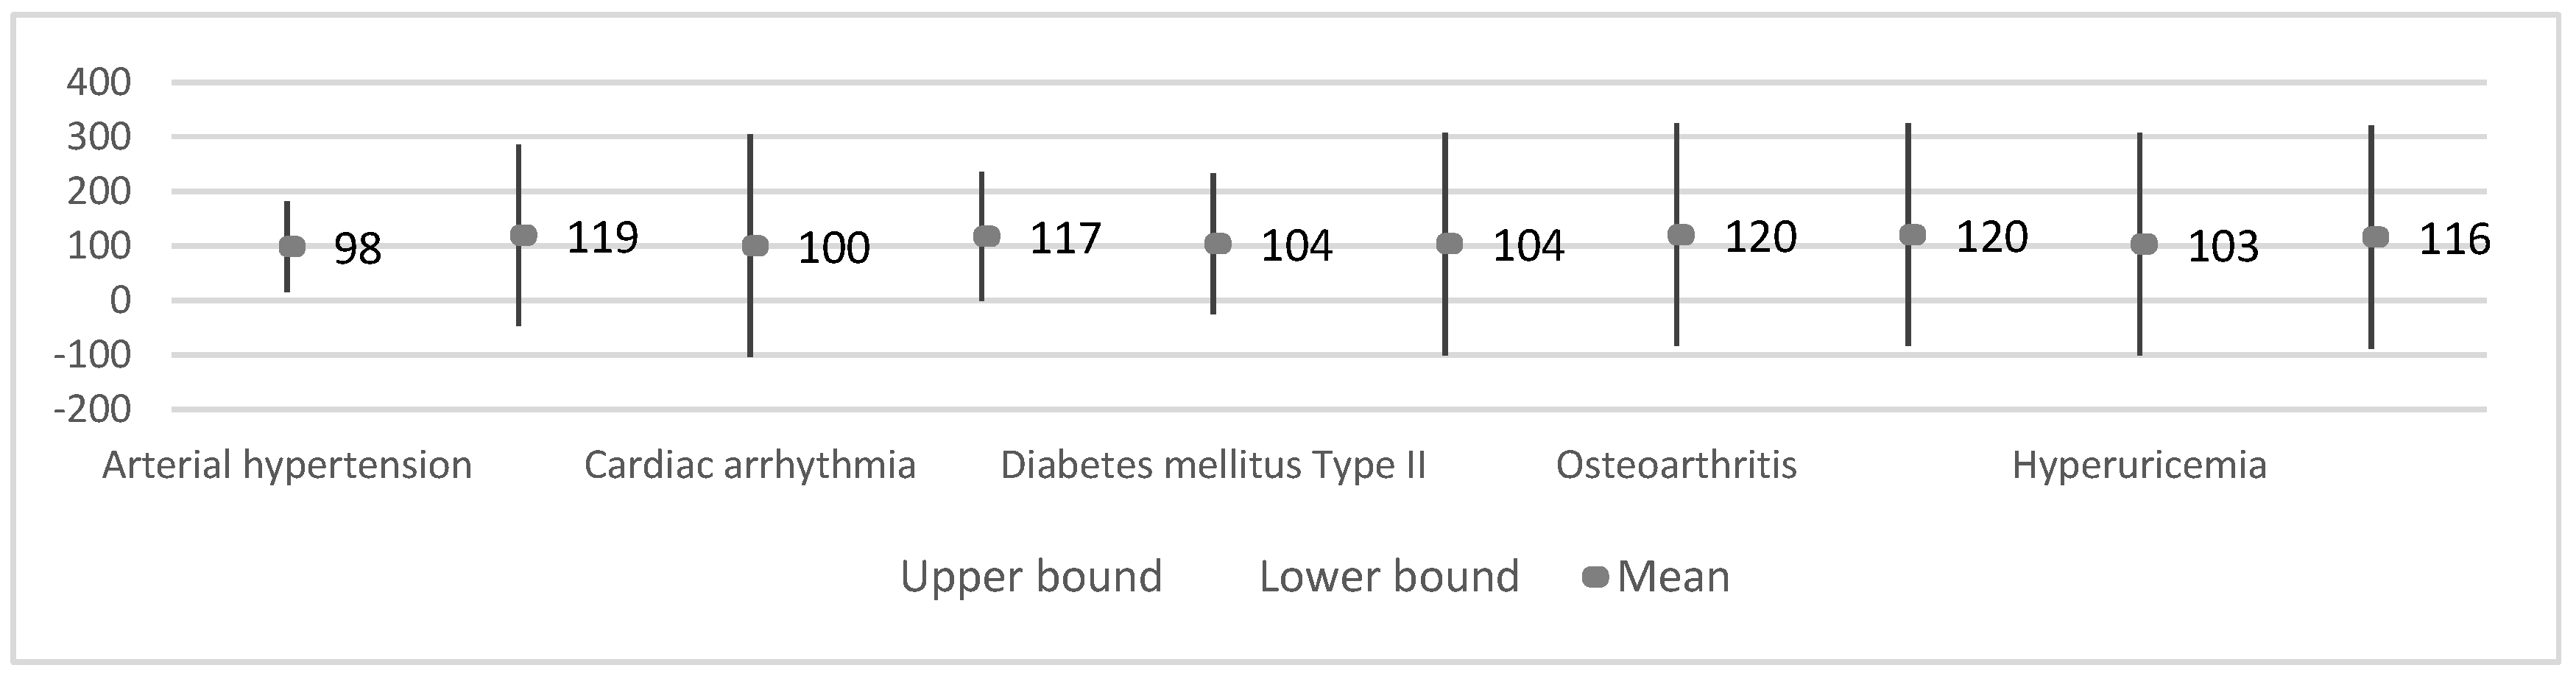
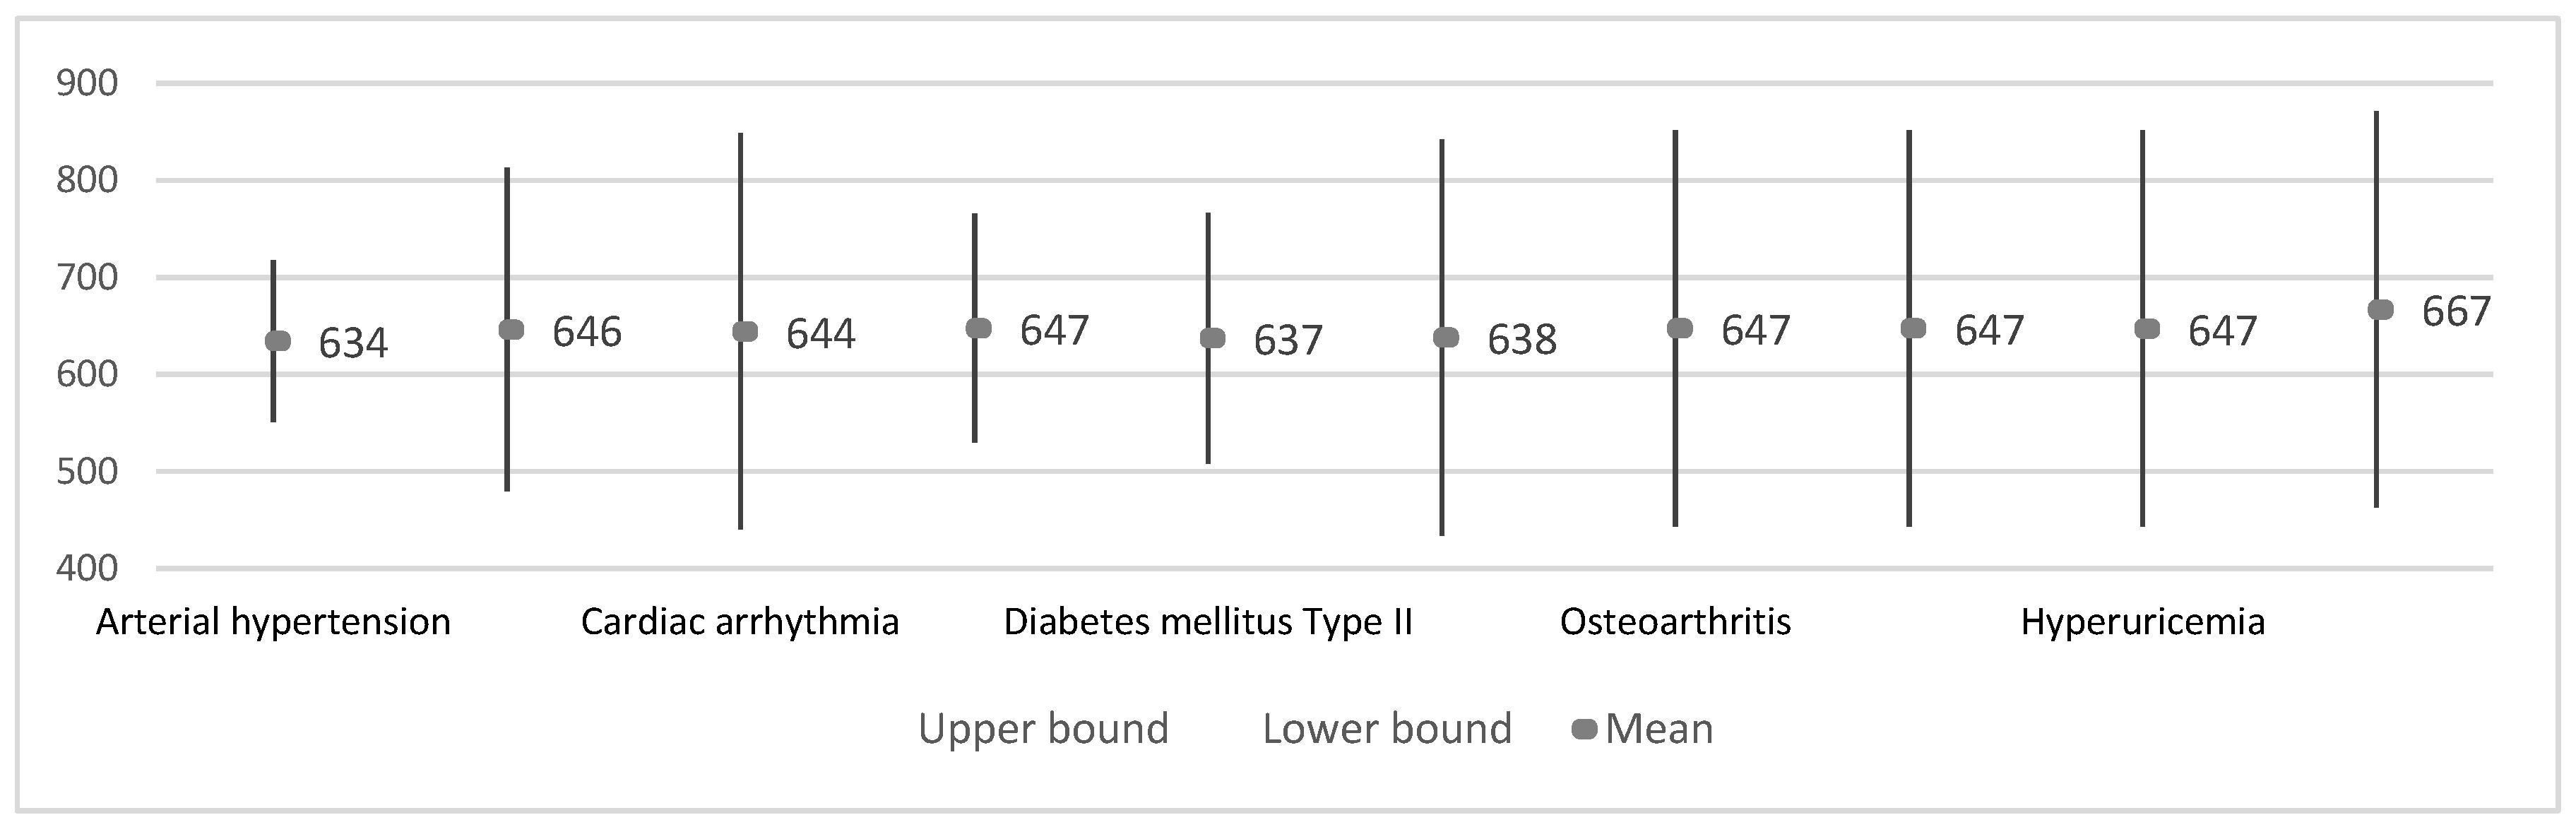
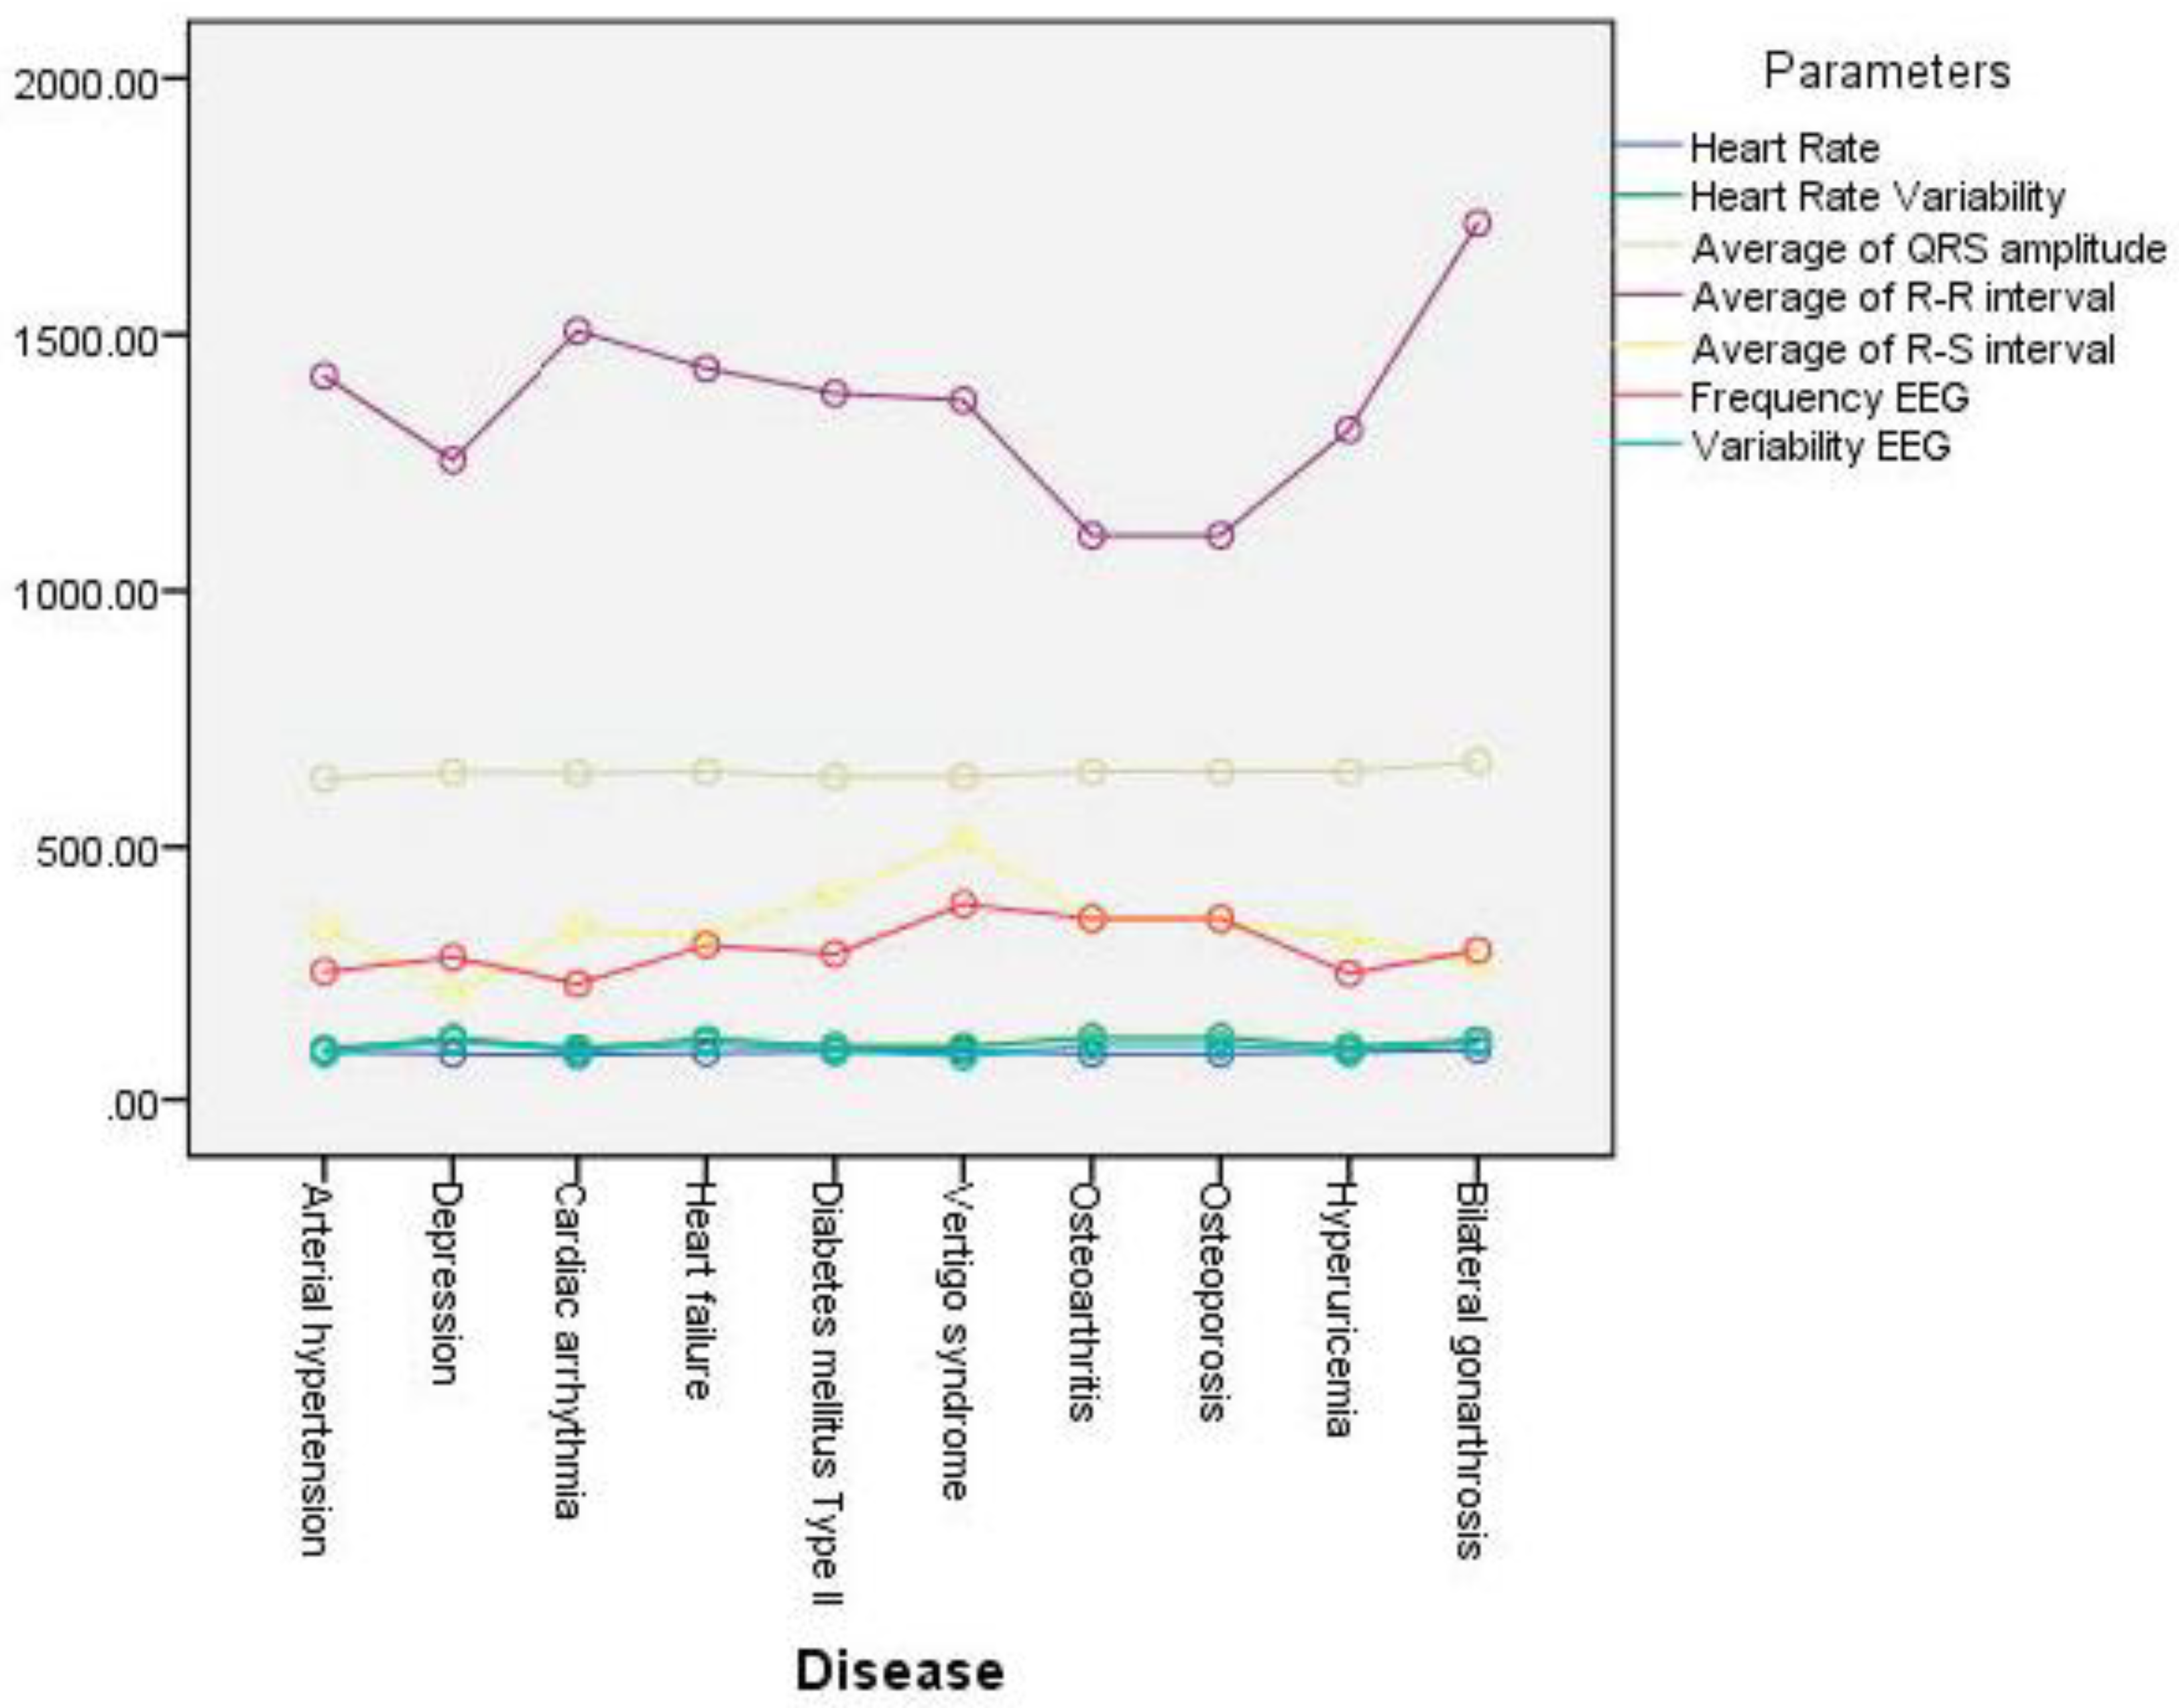
3.3.2. Results by Disease
4. Discussion
4.1. Main Findings
4.2. Limitations
4.3. Comparison with Prior Work
5. Conclusions
Author Contributions
Funding
Acknowledgments
Conflicts of Interest
References
- Pires, I.M.; Andrade, M.; Garcia, N.M.; Crisóstomo, R.; Florez-Revuelta, F. Measurement of heel-rise test results using a mobile device. In Proceedings of the Doctoral Consortium—DCPhyCS, (PhyCS 2015), Angers, France, 11–13 February 2015; pp. 9–18. [Google Scholar]
- World Health Organization. Ageing and Health. Available online: https://www.who.int/news-room/fact-sheets/detail/ageing-and-health (accessed on 27 December 2019).
- Blackman, S.; Matlo, C.; Bobrovitskiy, C.; Waldoch, A.; Fang, M.L.; Jackson, P.; Mihailidis, A.; Nygård, L.; Astell, A.; Sixsmith, A. Ambient assisted living technologies for aging well: A scoping review. J. Intell. Syst. 2015, 25, 55–69. [Google Scholar] [CrossRef]
- Lutz, W.; Sanderson, W.; Scherbov, S. The coming acceleration of global population ageing. Nature 2008, 451, 716–719. [Google Scholar] [CrossRef] [PubMed]
- Długosz, Z. Population ageing in Europe. Procedia Soc. Behav. Sci. 2011, 19, 47–55. [Google Scholar] [CrossRef]
- Wu, F.; Li, X.; Sangaiah, A.K.; Xu, L.; Kumari, S.; Wu, L.; Shen, J. A lightweight and robust two-factor authentication scheme for personalized healthcare systems using wireless medical sensor networks. Future Gener. Comput. Syst. 2018, 82, 727–737. [Google Scholar] [CrossRef]
- Jagadeeswari, V.; Subramaniyaswamy, V.; Logesh, R.; Vijayakumar, V. A study on medical Internet of Things and Big Data in personalized healthcare system. Health Inf. Sci. Syst. 2018, 6, 14. [Google Scholar] [CrossRef]
- Piper, A.M.; Garcia, R.C.; Brewer, R.N. Understanding the challenges and opportunities of smart mobile devices among the oldest old. Int. J. Mob. Hum. Comput. Interact. 2016, 8, 83–98. [Google Scholar] [CrossRef]
- Kim, S.; Gajos, K.Z.; Muller, M.; Grosz, B.J. Acceptance of mobile technology by older adults: A preliminary study. In Proceedings of the 18th International Conference on Human-Computer Interaction with Mobile Devices and Services, Florence, Italy, 6–9 September 2016; pp. 147–157. [Google Scholar]
- Christensen, L.; Vøllestad, N.K.; Veierød, M.B.; Stuge, B.; Cabri, J.; Robinson, H.S. The Timed Up & Go test in pregnant women with pelvic girdle pain compared to asymptomatic pregnant and non-pregnant women. Musculoskelet. Sci. Pract. 2019, 43, 110–116. [Google Scholar]
- Åhman, H.B.; Giedraitis, V.; Cedervall, Y.; Lennhed, B.; Berglund, L.; McKee, K.; Kilander, L.; Rosendahl, E.; Ingelsson, M.; Åberg, A.C. Dual-task performance and neurodegeneration: Correlations between timed up-and-go dual-task test outcomes and alzheimer’s disease cerebrospinal fluid biomarkers. JAD 2019, 71, S75–S83. [Google Scholar]
- Bustam, I.G.; Suriyaamarit, D.; Boonyong, S. Timed up and go test in typically developing children: Protocol choice influences the outcome. Gait Posture 2019, 73, 258–261. [Google Scholar] [CrossRef]
- Langeard, A.; Houdeib, R.; Saillant, K.; Kaushal, N.; Lussier, M.; Bherer, L. Switching ability mediates the age-related difference in timed up and go performance. JAD 2019, 71, S23–S28. [Google Scholar]
- Jakobsson, M.; Brisby, H.; Gutke, A.; Lundberg, M.; Smeets, R. One-minute stair climbing, 50-foot walk, and timed up-and-go were responsive measures for patients with chronic low back pain undergoing lumbar fusion surgery. BMC Musculoskelet. Disord. 2019, 20, 137. [Google Scholar] [CrossRef] [PubMed]
- Hatch, J.; Veneri, D. The effect of rolling walker use on interpretation of timed up and go test scores: A preliminary study. Int. J. Rehabil. Res. 2020, 43, 95–98. [Google Scholar] [CrossRef] [PubMed]
- Marques, G.; Pitarma, R.; Garcia, N.M.; Pombo, N. Internet of things architectures, technologies, applications, challenges, and future directions for enhanced living environments and healthcare systems: A review. Electronics 2019, 8, 1081. [Google Scholar] [CrossRef]
- Marques, G. Ambient assisted living and internet of things. In Harnessing the Internet of Everything (IoE) for Accelerated Innovation Opportunities; Cardoso, P.J.S., Monteiro, J., Semião, J., Rodrigues, J.M.F., Eds.; IGI Global: Hershey, PA, USA, 2019; pp. 100–115. ISBN 9781522573326. [Google Scholar]
- Majumder, S.; Deen, M.J. Smartphone sensors for health monitoring and diagnosis. Sensors 2019, 19, 2164. [Google Scholar] [CrossRef]
- Pires, I.M.; Teixeira, M.C.; Pombo, N.; Garcia, N.M.; Flórez-Revuelta, F.; Spinsante, S.; Goleva, R.; Zdravevski, E. Android library for recognition of activities of daily living: Implementation considerations, challenges, and solutions. Open Bioinform. J. 2018, 11, 61–88. [Google Scholar] [CrossRef]
- Kakria, P.; Tripathi, N.K.; Kitipawang, P. A real-time health monitoring system for remote cardiac patients using smartphone and wearable sensors. Int. J. Telemed. Appl. 2015, 2015, 1–11. [Google Scholar] [CrossRef]
- Higgins, J.P. Smartphone applications for patients’ health and fitness. Am. J. Med. 2016, 129, 11–19. [Google Scholar] [CrossRef]
- Ben-Zeev, D.; Scherer, E.A.; Wang, R.; Xie, H.; Campbell, A.T. Next-generation psychiatric assessment: Using smartphone sensors to monitor behavior and mental health. Psychiatr. Rehabil. J. 2015, 38, 218–226. [Google Scholar] [CrossRef]
- Gautschi, O.P.; Stienen, M.N.; Corniola, M.V.; Joswig, H.; Schaller, K.; Hildebrandt, G.; Smoll, N.R. Assessment of the minimum clinically important difference in the timed up and go test after surgery for lumbar degenerative disc disease. Neurosurgery 2017, 80, 380–385. [Google Scholar] [CrossRef]
- Whitney, J.C.; Lord, S.R.; Close, J.C.T. Streamlining assessment and intervention in a falls clinic using the timed up and go test and physiological profile assessments. Age Ageing 2005, 34, 567–571. [Google Scholar] [CrossRef]
- Haghi, M.; Thurow, K.; Stoll, R. Wearable devices in medical internet of things: Scientific research and commercially available devices. Healthc. Inform. Res. 2017, 23, 4. [Google Scholar] [CrossRef] [PubMed]
- Andrews, R.G. Mobile Sensor Data Measurements and Analysis for Fall Detection in Elderly Health Care. Available online: https://pdfs.semanticscholar.org/0c71/1db20d7a1449a4dda7e0f4a27b10d8fe9801.pdf (accessed on 20 June 2020).
- Guo, J.; Zhou, X.; Sun, Y.; Ping, G.; Zhao, G.; Li, Z. Smartphone-based patients’ activity recognition by using a self-learning scheme for medical monitoring. J. Med. Syst. 2016, 40, 140. [Google Scholar] [CrossRef]
- Dziak, D.; Jachimczyk, B.; Kulesza, W. IoT-based information system for healthcare application: Design methodology approach. Appl. Sci. 2017, 7, 596. [Google Scholar] [CrossRef]
- Mellone, S.; Tacconi, C.; Schwickert, L.; Klenk, J.; Becker, C.; Chiari, L. Smartphone-based solutions for fall detection and prevention: The FARSEEING approach. Z. Gerontol. Geriatr. 2012, 45, 722–727. [Google Scholar] [CrossRef] [PubMed]
- Herman, T.; Giladi, N.; Hausdorff, J.M. Properties of the ‘timed up and go’ test: More than meets the eye. Gerontology 2011, 57, 203–210. [Google Scholar] [CrossRef] [PubMed]
- Kotagal, V.; Albin, R.L.; Muller, M.L.T.M.; Koeppe, R.A.; Studenski, S.; Frey, K.A.; Bohnen, N.I. Advanced age, cardiovascular risk burden, and timed up and go test performance in parkinson disease. J. Gerontol. Ser. A Biol. Sci. Med. Sci. 2014, 69, 1569–1575. [Google Scholar] [CrossRef]
- Montes, J.; Cheng, B.; Diamond, B.; Doorish, C.; Mitsumoto, H.; Gordon, P.H. The timed up and go test: Predicting falls in ALS. Amyotroph. Lateral Scler. 2007, 8, 292–295. [Google Scholar] [CrossRef]
- Joshua, A.M.; Karnad, S.D.; Nayak, A.; Suresh, B.V.; Mithra, P.; Unnikrishnan, B. Effect of foot placements during sit to stand transition on timed up and go test in stroke subjects: A cross sectional study. NRE 2017, 40, 355–362. [Google Scholar] [CrossRef]
- Givens, D.L.; Eskildsen, S.; Taylor, K.E.; Faldowski, R.A.; Del Gaizo, D.J. Timed up and go test is predictive of patient-reported outcomes measurement information System physical function in patients awaiting total knee arthroplasty. Arthroplast. Today 2018, 4, 505–509. [Google Scholar] [CrossRef]
- Son, K.Y.; Shin, D.W.; Lee, J.E.; Kim, S.H.; Yun, J.M.; Cho, B. Association of timed up and go test outcomes with future incidence of cardiovascular disease and mortality in adults aged 66 years: Korean national representative longitudinal study over 5.7 years. BMC Geriatr. 2020, 20, 111. [Google Scholar] [CrossRef]
- Batista, D.; Silva, H.; Fred, A. Experimental characterization and analysis of the BITalino platforms against a reference device. In Proceedings of the 2017 39th Annual International Conference of the IEEE Engineering in Medicine and Biology Society (EMBC), JeJu, Korea, 11–15 July 2017; IEEE: Piscataway, NJ, USA, 2017; pp. 2418–2421. [Google Scholar]
- Ponciano, V.; Pires, I.M.; Ribeiro, F.R.; Garcia, N.M.; Pombo, N.; Spinsante, S.; Crisóstomo, R. Smartphone-based automatic measurement of the results of the timed-up and go test. In Proceedings of the 5th EAI International Conference on Smart Objects and Technologies for Social Good, Valencia, Spain, 25–27 September 2019; pp. 239–242. [Google Scholar]
- Ponciano, V.; Pires, I.M.; Ribeiro, F.R.; Garcia, N.M.; Pombo, N. Non-invasive measurement of results of timed-up and go test: Preliminary results. In Proceedings of the Ageing Congress 2019, Coimbra, Portugal, 25–28 May 2019. [Google Scholar]
- Williams, B.; Allen, B.; True, H.; Fell, N.; Levine, D.; Sartipi, M. A real-time, mobile timed up and go system. In Proceedings of the 2015 IEEE 12th International Conference on Wearable and Implantable Body Sensor Networks (BSN), Cambridge, MA, USA, 9–12 June 2015; pp. 1–6. [Google Scholar]
- Pires, I.M.; Garcia, N.M.; Pombo, N.; Flórez-Revuelta, F. Limitations of the use of mobile devices and smart environments for the monitoring of ageing people. In Proceedings of the 4th International Conference on Information and Communication Technologies for Ageing Well and e-Health, Funchal, Madeira, Portugal, 22–23 March 2018; pp. 269–275. [Google Scholar]
- Pires, I.; Felizardo, V.; Pombo, N.; Garcia, N.M. Limitations of energy expenditure calculation based on a mobile phone accelerometer. In Proceedings of the 2017 International Conference on High Performance Computing & Simulation (HPCS), Genoa, Italy, 17–21 July 2017; pp. 124–127. [Google Scholar]
- McGough, E.L.; Kelly, V.E.; Logsdon, R.G.; McCurry, S.M.; Cochrane, B.B.; Engel, J.M.; Teri, L. Associations between physical performance and executive function in older adults with mild cognitive impairment: Gait speed and the timed “up & go” test. Phys. Ther. 2011, 91, 1198–1207. [Google Scholar] [PubMed]
- Kwan, M.M.-S.; Lin, S.-I.; Chen, C.-H.; Close, J.C.T.; Lord, S.R. Sensorimotor function, balance abilities and pain influence Timed Up and Go performance in older community-living people. Aging Clin. Exp. Res. 2011, 23, 196–201. [Google Scholar] [CrossRef] [PubMed]
- Hui, E.; Chui, B.T.; Woo, J. Effects of dance on physical and psychological well-being in older persons. Arch. Gerontol. Geriatr. 2009, 49, e45–e50. [Google Scholar] [CrossRef] [PubMed]
- Patel, A.M.; Gakare, P.K.; Cheeran, A.N. Real time ECG feature extraction and arrhythmia detection on a mobile platform. Int. J. Comput. Appl. 2012, 44, 40–45. [Google Scholar]
- Yıldırım, Ö.; Pławiak, P.; Tan, R.S.; Acharya, U.R. Arrhythmia detection using deep convolutional neural network with long duration ECG signals. Comput. Biol. Med. 2018, 102, 411–420. [Google Scholar] [CrossRef]
- Deo, R.; Shou, H.; Soliman, E.Z.; Yang, W.; Arkin, J.M.; Zhang, X.; Townsend, R.R.; Go, A.S.; Shlipak, M.G.; Feldman, H.I. Electrocardiographic measures and prediction of cardiovascular and noncardiovascular death in CKD. J. Am. Soc. Nephrol. 2016, 27, 559–569. [Google Scholar] [CrossRef]
- Ahearn, G.S.; Tapson, V.F.; Rebeiz, A.; Greenfield, J.C. Electrocardiography to define clinical status in primary pulmonary hypertension and pulmonary arterial hypertension secondary to collagen vascular disease. Chest 2002, 122, 524–527. [Google Scholar] [CrossRef]
- Couceiro, R.; Carvalho, P.; Henriques, J.; Antunes, M.; Harris, M.; Habetha, J. Detection of atrial fibrillation using model-based ECG analysis. In Proceedings of the 2008 19th International Conference on Pattern Recognition, Tampa, FL, USA, 8–11 December 2008. [Google Scholar]
- Subramanian, B. ECG signal classification and parameter estimation using multiwavelet transform. Biomed. Res. 2017, 28, 3187–3193. [Google Scholar]
- Rassi, A.N.; Aljaroudi, W.; Naderi, S.; Alraies, M.C.; Menon, V.; Rodriguez, L.; Grimm, R.; Griffin, B.; Jaber, W.A. Exercise stress echocardiography in patients with aortic stenosis: Impact of baseline diastolic dysfunction and functional capacity on mortality and aortic valve replacement. Cardiovasc. Diagn. 2013, 3, 205–215. [Google Scholar]
- Ponciano, V.; Pires, I.M.; Ribeiro, F.R.; Villasana, M.V.; Garcia, N.M.; Leithardt, V. Detection of diseases based on Electrocardiography and Electroencephalography signals embedded in different devices: An exploratory study. BJD 2020, 6, 27212–27231. [Google Scholar] [CrossRef]
- Gautam, M.K.; Giri, V.K. A neural network approach and wavelet analysis for ECG classification. In Proceedings of the 2016 IEEE International Conference on Engineering and Technology (ICETECH), Coimbatore, India, 17–18 March 2016; pp. 1136–1141. [Google Scholar]
- Mochizuki, H.; Ishii, N.; Shiomi, K.; Nakazato, M. Clinical features and electrocardiogram parameters in Parkinson’s disease. Neurol. Int. 2017, 9, 82–83. [Google Scholar] [CrossRef]
- Saxena, S.C.; Kumar, V.; Hamde, S.T. Feature extraction from ECG signals using wavelet transforms for disease diagnostics. Int. J. Syst. Sci. 2002, 33, 1073–1085. [Google Scholar] [CrossRef]
- Lehmann, C.; Koenig, T.; Jelic, V.; Prichep, L.; John, R.E.; Wahlund, L.O.; Dodge, Y.; Dierks, T. Application and comparison of classification algorithms for recognition of Alzheimer’s disease in electrical brain activity (EEG). J. Neurosci. Methods 2007, 161, 342–350. [Google Scholar] [CrossRef] [PubMed]
- Kalaivani, M.; Kalaivani, V.; Devi, V.A. Analysis of EEG signal for the detection of brain abnormalities. Int. J. Comput. Appl. 2014, 1, 1–6. [Google Scholar]
- Acharya, U.R.; Sree, S.V.; Suri, J.S. Automatic detection of epileptic eeg signals using higher order cumulant features. Int. J. Neural Syst. 2011, 21, 403–414. [Google Scholar] [CrossRef] [PubMed]
- Khan, Y.U. Automatic detection of seizure ONSET in pediatric EEG. Int. J. Embed. Syst. Appl. 2012, 2, 81–89. [Google Scholar] [CrossRef]
- Kannathal, N.; Choo, M.L.; Acharya, U.R.; Sadasivan, P.K. Entropies for detection of epilepsy in EEG. Comput. Methods Programs Biomed. 2005, 80, 187–194. [Google Scholar] [CrossRef] [PubMed]
- Shantha, S.K.R.; Prabin, J.J. Seizure detection in EEG using time frequency analysis and SVM. In Proceedings of the 2011 International Conference on Emerging Trends in Electrical and Computer Technology, ICETECT 2011, Nagercoil, India, 23–24 March 2011; pp. 626–630. [Google Scholar]
- Woon, W.L.; Cichocki, A.; Vialatte, F.; Musha, T. Techniques for early detection of Alzheimer’s disease using spontaneous EEG recordings. Physiol. Meas. 2007, 28, 335–347. [Google Scholar] [CrossRef]
- Wijaya, S.K.; Badri, C.; Misbach, J.; Soemardi, T.P.; Sutanno, V. Electroencephalography (EEG) for detecting acute ischemic stroke. In Proceedings of the 2015 4th International Conference on Instrumentation, Communications, Information Technology and Biomedical Engineering, Bandung, Indonesia, 2–3 November 2015; pp. 36–41. [Google Scholar]
- Tejeda, R.G.; Falcón, M.C. Optimization of algorithms for real-time ECG beats classification. In World Congress on Medical Physics and Biomedical Engineering 2018; Lhotska, L., Sukupova, L., Lacković, I., Ibbott, G.S., Eds.; Springer: Singapore, 2019; Volume 68/2, pp. 335–338. ISBN 9789811090370. [Google Scholar]
- Herold, G. HEROLD’s Internal Medicine, 2nd ed.; Lulu.com: Morrisville, NC, USA; ISBN 9781291727340.
- Hui, D. Approach to Internal Medicine: A Resource Book for Clinical Practice; Springer Science & Business Media: Berlin, Germany, 2011; ISBN 9781441965059. [Google Scholar]
- Ayoka, A.; Ogunlade, O.; Akintomide, A.; Akomolafe, R. Normal limits of electrocardiogram and cut-off values for left ventricular hypertrophy in young adult nigerians. Niger. J. Physiol. Sci. 2014, 29, 63–66. [Google Scholar]
- Normal Electrocardiography (ECG) Intervals: Normal Electrocardiography Intervals. Available online: https://emedicine.medscape.com/article/2172196-overview (accessed on 10 August 2020).
- Rautaharju, P.M.; Surawicz, B.; Gettes, L.S. AHA/ACCF/HRS recommendations for the standardization and interpretation of the electrocardiogram: Part IV: The ST segment, T and U waves, and the QT interval: A scientific statement from the american heart association electrocardiography and arrhythmias committee, council on clinical cardiology; the american college of cardiology foundation; and the heart rhythm society: Endorsed by the international society for computerized electrocardiology. Circulation 2009, 119, e241–e250. [Google Scholar]


| Diseases | Studies | Number of Studies |
|---|---|---|
| ECG | ||
| Arrhythmia (i.e., atrial fibrillation, supraventricular tachyarrhythmia, pre-excitation, ventricular tachycardia, idioventricular rhythm, left and right branch block, and Wolff–Parkinson–White syndrome) | [46,49,50,53] | 4 |
| Premature ventricular contraction | [45,46,53] | 3 |
| Primary and secondary pulmonary hypertension; coronary artery disease; myocardial ischemia; myocardial injury; Parkinson’s disease; left and right ventricular hypertrophies | [48,51,53,54,55] | 1 |
| EEG | ||
| Epilepsy | [58,59,60,61] | 4 |
| Alzheimer’s disease | [56,62] | 2 |
| Brain abnormalities; acute ischemic stroke. | [63] | 1 |
| Person ID | Diseases | Age (Years Old) | Test Conditions | |||
|---|---|---|---|---|---|---|
| Chair with Supports | Good Mobile Network Coverage | Physical Conditions | Monitored by Physical Therapist | |||
| 1 | Arterial hypertension; Arthrosis | 85 | No | Yes | Good | Yes |
| 2 | Arterial hypertension; Cardiac arrhythmia; Arteriosclerotic coronary disease; Heart failure | 84 | Yes | No | Good | Yes |
| 3 | Right leg amputation; Umbilical hernia; Arterial hypertension | 88 | Yes | No | With Slope | No |
| 4 | Prostate Cancer; Parkinson’s disease; Post-traumatic stress | 76 | Yes | No | With Slope | No |
| 5 | Arterial hypertension; Diabetes mellitus Type II | 86 | Yes | No | With Slope | No |
| 6 | Heart failure; Diabetes mellitus Type II; Arterial hypertension; Depression; Sequelae of surgery to brain injury | 83 | Yes | No | With Slope | No |
| 7 | Heart failure; Diabetes mellitus Type II; Vertigo syndrome; Chronic headaches; Osteoarthritis; Prosthesis in the right humeral; Osteoporosis; Arterial hypertension | 81 | Yes | No | With Slope | No |
| 8 | Osteoarthritis; Depression; Heart failure; Arterial hypertension; Osteoporosis | 89 | Yes | No | With Slope | No |
| 9 | Dementia of vascular etiology; Prostate Cancer; Arterial hypertension; Vertigo syndrome | N/D | No | Yes | Narrow and tight | No |
| 10 | Diabetes mellitus Type II; Arterial hypertension; Heart failure; Hyperuricemia; Depression; Bilateral gonarthrosis | N/D | No | Yes | Narrow and tight | No |
| 11 | Heart failure; Chronic obstructive pulmonary disease; Bilateral gonarthrosis | 97 | No | Yes | Narrow and tight | No |
| 12 | Diabetes mellitus Type II; Arterial hypertension | 71 | No | Yes | Narrow and tight | No |
| 13 | Arterial hypertension | 74 | No | Yes | Narrow and tight | No |
| 14 | Arterial hypertension; Pulmonary fibrosis; Hyperuricemia; Anemia; Chronic kidney disease; Cardiac arrhythmia; Acute myocardial infarction; Hypocoagulated | N/D | No | Yes | Narrow and tight | No |
| Class of Age | Frequency | Percent (%) | Valid Percent (%) | |
|---|---|---|---|---|
| Valid | [71; 83] | 5 | 35.7 | 45.5 |
| (83; 97] | 6 | 42.9 | 54.5 | |
| Total | 11 | 78.6 | 100.0 | |
| missing | N/D | 3 | 21.4 | |
| Total | 14 | 100.0 | ||
| Parameters | N | Class Age (Years Old) | Mean ± Standard Deviation | Standard Error of Mean | Minimum | Maximum | p-Value | |
|---|---|---|---|---|---|---|---|---|
| F-Test | Student t-Test | |||||||
| Heart Rate | 5 | [71; 83] | 90.8 ± 5.6 | 2.5 | 86 | 99 | 0.295 | 0.332 |
| 6 | (83; 97] | 95.5 ± 8.8 | 3.6 | 84 | 107 | |||
| Linear Heart Rate Variability (%) | 5 | [71; 83] | 108.2 ± 16 | 3.8 | 73 | 120 | 0.698 | 0.898 |
| 6 | (83; 97] | 104.5 ± 19.5 | 4.5 | 58 | 121 | |||
| Average of QRS interval (ms) | 5 | [71; 83] | 654.8 ± 55.5 | 13.1 | 578 | 763 | 0.347 | 0.633 |
| 6 | (83; 97] | 646.6 ± 40.3 | 9.3 | 599 | 714 | |||
| Average of R-R interval (ms) | 5 | [71; 83] | 1365.3 ± 371.3 | 87.5 | 1018 | 2013 | 0.729 | 0.895 |
| 6 | (83; 97] | 1543.9 ± 390.9 | 89.7 | 899 | 2169 | |||
| Average of R-S interval (ms) | 5 | [71; 83] | 464.6 ± 181.9 | 42.9 | 279 | 683 | 0.669 | 0.189 |
| 6 | (83; 97] | 233.8 ± 139.9 | 32.1 | 16 | 396 | |||
| Frequency of EEG | 5 | [71; 83] | 290.5 ± 132.8 | 31.3 | 111 | 434 | 0.237 | 0.916 |
| 6 | (83; 97] | 243.6 ± 58.9 | 13.5 | 151 | 313 | |||
| Variability of EEG (%) | 5 | [71; 83] | 88.9 ± 15.8 | 3.7 | 64 | 109 | 0.239 | 0.480 |
| 6 | (83; 97] | 103.6 ± 27.8 | 6.4 | 31 | 122 | |||
| Parameter | Disease | N | Mean ± Standard Deviation | Standard Error of Mean | 95% Confidence Interval for Mean | Minimum | Maximum | |
|---|---|---|---|---|---|---|---|---|
| Lower Bound | Upper Bound | |||||||
| Heart Rate | Arterial hypertension | 12 | 93.5 ± 7.2 | 2.1 | 89.0 | 98.1 | 84 | 107 |
| Cardiac arrhythmia | 2 | 86.5 ± 0.7 | 0.5 | 80.2 | 92.9 | 86 | 87 | |
| Heart failure | 6 | 90.7 ± 6.0 | 2.5 | 84.4 | 97.0 | 84 | 97 | |
| Diabetes mellitus Type II | 5 | 93.2 ± 5.7 | 2.6 | 86.1 | 100.3 | 86 | 100 | |
| Depression | 3 | 89.0 ± 7.0 | 4.0 | 71.6 | 106.4 | 84 | 97 | |
| Vertigo syndrome | 2 | 94.0 ± 0.0 | 0.0 | 94.0 | 94.0 | 94 | 94 | |
| Osteoarthritis | 2 | 89.0 ± 7.1 | 5.0 | 25.5 | 152.5 | 84 | 94 | |
| Osteoporosis | 2 | 89.0 ± 7.1 | 5.0 | 25.5 | 152.5 | 84 | 94 | |
| Hyperuricemia | 2 | 92.0 ± 7.1 | 5.0 | 28.5 | 155.5 | 87 | 97 | |
| Bilateral gonarthrosis | 2 | 97.0 ± 0.0 | 0.0 | 97.0 | 97.0 | 97 | 97 | |
| Chronic obstructive pulmonary disease | 1 | 92.0 ± 7.1 | 5.0 | 28.5 | 155.5 | 87 | 97 | |
| Linear Heart Rate Variability (%) | Arterial hypertension | 12 | 98.4 ± 20.9 | 6.0 | 85.1 | 111.7 | 58.00 | 122.00 |
| Cardiac arrhythmia | 2 | 100.0 ± 22.6 | 16.0 | −103.3 | 303.3 | 84.00 | 116.00 | |
| Heart failure | 6 | 117.4 ± 4.4 | 1.8 | 112.7 | 122.1 | 110.00 | 122.00 | |
| Diabetes mellitus Type II | 5 | 104.0 ± 21.8 | 9.7 | 77.0 | 131.0 | 73.00 | 122.00 | |
| Depression | 3 | 119.4± 3.4 | 2.0 | 111.0 | 127.8 | 115.60 | 122.00 | |
| Vertigo syndrome | 2 | 103.7 ± 23.1 | 16.4 | −104.1 | 311.4 | 87.30 | 120.00 | |
| Osteoarthritis | 2 | 120.4 ± 0.5 | 0.4 | 115.9 | 124.8 | 120.00 | 120.70 | |
| Osteoporosis | 2 | 120.4 ± 0.5 | 0.4 | 115.9 | 124.8 | 120.00 | 120.70 | |
| Hyperuricemia | 2 | 103.0 ± 26.9 | 19.0 | −138.4 | 344.4 | 84.00 | 122.00 | |
| Bilateral gonarthrosis | 2 | 116.0 ± 8.5 | 6.0 | 39.8 | 192.2 | 110.00 | 122.00 | |
| Chronic obstructive pulmonary disease | 1 | 97.0 ± 18.4 | 13.0 | −68.2 | 262.2 | 84.00 | 110.00 | |
| Average of QRS interval (ms) | Arterial hypertension | 12 | 634.2 ± 33.0 | 9.5 | 613.2 | 655.1 | 579.6 | 686.1 |
| Cardiac arrhythmia | 2 | 644.1 ± 42.4 | 30.0 | 262.9 | 1025.3 | 614.1 | 674.1 | |
| Heart failure | 6 | 647.4 ± 39.6 | 16.2 | 605.9 | 688.9 | 614.1 | 713.5 | |
| Diabetes mellitus Type II | 5 | 637.0 ± 29.3 | 13.1 | 600.6 | 673.4 | 617.3 | 686.1 | |
| Depression | 3 | 645.9 ± 27.8 | 16.0 | 577.0 | 714.9 | 620.0 | 675.2 | |
| Vertigo syndrome | 2 | 637.7 ± 26.5 | 18.7 | 400.1 | 875.3 | 619.0 | 656.4 | |
| Osteoarthritis | 2 | 647.1 ± 39.7 | 28.1 | 290.1 | 1004.1 | 619.0 | 675.2 | |
| Osteoporosis | 2 | 647.1 ± 39.7 | 28.1 | 290.1 | 1004.1 | 619.0 | 675.2 | |
| Hyperuricemia | 2 | 647.1 ± 38.3 | 27.1 | 303.4 | 990.8 | 620.0 | 674.1 | |
| Bilateral gonarthrosis | 2 | 666.8 ± 66.1 | 46.8 | 72.7 | 1260.8 | 620.0 | 713.5 | |
| Chronic obstructive pulmonary disease | 1 | 693.8 ± 27.9 | 19.7 | 443.5 | 944.1 | 674.1 | 713.5 | |
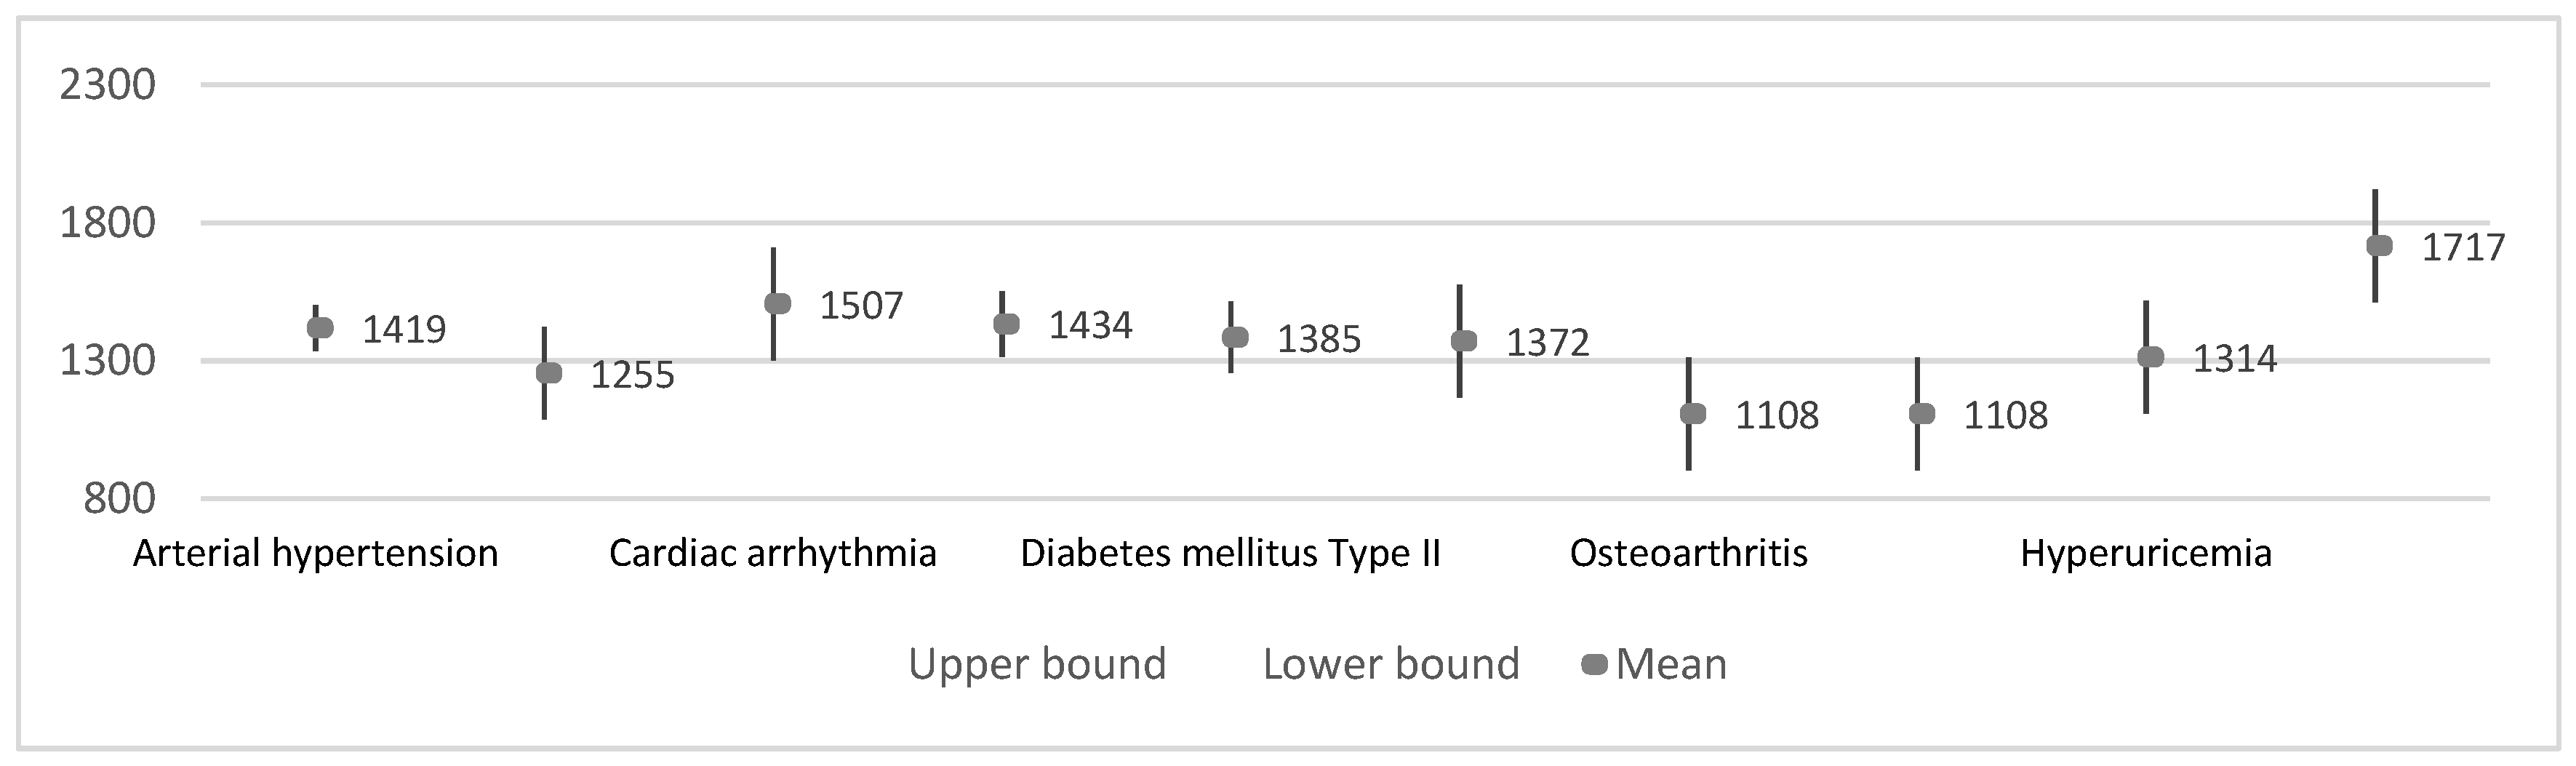
| Average of R-R interval (ms) | Arterial hypertension | 12 | 1419.1 ± 285.1 | 82.3 | 1238.0 | 1600.2 | 899 | 1725 |
| Cardiac arrhythmia | 2 | 1507.0± 203.7 | 144.0 | −322.7 | 3336.7 | 1363 | 1651 | |
| Heart failure | 6 | 1433.8 ± 415.2 | 169.5 | 998.1 | 1869.6 | 1018 | 2169 | |
| Diabetes mellitus Type II | 5 | 1385.2 ± 282.5 | 126.3 | 1034.5 | 1735.9 | 1018 | 1678 | |
| Depression | 3 | 1255.0 ± 52.7 | 30.4 | 1124.1 | 1386.0 | 1198 | 1302 | |
| Vertigo syndrome | 2 | 1371.5 ± 499.9 | 353.5 | −3120.1 | 5863.1 | 1018 | 1725 | |
| Osteoarthritis | 2 | 1108.0 ± 127.3 | 90.0 | −35.6 | 2251.6 | 1018 | 1198 | |
| Osteoporosis | 2 | 1108.0 ± 127.3 | 90.0 | −35.6 | 2251.6 | 1018 | 1198 | |
| Hyperuricemia | 2 | 1314.0 ± 69.3 | 49.0 | 691.4 | 1936.6 | 1265 | 1363 | |
| Bilateral gonarthrosis | 2 | 1717.0 ± 639.2 | 452.0 | −4026.2 | 7460.2 | 1265 | 2169 | |
| Chronic obstructive pulmonary disease | 1 | 1766.0 ± 569.9 | 403.0 | −3354.6 | 6886.6 | 1363 | 2169 | |
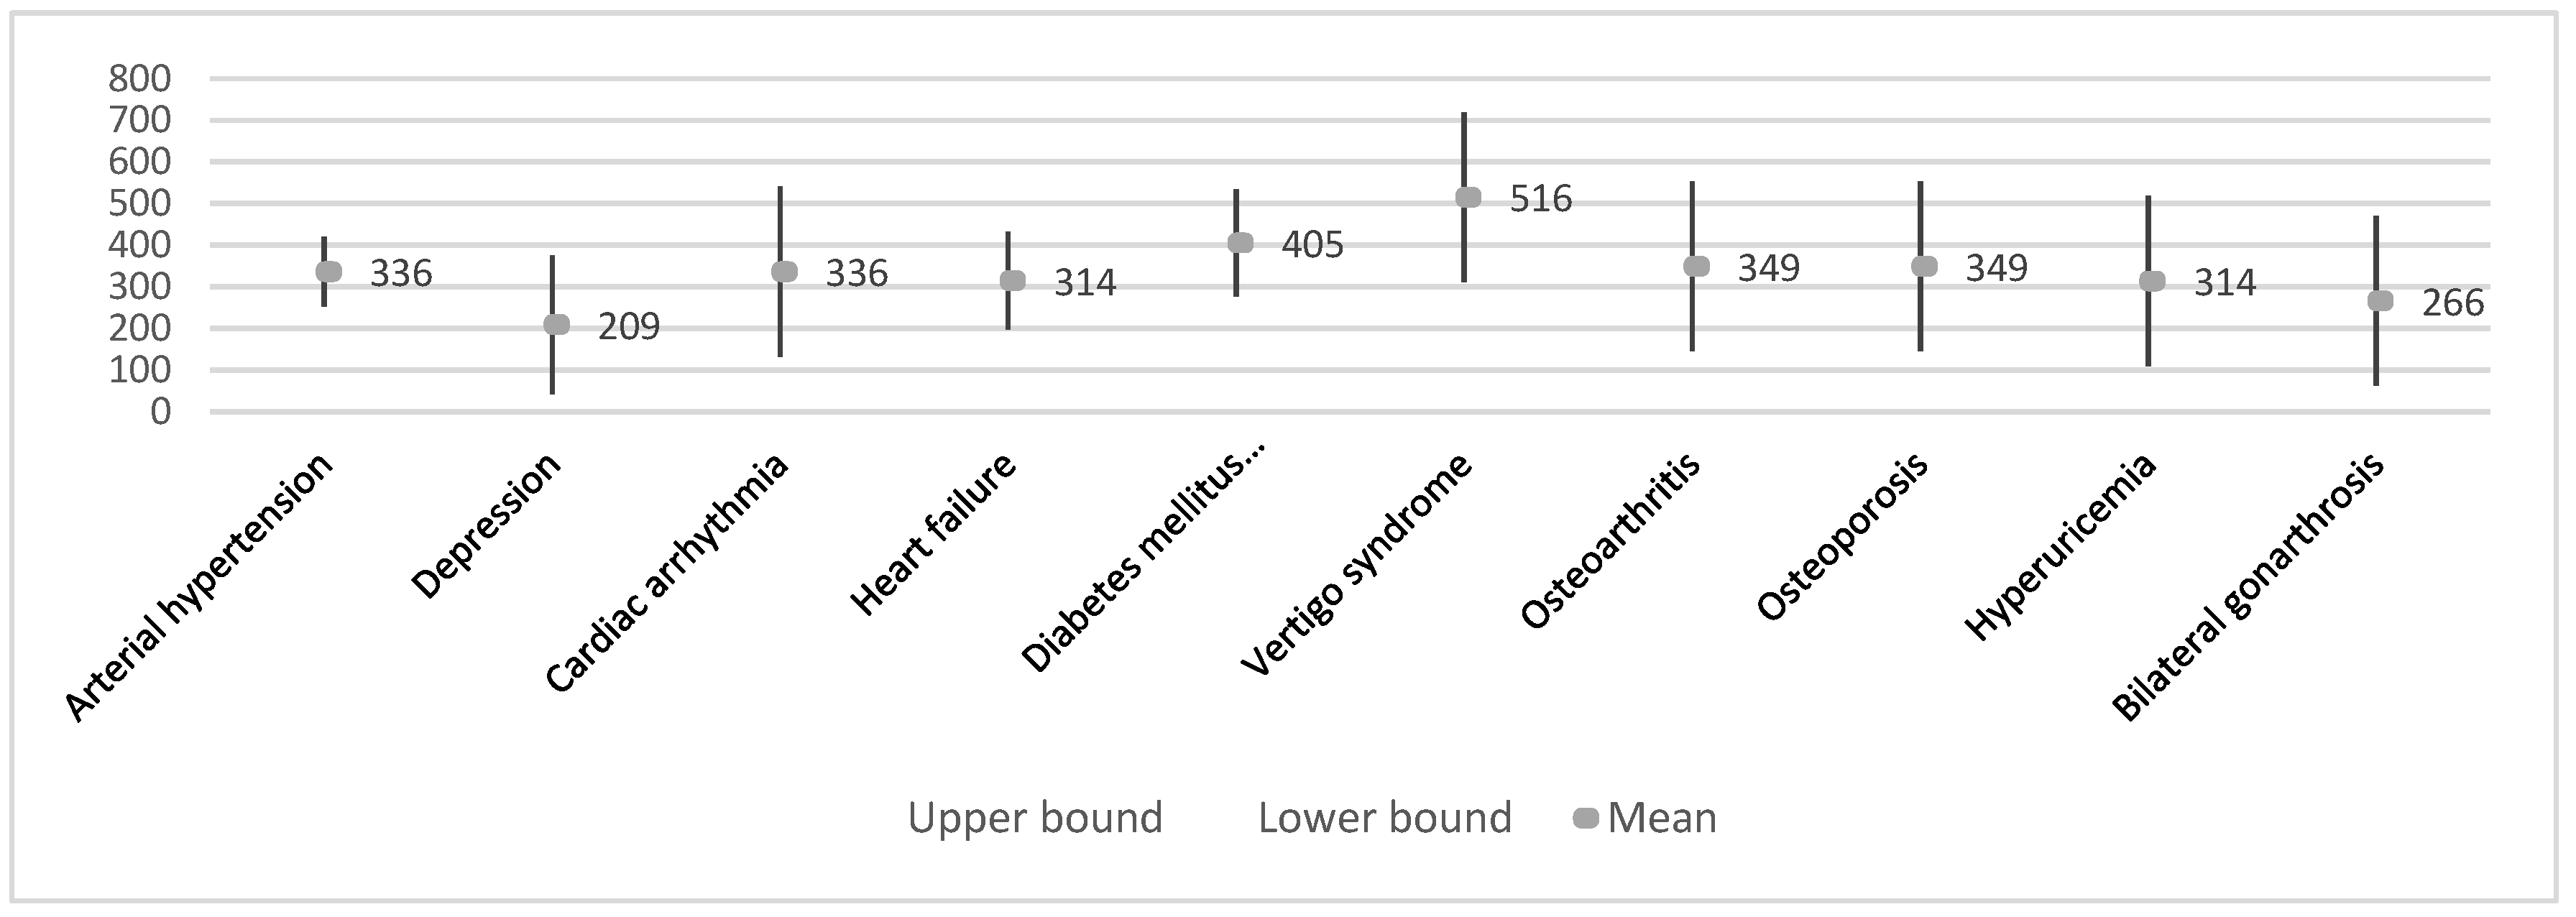
| Average of R-S interval (ms) | Arterial hypertension | 12 | 336.1 ± 147.3 | 42.5 | 242.5 | 429.6 | 15.77 | 683.00 |
| Cardiac arrhythmia | 2 | 336.0 ± 21.2 | 15.0 | 145.4 | 526.6 | 321.00 | 351.00 | |
| Heart failure | 6 | 314.3 ± 214.7 | 87.6 | 89.0 | 539.6 | 15.77 | 683.00 | |
| Diabetes mellitus Type II | 5 | 405.4 ± 160.3 | 71.7 | 206.4 | 604.4 | 277.00 | 683.00 | |
| Depression | 3 | 208.9 ± 169.7 | 98.0 | −212.6 | 630.5 | 15.77 | 334.00 | |
| Vertigo syndrome | 2 | 515.5 ± 236.9 | 167.5 | −1612.8 | 2643.8 | 348.00 | 683.00 | |
| Osteoarthritis | 2 | 349.4 ± 471.8 | 333.6 | −3889.6 | 4588.4 | 15.77 | 683.00 | |
| Osteoporosis | 2 | 349.4 ± 471.8 | 333.6 | −3889.6 | 4588.4 | 15.77 | 683.00 | |
| Hyperuricemia | 2 | 314.0 ± 52.3 | 37.0 | −156.1 | 784.1 | 277.00 | 351.00 | |
| Bilateral gonarthrosis | 2 | 266.0 ± 15.6 | 11.0 | 126.2 | 405.8 | 255.00 | 277.00 | |
| Chronic obstructive pulmonary disease | 1 | 303.0 ± 67.9 | 48.0 | −306.9 | 912.9 | 255.00 | 351.00 | |
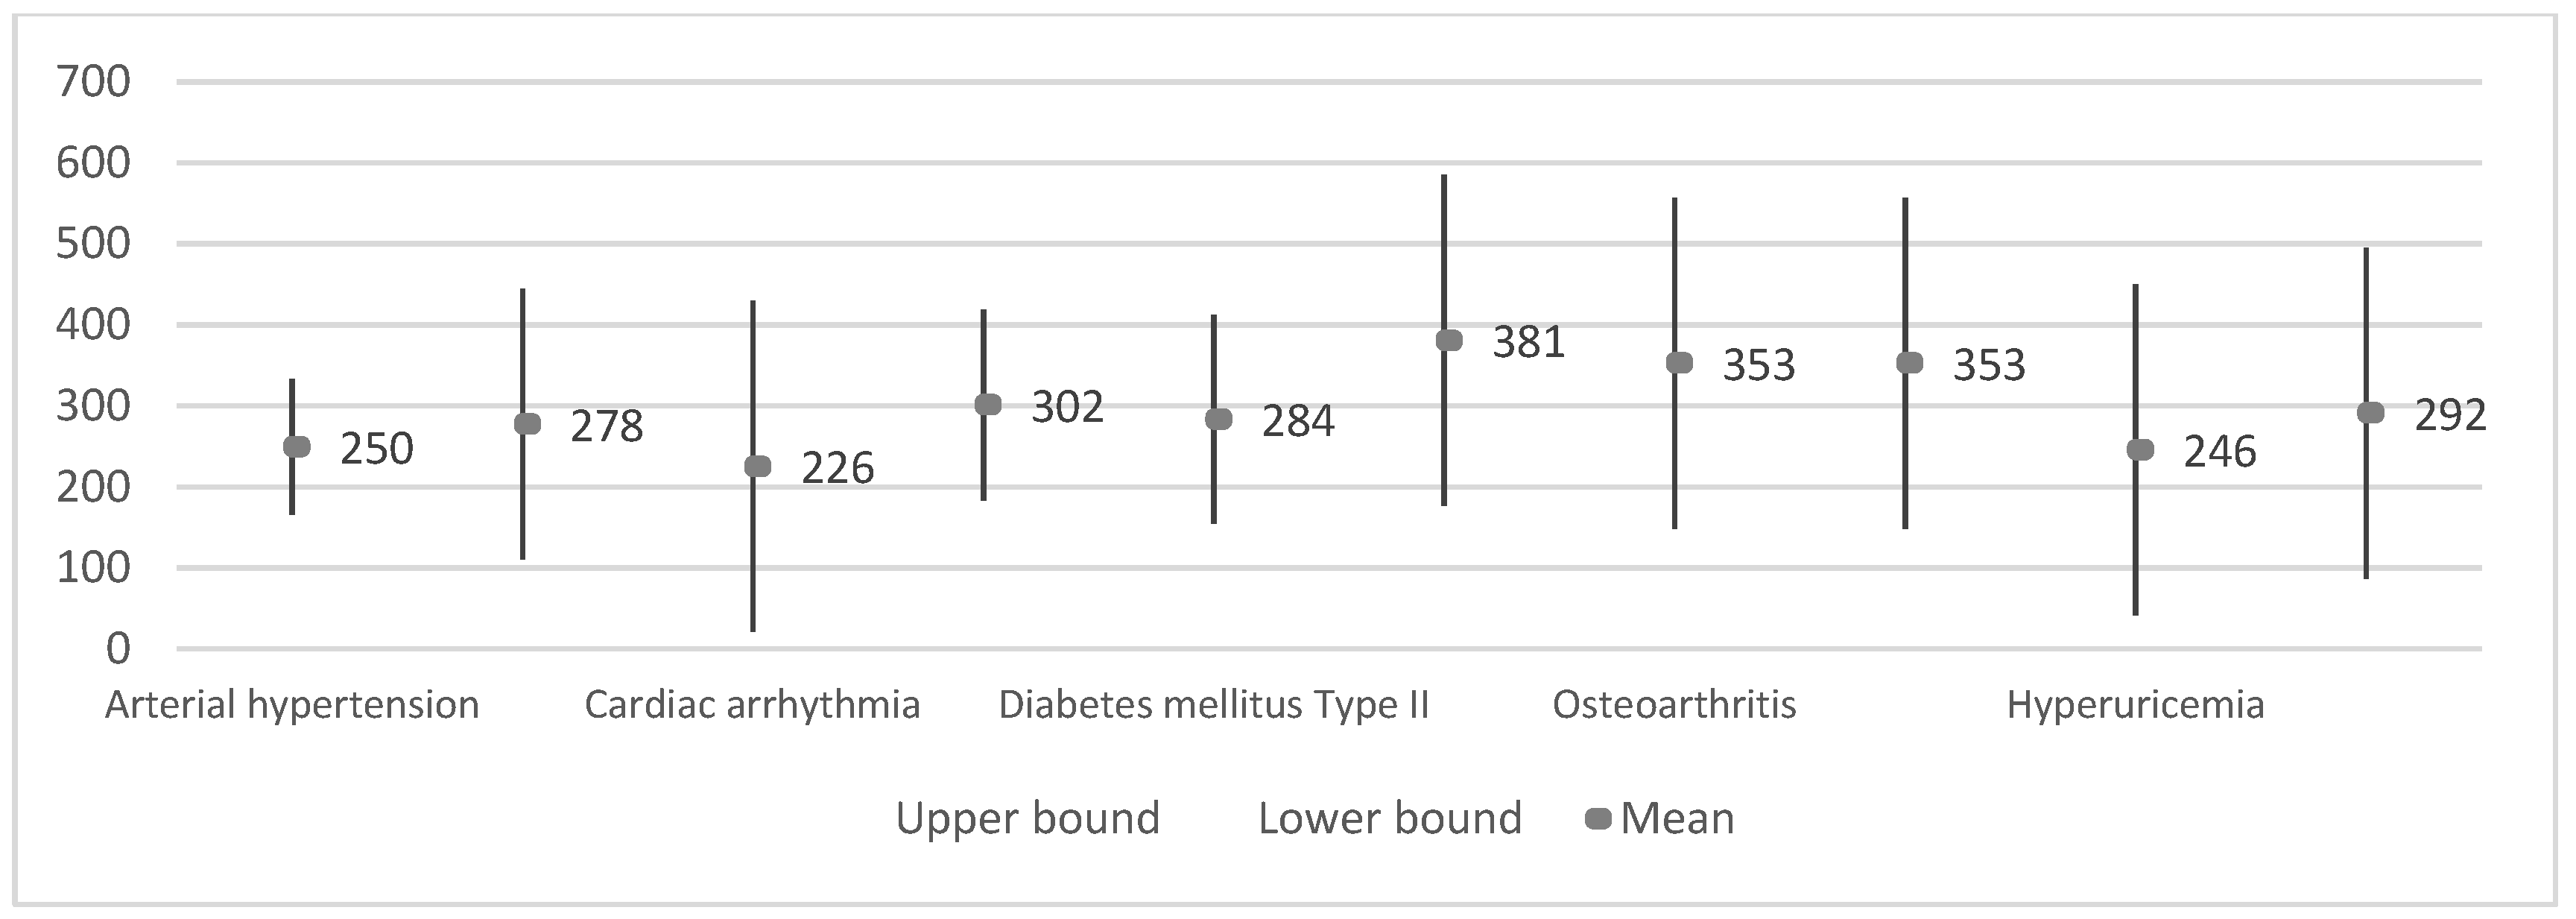
| Frequency of EEG | Arterial hypertension | 12 | 249.7 ± 88.9 | 25.7 | 193.2 | 306.1 | 111 | 434 |
| Cardiac arrhythmia | 2 | 225.5 ± 24.7 | 17.5 | 3.1 | 447.9 | 208 | 243 | |
| Heart failure | 6 | 301.5 ± 67.5 | 27.6 | 230.7 | 372.3 | 243 | 434 | |
| Diabetes mellitus Type II | 5 | 283.8 ± 115.5 | 51.6 | 140.4 | 427.2 | 111 | 434 | |
| Depression | 3 | 277.7 ± 6.0 | 3.5 | 262.7 | 292.6 | 272 | 284 | |
| Vertigo syndrome | 2 | 381.0 ± 75.0 | 53.0 | −292.4 | 1054.4 | 328 | 434 | |
| Osteoarthritis | 2 | 353.0 ± 114.6 | 81.0 | −676.2 | 1382.2 | 272 | 434 | |
| Osteoporosis | 2 | 353.0 ± 114.6 | 81.0 | −676.2 | 1382.2 | 272 | 434 | |
| Hyperuricemia | 2 | 246.0 ± 53.7 | 38.0 | −236.8 | 728.8 | 208 | 284 | |
| Bilateral gonarthrosis | 2 | 291.5 ± 10.6 | 7.5 | 196.2 | 386.8 | 284 | 299 | |
| Chronic obstructive pulmonary disease | 1 | 253.5 ± 64.4 | 45.5 | −324.6 | 831.6 | 208 | 299 | |
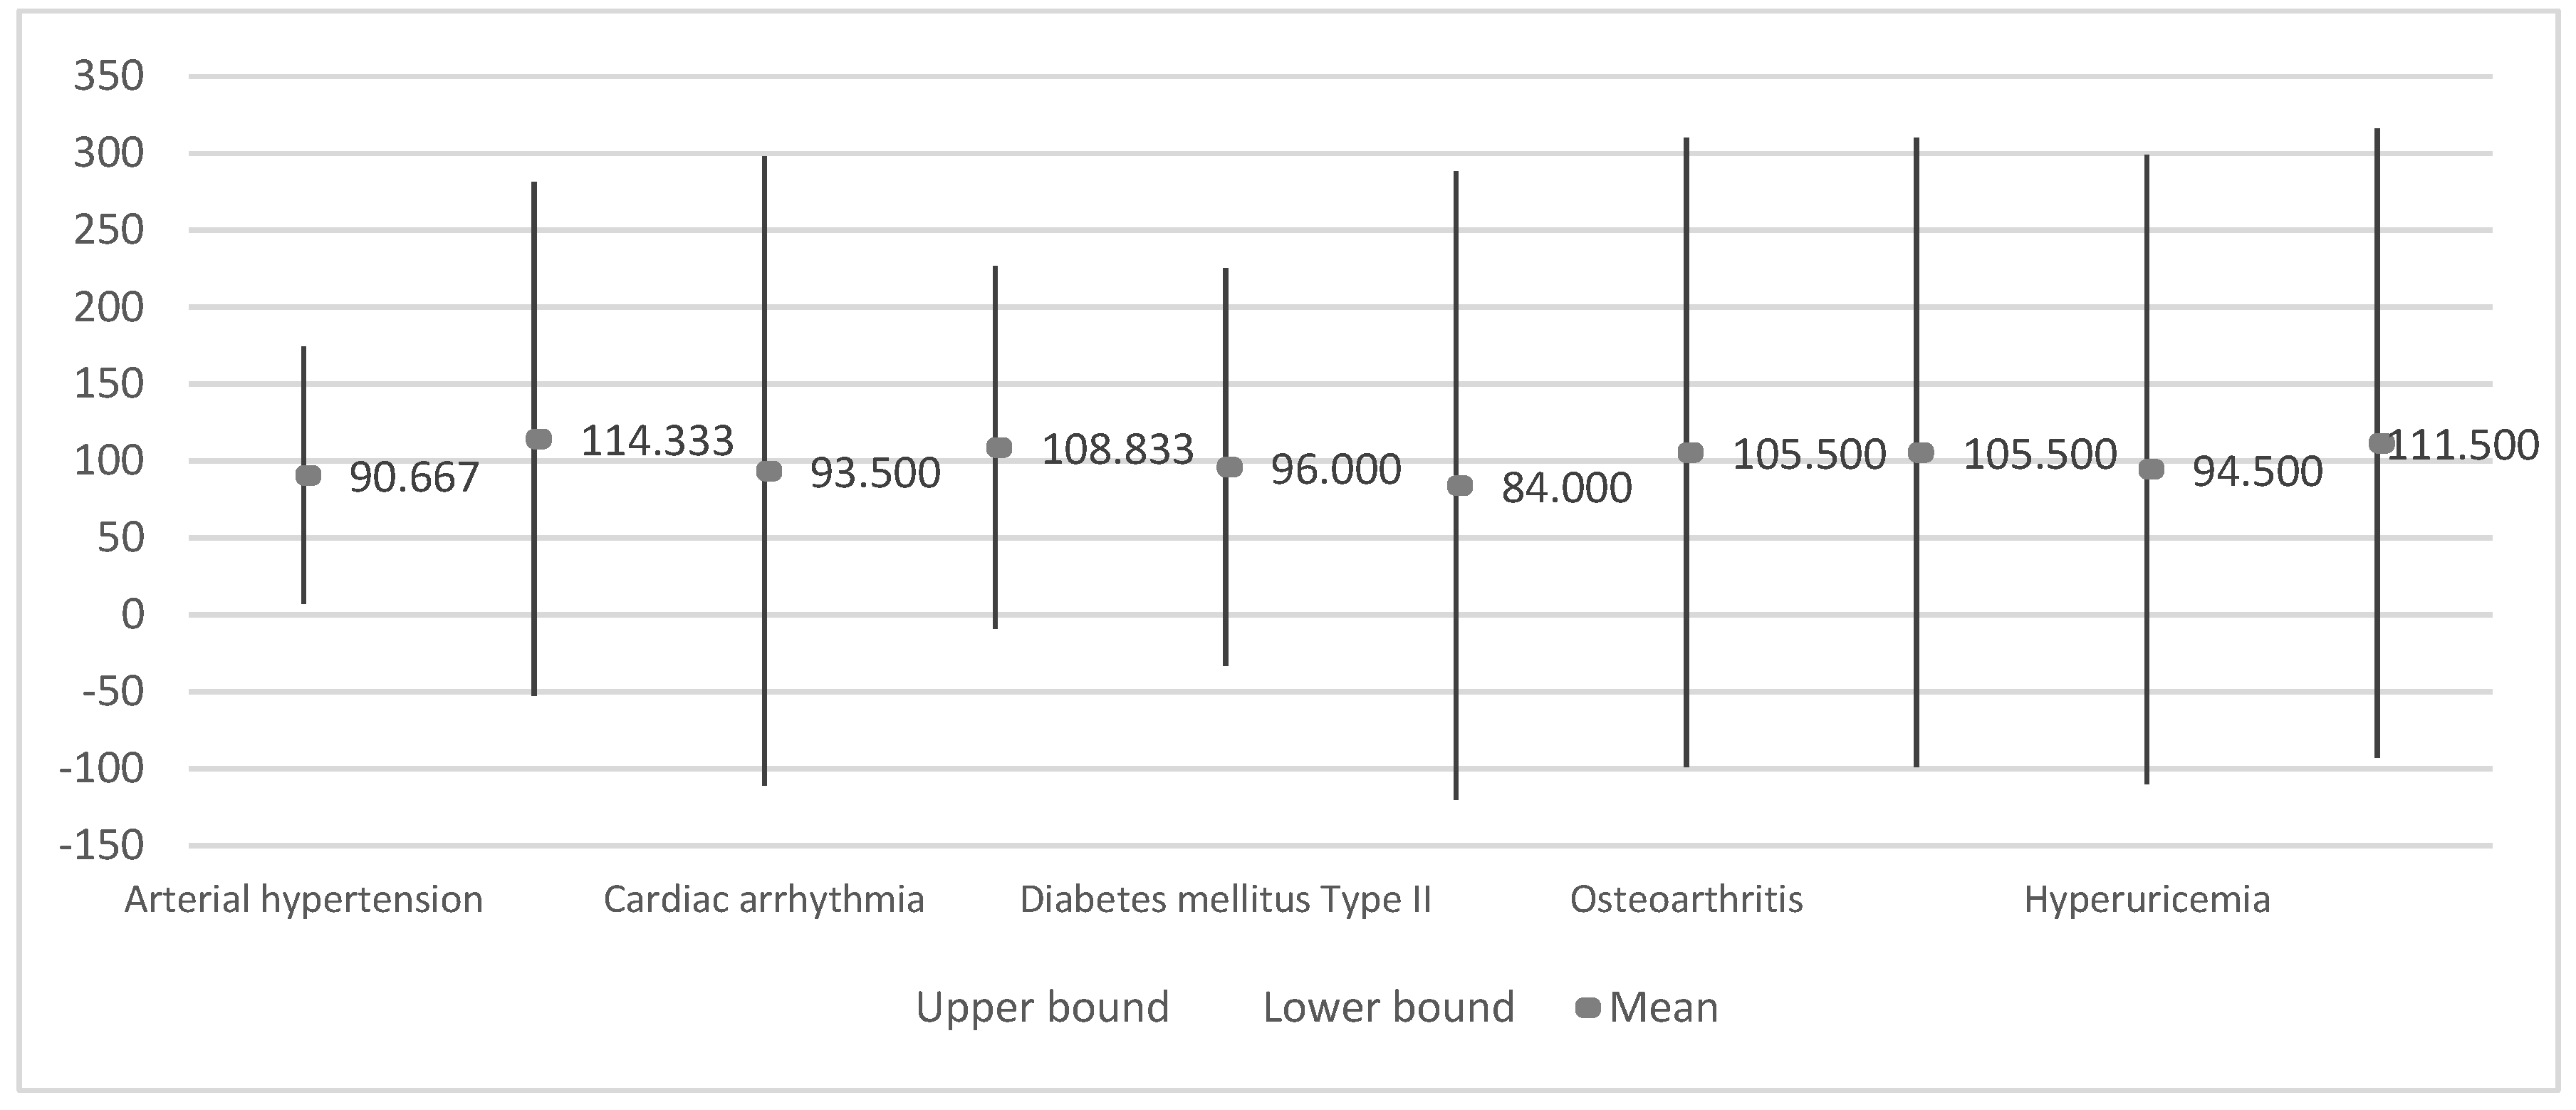
| Variability of EEG (%) | Arterial hypertension | 12 | 90.7 ± 25.6 | 7.4 | 74.4 | 107.0 | 31.00 | 122.00 |
| Cardiac arrhythmia | 2 | 93.5 ± 23.3 | 16.5 | −116.2 | 303.2 | 77.00 | 110.00 | |
| Heart failure | 6 | 108.8 ± 10.8 | 4.4 | 97.5 | 120.2 | 89.00 | 122.00 | |
| Diabetes mellitus Type II | 5 | 96.0 ± 13.38 | 6.0 | 79.4 | 112.6 | 85.00 | 112.00 | |
| Depression | 3 | 114.3 ± 6.8 | 3.9 | 97.4 | 131.2 | 109.00 | 122.00 | |
| Vertigo syndrome | 2 | 84.0 ± 7.1 | 5.0 | 20.5 | 147.5 | 79.00 | 89.00 | |
| Osteoarthritis | 2 | 105.5 ± 23.3 | 16.5 | −104.2 | 315.2 | 89.00 | 122.00 | |
| Osteoporosis | 2 | 105.5 ± 23.3 | 16.5 | −104.2 | 315.2 | 89.00 | 122.00 | |
| Hyperuricemia | 2 | 94.5 ± 24.75 | 17.5 | −127.9 | 316.9 | 77.00 | 112.00 | |
| Bilateral gonarthrosis | 2 | 111.5 ± 0.7 | 0.5 | 105.2 | 117.9 | 111.00 | 112.00 | |
| Chronic obstructive pulmonary disease | 1 | 94.0 ± 24.0 | 17.0 | −122.0 | 310.0 | 77.00 | 111.00 | |
| Study | Diseases | Parameters | Values in the Literature | Average Values Obtained in our Study | Normal Values in Healthy Adults |
|---|---|---|---|---|---|
| [45] | Bradycardia | Heart rate | <60 bpm | N/A | >60 bpm <92 bpm |
| [45] | Tachycardia | Heart rate | >100 bpm | N/A | >60 bpm <92 bpm |
| [45] | Premature ventricular contraction | Duration of QRS interval | >120ms | N/A | >75.5 ms <108.0 ms |
| [45] | Premature atrial contraction | Heart rate | >60 bpm <100 bpm | N/A | >60 bpm <92 bpm |
| [49] | Atrial fibrillation | Duration of P-wave | N/D | N/A | >80 ms <120 ms |
| Heart rate | Irregular | N/A | >60 bpm <92 bpm | ||
| [50] | Arrhythmia | Heart rate variability | N/D | >100% | N/A |
| - | Heart rate failure | Heart rate variability | N/A | >100% | N/A |
| - | Arterial hypertension | Duration of QRS interval | N/A | <700 ms | >75.5 ms <108.0 ms |
| [54] | Parkinson’s disease; Bilateral Gonarthrosis | Duration of R-R interval | N/A | >2000 ms | >600 ms <1200 ms |
| Duration of QRS interval | N/A | >700 ms | >75.5 ms <108.0 ms |
© 2020 by the authors. Licensee MDPI, Basel, Switzerland. This article is an open access article distributed under the terms and conditions of the Creative Commons Attribution (CC BY) license (http://creativecommons.org/licenses/by/4.0/).
Share and Cite
Ponciano, V.; Pires, I.M.; Ribeiro, F.R.; Villasana, M.V.; Canavarro Teixeira, M.; Zdravevski, E. Experimental Study for Determining the Parameters Required for Detecting ECG and EEG Related Diseases during the Timed-Up and Go Test. Computers 2020, 9, 67. https://doi.org/10.3390/computers9030067
Ponciano V, Pires IM, Ribeiro FR, Villasana MV, Canavarro Teixeira M, Zdravevski E. Experimental Study for Determining the Parameters Required for Detecting ECG and EEG Related Diseases during the Timed-Up and Go Test. Computers. 2020; 9(3):67. https://doi.org/10.3390/computers9030067
Chicago/Turabian StylePonciano, Vasco, Ivan Miguel Pires, Fernando Reinaldo Ribeiro, María Vanessa Villasana, Maria Canavarro Teixeira, and Eftim Zdravevski. 2020. "Experimental Study for Determining the Parameters Required for Detecting ECG and EEG Related Diseases during the Timed-Up and Go Test" Computers 9, no. 3: 67. https://doi.org/10.3390/computers9030067
APA StylePonciano, V., Pires, I. M., Ribeiro, F. R., Villasana, M. V., Canavarro Teixeira, M., & Zdravevski, E. (2020). Experimental Study for Determining the Parameters Required for Detecting ECG and EEG Related Diseases during the Timed-Up and Go Test. Computers, 9(3), 67. https://doi.org/10.3390/computers9030067