Article

Machine Learning Techniques with ECG and EEG Data: An Exploratory Study

by
Vasco Ponciano
1,2,
Ivan Miguel Pires
3,4,*,
Fernando Reinaldo Ribeiro
1,
Nuno M. Garcia
3,
María Vanessa Villasana
5,
Eftim Zdravevski
6 and
Petre Lameski
6
1
R&D Unit in Digital Services, Applications and Content, Polytechnic Institute of Castelo Branco, 6000-767 Castelo Branco, Portugal
2
Altranportugal, 1990-096 Lisbon, Portugal
3
Instituto de Telecomunicações, Universidade da Beira Interior, 6200-001 Covilhã, Portugal
4
Department of Computer Science, Polytechnic Institute of Viseu, 3504-510 Viseu, Portugal
5
Faculty of Health Sciences, Universidade da Beira Interior, 6200-506 Covilhã, Portugal
6
Faculty of Computer Science and Engineering, University Ss Cyril and Methodius, 1000 Skopje, North Macedonia
*
Author to whom correspondence should be addressed.
Computers 2020, 9(3), 55; https://doi.org/10.3390/computers9030055
Submission received: 1 June 2020 / Revised: 25 June 2020 / Accepted: 28 June 2020 / Published: 29 June 2020
(This article belongs to the Special Issue Machine Learning for EEG Signal Processing)

Abstract

:
Electrocardiography (ECG) and electroencephalography (EEG) are powerful tools in medicine for the analysis of various diseases. The emergence of affordable ECG and EEG sensors and ubiquitous mobile devices provides an opportunity to make such analysis accessible to everyone. In this paper, we propose the implementation of a neural network-based method for the automatic identification of the relationship between the previously known conditions of older adults and the different features calculated from the various signals. The data were collected using a smartphone and low-cost ECG and EEG sensors during the performance of the timed-up and go test. Different patterns related to the features extracted, such as heart rate, heart rate variability, average QRS amplitude, average R-R interval, and average R-S interval from ECG data, and the frequency and variability from the EEG data were identified. A combination of these parameters allowed us to identify the presence of certain diseases accurately. The analysis revealed that the different institutions and ages were mainly identified. Still, the various diseases and groups of diseases were difficult to recognize, because the frequency of the different diseases was rare in the considered population. Therefore, the test should be performed with more people to achieve better results.

1. Introduction

The emergence of non-invasive methods for analyzing and detecting diseases is one of the most significant prospects in medicine. At the same time, this poses challenges related to the correct use of technology, the positioning of the sensors, and the constant evolution of the equipment [1,2]. Technological advancements allow for a preliminary diagnosis through machines without any intervention from healthcare professionals. This research is included in the development of systems to support ambient assisted living technologies [3,4,5,6]. Cutting-edge approaches in the healthcare area have helped in solving various computer vision-based tasks by analyzing different features from various biosignals, including the facial features [7,8].
Mobile devices can be connected to different devices to head the creation of sophisticated hand-held systems for the monitoring of health states [9,10,11]. They are handy because they are portable and small, allowing their correct positioning for different measurements [9,10,11]. These devices are equipped with different sensors, but more sensors can be connected through over-the-air connections [12,13,14,15,16,17,18]. These devices with increasing number of functionalities, and the number of available sensors, boost the options for creation of systems that could assist older adults [15,19,20,21,22]. The use of this data captured in each individual and their subsequent calculation present the potential of these projects.
This research is included in a project related to Timed-Up and Go test, where the individuals were provided with a smartphone having an accelerometer and magnetometer sensors. To perform the experiments, we used two BITalino devices (https://bitalino.com/en/) that are affordable do-it-your-self boards facilitating the collection and analysis of variety of biomedical signals with inexpensive sensors. First, a BITalino device was positioned on the chair with a force sensor to detect the duration for which the individuals stood. Then, another BITalino device, with ECG and EEG sensors, was placed in the individual, and the different sensors were prepared for the acquisition of data during the test. Regarding the data acquired by the mobile device, the sampling rate is around 10 ms. Then, for the data acquired by the BITalino device, the sampling rate is exactly 100 ms. The similar frequencies enable the comparison of the data more accurately.
The main purpose of this study was the implementation of neural networks to identify the different diseases present in the population considered in the study reported in [23,24]. It was related to the timed-up and go test’s execution with institutionalized people from the Covilhã and Fundão municipalities. Thus, the implementation of the methods started with identifying persons by institutions, age, diseases, and groups of diseases.
The implemented neural networks with the WEKA software [25] reported that the individuals might be recognized by institutions, where only the individuals from Centro Comunitário das Lameiras were not correctly identified. Similar results were obtained by age, where only persons who were 74, 85, and 86 years old were not correctly recognized. Regarding the recognition of the diseases, they were not correctly identified, because the sample consisted of a small number of individuals. However, after the categorization of the illnesses, cardiac diseases started to be recognized as a group of diseases.
Other studies related to processing of ECG and EEG data are reviewed and summarized in [26,27]. There are two main tracks regarding feature extraction—based on statistical features from the time and frequency domain, and ones based on deep learning. Our approach is using classical feature extraction because of the limited dataset size that we have. The results are on par with other approaches with a similar number of participants. What is novel in our approach is the combination of both sensors embedded on an inexpensive board, proving that even such affordable devices can provide satisfactory results and serve as indication of emerging diseases.
The Introductory section ends with this paragraph, and the remaining sections of this paper are organized as follows: Section 2 presents the description of the structure of the method implemented for the recognition of persons by institution, age, diseases, and groups of diseases. The results obtained are presented in Section 3. This paper ends with the discussion of the results and the presentation of the different conclusions in Section 4.

2. Methods

Machine learning methods were implemented with ECG and EEG data to identify the persons by the institution, age, diseases, and groups of disorders. The flow of the proposed method includes several stages, including data collection, feature extraction, machine learning, and statistical methods, as presented in Figure 1. We only considered the persons whose ECG and EEG data were correctly acquired, and the data were not filtered, extracting only the different features.

2.1. Data Collection

Following the previous studies [23,24], the data, as presented in Table 1, were acquired from 14 institutionalized individuals aged between 71 and 97 years old (83 +/− 7.4) with different diseases included in some categories, as presented in Section 3.4. The different data were acquired from various institutions, such as Centro Comunitário das Lameiras, Lar Minas, Lar da Misericórdia, and Lar da Nossa Senhora de Fátima. The data were collected by a mobile application connected by Bluetooth to a BITalino device. Different constraints were verified during the data collection, but these records were reliable for the analysis and correlation of the different diseases found in the population. For this study, only the ECG and EEG data acquired by a BITalino device were considered for the processing of the different disorders. The data acquisition faced some challenges, as presented in [28,29].
The acquisition of the data has different sample rate between devices, where the sampling rate of the sensors available in the mobile device is variable, because the instruction Sensor.DELAY_FASTEST does not have the same frequency on all devices. Regarding the device used, i.e., XIAOMI MI 6, reported that the frequency is around 10 ms, i.e., 100 Hz. Next, the sampling rate of the BITalino device connected by Bluetooth is 100 Hz. After the data acquisition, the different features were extracted for further comparison, as explained in Section 2.2. After the data acquisition, the data were processed offline as presented in Section 2.3.

2.2. Feature Extraction

Different features were extracted with the framework [4] from the ECG and EEG signals, including heart rate, heart rate variability, average QRS amplitude, average R-R interval, and the average R-S interval from the ECG data, and the frequency and variability from the EEG data. These data were combined for the identification of institution, age, disease, and a group of disorders of different individuals.

2.3. Machine Learning

The machine learning method implemented was a neural network, i.e., multiplayer perceptron, implemented with the WEKA software [25] with the following details:
  • Learning rate: 0.3;
  • Momentum: 0.2;
  • Normalization of attributes and classes;
  • Seed value: 0;
  • Training time: 500ms;
  • Validation Threshold: 20.
The WEKA software is a free and open-source application to test different machine learning methods. It includes a set of methods, but we chose the Multiplayer Perceptron method [30,31], which is a method that consists of the training and the prediction of different classes with different weights to the input and output neurons. It also supports different attribute transformation methods, including ones for handling nominal and numeric data, which is important for medical datasets, which frequently encounter mixed data types [32,33].

2.4. Statistical Analysis

For the validation of the implemented method, different parameters were calculated, such as true positive (TP), false positive (FP), true negative (TN), and false negative (FN). With these values, the accuracy, precision, recall, and F1 score values were calculated to measure the performance of the implemented method.

3. Results

Based on the different constraints during data acquisition, we performed various types of analyses with neural networks, firstly, by combining the institution with the different features extracted (Section 3.1). Secondly, we combined the different features extracted with the sample’s different ages (Section 3.2). Thirdly, we combined the same features extracted with various diseases (Section 3.3). Finally, we established groups of disorders, and the disorders were categorized; then, we combined the different groups of illnesses with the features extracted previously (Section 3.4).

3.1. Analysis by Institution

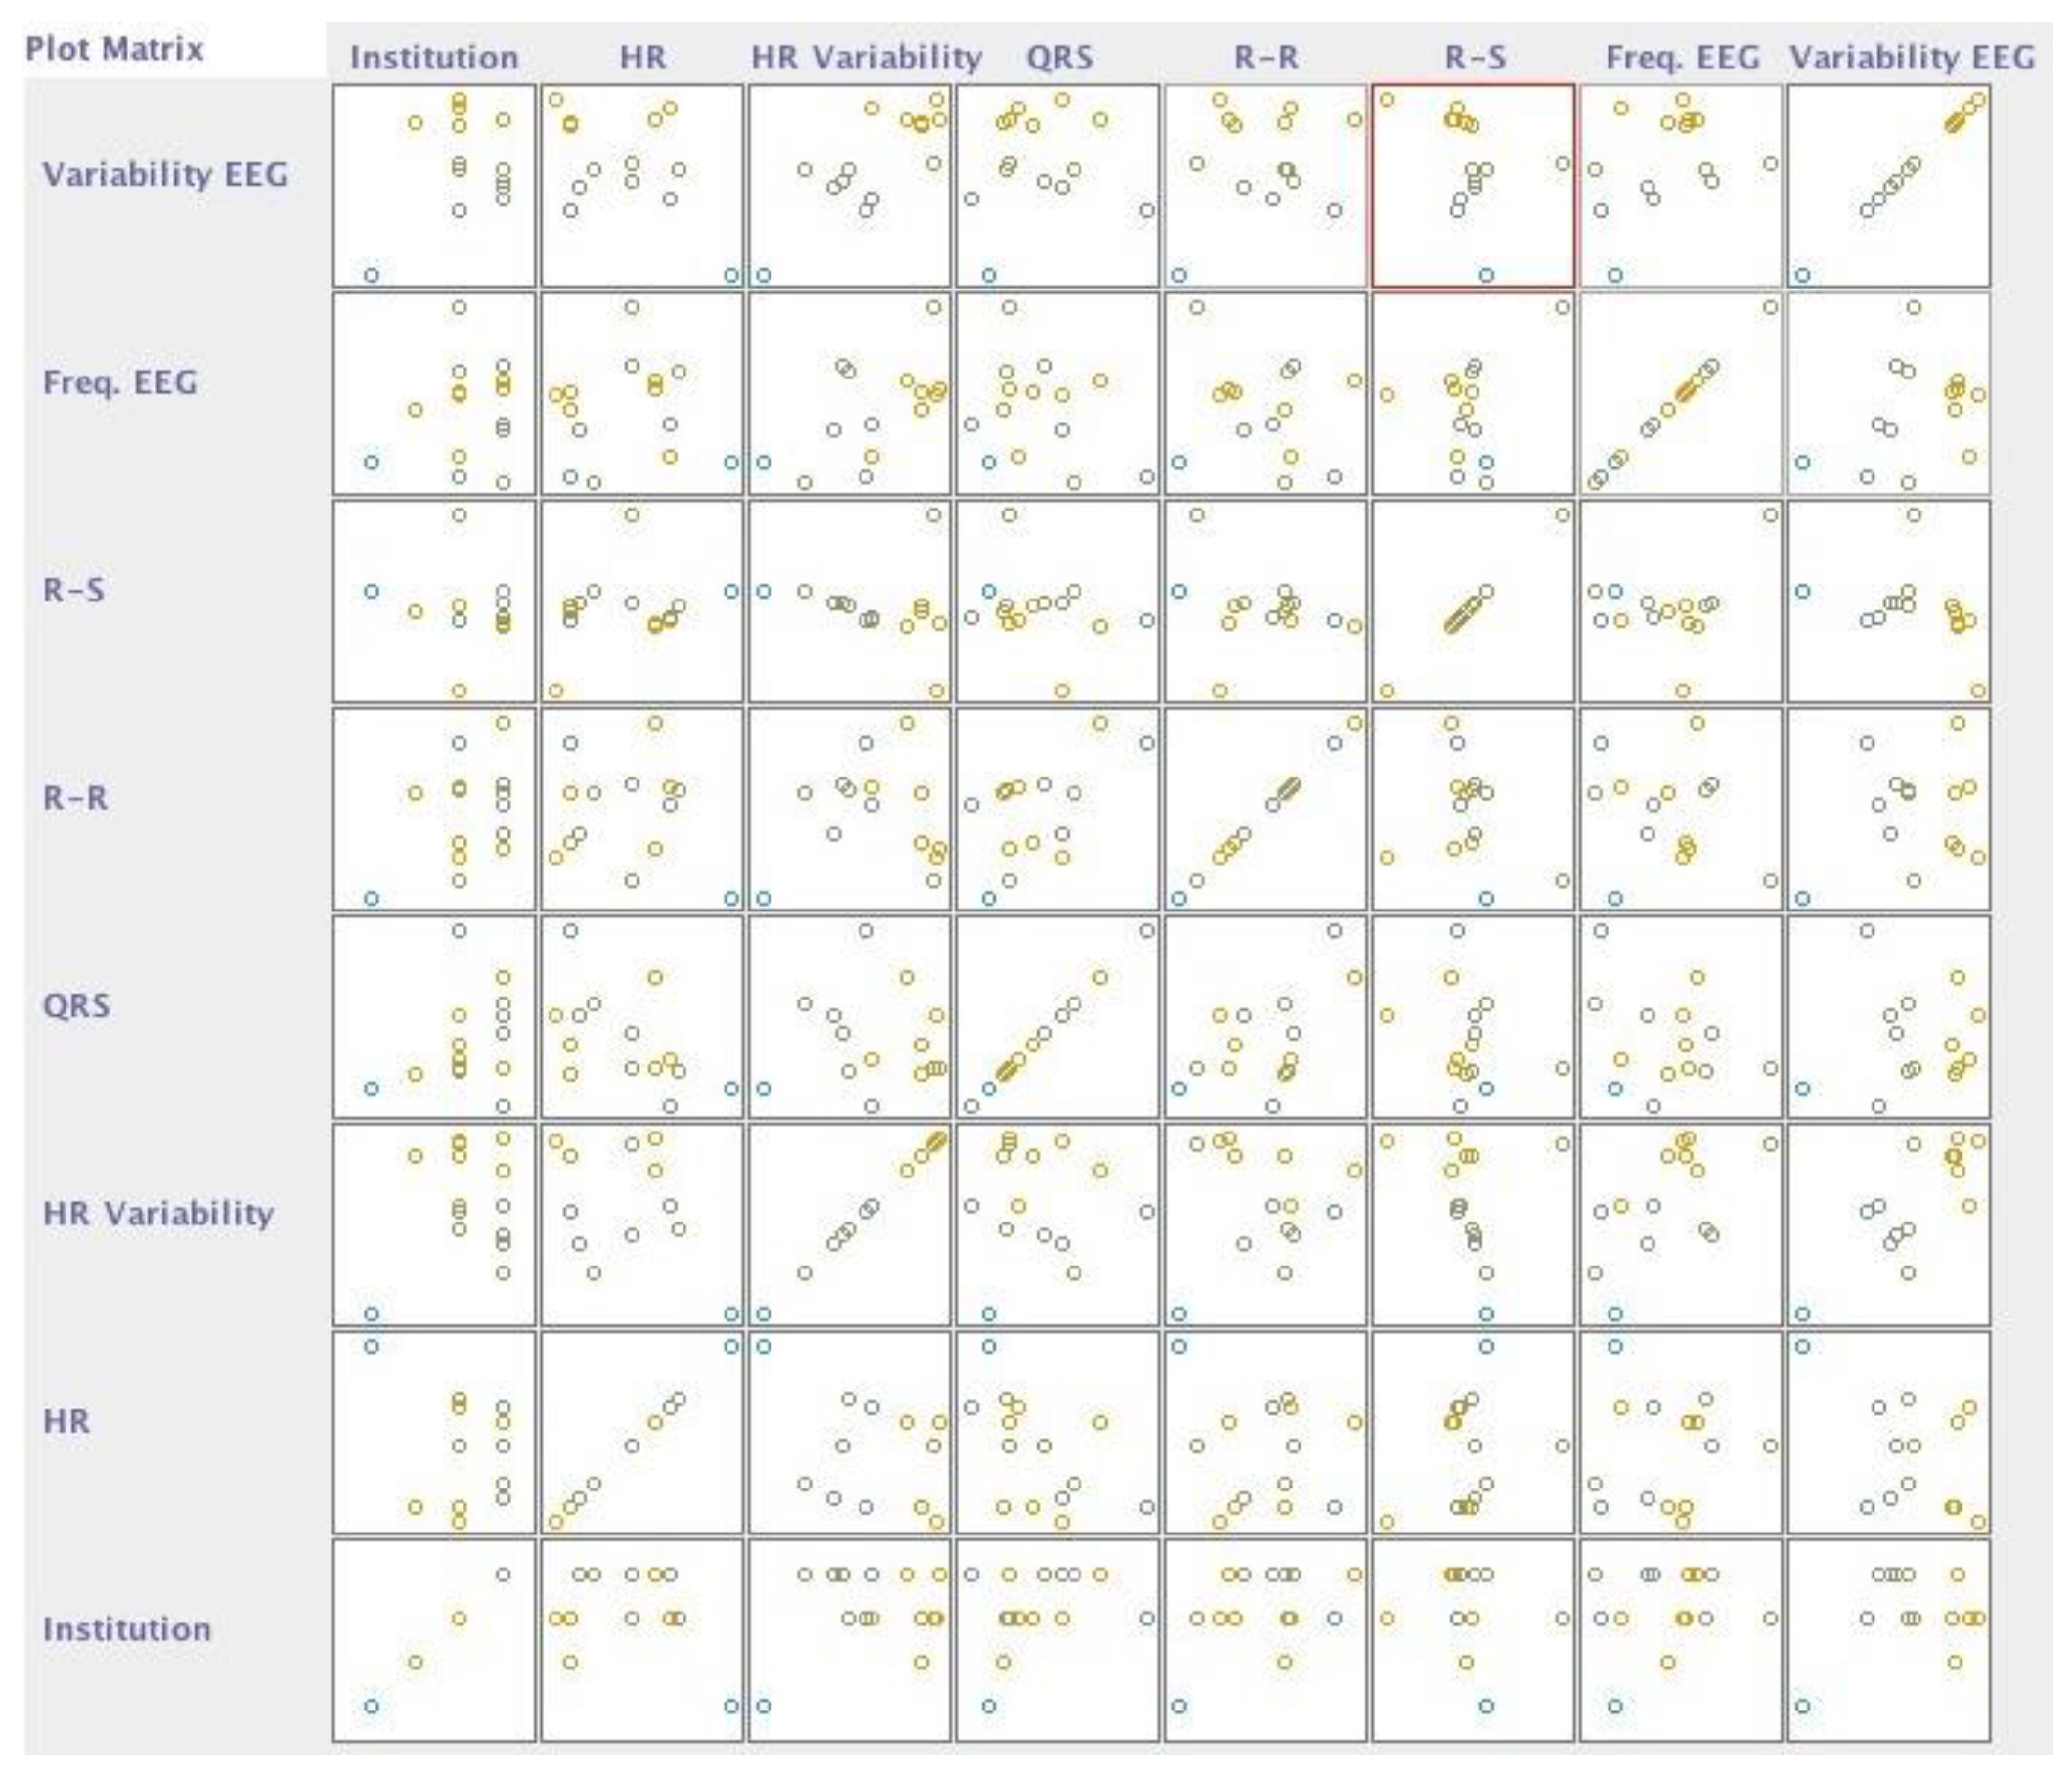
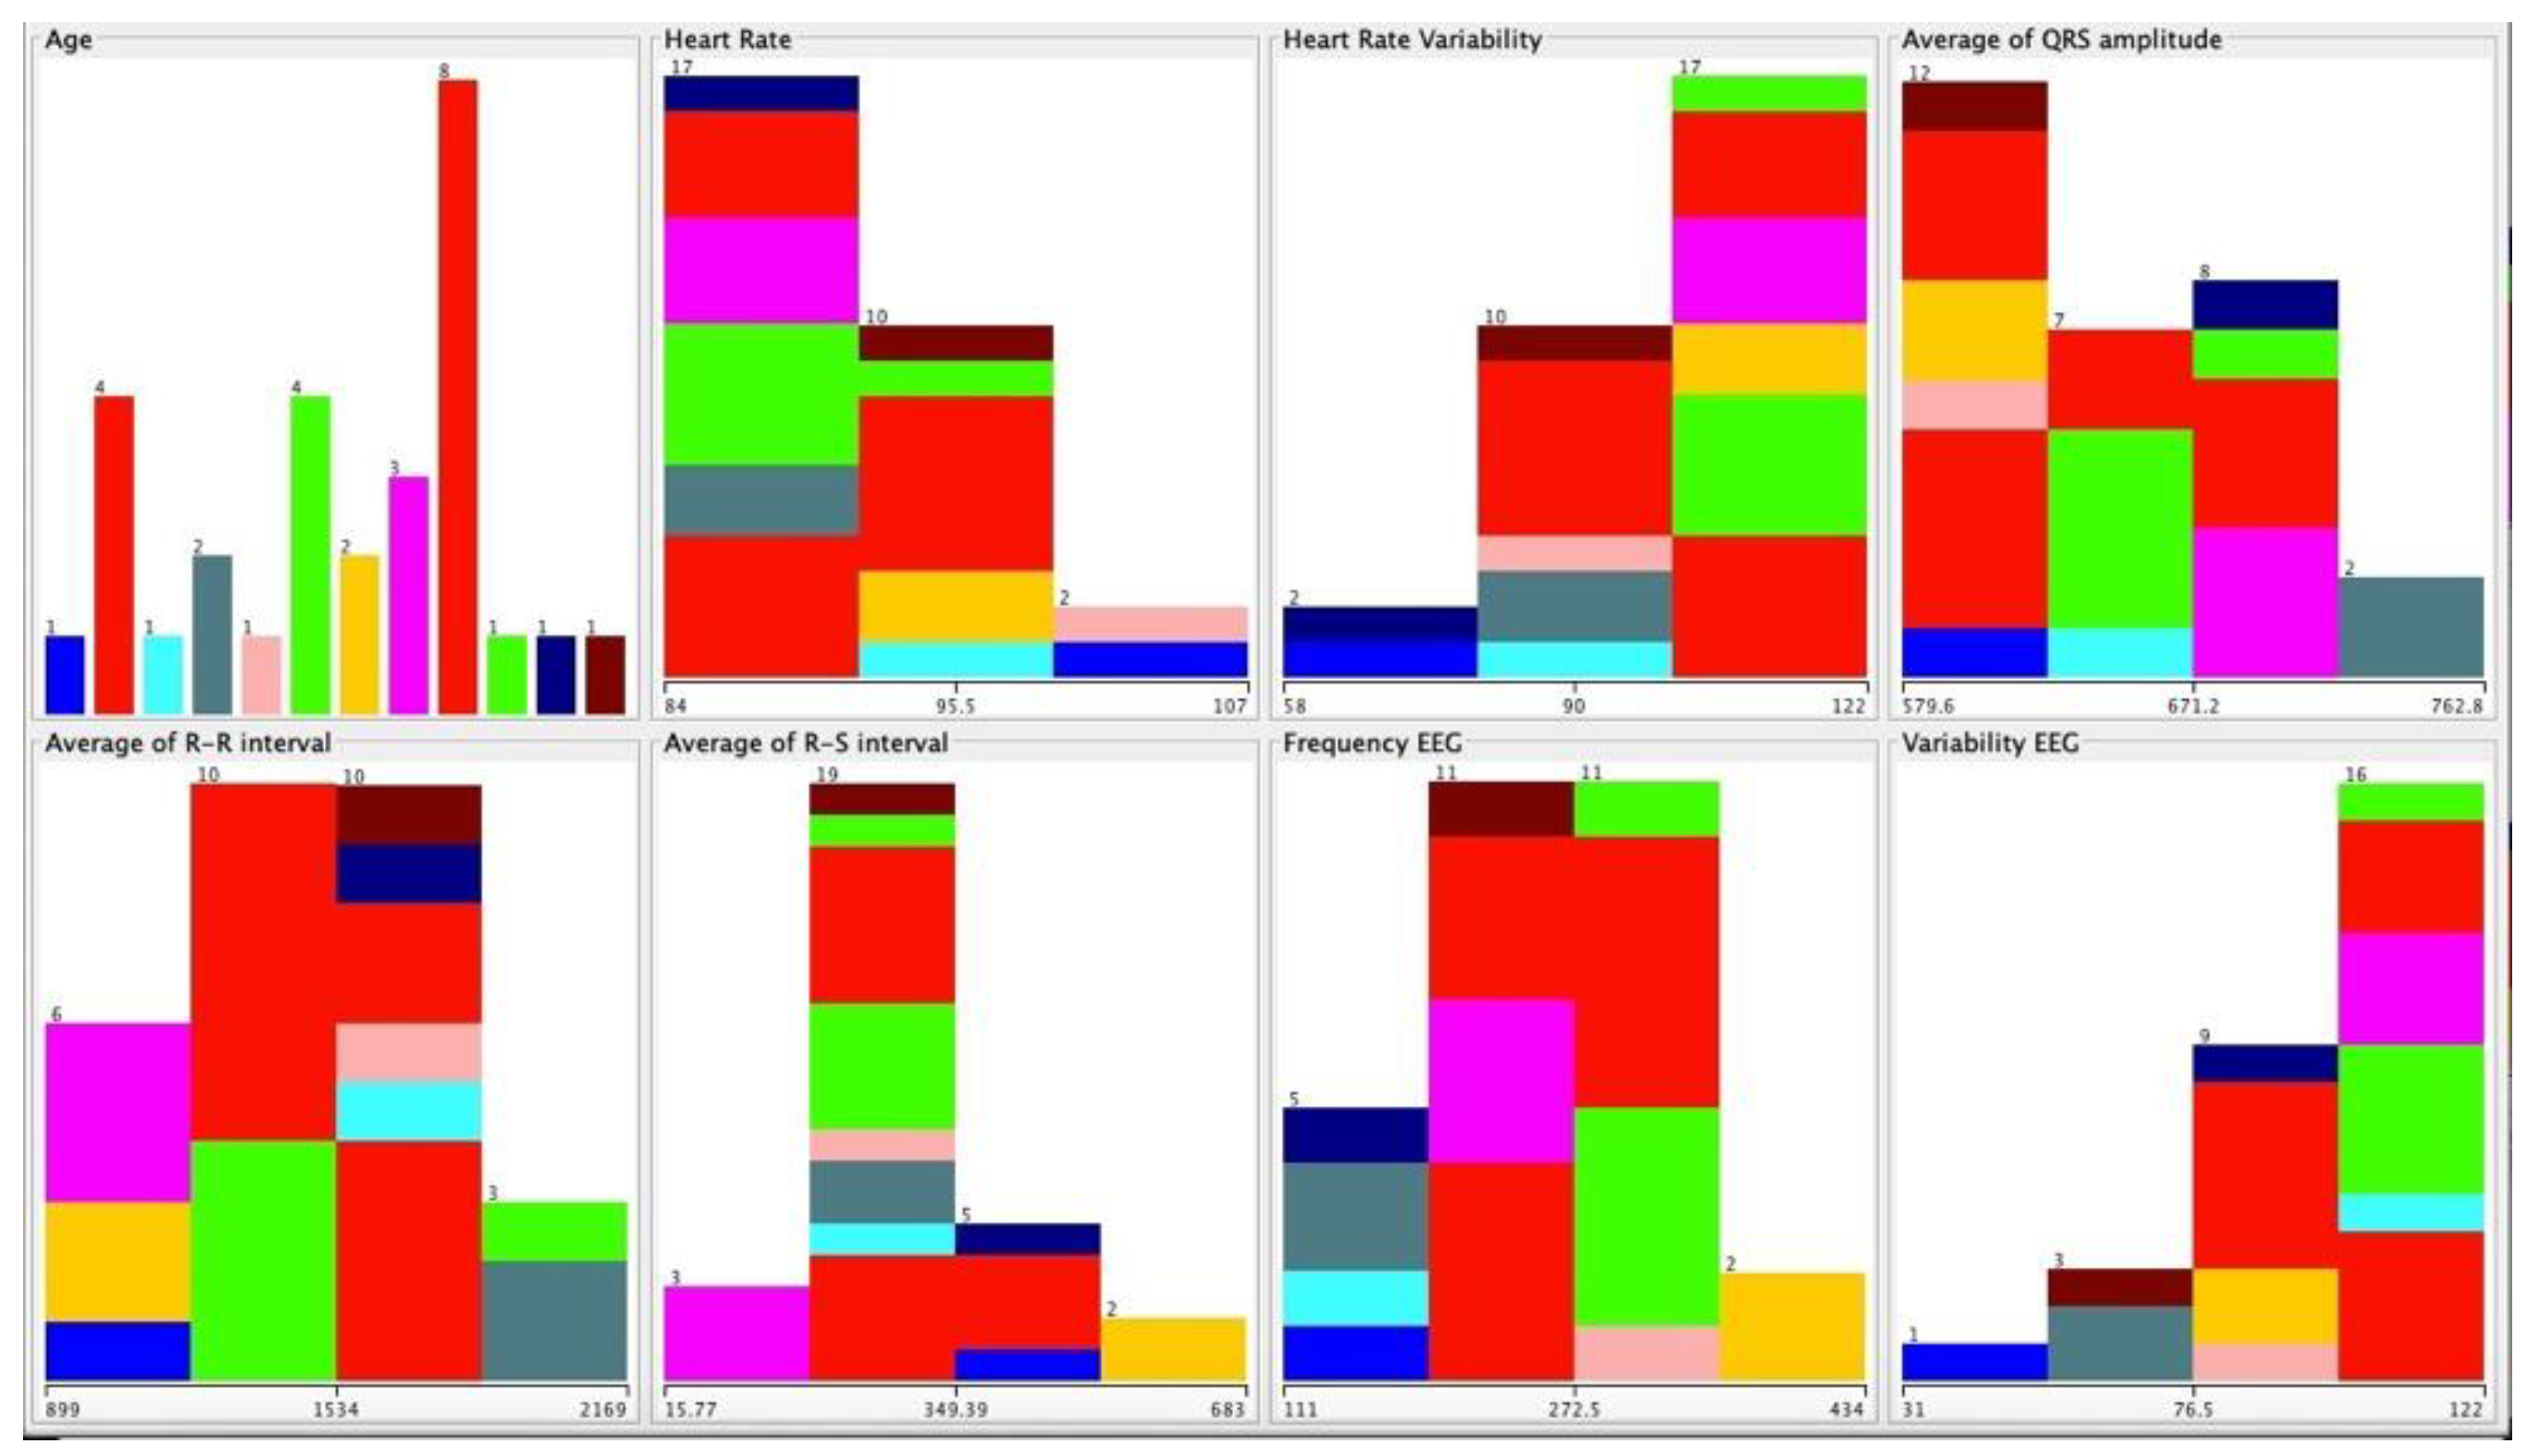
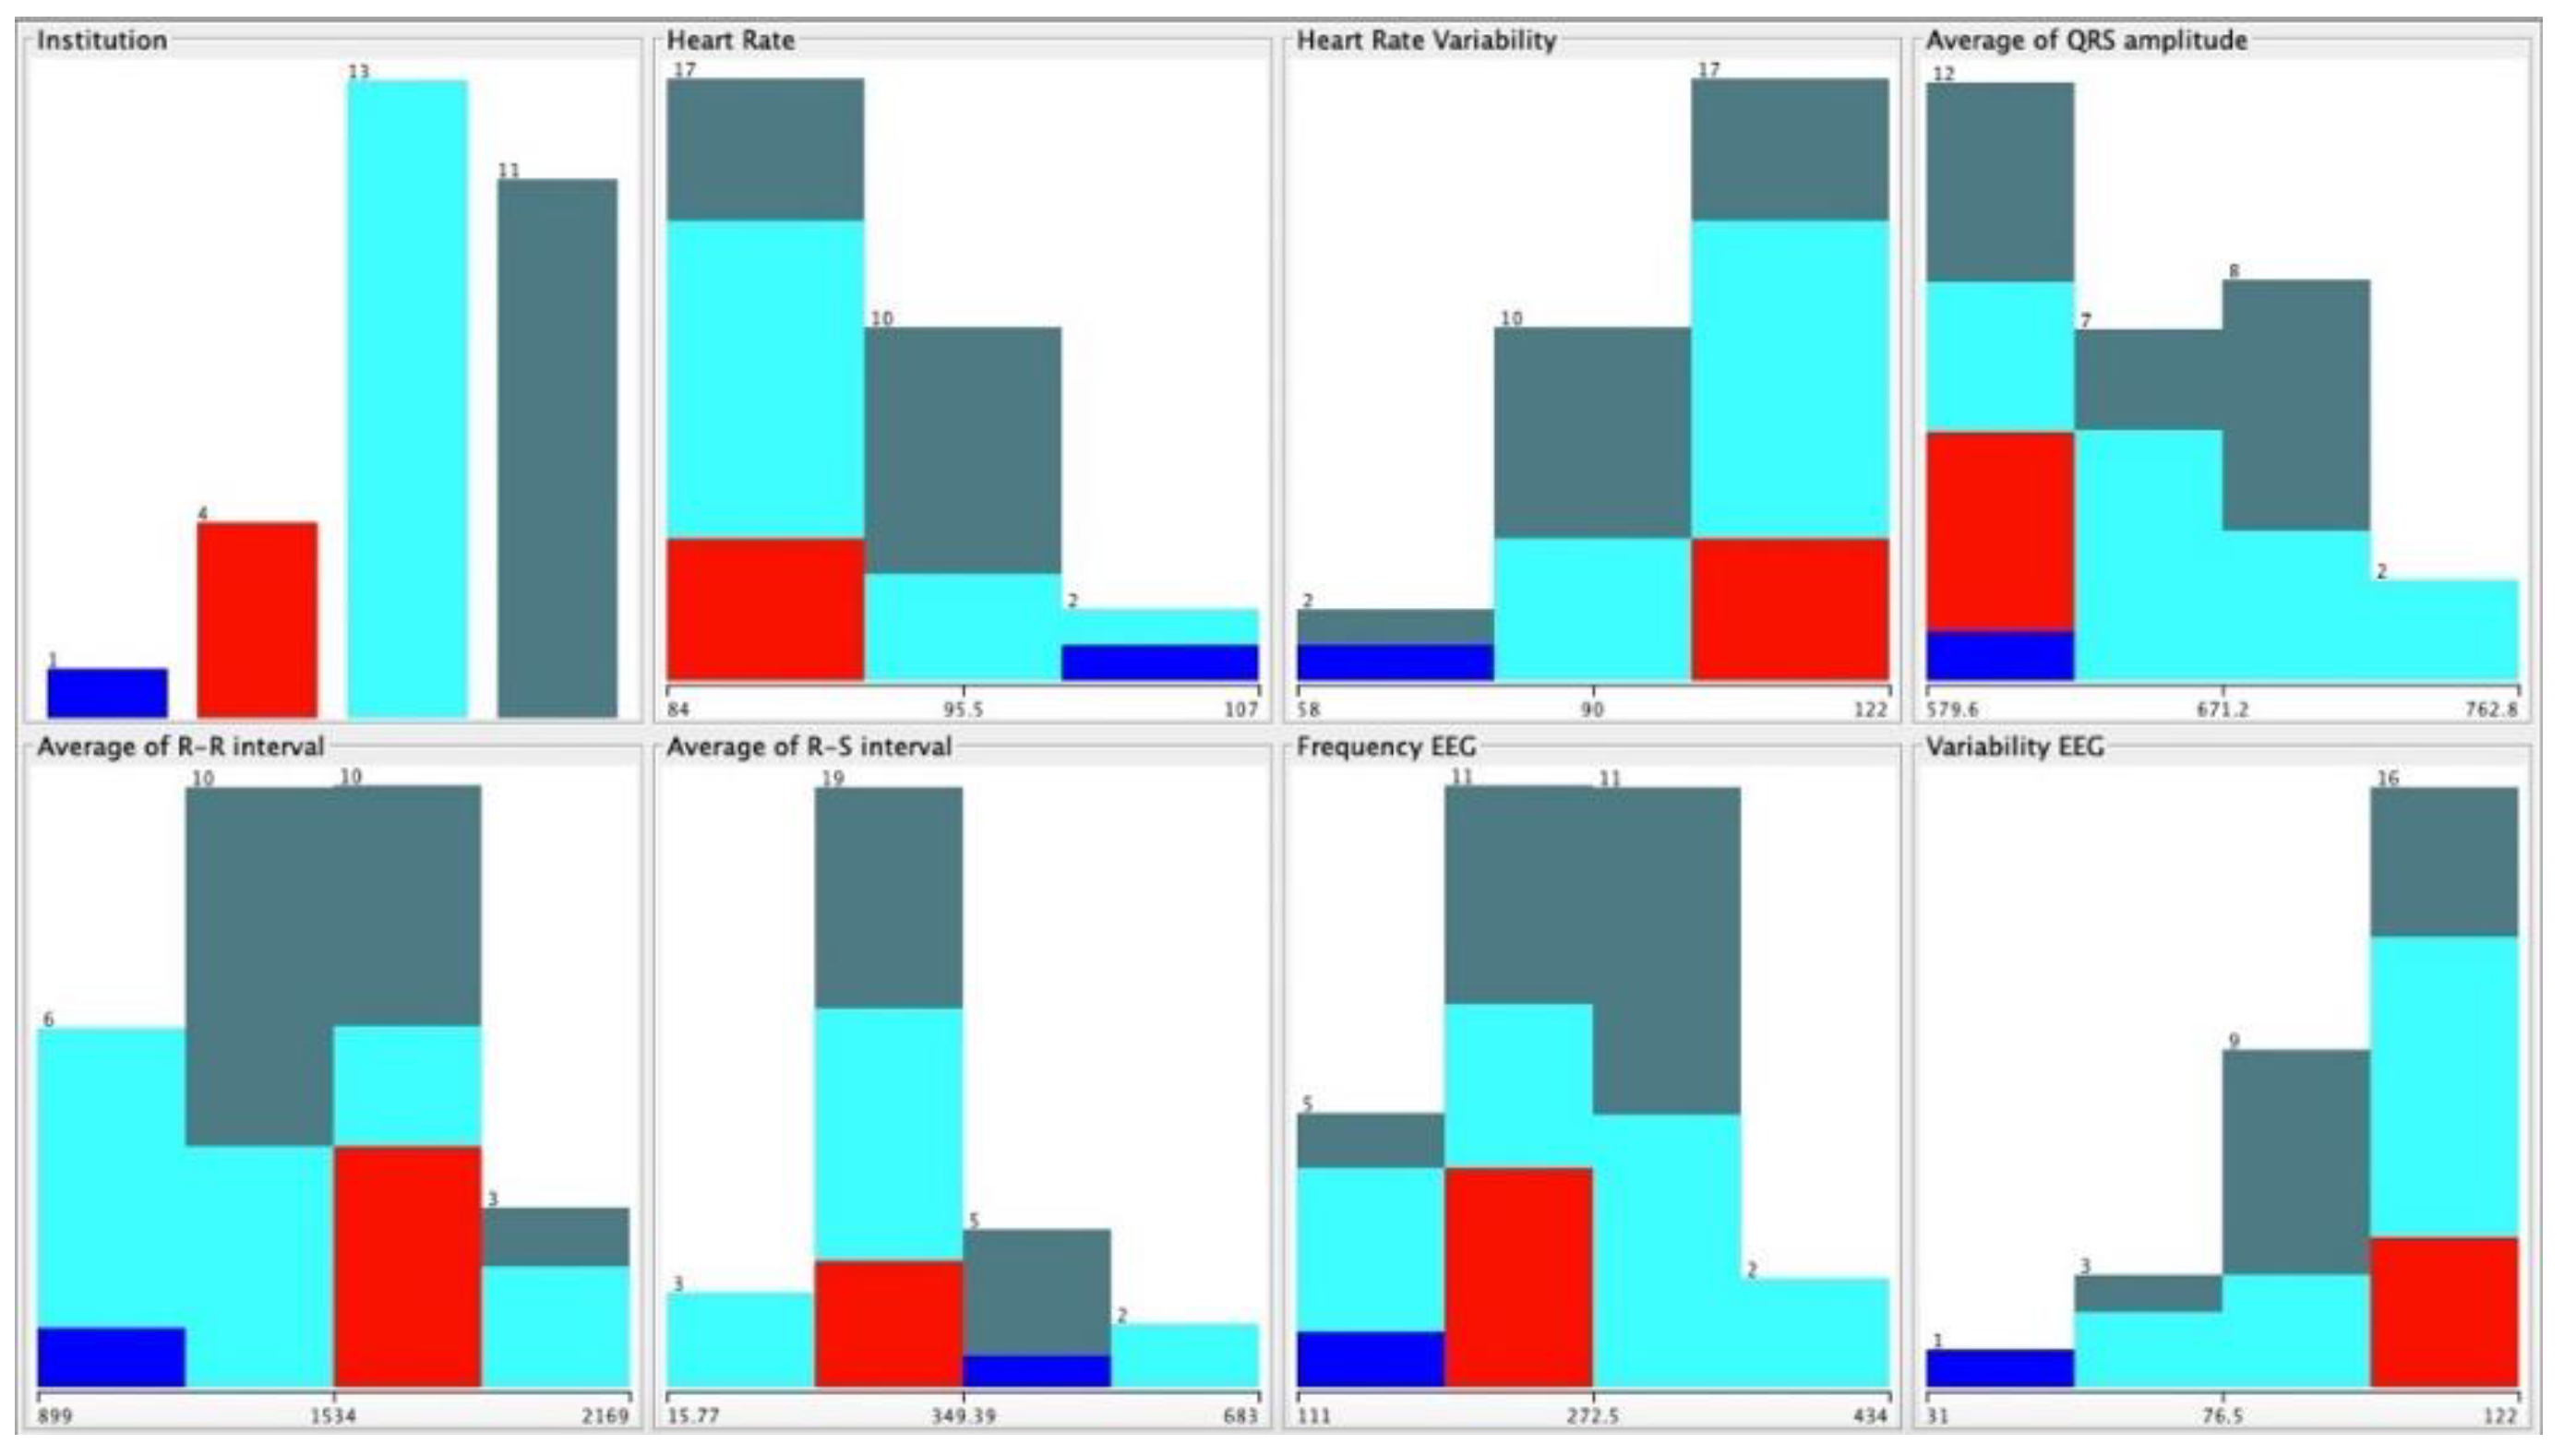
Based on the implementation of the machine learning methods described in Section 2.3 with the data separated by institution, Table 2 presents the confusion matrix of the results obtained. We verified that the records from Centro Comunitário das Lameiras were not correctly identified, but the persons from the remaining institutions were correctly identified. The data were selected with WEKA software as shown in Figure 2, presenting the classification dispersed by the different institutions (Figure 3), such as Centro Comunitário das Lameiras, Lar Minas, Lar da Misericórdia, and Lar da Nossa Senhora de Fátima.
Next, the results of the identification of the persons from the institutions performed with neural networks, as presented in Table 3, showed that the persons from Lar Minas were correctly discretized, where the persons from Centro Comunitário das Lameiras were not identified. The remaining institutions were commonly identified, reporting one record that was not correctly identified in each institution. Thus, the use of neural networks resulted in an accuracy of 93% with a precision of 89%. Moreover, the recall value was 93%, and the F1 Score was 91%.

3.2. Analysis by Age

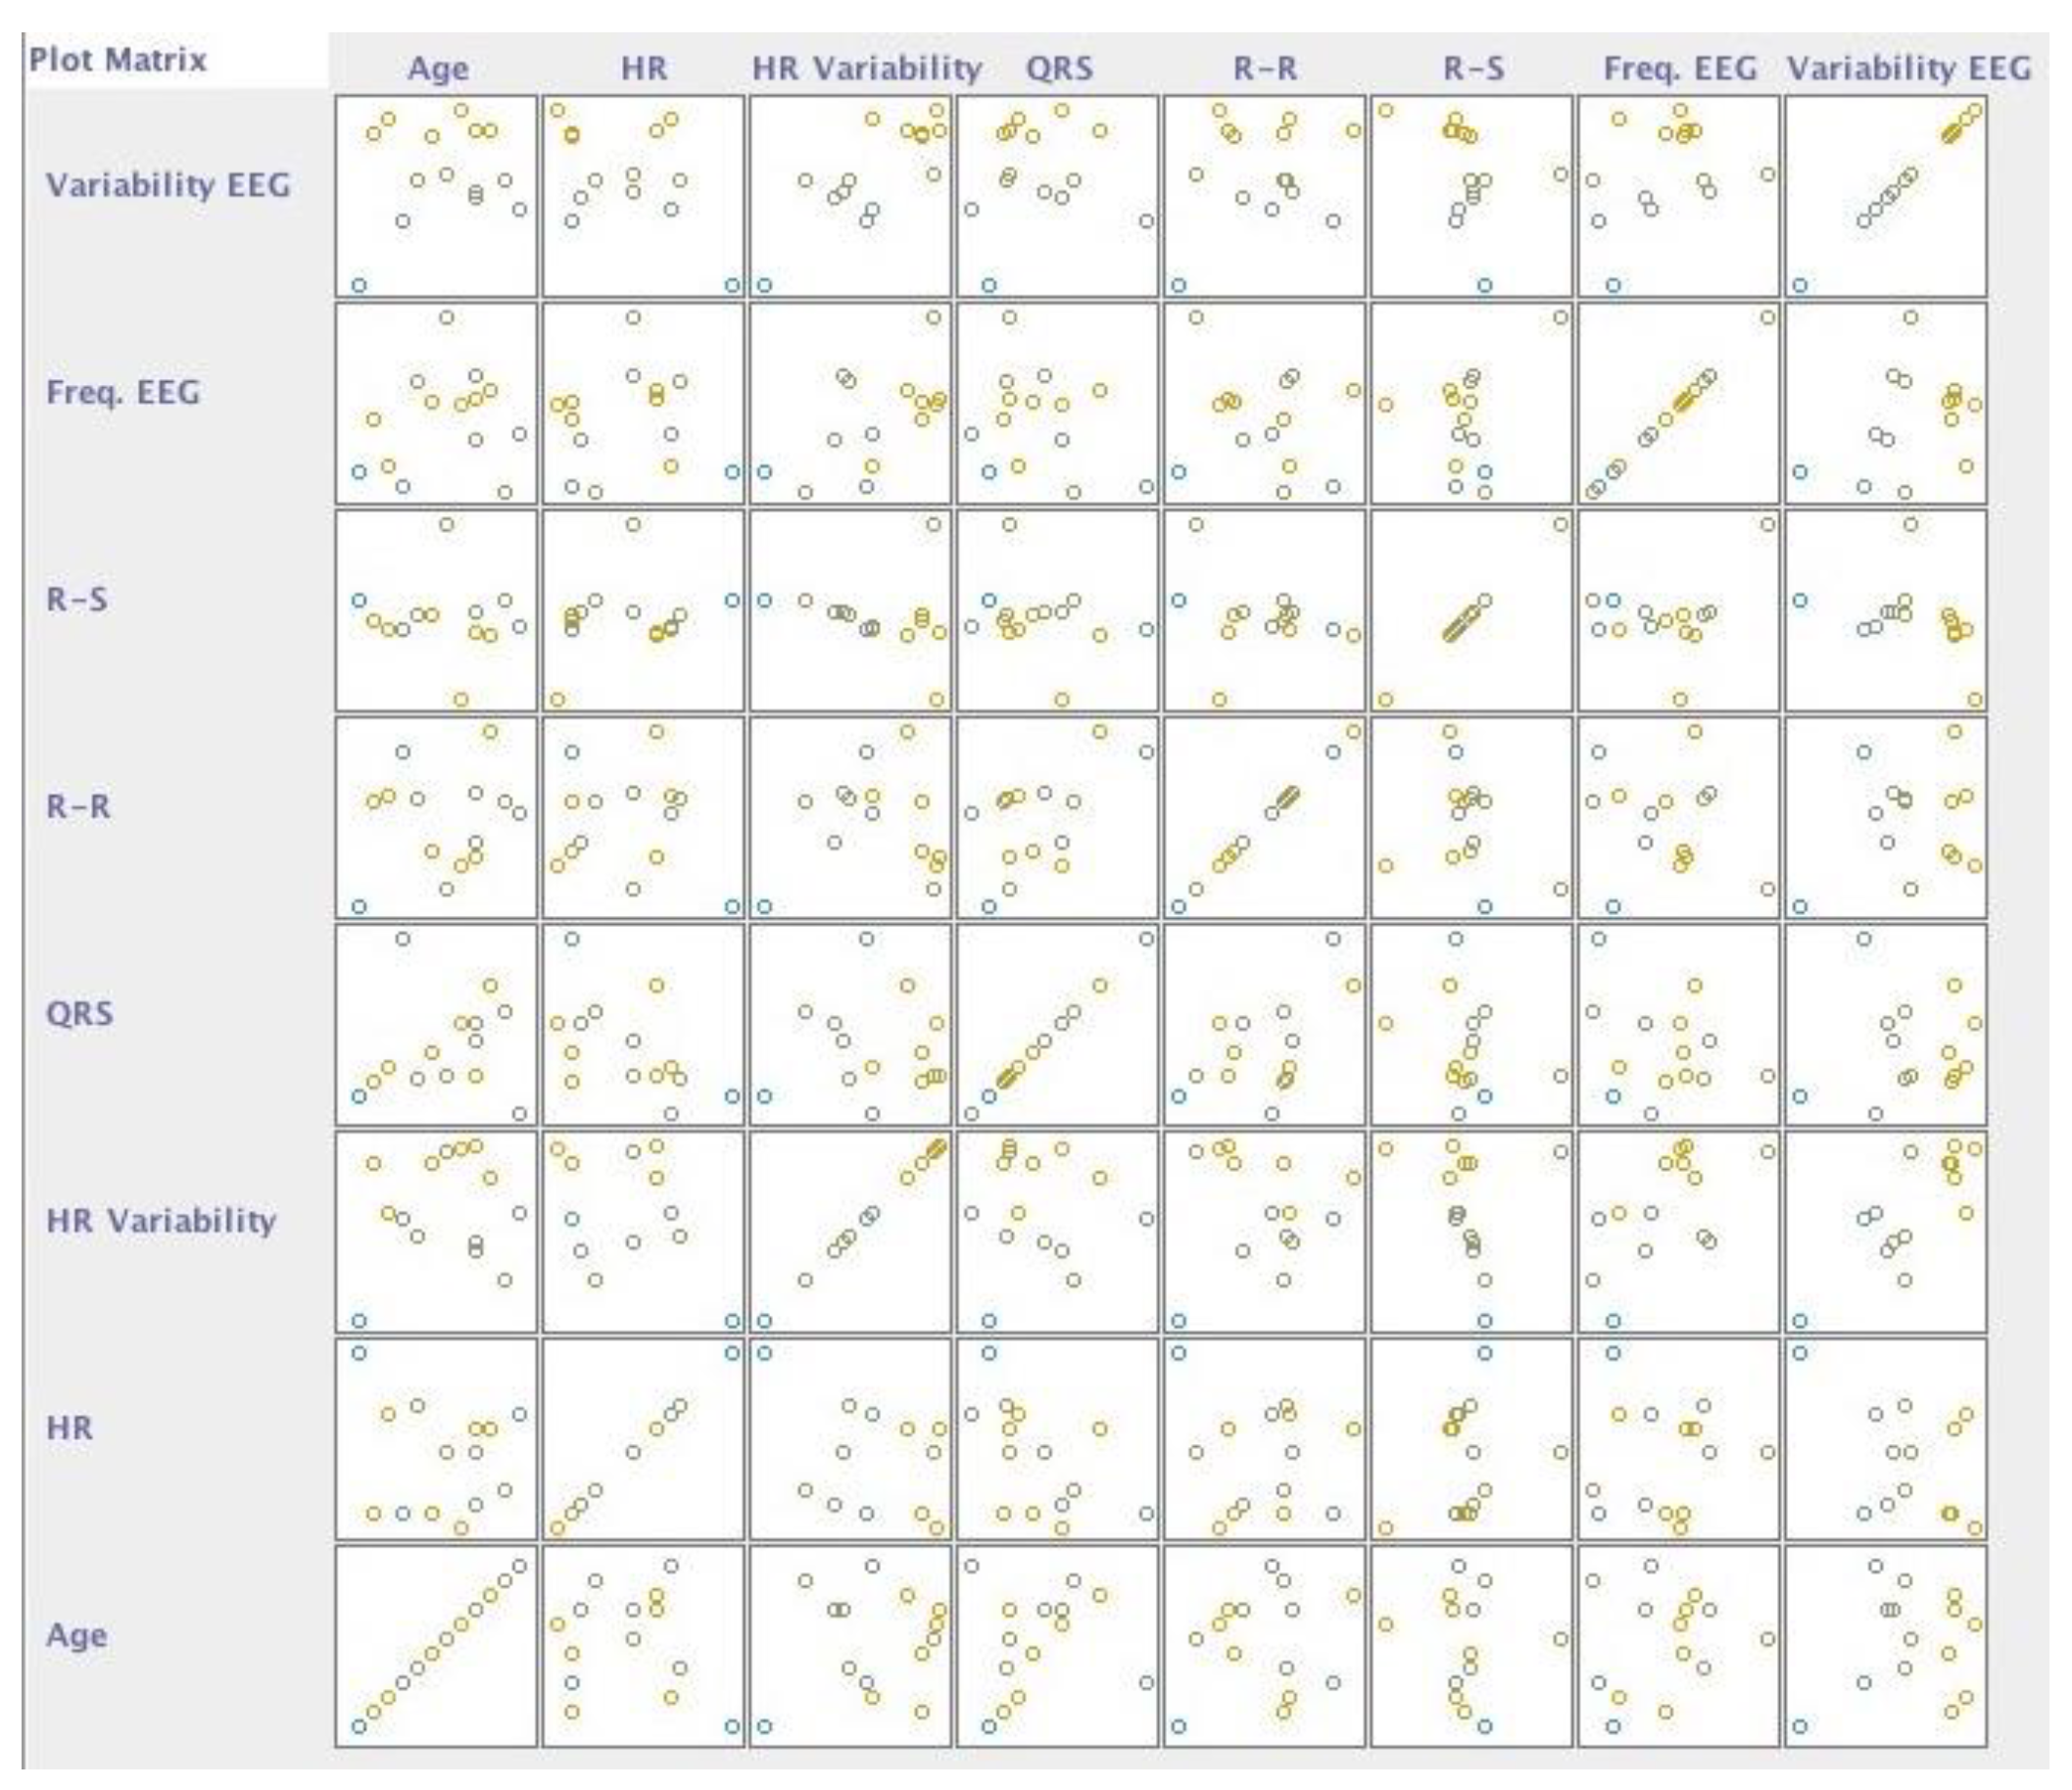
As the different institutions had different types of people, we implemented the machine learning methods with the data separated by age. Table 4 presents the confusion matrix of the results obtained. We verified that the records related to persons aged 74, 85, and 86 years old were not correctly identified. The data were selected with WEKA software as presented in Figure 4, showing the classification dispersed by the different ages in the following order (Figure 5): 85, 84, 88, 76, 86, 83, 81, 89, N/D, 97, 71, and 74.
Next, the results of the identification of the persons by age performed with neural networks, as presented in Table 5, showed that the 74 years-old people were not correctly identified at all. Concerning the 85 and 86 years-old, only 50% of the cases were correctly identified. Finally, the method reported an accuracy of 95%, precision of 96%, recall value of 95%, and F1 score of 95%.

3.3. Analysis by Diseases

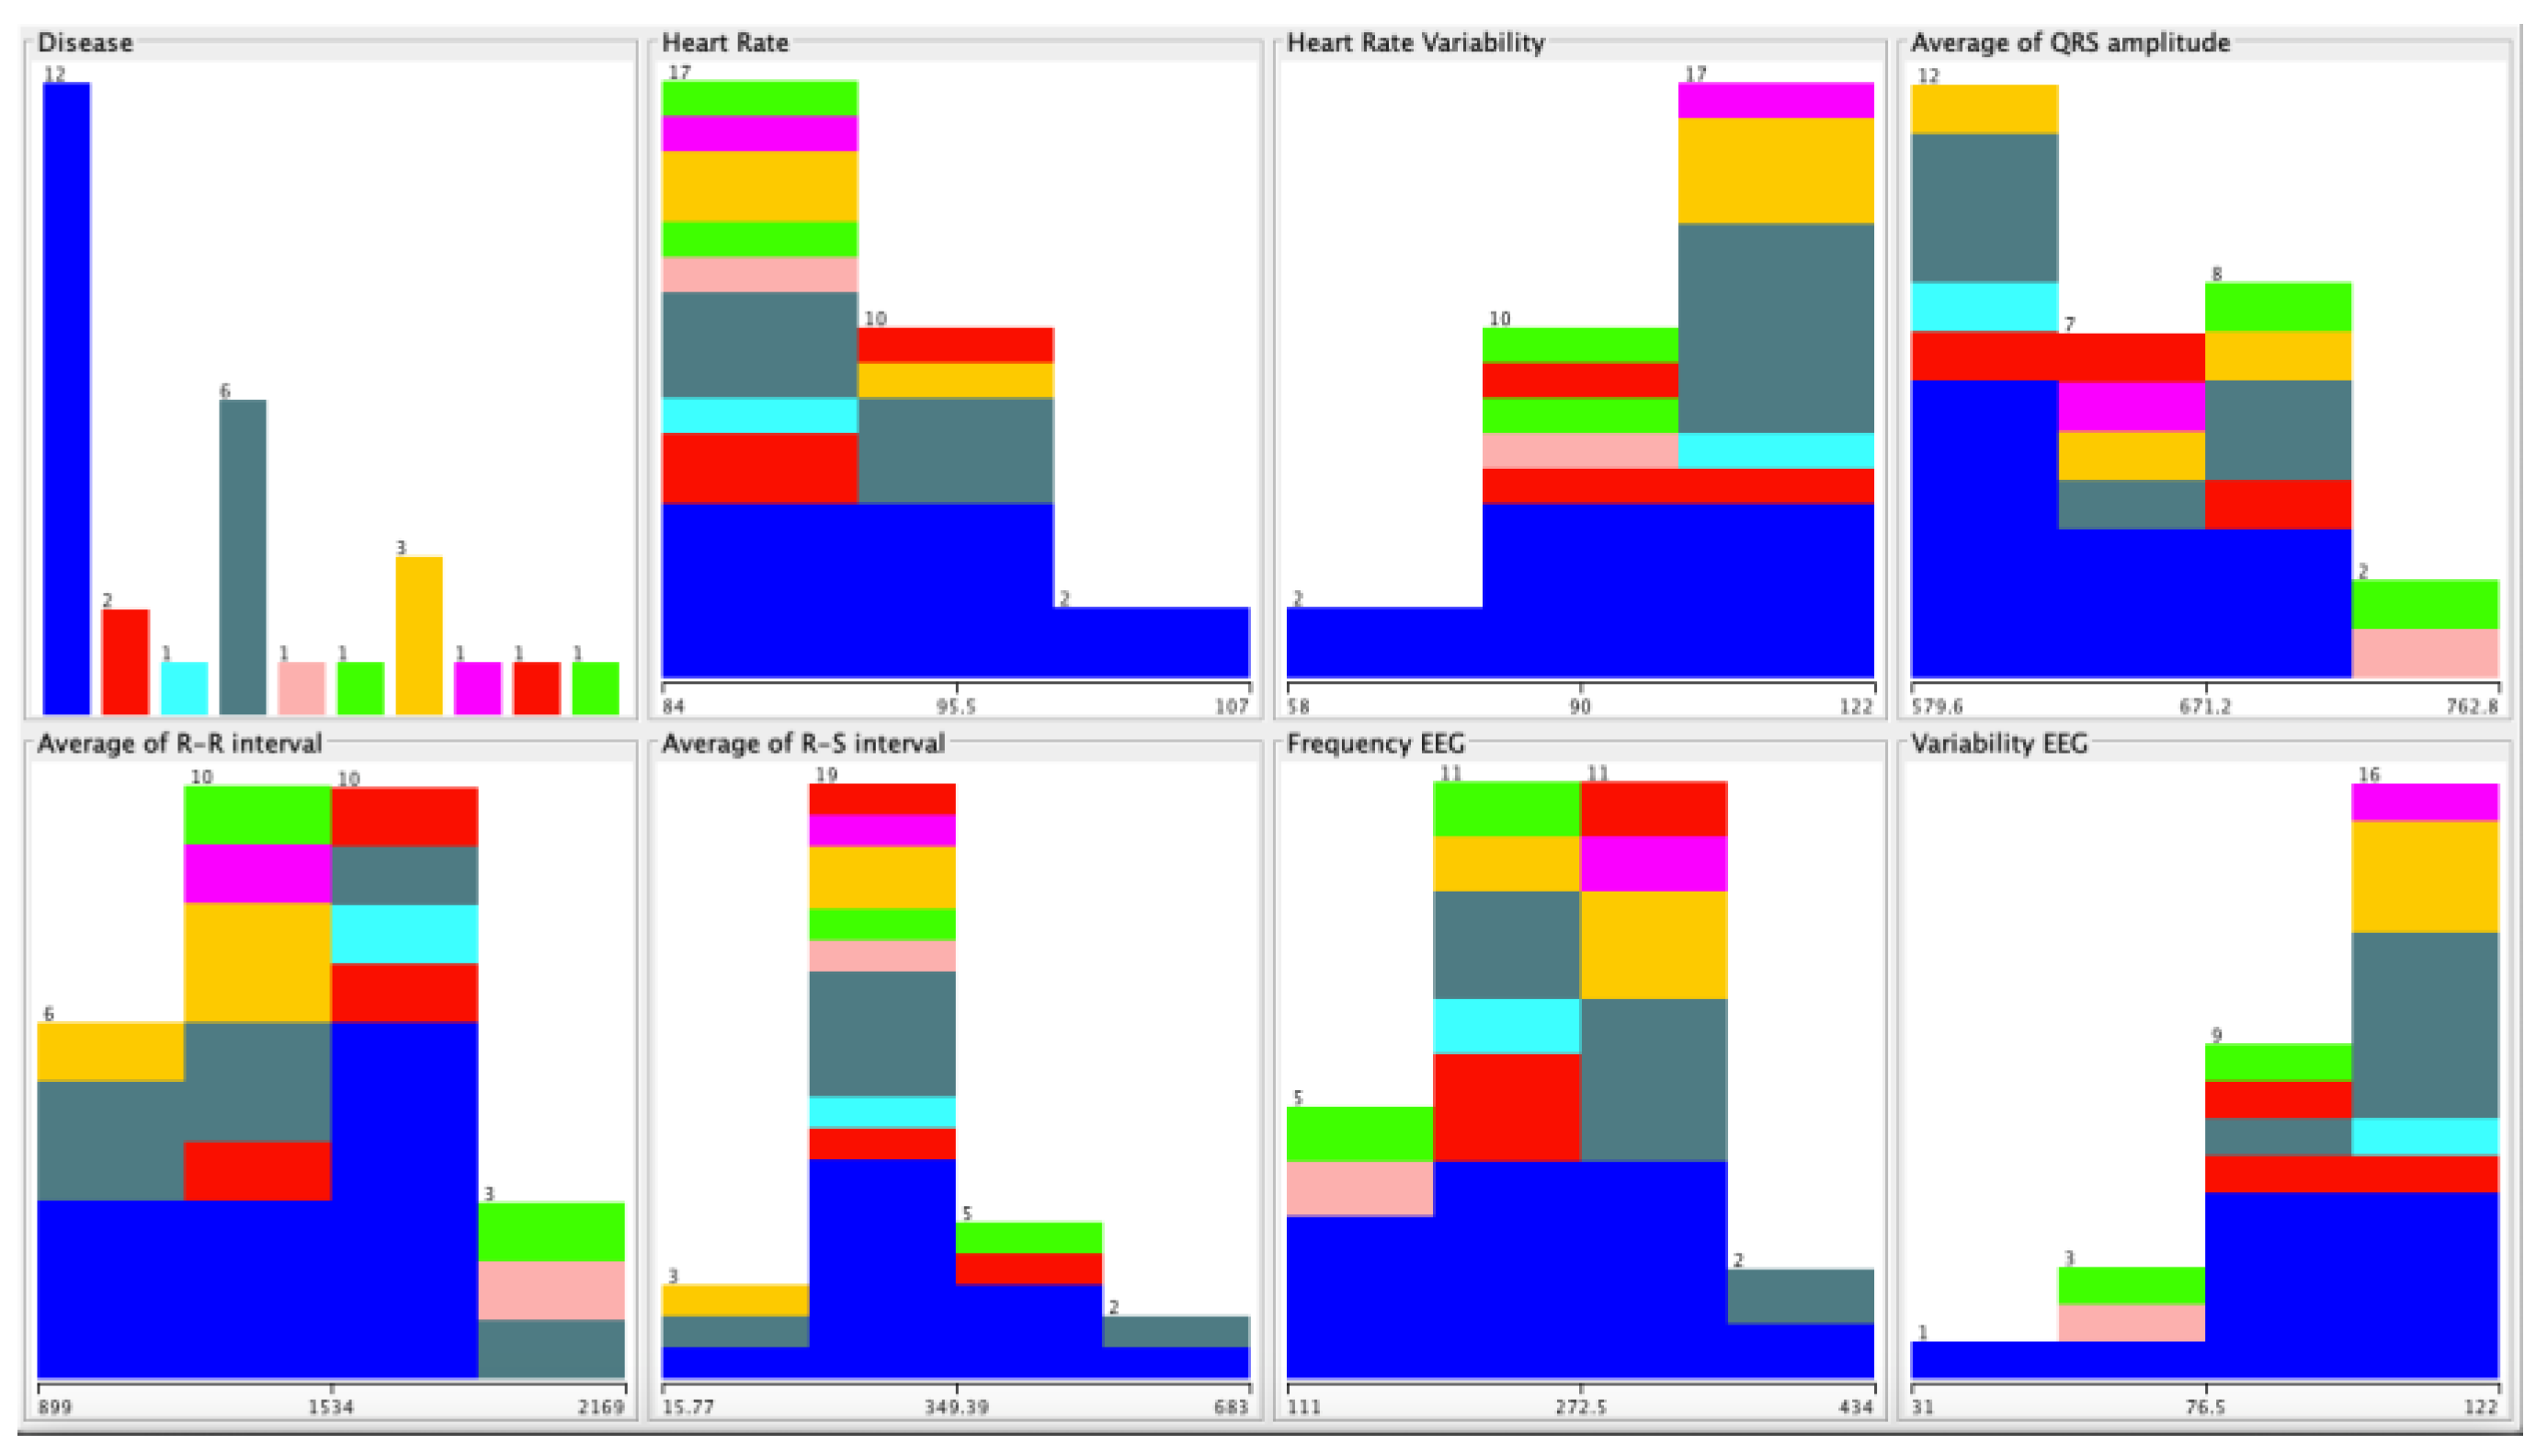
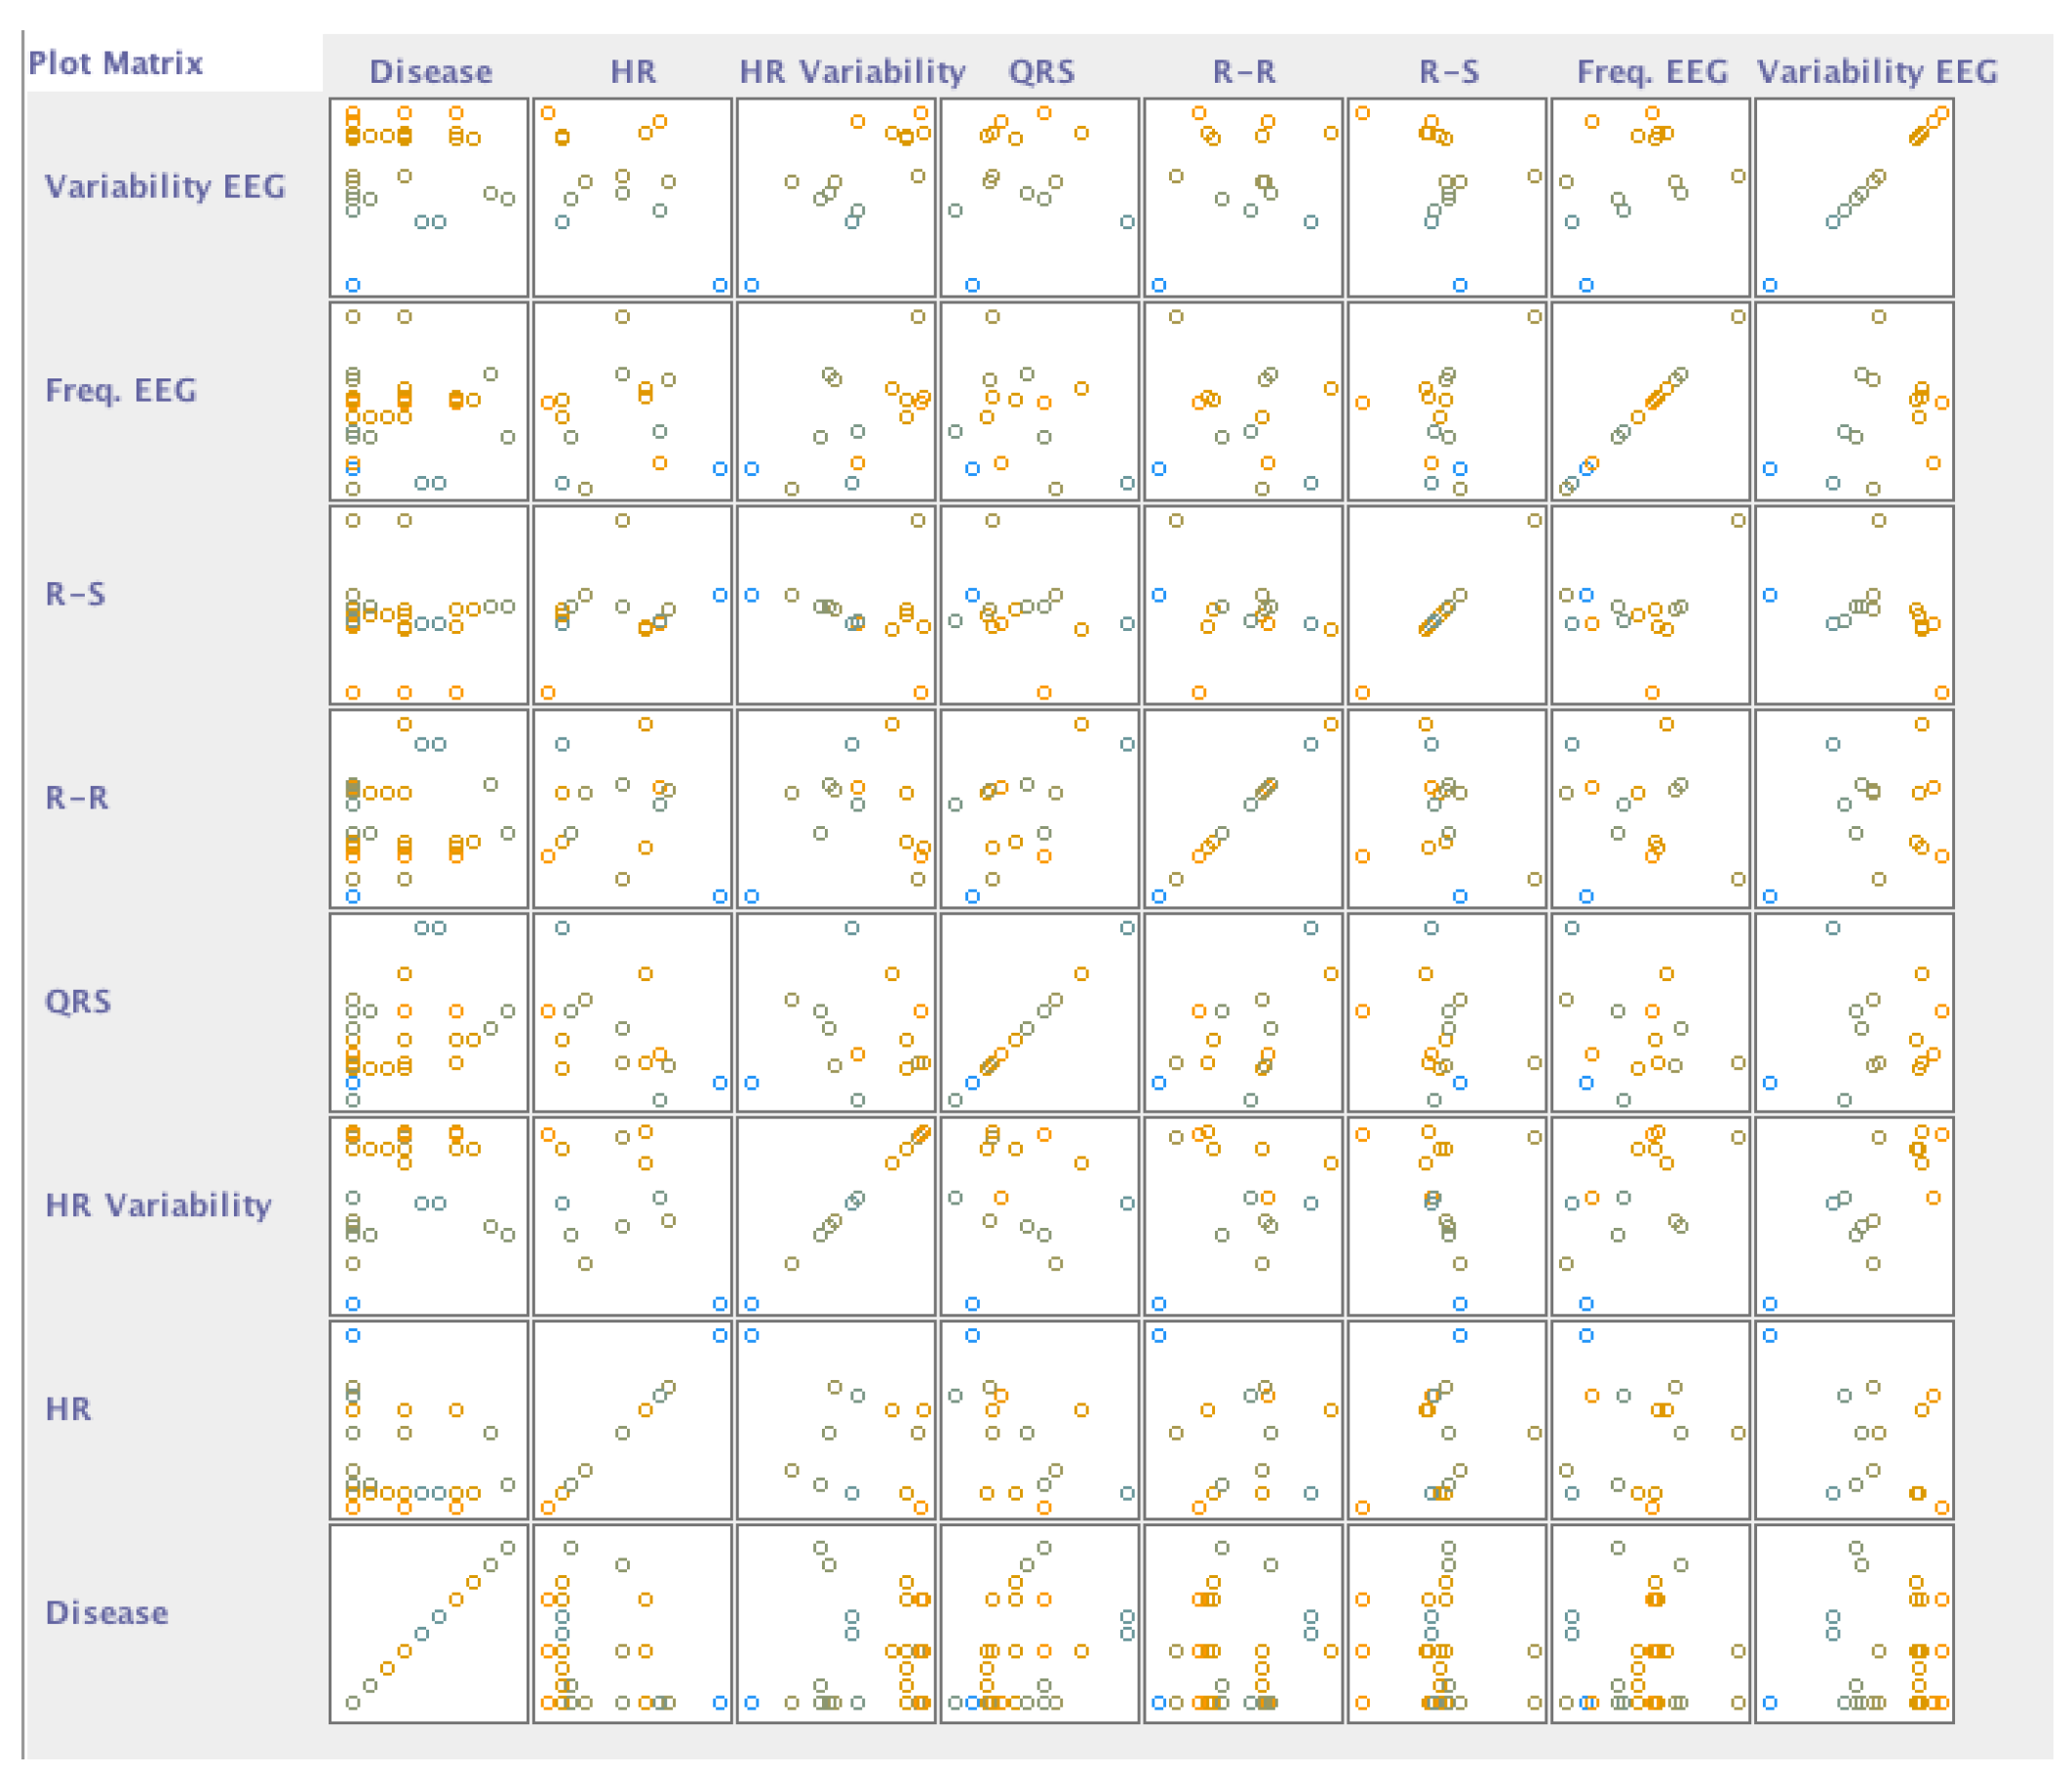
The subjects of this study had different diseases, and we verified, with the implementation of neural networks, which disorders did not correlate with the different acquired data. We confirmed that this was because we had a limited number of persons with each disease. However, the negative cases were correctly identified, reporting an accuracy between 89% and 98%, as shown in Table 6. The data were selected with WEKA software as presented in Figure 6, showing the classification dispersed by the different diseases in the following order (Figure 7): arterial hypertension, cardiac arrhythmia, arteriosclerotic coronary disease, heart failure, Parkinson’s disease, post-traumatic stress, depression, sequelae of surgery to brain injury, dementia of vascular etiology, and acute myocardial infarction.

3.4. Analysis by Group of Diseases

As previously verified, there was no correlation between the values acquired from the ECG and EEG sensors and the different diseases. Therefore, we grouped the different disorders by categories, such as osteoarticular diseases, cardiovascular diseases, lung diseases, neurological and balance diseases, psychiatric illnesses, nephro-urological diseases, digestive system and abdominal wall diseases, and metabolic disorders, as presented in Table 7.
After the grouping of different diseases, the neural networks were applied to the various records grouped by diseases. As shown in Table 8, the results improved. The identification of persons with cardiovascular diseases had an accuracy of 51%. As in the case of the detection of isolated diseases, the negative cases were correctly identified, reporting an accuracy between 51% and 98%.
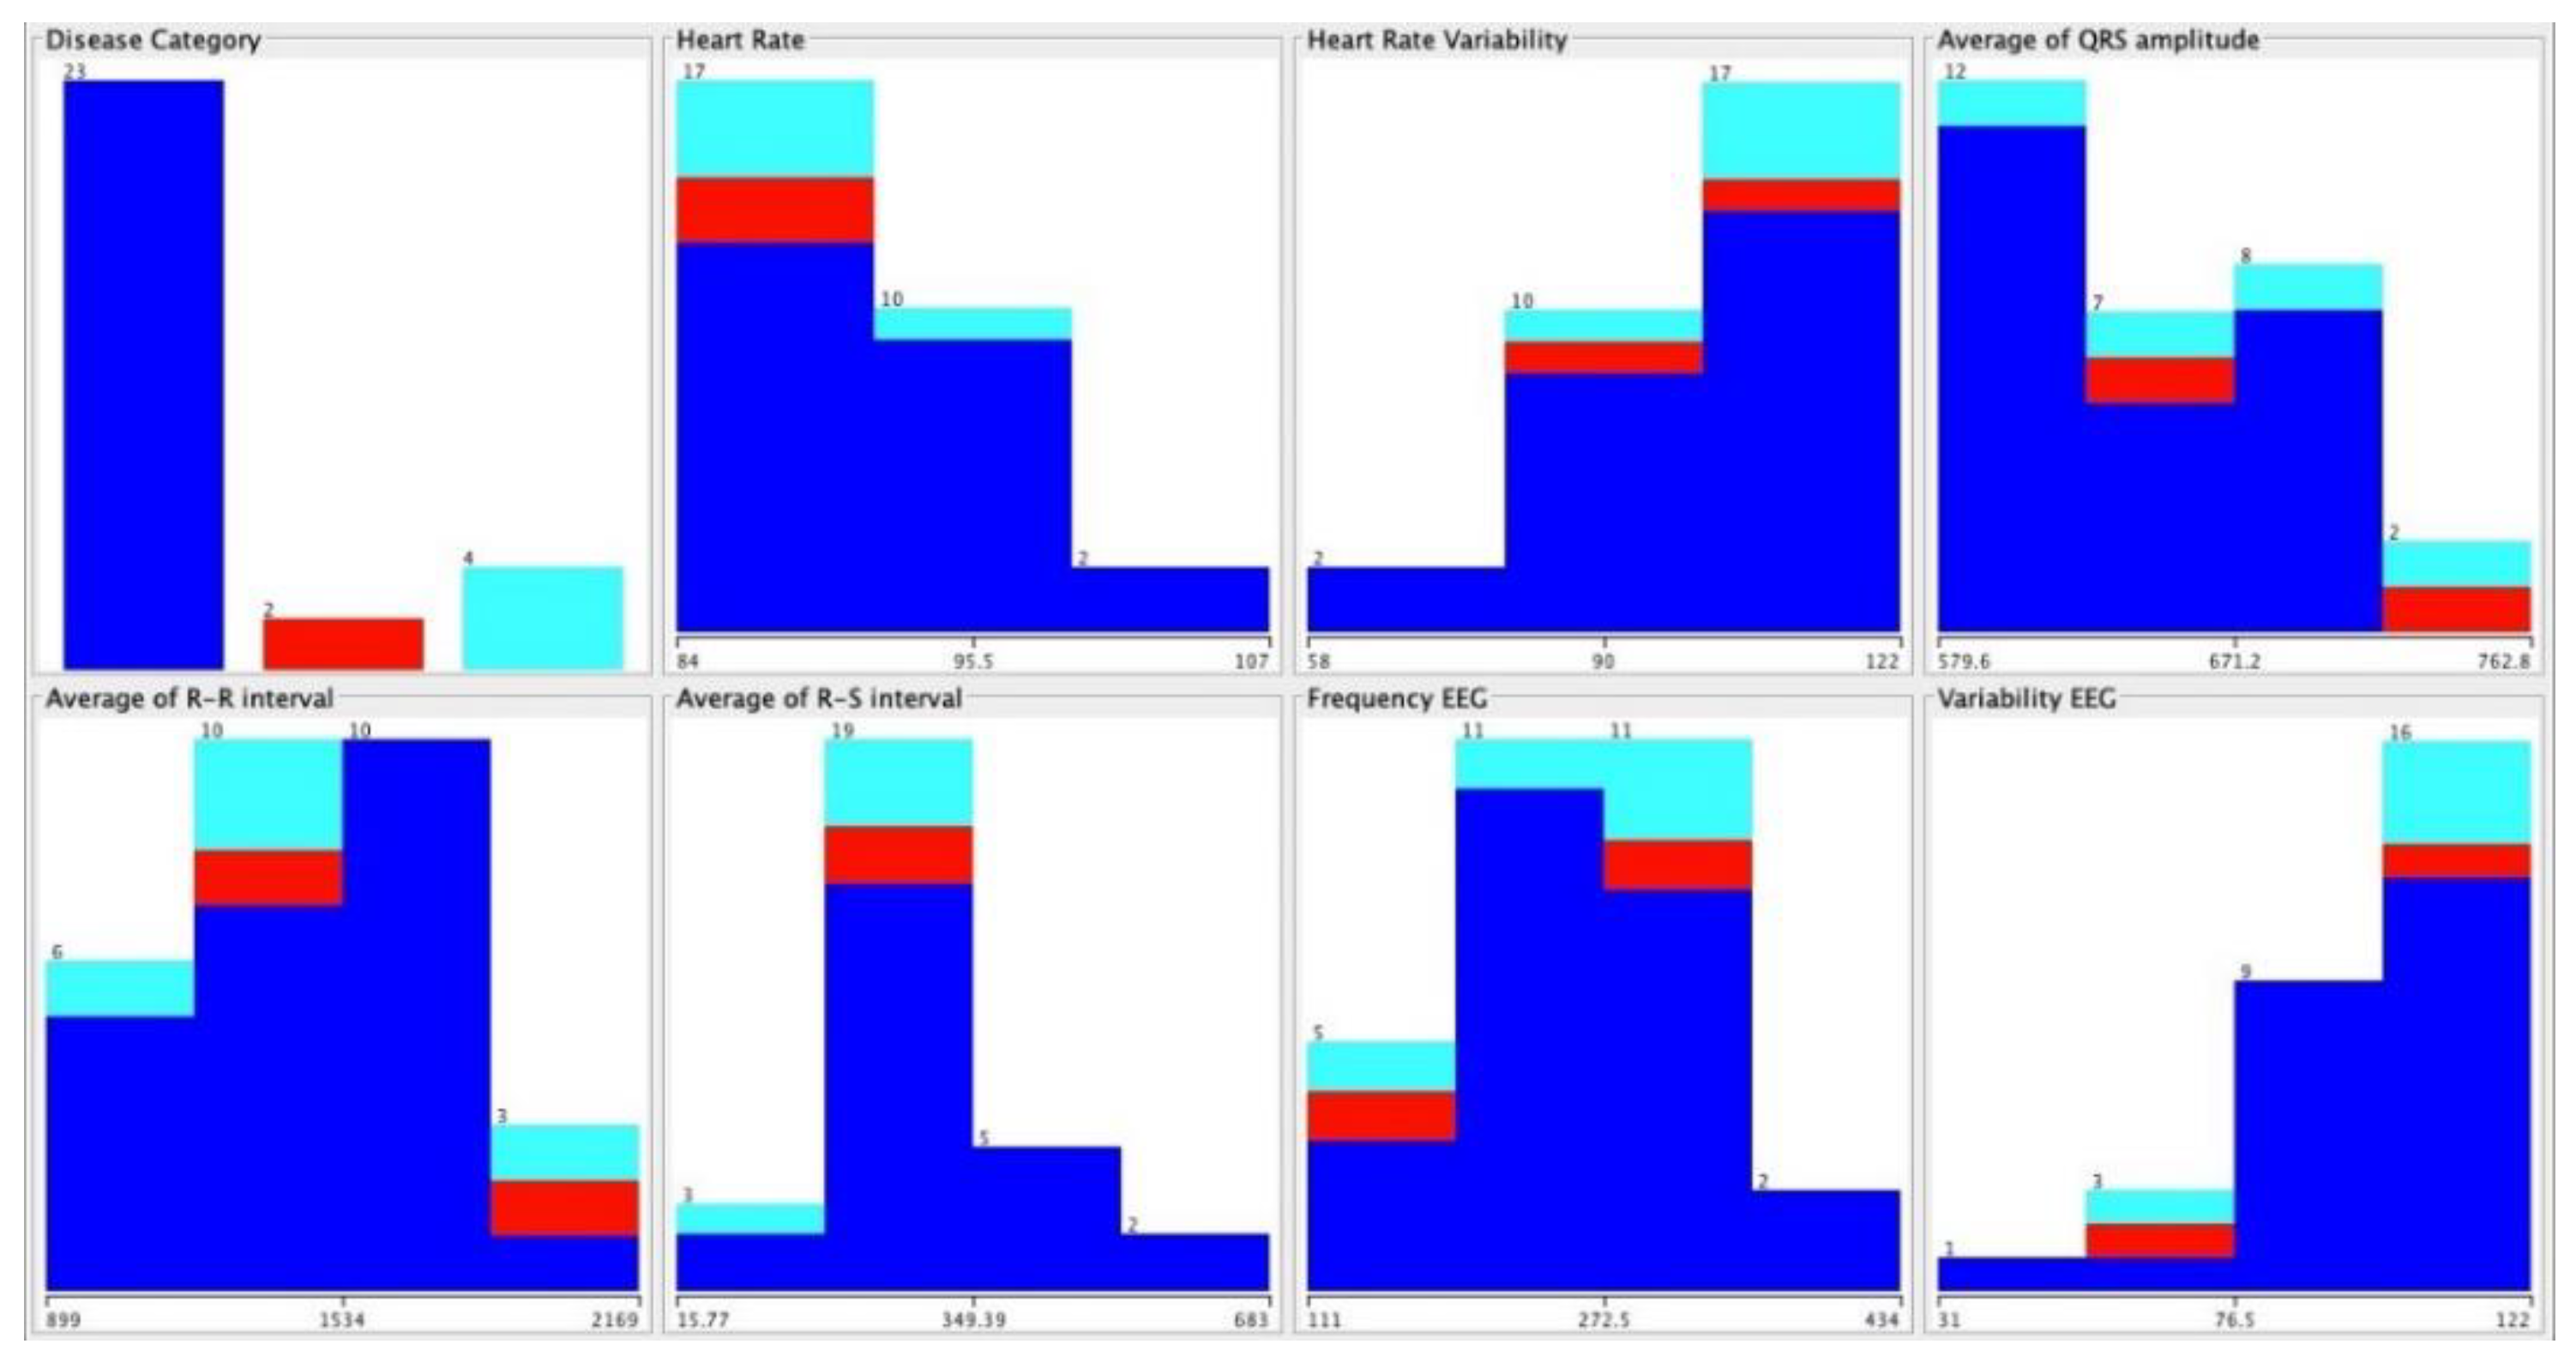
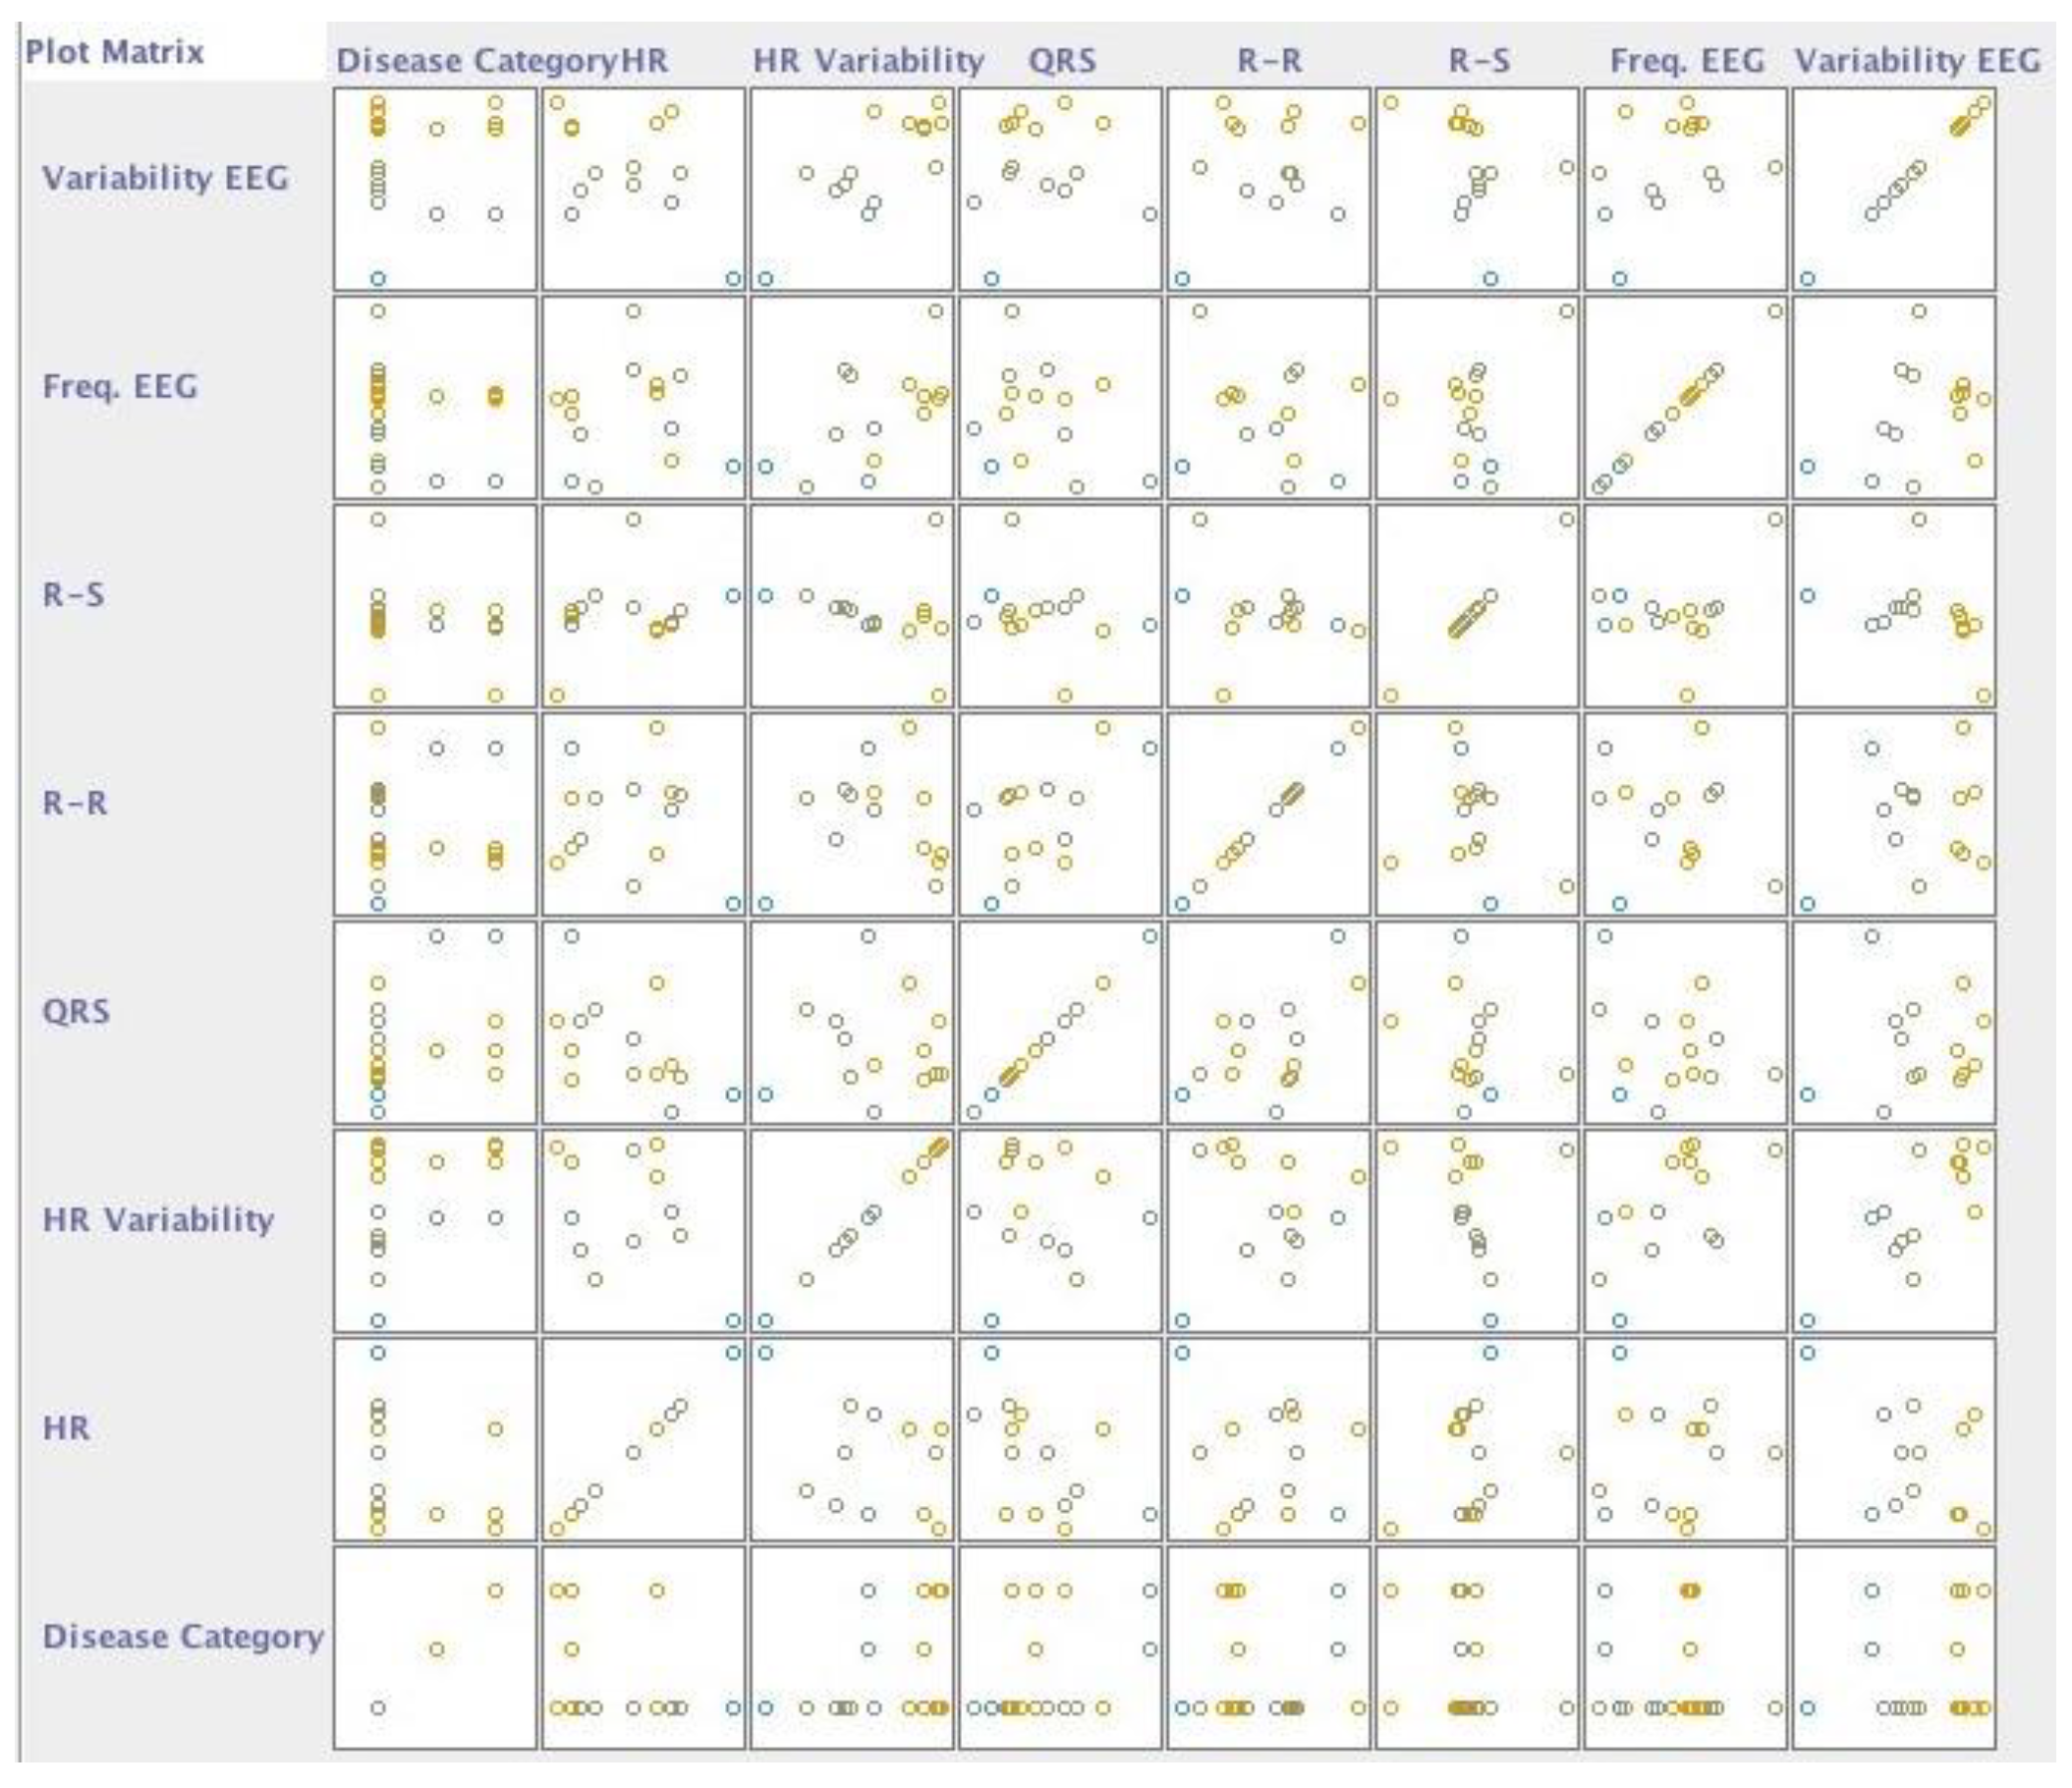
As we are only acquiring data related to ECG and EEG sensors, the reported results are the expected. Thus, we analysed the groups of diseases that are related to this type of data, such as Cardiovascular diseases, Neurological and balance diseases, and Psychiatric illnesses, resulting in Table 9. It is also verified that the most recognized conditions are the Cardiovascular diseases with an accuracy of 76%. The data was selected with WEKA software as presented in Figure 8, presenting the classification dispersed by the different diseases in the following order (Figure 9): cardiovascular, neurological and balance, and psychiatric.

4. Discussion and Conclusions

Machine learning techniques are helpful for the recognition of different diseases involved in the studied population. The application of machine learning techniques made it possible to identify with some accuracy the different patterns related to the extracted features, such as heart rate, heart rate variability, average QRS amplitude, average R-R interval, and average R-S interval from ECG data, and the frequency and variability from the EEG data. A combination of these parameters allowed us to identify, with some accuracy, the presence of certain diseases.
However, this study revealed some limitations related to the data acquisition and different constraints, and some data were excluded for several reasons, including the failure of the sensors. A small number of valid records implies that the machine learning method might benefit from larger datasets and samples for them to be reliable.
The obtained results revealed that the individuals related to institutions were recognized except for individuals from Centro Comunitário das Lameiras. The identification results related to age were also accurate except for the results for persons aged 74, 85, and 86 years old. Regarding the recognition of diseases and considering that we had a small dataset for the analysis, the isolated disorders were not recognized. However, when the disorders were categorized, some persons with cardiovascular diseases were identified. Thus, the proposed method reported low accuracies for illnesses, but the accuracy was higher for the recognition of persons by age and institution.
In the future we intend to study a larger number of individuals to increase the size of the dataset acquired. Next, other types of diseases will be analyzed, comparing healthy people with those suffering from certain disorders.

Author Contributions

Conceptualization, methodology, software, validation, formal analysis, investigation, writing—original draft preparation, writing—review, and editing: V.P., I.M.P., F.R.R., N.M.G., M.V.V., E.Z. and P.L. All authors have read and agreed to the published version of the manuscript.

Funding

This work is funded by FCT/MEC through national funds and co-funded by FEDER-PT2020 partnership agreement under the project UIDB/EEA/50008/2020.

Acknowledgments

This work is funded by FCT/MEC through national funds and when applicable co-funded by FEDER-PT2020 partnership agreement under the project UIDB/EEA/50008/2020. (Este trabalho é financiado pela FCT/MEC através de fundos nacionais e cofinanciado pelo FEDER, no âmbito do Acordo de Parceria PT2020 no âmbito do projeto UIDB/EEA/50008/2020). This article is based upon work from COST Action IC1303-AAPELE—Architectures, Algorithms and Protocols for Enhanced Living Environments and COST Action CA16226–SHELD-ON—Indoor living space improvement: Smart Habitat for the Elderly, supported by COST (European Cooperation in Science and Technology). More information in www.cost.eu.

Conflicts of Interest

The authors declare no conflict of interest.

References

  1. Chatterjee, S.; Price, A. Healthy Living with Persuasive Technologies: Framework, Issues, and Challenges. J. Am. Med. Inform. Assoc. 2009, 16, 171–178. [Google Scholar] [CrossRef] [PubMed]
  2. Nesse, R.M.; Stearns, S.C. The great opportunity: Evolutionary applications to medicine and public health. Evol. Appl. 2008, 1, 28–48. [Google Scholar] [CrossRef] [PubMed]
  3. Dimitrievski, A.; Zdravevski, E.; Lameski, P.; Trajkovik, V. A survey of Ambient Assisted Living systems: Challenges and opportunities. In Proceedings of the 2016 IEEE 12th International Conference on Intelligent Computer Communication and Processing (ICCP), Cluj-Napoca, Romania, 8–10 September 2016; pp. 49–53. [Google Scholar]
  4. Zdravevski, E.; Lameski, P.; Trajkovik, V.; Kulakov, A.; Chorbev, I.; Goleva, R.; Pombo, N.; Garcia, N. Improving Activity Recognition Accuracy in Ambient-Assisted Living Systems by Automated Feature Engineering. IEEE Access 2017, 5, 5262–5280. [Google Scholar] [CrossRef]
  5. Garcia, N.M.; Rodrigues, J.J.P.C. (Eds.) Ambient Assisted Living; CRC Press: Boca Raton, FL, USA, 2015; ISBN 978-0-429-10674-3. [Google Scholar]
  6. Autexier, S.; Goleva, R.; Garcia, N.M.; Stainov, R.; Ganchev, I.; Mavromoustakis, C.X.; Dobre, C.; Chorbev, I.; Trajkovik, V.; Zdravevski, E. End-users’ AAL and ELE service scenarios in smart personal environments. In Enhanced Living Environments: From models to technologies; Goleva, R.I., Ganchev, I., Dobre, C., Garcia, N., Valderrama, C., Eds.; Institution of Engineering and Technology: London, UK, 2017; pp. 101–131. ISBN 978-1-78561-211-4. [Google Scholar]
  7. Lee, B.-G.; Chung, W.-Y. Driver Alertness Monitoring Using Fusion of Facial Features and Bio-Signals. IEEE Sensors J. 2012, 12, 2416–2422. [Google Scholar] [CrossRef]
  8. Leo, M.; Carcagnì, P.; Mazzeo, P.L.; Spagnolo, P.; Cazzato, D.; Distante, C. Analysis of Facial Information for Healthcare Applications: A Survey on Computer Vision-Based Approaches. Information 2020, 11, 128. [Google Scholar] [CrossRef] [Green Version]
  9. Varshney, U. Pervasive healthcare. Computer 2003, 36, 138–140. [Google Scholar] [CrossRef]
  10. Jung, S.-J.; Myllylä, R.; Chung, W.-Y. Wireless Machine-to-Machine Healthcare Solution Using Android Mobile Devices in Global Networks. IEEE Sensors J. 2013, 13, 1419–1424. [Google Scholar] [CrossRef]
  11. Mobile healthcare Informatics: Medical Informatics and the Internet in Medicine: Vol 31, No 2. Available online: https://www.tandfonline.com/doi/abs/10.1080/14639230500095651 (accessed on 26 May 2020).
  12. Ureña, R.; Chiclana, F.; Gonzalez-Alvarez, A.; Herrera-Viedma, E.; Moral-Munoz, J.A. m-SFT: A Novel Mobile Health System to Assess the Elderly Physical Condition. Sensors 2020, 20, 1462. [Google Scholar] [CrossRef] [Green Version]
  13. Stankevich, E.; Paramonov, I.; Timofeev, I. Mobile phone sensors in health applications. In Proceedings of the 2012 12th Conference of Open Innovations Association (FRUCT), Oulu, Finland, 5–9 November 2012; pp. 1–6. [Google Scholar]
  14. Sousa, P.S.; Sabugueiro, D.; Felizardo, V.; Couto, R.; Pires, I.; Garcia, N.M. mHealth Sensors and Applications for Personal Aid. In Mobile Health; Adibi, S., Ed.; Springer Series in Bio-/Neuroinformatics; Springer International Publishing: Cham, Switzerland, 2015; Volume 5, pp. 265–281. ISBN 978-3-319-12816-0. [Google Scholar]
  15. Sendra, S.; Granell, E.; Lloret, J.; Rodrigues, J.J.P.C. Smart collaborative system using the sensors of mobile devices for monitoring disabled and elderly people. In Proceedings of the 2012 IEEE International Conference on Communications (ICC), Ottawa, ON, Canada, 10–15 June 2012; pp. 6479–6483. [Google Scholar]
  16. Pires, I.M.; Marques, G.; Garcia, N.M.; Pombo, N.; Flórez-Revuelta, F.; Spinsante, S.; Teixeira, M.C.; Zdravevski, E. Recognition of Activities of Daily Living and Environments Using Acoustic Sensors Embedded on Mobile Devices. Electronics 2019, 8, 1499. [Google Scholar] [CrossRef] [Green Version]
  17. Pires, I.; Garcia, N.; Pombo, N.; Flórez-Revuelta, F.; Spinsante, S. Approach for the development of a framework for the identification of activities of daily living using sensors in mobile devices. Sensors 2018, 18, 640. [Google Scholar] [CrossRef] [PubMed] [Green Version]
  18. Felizardo, V.; Sousa, P.; Sabugueiro, D.; Alexandre, C.; Couto, R.; Garcia, N.; Pires, I. E-Health: Current status and future trends. In Handbook of Research on Democratic Strategies and Citizen-Centered E-Government Services; IGI Global: Hershey, PA, USA, 2015; pp. 302–326. [Google Scholar]
  19. Bischoff, H.A. Identifying a cut-off point for normal mobility: A comparison of the timed “up and go” test in community-dwelling and institutionalised elderly women. Age Ageing 2003, 32, 315–320. [Google Scholar] [CrossRef] [PubMed] [Green Version]
  20. Hussain, F.; Umair, M.B.; Ehatisham-ul-Haq, M.; Pires, I.M.; Valente, T.; Garcia, N.M.; Pombo, N. An Efficient Machine Learning-based Elderly Fall Detection Algorithm. In Proceedings of the SENSORDEVICES 2018, the Ninth International Conference on Sensor Device Technologies and Applications, Venice, Italy, 16–20 September 2018; pp. 88–93. [Google Scholar]
  21. Klimova, B. Acceptance and Use of Mobile Devices and Apps by Elderly People. In Challenges and Opportunities in the Digital Era; Al-Sharhan, S.A., Simintiras, A.C., Dwivedi, Y.K., Janssen, M., Mäntymäki, M., Tahat, L., Moughrabi, I., Ali, T.M., Rana, N.P., Eds.; Lecture Notes in Computer Science; Springer International Publishing: Cham, Switzerland, 2018; Volume 11195, pp. 30–36. ISBN 978-3-030-02130-6. [Google Scholar]
  22. Dzhagaryan, A.; Milenkovic, A.; Jovanov, E.; Milosevic, M. Smart Button: A wearable system for assessing mobility in elderly. In Proceedings of the 2015 17th International Conference on E-health Networking, Application & Services (HealthCom), Boston, MA, USA, 14–17 October 2015; pp. 416–421. [Google Scholar]
  23. Ponciano, V.; Pires, I.M.; Ribeiro, F.R.; Garcia, N.M.; Pombo, N.; Spinsante, S.; Crisóstomo, R. Smartphone-based automatic measurement of the results of the Timed-Up and Go test. In Proceedings of the Proceedings of the 5th EAI International Conference on Smart Objects and Technologies for Social Good, Valencia, Spain, 25–27 September 2019; pp. 239–242. [Google Scholar]
  24. Ponciano, V.; Pires, I.M.; Ribeiro, F.R.; Garcia, N.M.; Pombo, N. Non-invasive measurement of results of timed-up and go test: Preliminary results. Ageing Congress. 2019. Available online: https://repositorio.ipcb.pt/handle/10400.11/6829?locale=en (accessed on 24 May 2020).
  25. Weka 3-Data Mining with Open Source Machine Learning Software in Java. Available online: https://www.cs.waikato.ac.nz/ml/weka/ (accessed on 24 May 2020).
  26. Ponciano, V.; Pires, I.M.; Ribeiro, F.R.; Villasana, M.V.; Garcia, N.M.; Leithardt, V. Detection of diseases based on Electrocardiography and Electroencephalography signals embedded in different devices: An exploratory study. BJD 2020, 6, 27212–27231. [Google Scholar] [CrossRef]
  27. Rim, B.; Sung, N.-J.; Min, S.; Hong, M. Deep Learning in Physiological Signal Data: A Survey. Sensors 2020, 20, 969. [Google Scholar] [CrossRef] [PubMed] [Green Version]
  28. Pires, I.; Felizardo, V.; Pombo, N.; Garcia, N.M. Limitations of energy expenditure calculation based on a mobile phone accelerometer. In Proceedings of the 2017 International Conference on High Performance Computing & Simulation (HPCS), Genoa, Italy, 17–21 July 2017; pp. 124–127. [Google Scholar]
  29. Pires, I.M.; Garcia, N.M.; Pombo, N.; Flórez-Revuelta, F. Limitations of the Use of Mobile Devices and Smart Environments for the Monitoring of Ageing People. In Proceedings of the ICT4AWE, Funchal, Portugal, 22–23 March 2018; pp. 269–275. Available online: https://www.scitepress.org/Papers/2018/68178/68178.pdf (accessed on 24 May 2020).
  30. Hassoun, M.H. Fundamentals of artificial neural networks; MIT Press: Cambridge, MA, USA, 1995; ISBN 0-262-08239-X. [Google Scholar]
  31. Haykin, S. Neural Networks: A Comprehensive Foundation, 1st ed.; Prentice Hall PTR: Upper Saddle River, NJ, USA, 1994; ISBN 978-0-02-352761-6. [Google Scholar]
  32. Zdravevski, E.; Lameski, P.; Kulakov, A. Weight of evidence as a tool for attribute transformation in the preprocessing stage of supervised learning algorithms. In Proceedings of the 2011 International Joint Conference on Neural Networks, San Jose, CA, USA, 31 July–5 August 2011; pp. 181–188. [Google Scholar]
  33. Zdravevski, E.; Lameski, P.; Kulakov, A.; Kalajdziski, S. Transformation of nominal features into numeric in supervised multi-class problems based on the weight of evidence parameter. In Proceedings of the 2015 Federated Conference on Computer Science and Information Systems (FedCSIS), Lodz, Poland, 13–16 September 2015; pp. 169–179. [Google Scholar]
Figure 1. Flow of the analysis of the collected data.
Computers 09 00055 g001
Figure 2. Descriptive analysis of the data by Institution.
Computers 09 00055 g002
Figure 3. Plot dispersion of the classified data by Institution.
Computers 09 00055 g003
Figure 4. Descriptive analysis of the data by age.
Computers 09 00055 g004
Figure 5. Plot dispersion of the classified data by age.
Computers 09 00055 g005
Figure 6. Descriptive analysis of the data related by disease.
Computers 09 00055 g006
Figure 7. Plot dispersion of the classified data by disease.
Computers 09 00055 g007
Figure 8. Descriptive analysis of the data related by groups of diseases.
Computers 09 00055 g008
Figure 9. Plot dispersion of the classified data by groups of diseases.
Computers 09 00055 g009
Table 1. Different characteristics of the population analysed.
Person IDInstitutionAgeDiseaseDisease Category
1Centro Comunitário das Lameiras85Arterial hypertensionCardiovascular
ArthrosisOsteoarticular
2Lar Minas84Arterial hypertension; Cardiac arrhythmia; Arteriosclerotic coronary disease; Heart failureCardiovascular
3Lar da Misericórdia88Right leg amputationOsteoarticular
Umbilical herniaDigestive system and abdominal wall
Arterial hypertensionCardiovascular
476Prostate CancerNephro-urological
Parkinson’s diseaseNeurological and balance
Post-traumatic stressPsychiatric
586Arterial hypertensionCardiovascular
Diabetes mellitus Type IIMetabolic
683Heart failure; Arterial hypertensionCardiovascular
Diabetes mellitus Type IIMetabolic
DepressionPsychiatric
Sequelae of surgery to brain injuryNeurological and balance
781Heart failure; Arterial hypertensionCardiovascular
Diabetes mellitus Type IIMetabolic
Osteoarthritis; Prosthesis in the right humeral; OsteoporosisOsteoarticular
889Osteoarthritis; OsteoporosisOsteoarticular
DepressionPsychiatric
Heart failure; Arterial hypertensionCardiovascular
9Lar da Nossa Senhora de FátimaN/DDementia of vascular etiology; Arterial hypertensionCardiovascular
Prostate CancerNephro-urological
10N/DDiabetes mellitus Type II; HyperuricemiaMetabolic
Arterial hypertension; Heart failureCardiovascular
DepressionPsychiatric
Bilateral gonarthrosisOsteoarticular
1197Heart failureCardiovascular
Chronic obstructive pulmonary diseaseLung
Bilateral gonarthrosisOsteoarticular
1271Diabetes mellitus Type IIMetabolic
Arterial hypertensionCardiovascular
1374Arterial hypertensionCardiovascular
14N/DArterial hypertension; Cardiac arrhythmia; Acute myocardial infarctionCardiovascular
Pulmonary fibrosisLung
HyperuricemiaMetabolic
Chronic kidney diseaseNephro-urological
Table 2. Confusion Matrix for the analysis by Institution.
Predicted Class
Centro Comunitário das LameirasLar MinasLar da MisericórdiaLar da Nossa Senhora de Fátima
Actual ClassCentro Comunitário das Lameiras0011
Lar Minas0400
Lar da Misericórdia00241
Lar da Nossa Senhora de Fátima00123
Table 3. Results of the analysis by Institution.
InstitutionAccuracyPrecisionRecallF1 Score
Centro Comunitário das Lameiras0%0%0%0%
Lar Minas100%100%100%100%
Lar da Misericórdia96%92%96%94%
Lar da Nossa Senhora de Fátima96%92%96%94%
Total93%89%93%91%
Table 4. Confusion Matrix for the analysis by age.
Predicted Class
7174768183848586888997N/D
Actual Class71200000000000
74000000010000
76003000000000
81000700000000
83000050000000
84000004000000
85000000110000
86010000010000
88000000003000
89000000000500
97000000000030
N/D0000000000018
Table 5. Results of the analysis by age.
AgeAccuracyPrecisionRecallF1 Score
71100%100%100%100%
740%0%0%0%
76100%100%100%100%
81100%100%100%100%
83100%100%100%100%
84100%100%100%100%
8550%100%50%67%
8650%33%50%40%
88100%100%100%100%
89100%100%100%100%
97100%100%100%100%
N/D100%100%100%100%
Total95%96%95%95%
Table 6. Results of the analysis by each disease.
True PositiveFalse PositiveFalse NegativeTrue NegativeAccuracyPrecisionRecallF1 Score
Arterial Hypertension11153871%74%64%70%
Arthrosis0115396%98%96%96%
Cardiac arrhythmia0205396%93%96%94%
Arteriosclerotic coronary disease0105498%96%98%97%
Heart Failure0604989%79%89%84%
Right leg amputation0105498%96%98%97%
Umbilical hernia0105498%96%98%97%
Prostate Cancer0215295%93%95%94%
Parkinson’s disease0115396%96%96%96%
Post-traumatic stress0115396%96%96%96%
Diabetes mellitus Type II0505091%83%91%87%
Depression0305295%89%95%92%
Sequelae of surgery to brain injury0105498%96%98%97%
Osteoarthritis0205396%93%96%95%
Prosthesis in the right humeral0105498%96%98%97%
Osteoporosis0205396%93%96%95%
Dementia of vascular etiology0105498%96%98%97%
Hyperuricemia0205396%93%96%95%
Bilateral gonarthrosis0215295%93%95%94%
Pulmonary fibrosis0105498%96%98%97%
Chronic obstructive pulmonary disease0105498%96%98%97%
Chronic kidney disease0105498%96%98%97%
Acute myocardial infarction0105498%96%98%97%
Table 7. Classification of different diseases.
Classification CategoryDiseases
OsteoarticularArthrosis; Right leg amputation; Bilateral gonarthrosis; Osteoarthritis; Prosthesis in the right humeral; Osteoporosis
CardiovascularArterial Hypertension; Cardiac arrhythmia; Arteriosclerotic coronary disease; Heart failure; Acute myocardial infarction
LungPulmonary fibrosis; Chronic obstructive pulmonary disease
Neurological and balanceParkinson’s disease; Dementia of vascular etiology; Sequelae of surgery to brain injury
PsychiatricPost-traumatic stress; Depression; Chronic kidney disease; Prostate cancer
Digestive system and abdominal wallUmbilical hernia
MetabolicHyperuricemia; Diabetes mellitus Type II
Table 8. Results of the analysis by groups of diseases.
True PositiveFalse PositiveFalse NegativeTrue NegativeAccuracyPrecisionRecallF1 Score
Cardiovascular617102251%56%49%51%
Osteoarticular0934378%69%78%73%
Digestive system and abdominal wall0105498%96%98%97%
Nephro-urological0524887%82%87%85%
Neurological and balance0225193%93%93%93%
Psychiatric0405193%86%93%89%
Metabolic0914582%70%82%75%
Lung0205396%93%96%95%
Table 9. Confusion Matrix and results of the analysis by groups of diseases related to ECG and EEG data.
True PositiveFalse PositiveFalse NegativeTrue NegativeAccuracyPrecisionRecallF1 Score
Cardiovascular2034276%74%76%75%
Neurological and balance0222586%86%86%86%
Psychiatric0422374%73%79%76%