Deep Transfer Learning in Diagnosing Leukemia in Blood Cells


Abstract
1. Introduction
2. Related Studies
2.1. Traditional Methods
2.2. Deep-Learning-Based Methods
3. Proposed Method
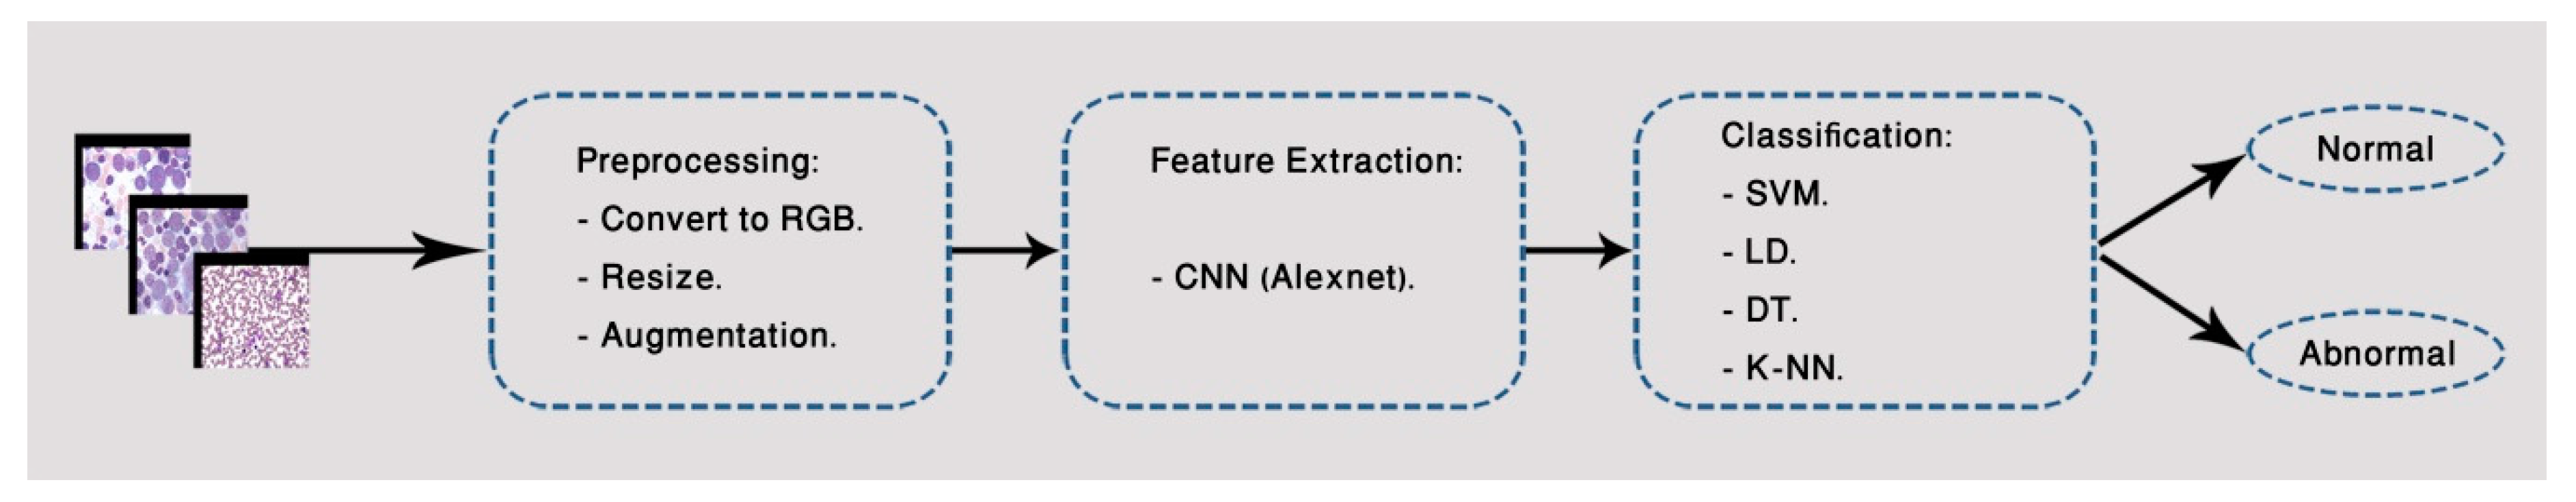
3.1. First Classification Model
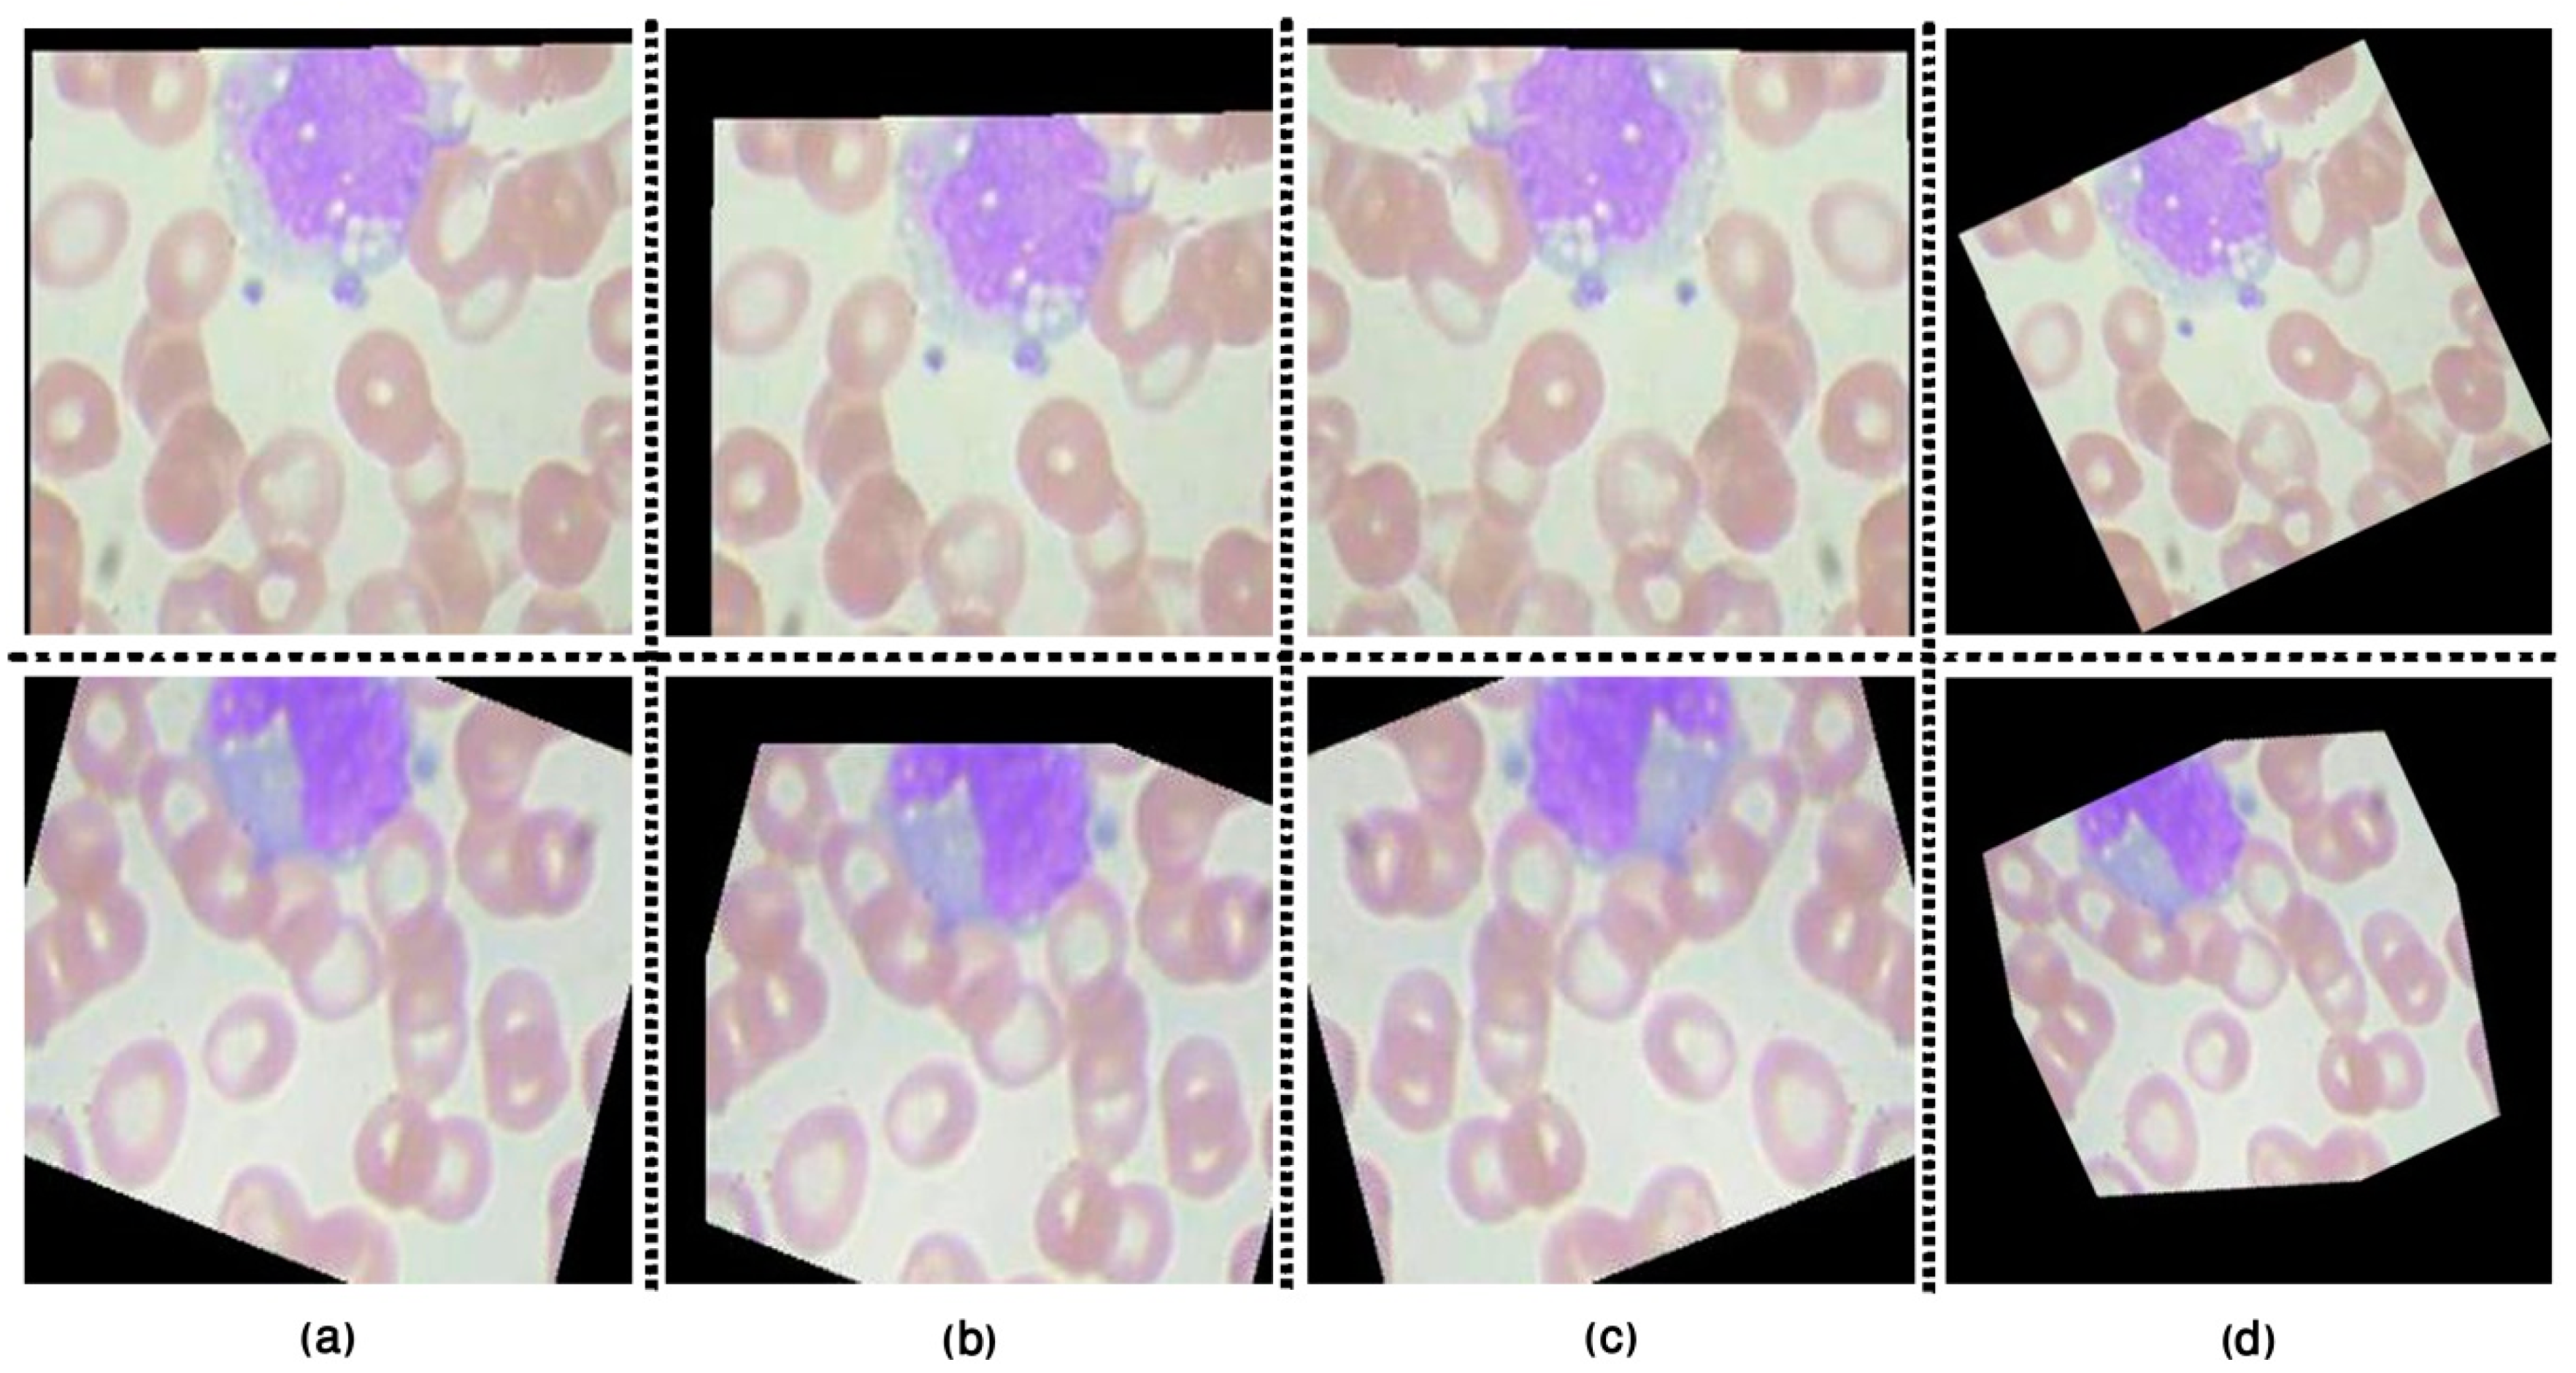
3.1.1. Image Pre-Processing
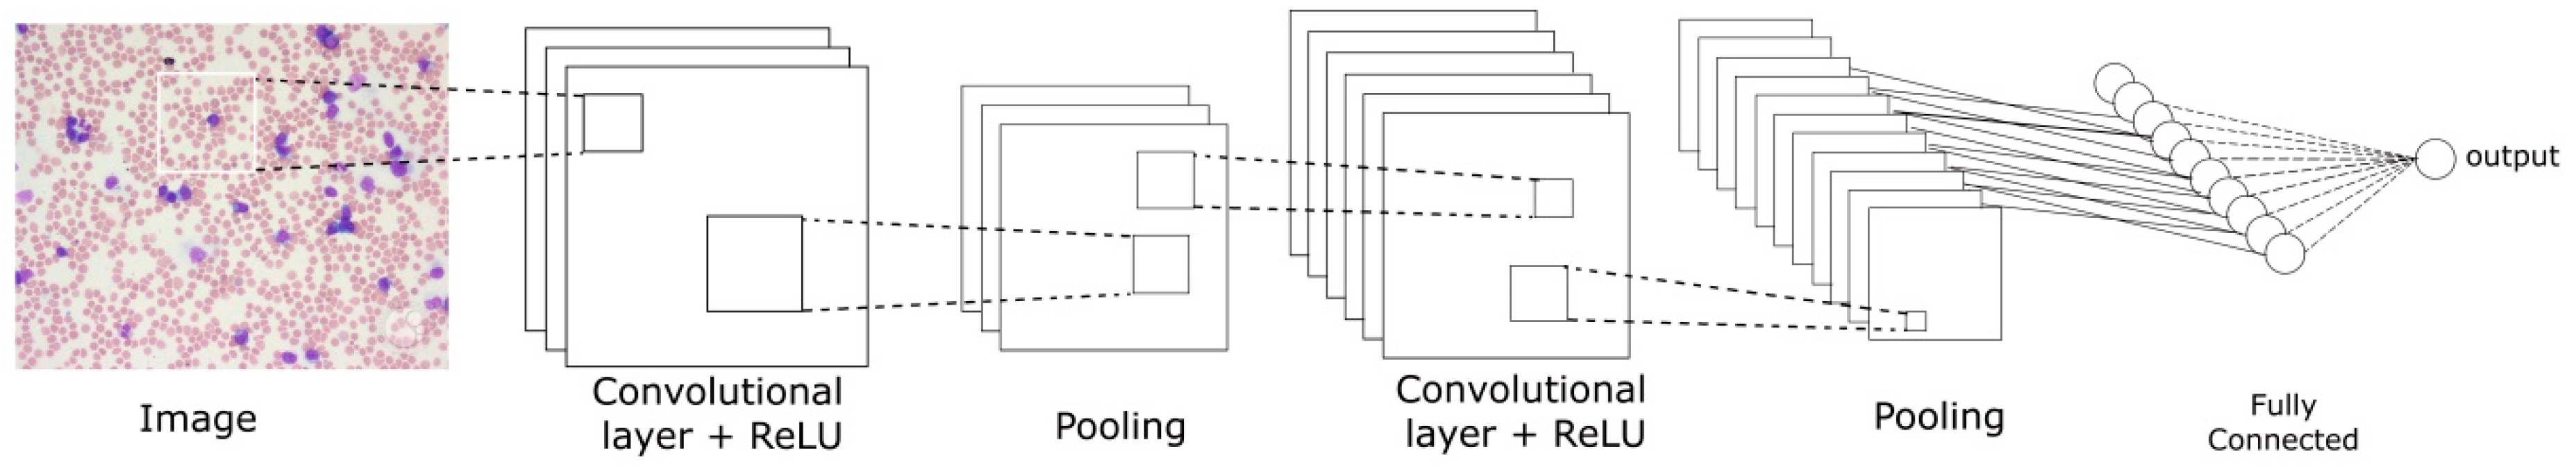
3.1.2. Feature Extraction
3.1.3. Classification Approaches
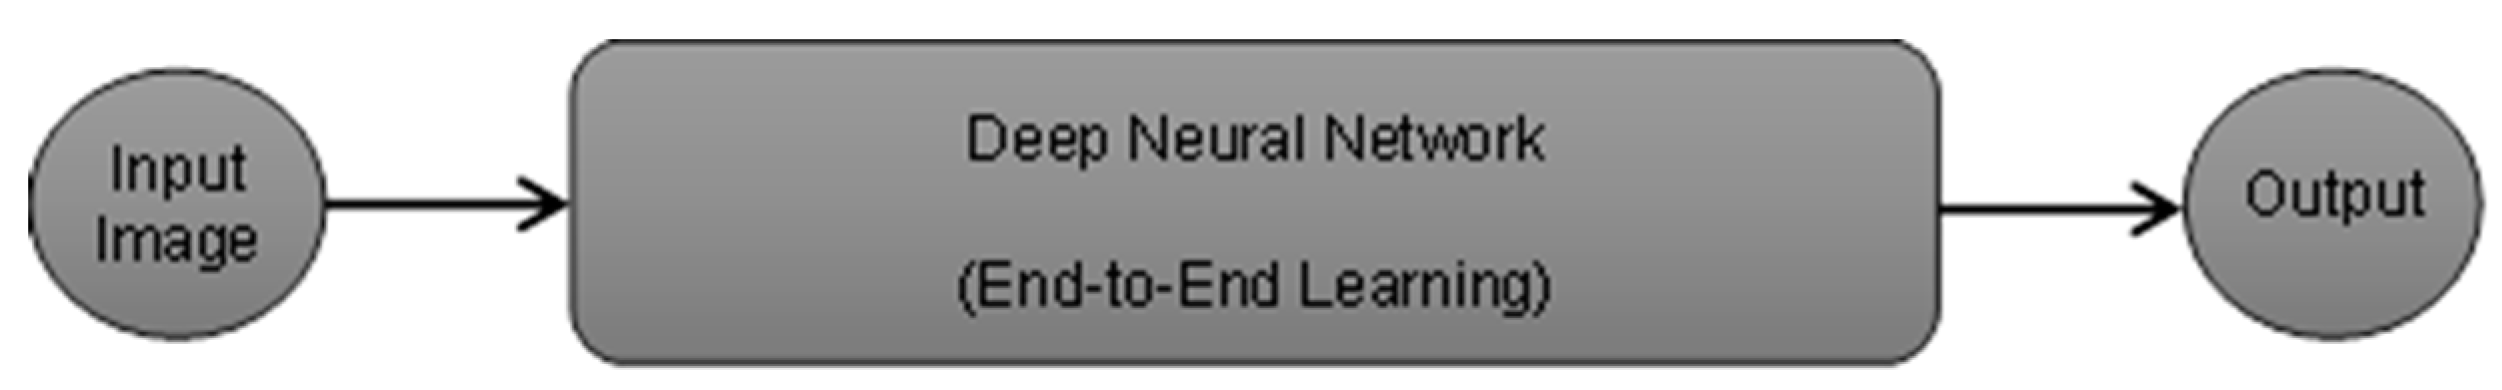
3.2. Second Classification Model
4. Implementation and Experiments
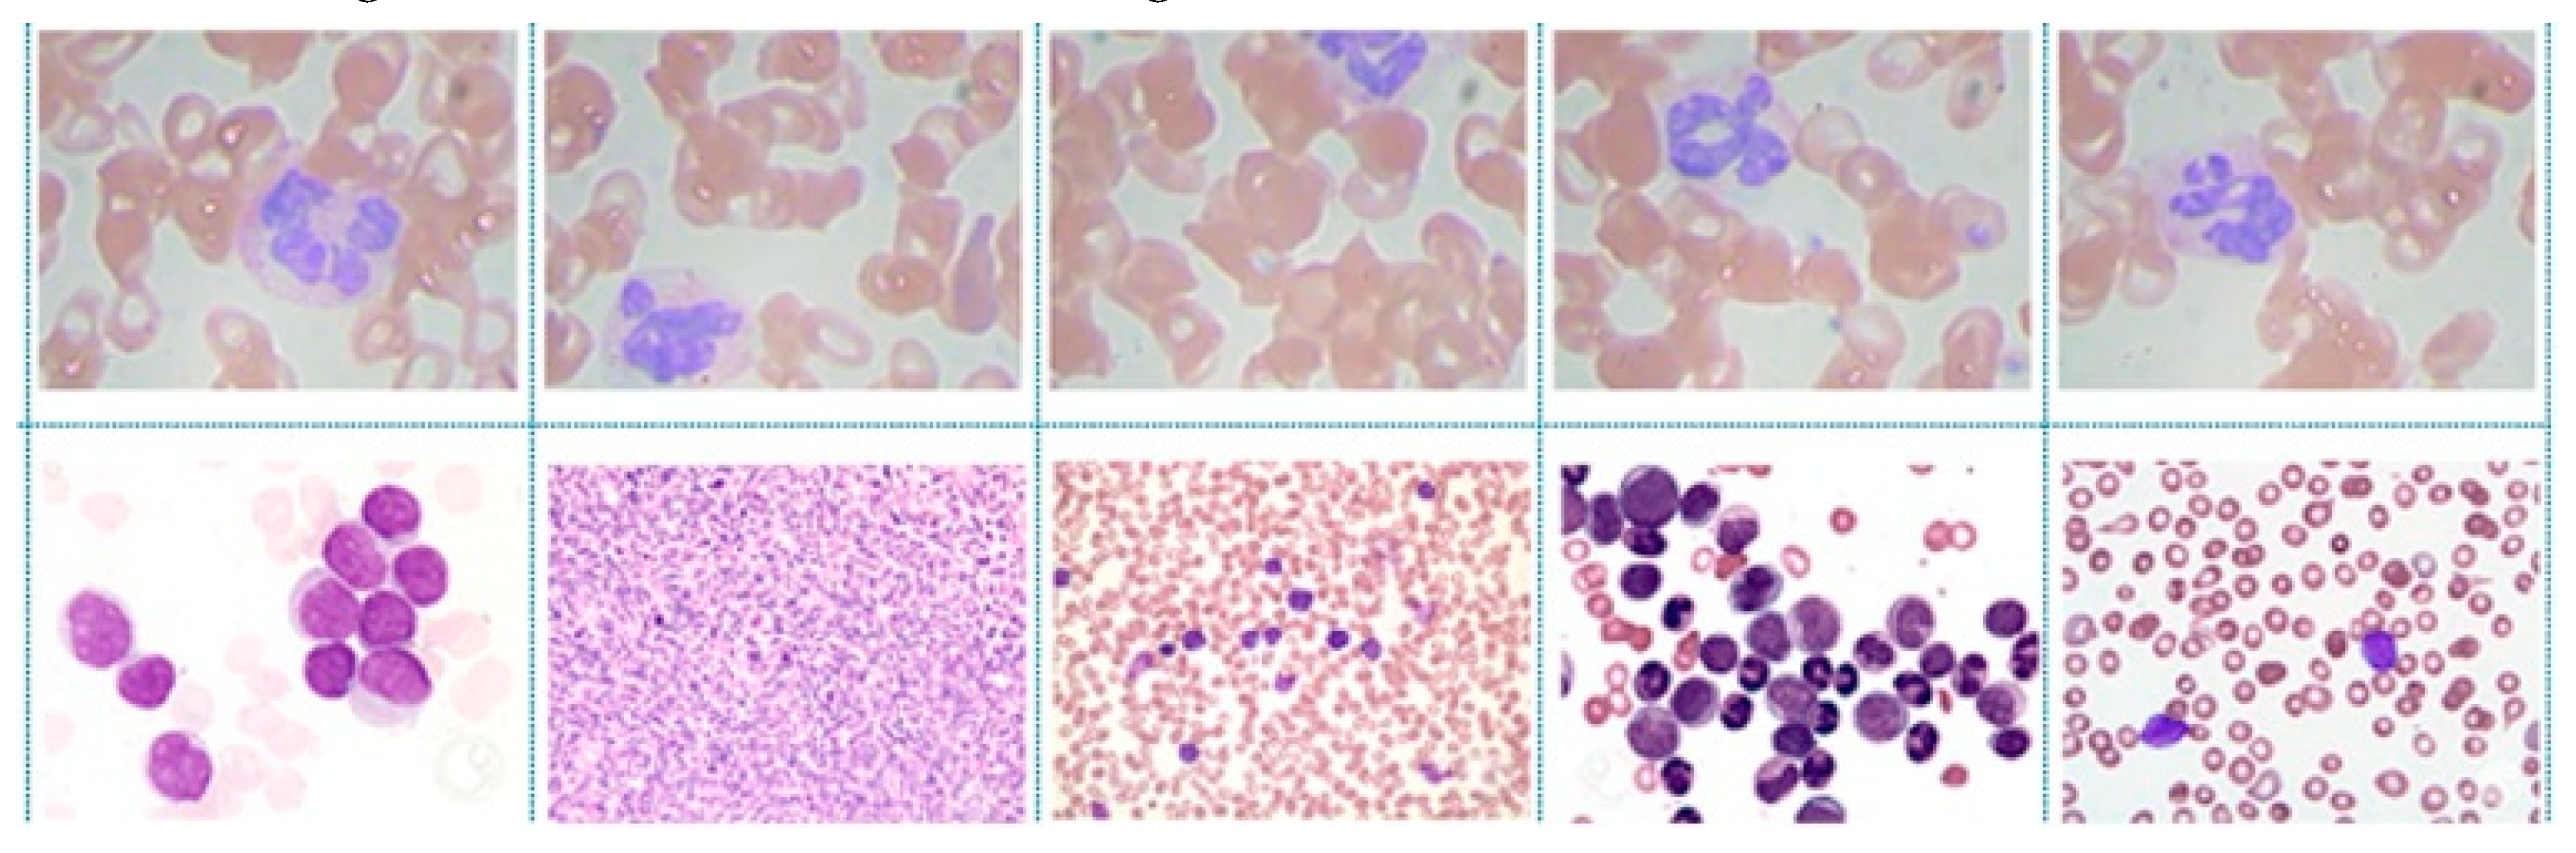
4.1. Dataset Description
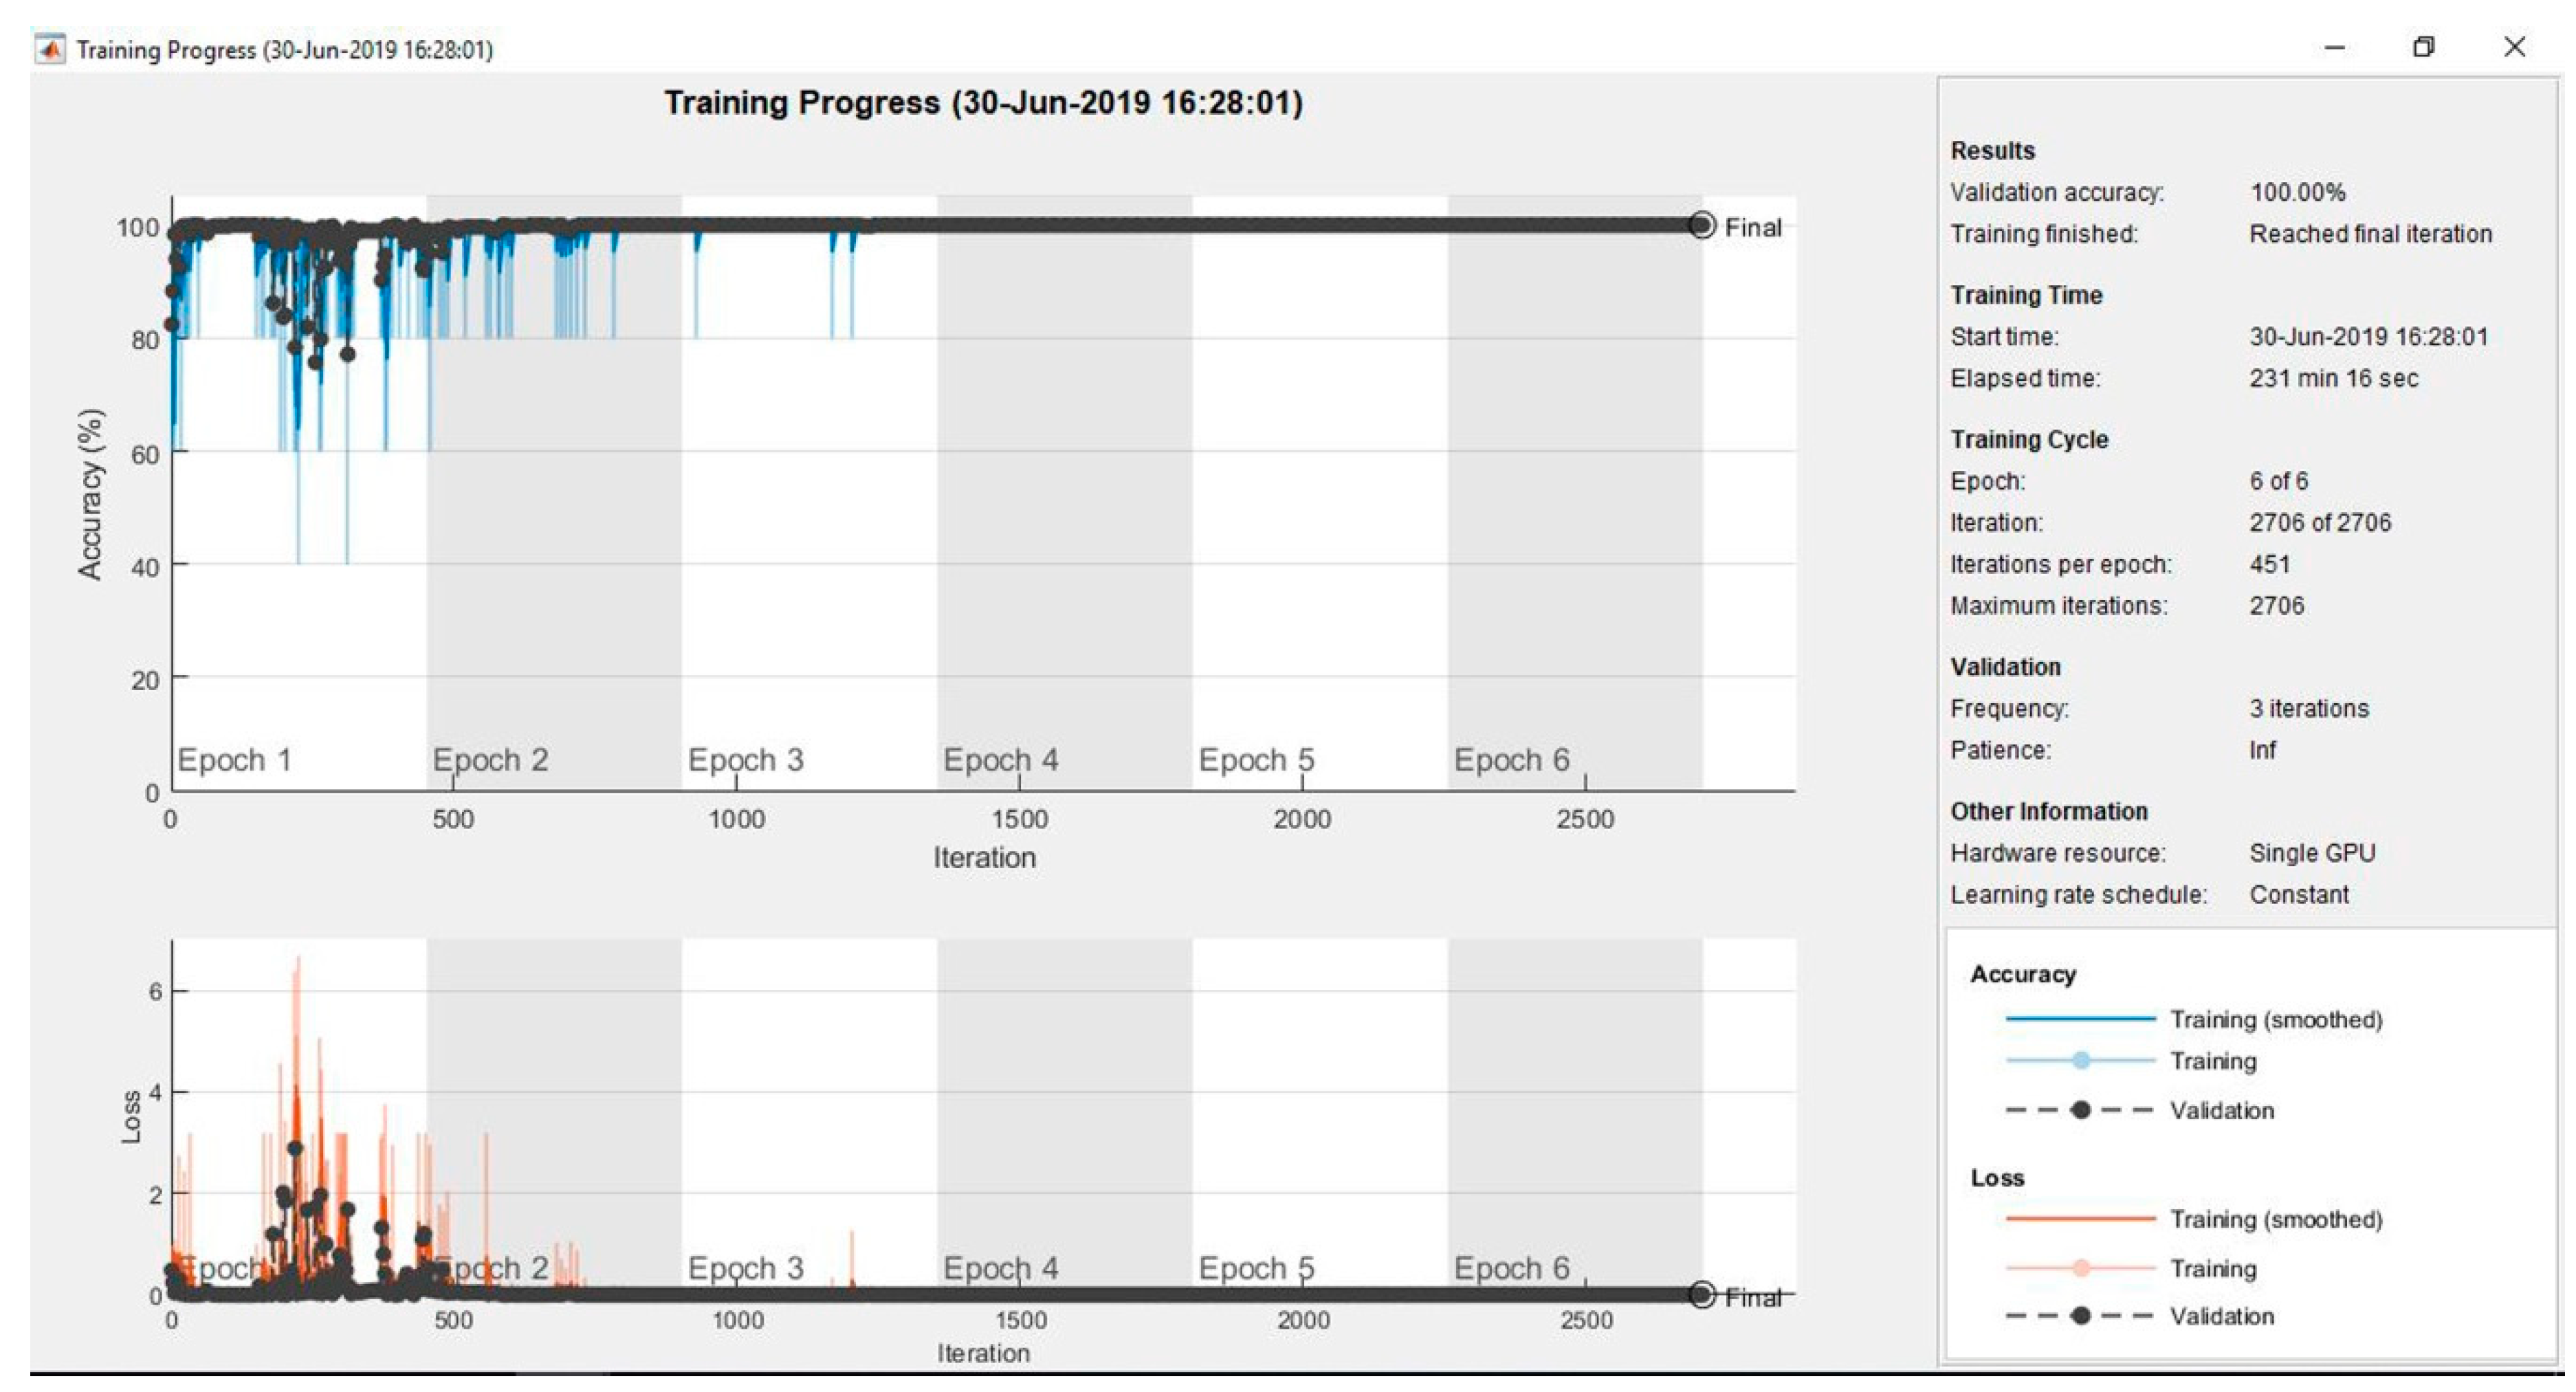
4.2. Implementation and Experiments
5. Discussion
6. Conclusions and Future Studies
Author Contributions
Funding
Acknowledgments
Conflicts of Interest
References
- Vogado, L.H.S.; Veras, R.D.M.S.; Andrade, A.R.; De Araujo, F.H.D.; e Silva, R.R.V.; Aires, K.R.T. Diagnosing leukemia in blood smear images using an ensemble of classifiers and pre-trained convolutional neural networks. In Proceedings of the 2017 IEEE 30th SIBGRAPI Conference on Graphics, Patterns and Images (SIBGRAPI), Niteroi, Brazil, 17–20 October 2017; pp. 367–373. [Google Scholar]
- Chen, X.; Xu, Y.; Wong, D.W.K.; Wong, T.Y.; Liu, J. Glaucoma detection based on deep convolutional neural network. In Proceedings of the 2015 37th Annual International Conference of the IEEE Engineering in Medicine and Biology Society (EMBC), Milan, Italy, 25–29 August 2015; IEEE: Piscataway, NJ, USA, 2015; pp. 715–718. [Google Scholar]
- Kawahara, J.; Hamarneh, G. Multi-resolution-tract CNN with hybrid pretrained and skin-lesion trained layers. In Proceedings of the International Workshop on Machine Learning in Medical Imaging, Athens, Greece, 17 October 2016; Springer: Cham/Canton of Zug, Switzerland, 2016; pp. 164–171. [Google Scholar]
- Wang, D.; Khosla, A.; Gargeya, R.; Irshad, H.; Beck, A.H. Deep learning for identifying metastatic breast cancer. arXiv 2016, arXiv:1606.05718. [Google Scholar]
- Agaian, S.; Madhukar, M.; Chronopoulos, A.T. Automated screening system for acute myelogenous leukemia detection in blood microscopic images. IEEE Syst. J. 2014, 8, 995–1004. [Google Scholar] [CrossRef]
- Thanh, T.T.P.; Vununu, C.; Atoev, S.; Lee, S.-H.; Kwon, K.-R. Leukemia blood cell image classification using convolutional neural network. Int. J. Comput. Theory Eng. 2018, 10, 54–58. [Google Scholar] [CrossRef]
- Imran Razzak, M.; Naz, S. Microscopic blood smear segmentation and classification using deep contour aware CNN and extreme machine learning. In Proceedings of the IEEE Conference on Computer Vision and Pattern Recognition Workshops, Honolulu, HI, USA, 21–26 July 2017; pp. 49–55. [Google Scholar]
- Sajjad, M.; Khan, S.; Jan, Z.; Muhammad, K.; Moon, H.; Kwak, J.T.; Rho, S.; Baik, S.W.; Mehmood, I. Leukocytes classification and segmentation in microscopic blood smear: A resource-aware healthcare service in smart cities. IEEE Access 2016, 5, 3475–3489. [Google Scholar] [CrossRef]
- Abdeldaim, A.M.; Sahlol, A.T.; Elhoseny, M.; Hassanien, A.E. Computer-aided acute lymphoblastic leukemia diagnosis system based on image analysis. In Advances in Soft Computing and Machine Learning in Image Processing; Springer: Berlin/Heidelberg, Germany, 2018; pp. 131–147. [Google Scholar]
- Vogado, L.H.; Veras, R.M.; Araujo, F.H.; Silva, R.R.; Aires, K.R. Leukemia diagnosis in blood slides using transfer learning in CNNs and SVM for classification. Eng. Appl. Artif. Intell. 2018, 72, 415–422. [Google Scholar] [CrossRef]
- Yu, W.; Chang, J.; Yang, C.; Zhang, L.; Shen, H.; Xia, Y.; Sha, J. Automatic classification of leukocytes using deep neural network. In Proceedings of the 2017 IEEE 12th International Conference on ASIC (ASICON), Guiyang, China, 25–28 October 2017; IEEE: Piscataway, NJ, USA, 2017; pp. 1041–1044. [Google Scholar]
- Pansombut, T.; Wikaisuksakul, S.; Khongkraphan, K.; Phon-on, A. Convolutional Neural Networks for Recognition of Lymphoblast Cell Images. Comput. Intell. Neurosci. 2019, 2019, 7519603. [Google Scholar] [CrossRef]
- Kumar, S.; Mishra, S.; Asthana, P. Automated detection of acute leukemia using k-mean clustering algorithm. In Advances in Computer and Computational Sciences; Springer: Berlin/Heidelberg, Germany, 2018; pp. 655–670. [Google Scholar]
- Classification of Blasts in Acute Leukemia Blood samples Using k-Nearest Neighbour—IEEE Conference Publication. Available online: https://ieeexplore.ieee.org/abstract/document/6194769/ (accessed on 3 February 2020).
- Madhukar, M.; Agaian, S.; Chronopoulos, A.T. Deterministic model for acute myelogenous leukemia classification. In Proceedings of the 2012 IEEE International Conference on Systems, Man, and Cybernetics (SMC), Seoul, Korea, 14–17 October 2012; pp. 433–438. [Google Scholar]
- Setiawan, A.; Harjoko, A.; Ratnaningsih, T.; Suryani, E.; Palgunadi, S. Classification of cell types in Acute Myeloid Leukemia (AML) of M4, M5 and M7 subtypes with support vector machine classifier. In Proceedings of the 2018 International Conference on Information and Communications Technology (ICOIACT), Yogyakarta, Indonesia, 6–7 March 2018; pp. 45–49. [Google Scholar]
- Faivdullah, L.; Azahar, F.; Htike, Z.Z.; Naing, W.N. Leukemia detection from blood smears. J. Med. Bioeng. 2015, 4, 488–491. [Google Scholar] [CrossRef]
- Laosai, J.; Chamnongthai, K. Acute leukemia classification by using SVM and K-Means clustering. In Proceedings of the 2014 IEEE International Electrical Engineering Congress (iEECON), Chonburi, Thailand, 19–21 March 2014; pp. 1–4. [Google Scholar]
- Patel, N.; Mishra, A. Automated leukaemia detection using microscopic images. Procedia Comput. Sci. 2015, 58, 635–642. [Google Scholar] [CrossRef]
- Dwivedi, A.K. Artificial neural network model for effective cancer classification using microarray gene expression data. Neural Comput. Appl. 2018, 29, 1545–1554. [Google Scholar] [CrossRef]
- Sahlol, A.T.; Abdeldaim, A.M.; Hassanien, A.E. Automatic acute lymphoblastic leukemia classification model using social spider optimization algorithm. Soft Comput. 2019, 23, 6345–6360. [Google Scholar] [CrossRef]
- Zhao, J.; Zhang, M.; Zhou, Z.; Chu, J.; Cao, F. Automatic detection and classification of leukocytes using convolutional neural networks. Med. Biol. Eng. Comput. 2017, 55, 1287–1301. [Google Scholar] [CrossRef] [PubMed]
- Habibzadeh, M.; Jannesari, M.; Rezaei, Z.; Baharvand, H.; Totonchi, M. Automatic white blood cell classification using pre-trained deep learning models: Resnet and inception. In Proceedings of the Tenth International Conference on Machine Vision (ICMV 2017), Vienna, Austria, 13–15 November 2017; International Society for Optics and Photonics: San Diego, CA, USA, 2018; Volume 10696, p. 1069612. [Google Scholar]
- Lin, L.; Wang, W.; Chen, B. Leukocyte recognition with convolutional neural network. J. Algorithms Comput. Technol. 2018, 13, 1–8. [Google Scholar] [CrossRef]
- Rehman, A.; Abbas, N.; Saba, T.; ur Rahman, S.I.; Mehmood, Z.; Kolivand, H. Classification of acute lymphoblastic leukemia using deep learning. Microsc. Res. Tech. 2018, 81, 1310–1317. [Google Scholar] [CrossRef] [PubMed]
- Shafique, S.; Tehsin, S. Acute lymphoblastic leukemia detection and classification of its subtypes using pretrained deep convolutional neural networks. Technol. Cancer Res. Treat. 2018, 17, 1–7. [Google Scholar] [CrossRef] [PubMed]
- Wang, J.L.; Li, A.Y.; Huang, M.; Ibrahim, A.K.; Zhuang, H.; Ali, A.M. Classification of White Blood Cells with PatternNet-fused Ensemble of Convolutional Neural Networks (PECNN). In Proceedings of the 2018 IEEE International Symposium on Signal Processing and Information Technology (ISSPIT), Louisville, KY, USA, 6–8 December 2018; pp. 325–330. [Google Scholar]
- Sawada, Y.; Sato, Y.; Nakada, T.; Yamaguchi, S.; Ujimoto, K.; Hayashi, N. Improvement in Classification Performance Based on Target Vector Modification for All-Transfer Deep Learning. Appl. Sci. 2019, 9, 128. [Google Scholar] [CrossRef]
- Gu, Y.; Ge, Z.; Bonnington, C.P.; Zhou, J. Progressive Transfer Learning and Adversarial Domain Adaptation for Cross-Domain Skin Disease Classification. IEEE J. Biomed. Health Inform. 2019. [Google Scholar] [CrossRef]
- Zamir, A.R.; Sax, A.; Shen, W.; Guibas, L.J.; Malik, J.; Savarese, S. Taskonomy: Disentangling task transfer learning. In Proceedings of the IEEE Conference on Computer Vision and Pattern Recognition, Utah, USA, 18–22 June 2018; pp. 3712–3722. [Google Scholar]
- Razavian, A.S.; Azizpour, H.; Sullivan, J.; Carlsson, S. CNN Features off-the-shelf: An Astounding Baseline for Recognition. arXiv 2014, arXiv:1403.6382. [Google Scholar]
- Castelluccio, M.; Poggi, G.; Sansone, C.; Verdoliva, L. Land use classification in remote sensing images by convolutional neural networks. arXiv 2015, arXiv:1508.00092. [Google Scholar]
- Athiwaratkun, B.; Kang, K. Feature representation in convolutional neural networks. arXiv 2015, arXiv:1507.02313. [Google Scholar]
- Krizhevsky, A.; Sutskever, I.; Hinton, G.E. Imagenet classification with deep convolutional neural networks. In Proceedings of the Advances in Neural Information Processing Systems, Lake Tahoe, CA, USA, 3–8 December 2012; pp. 1097–1105. [Google Scholar]
- Quinlan, J.R. Induction of decision trees. Mach. Learn. 1986, 1, 81–106. [Google Scholar] [CrossRef]
- Zhao, W.; Chellappa, R.; Nandhakumar, N. Empirical performance analysis of linear discriminant classifiers. In Proceedings of the Proceedings. 1998 IEEE Computer Society Conference on Computer Vision and Pattern Recognition (Cat. No. 98CB36231), Santa Barbara, CA, USA, 25 June 1998; pp. 164–169. [Google Scholar]
- Vapnik, V. Statistical Learning Theory; Wiley: New York, NY, USA, 1998; Volume 1, pp. 1–740. [Google Scholar]
- Cover, T.; Hart, P. Nearest neighbor pattern classification. IEEE Trans. Inf. Theory 1967, 13, 21–27. [Google Scholar] [CrossRef]
- Kaggle. Available online: www.kaggle.com/paultimothymooney/blood-cells (accessed on 19 March 2020).
- ASH Image Bank. Available online: https://imagebank.hematology.org/collection/list/#selectedFacetlds=751 (accessed on 19 March 2020).


| Methods | Performance Metrics | ||||
|---|---|---|---|---|---|
| Precision | Recall | Accuracy | Specificity | ||
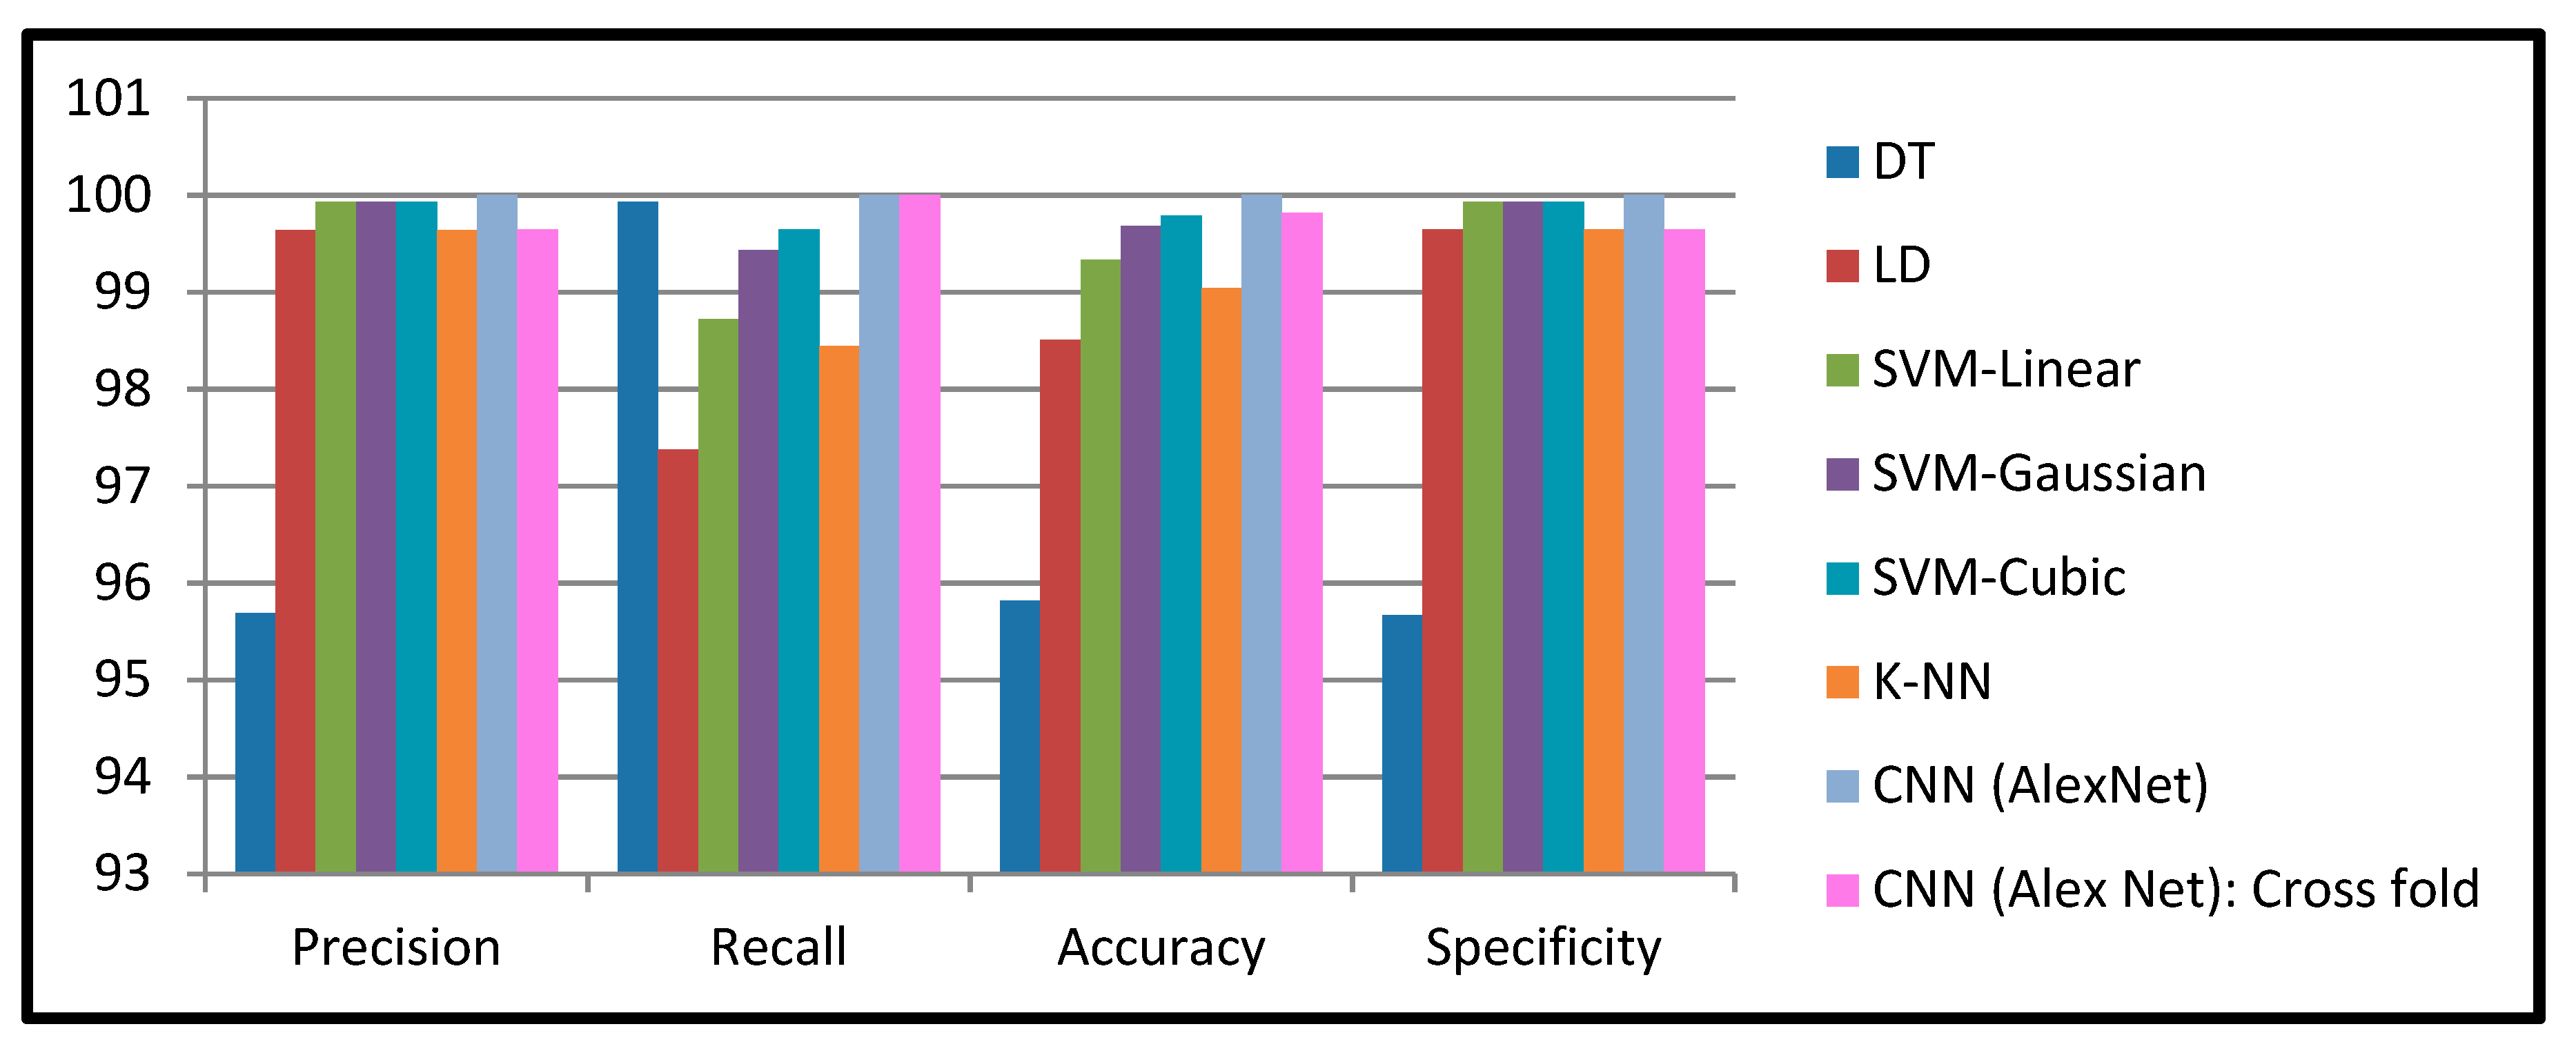
| First Model | DT | 95.69% | 95.96% | 95.82% | 95.67% |
| LD | 99.64% | 97.38% | 98.51% | 99.65% | |
| SVM-Linear | 99.93% | 98.72% | 99.33% | 99.93% | |
| SVM-Gaussian | 99.93% | 99.43% | 99.68% | 99.93% | |
| SVM-Cubic | 99.93% | 99.65% | 99.79% | 99.93% | |
| K-NN | 99.64% | 98.44% | 99.04% | 99.65% | |
| Second Model | CNN (Alex Net): Cross fold | 99.65% | 100.00% | 99.82% | 99.65% |
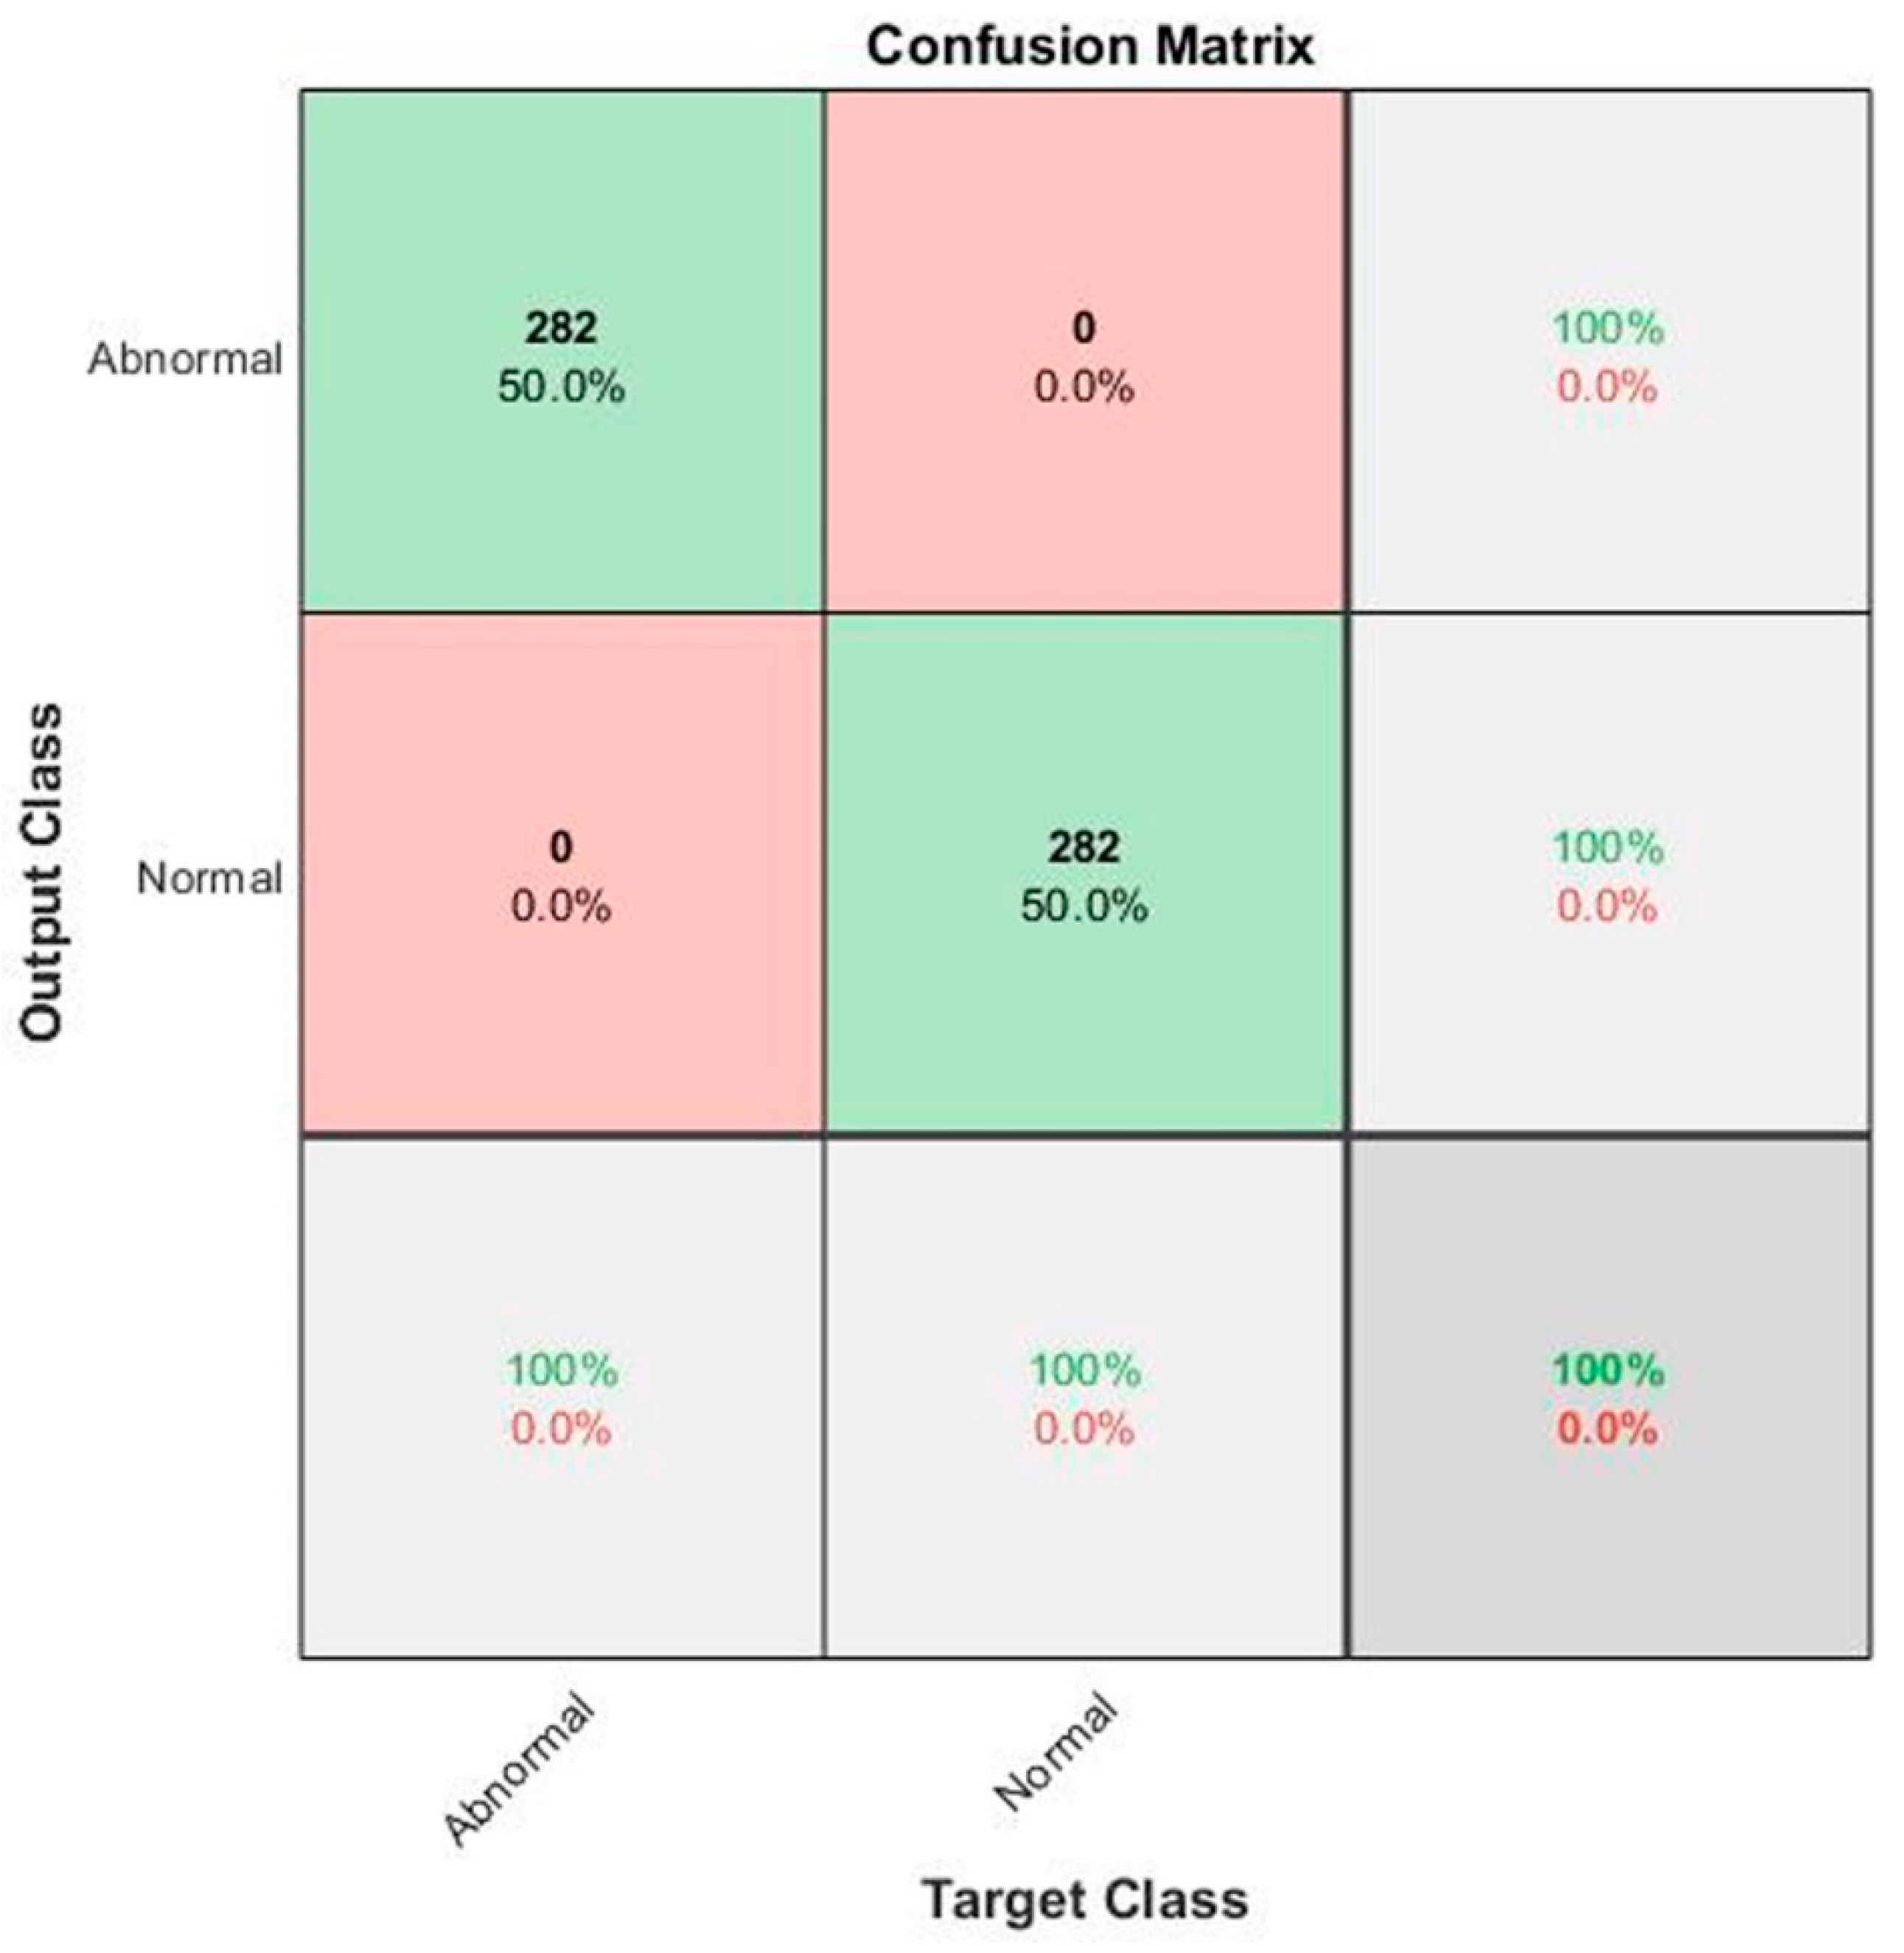
| CNN (Alex Net) | 100% | 100% | 100% | 100% | |
| Work | Number of Images | Methodology | Accuracy | |
|---|---|---|---|---|
| Feature Extraction | Classifier | |||
| Thanh et al. [6] | 1188 | CNN | FC | 96.6% |
| Vogado et al. [10] | 377 | CNN | SVM | 99% |
| Rehman et al. [25] | 330 | CNN | FC | 97.78% |
| Shafique and Tehsin [26] | 260 | CNN | FC | 96.06% |
| Pansombut et al. [12] | 363 | CNN | FC | 80% |
| Proposed work | 2820 | CNN | FC | 100% |
© 2020 by the authors. Licensee MDPI, Basel, Switzerland. This article is an open access article distributed under the terms and conditions of the Creative Commons Attribution (CC BY) license (http://creativecommons.org/licenses/by/4.0/).
Share and Cite
Loey, M.; Naman, M.; Zayed, H. Deep Transfer Learning in Diagnosing Leukemia in Blood Cells. Computers 2020, 9, 29. https://doi.org/10.3390/computers9020029
Loey M, Naman M, Zayed H. Deep Transfer Learning in Diagnosing Leukemia in Blood Cells. Computers. 2020; 9(2):29. https://doi.org/10.3390/computers9020029
Chicago/Turabian StyleLoey, Mohamed, Mukdad Naman, and Hala Zayed. 2020. "Deep Transfer Learning in Diagnosing Leukemia in Blood Cells" Computers 9, no. 2: 29. https://doi.org/10.3390/computers9020029
APA StyleLoey, M., Naman, M., & Zayed, H. (2020). Deep Transfer Learning in Diagnosing Leukemia in Blood Cells. Computers, 9(2), 29. https://doi.org/10.3390/computers9020029