Deep Validation of Spatial Temporal Features of Synthetic Mobility Models

 ,
, 
Abstract
1. Introduction
2. Preliminaries
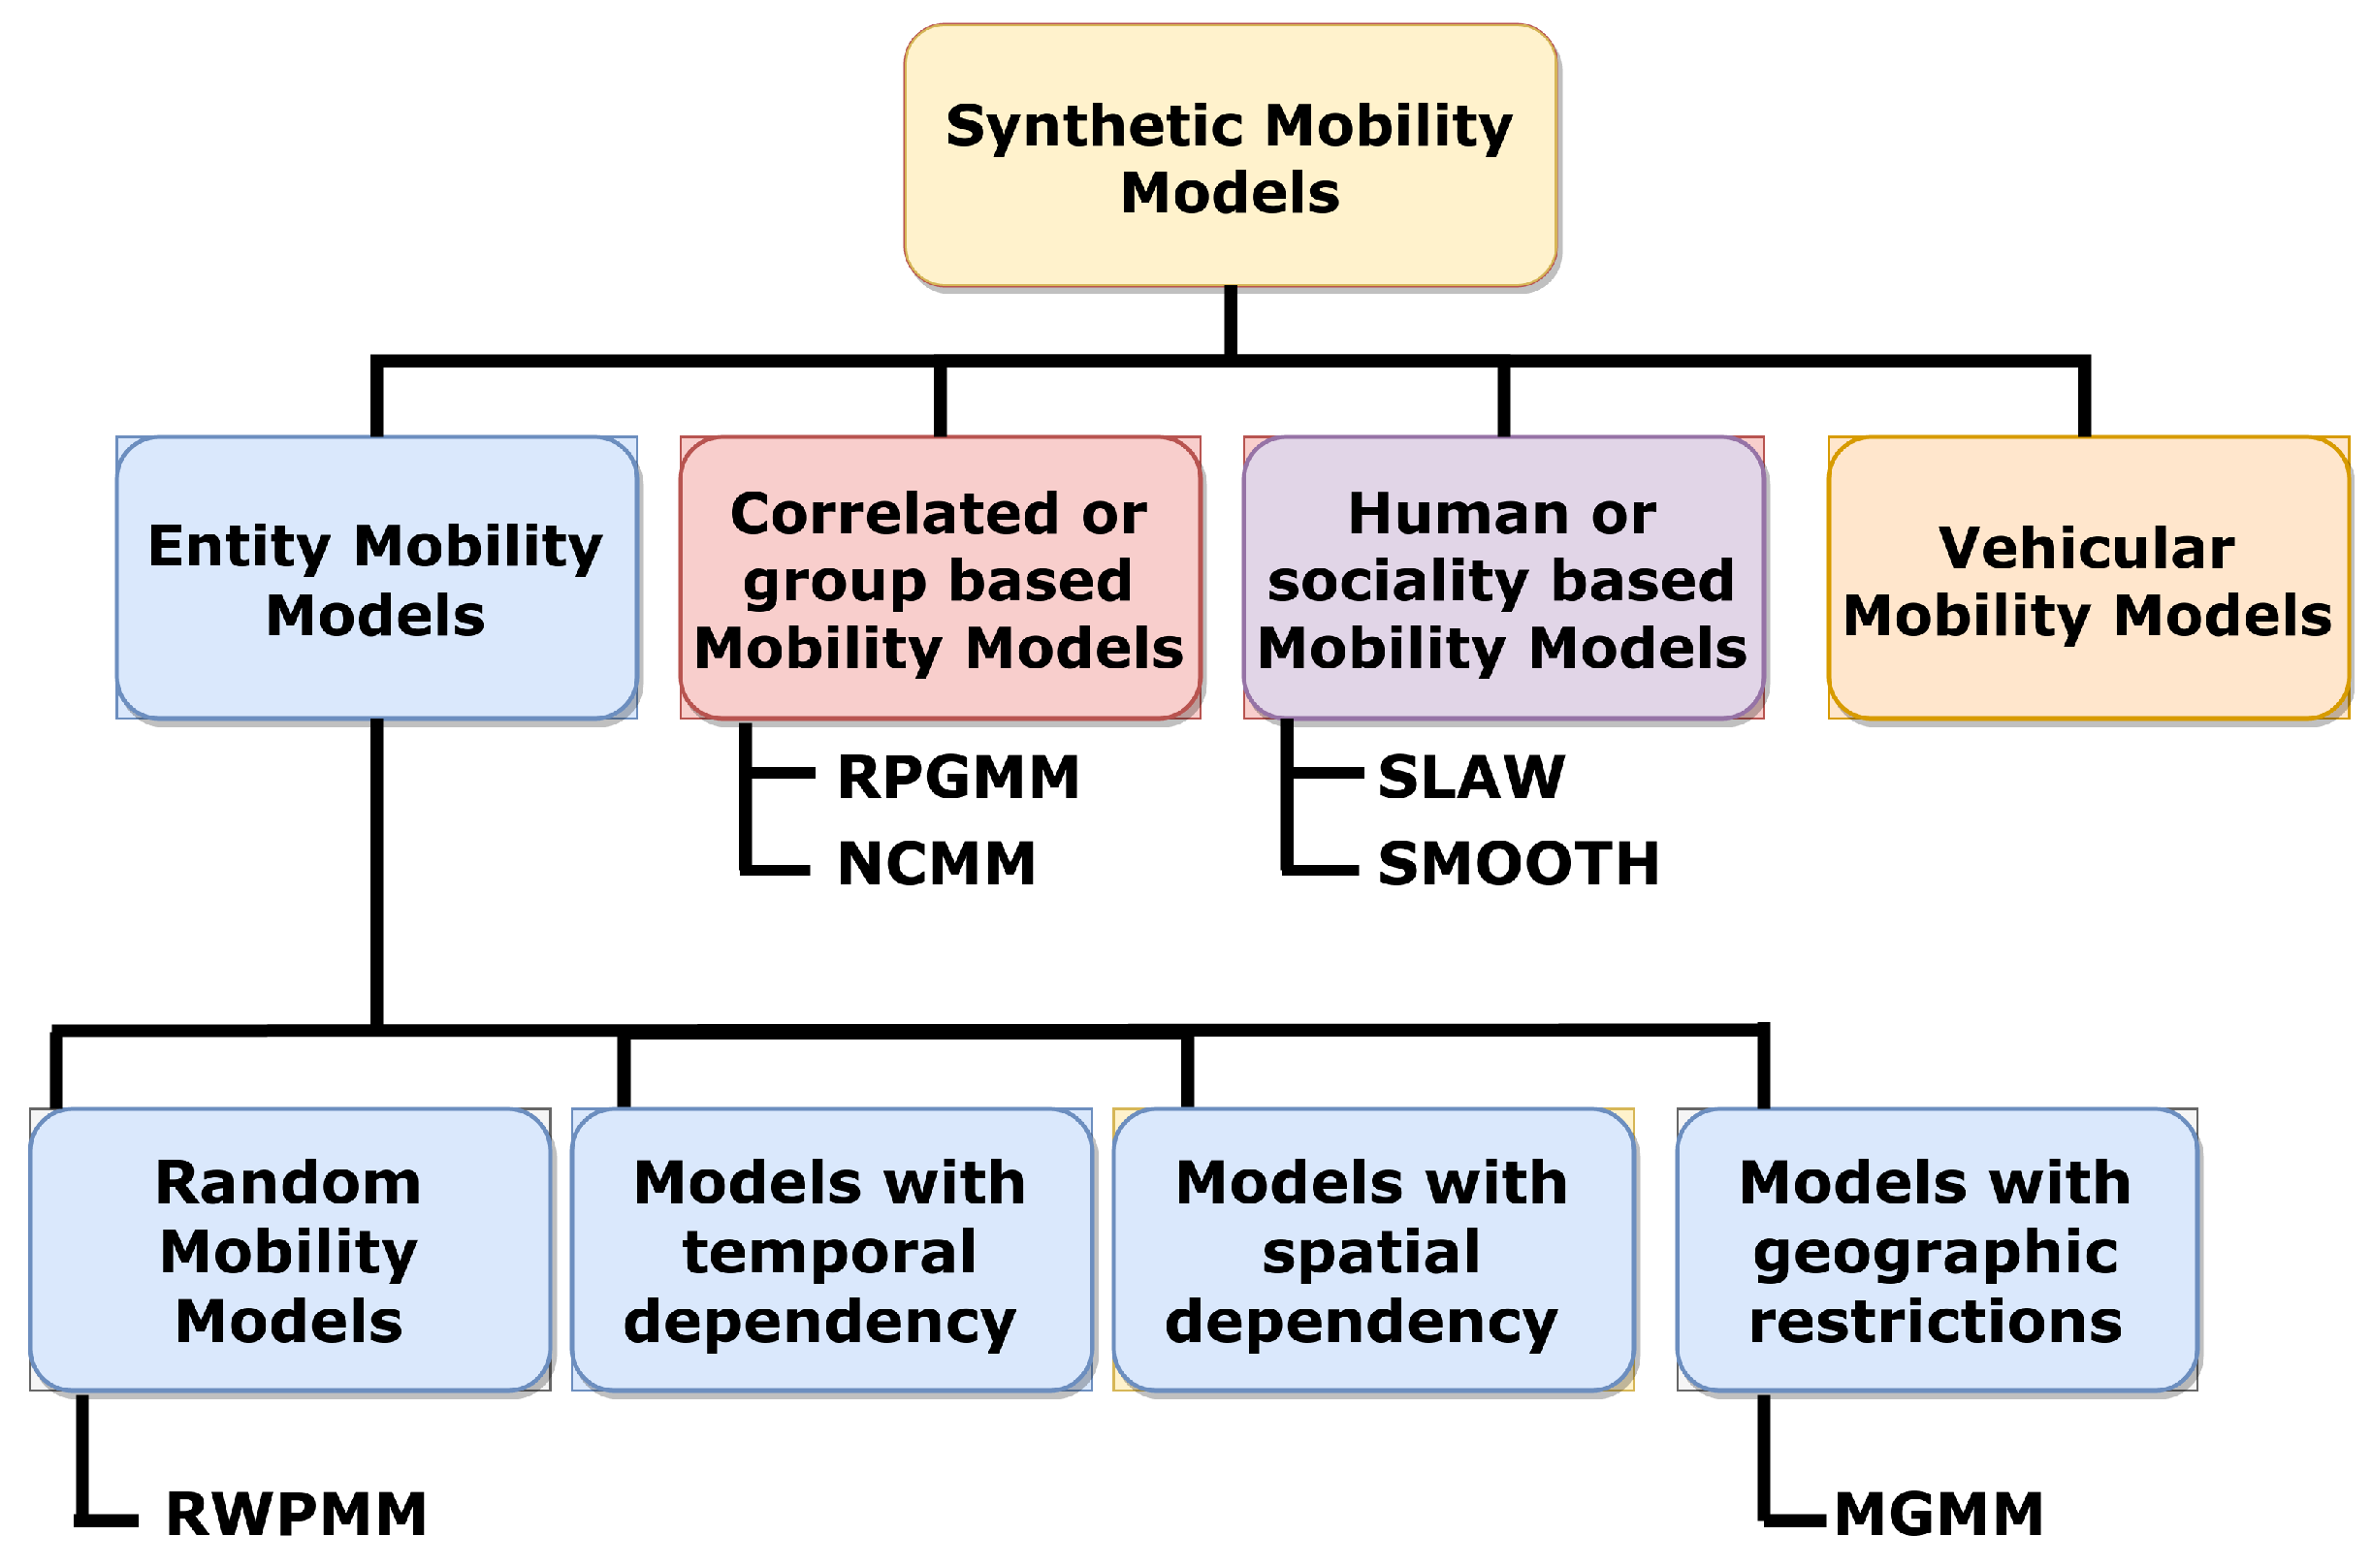
- Entity MMs [19]: In this class, each mobile node is autonomous, moving in the network independently of other nodes. This class may be further divided into four subclasses: random mobility models, models with temporal dependencies, models with spatial dependencies, and models with geographic restrictions.
- Correlated or group-based MMs [20]: In this class, the motion of nodes is correlated and related to the movement of other nodes. The whole network is split into many groups of nodes, where each group is governed by one leader. This may be a logical leader in the network or a pre-defined node, for example, the Reference Point Group Mobility (RPGM) model [21] or the Nomadic Community Mobility Model (NCMM) [22].
- Vehicular MMs [25]: In this class, the nodes imitate the movement of a real vehicle by taking into consideration stops at traffic signals, speed variation, and queuing along highways [26]. This category shows remarkable superior performance due to vehicular communications of intelligent transport systems which are applied in smart cities [27]. This family is not the focus of the validation performed in this paper.
- The first experimental pattern is that of the RWPMM, which belongs to the random subclass of entity MMs. It was first defined by Johnson and Maltz [28] and then became a benchmark for mobility modeling of mobile ad-hoc networks. Using this pattern, nodes choose a new speed that is uniformly distributed within an established range to move toward the next waypoint during a given period. The node stops at the destination for a specific pause time and then repeats the whole process until the experimental time has elapsed. This model takes into consideration neither previous mobility decisions nor the relation between time, speed, and distance [29]. This memoryless property leads to an unrealistic motion as a consequence of the abrupt stops and sharp turns [30].
- The second validated pattern is the Manhattan Grid Mobility Model (MGMM) [31]. This is an entity synthetic mobility model with geographic restrictions. It represents a variation of the pathway/city section mobility model [32]. In this case, mobile nodes move not randomly but according to existing roads and paths. The MGMM attempts to imitate the motion motif of mobile nodes on streets defined on maps. It uses a grid-road-based topology and a probabilistic method to generate node movements where a node can turn either left or right with the same probability of 0.25 or maintain a straight movement with a probability of 0.5 [33].
- The third validated mobility pattern is the RPGM model [21]. This model belongs to the class of correlated or group-based mobility models where nodes behave in a co-operative manner and move in groups. Each group follows a reference point considered as the group leader, namely a node which may be a pre-defined leader or a center node. The motion of the entire group depends on the leader’s movement, including its speed and direction. This model successfully mimics diverse mobility behaviors, such as battlefield movements and disaster relief.
- The fourth verified mobility pattern is the Nomadic Community Mobility Model (NCMM) [22]. This model belongs to the class of correlated or group-based mobility models, which represent movement scenarios of a group where several nodes move together based on a single reference point. The whole group moves randomly from a given position to another one according to the mobility decisions of the leader. This mobility pattern is applied in mobile communications such as military applications, conferences, and museum visits by classes of students.
- The fifth pattern is the Self-Similar Least Action Walk (SLAW) [34]. This model belongs to the Human class. It considers that people are usually attracted and confined to popular places that are often rare. These places have high popularity and are clustered close together. On the other hand, less popular locations are numerous and far from each other. This is recognized as a fractal distribution of waypoints. This model integrates five major characteristics of human mobility:
- -
- self-similar dispersion of destinations;
- -
- truncated power-law inter-contact times;
- -
- heavy-tail flight and pause-time distribution;
- -
- least-action trip planning (LATP);
- -
- heterogeneously bounded mobility areas of individuals.
- The last pattern is SMOOTH [32], which belongs to the Human class. This model incorporates two major mobility features: pause time and truncated power-law distribution of flight length. The whole simulation field is split into a number of landmarks which represent communities, with clusters where each node is initially located randomly inside a cluster. In addition, the pause time follows the truncated power-law distribution, and nodes’ velocities are proportional to the flight length.
3. Validation of Mobility Models
- The four validated mobility metrics are the speed decay problem, spatial node distribution, density wave phenomenon, and average neighbor percentage.
- The six verified mobility models are distributed as follows: there are two entity models, the RWPMM and the MGMM, two correlated models, the RPGMM and the NCMM, and two human models: SLAW and SMOOTH.
- A spread out field of 1030 × 1030 m is considered as a very prominent mobility pattern.
- One hundred twenty different scenarios are examined with trials of 20 iterations per model over 1000 s and an average speed of 5 m/s.
3.1. Speed Decay Problem
- From Figure 2e,f, we conclude that human models suffer heavily from the speed decay problem and show the worst average speed. Even in the case where a specific speed is fixed, it will not be deployed by these models because it is lower than 5 m/s during the whole simulation period. This problem mainly relates to the non-attributed speed, acceleration, and deceleration in these models, as strictly reported by the settings of these models in Table 3.
- Figure 2c shows that the RPGMM presents a speed that fluctuates with time, starting from the specified speed and then oscillating between 0 and 5 m/s. This is due to the correlated strategy of mobile nodes. The nodes form several groups and each group has a leader that takes all mobility decisions. Sometimes, a node changes group and follows another group leader with a different speed. Table 3 also highlights that speed is based on reference points, while this validation metric precisely indicates that speed is uniformly distributed according to the reference points.
- In Figure 2b, the MGMM represents a nearly stable speed during the entire simulation. MGMM fluctuates in an acceptable margin between 5 and 5.25 m/s. This allows it to be steadier due to the adopted movement strategy, which is based on a uniform division of the simulation field with a constant or uniform speed, as depicted in Table 3.
- According to Figure 2d, we remark that the NCMM presents the best average speed out of all the validated models that keep the same speed during the simulation. This result mainly does not agree with the principal methodology of using the non-attributed speed, acceleration, and deceleration as shown in Table 3. Therefore, a relevant outcome of this research and this validation is that the NCMM showed a constant speed during the experiment since all MNs belong to a single leader.
3.2. Density Wave Phenomenon
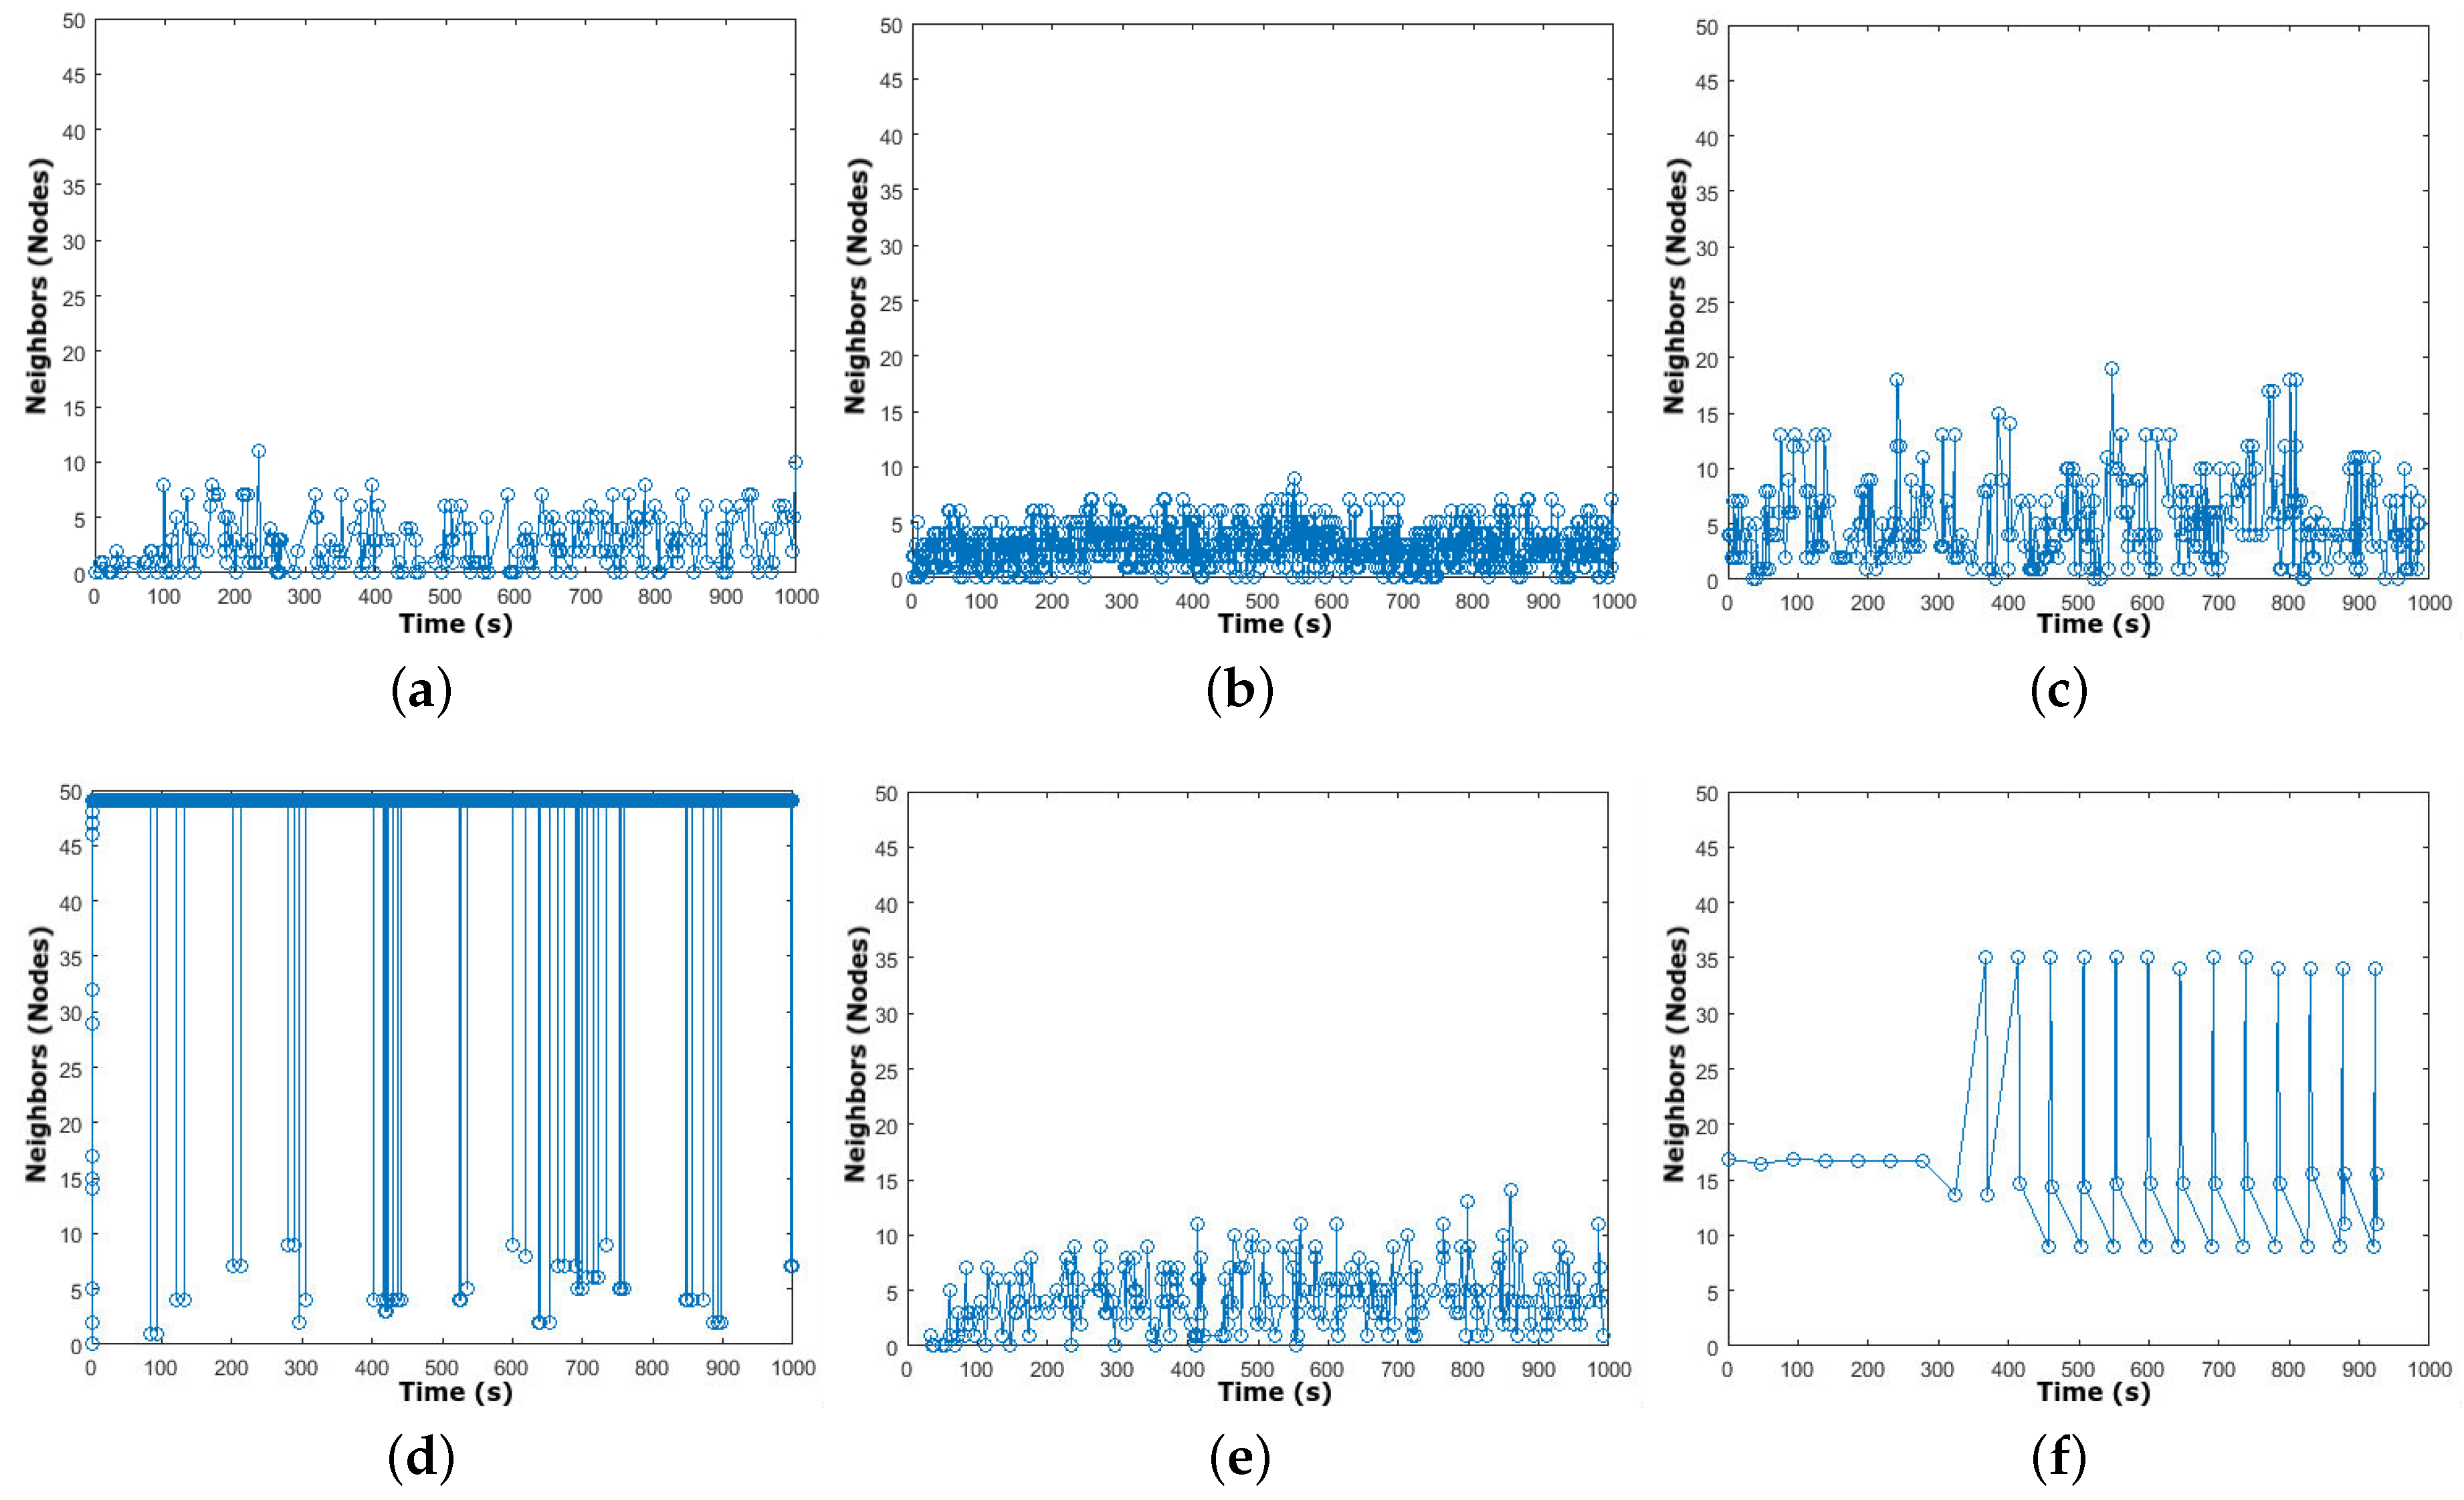
- Entity models show, in Figure 3a,b, the worst density wave behavior when they are limited between 0 and 11 and between 0 and 9 for the RWPMM and the MGMM, respectively. Due to their independent selection of destination positions, nodes move independently without taking into consideration other nodes’ mobility decisions, with regard to directions and destinations.
- In Figure 3e, the SLAW oscillates moderately between 0 and 14 with certain moments in which the node has no neighbor due to the probabilistic distribution of nodes.
- However, the correlated RPGMM and NCMM show the best outcomes when considering only the effect of this issue. The output of these models fluctuate in a satisfactory range with fewer time instants without any neighbor, as shown in Figure 3c,d. These sub-figuresrefer to group-based movement where a mobile node always belongs to a specific group with the attached nodes.
- SMOOTH outperforms the other models when considering this property in the range of 8 to 35, as shown in Figure 3f. We can remark that the mobile node had at least eight neighbors during the simulation, which shows the best packet delivery ratio.
3.3. Average Neighbor Percentage
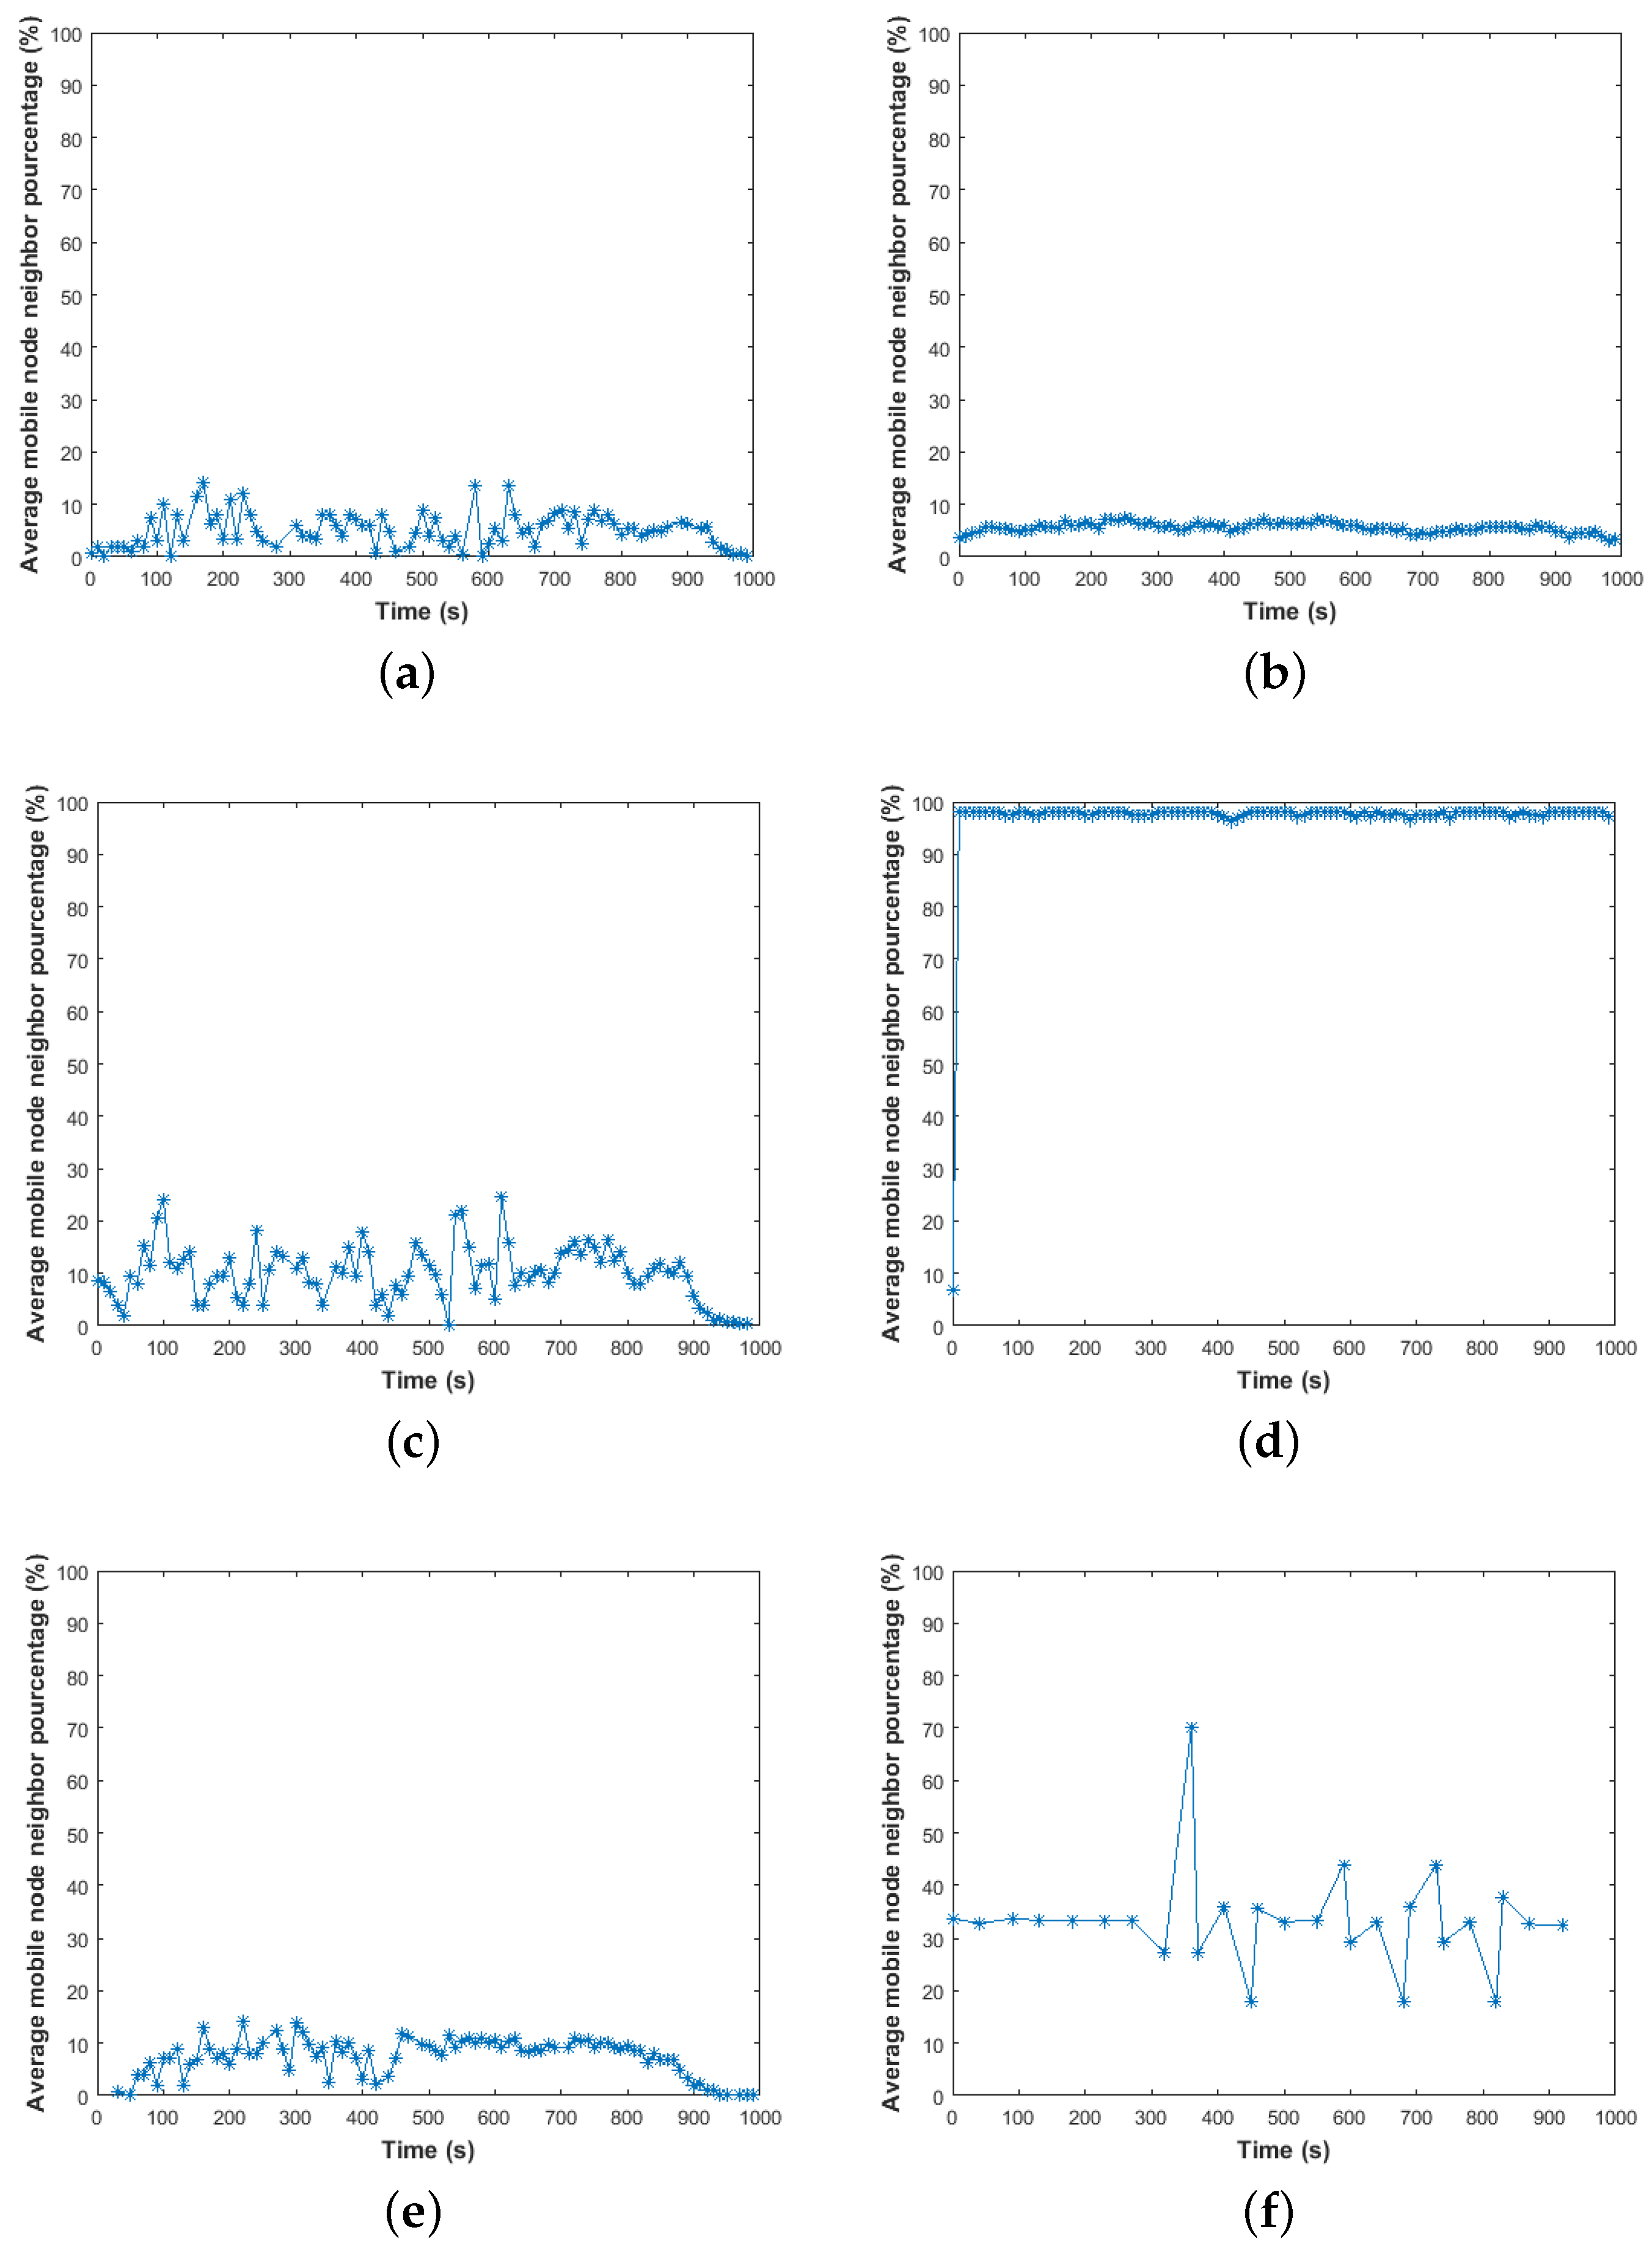
- According to Figure 4a, the RWPMM presents the worst outcomes, where it fluctuates in a range of 0–16% with many detected time instants without any neighbors. At these moments, if a mobile node sends a packet, it finds no receiver to which these data can be forwarded. This behavior further increases the number of lost packets, and decreases the PDR of the RWPMM.
- From Figure 4b, the MGMM shows small fluctuations in the range of 4–9%, and more than two neighbors from the total of 49 nodes are always present. This allows this model to perform better than the RWPMM, but it stays enough to offer best performances.
- From Figure 4c,e, SLAW and the RPGMM show better results than the RWPMM and the MGMM. These models fluctuate in the ranges 0–18% and 0–25%, respectively, with fewer time instants are without any neighbors.
- However, from Figure 4d,f, SMOOTH and the NCMM have ranges of 18–70% and 8–98%, respectively. They both provide the best results, having more than four neighbors during the entire simulation. This feature allows them to outperform other models in mobile networks as they can deliver all the packets [36]. These models are more stable than other models.
3.4. Spatial Node Distribution
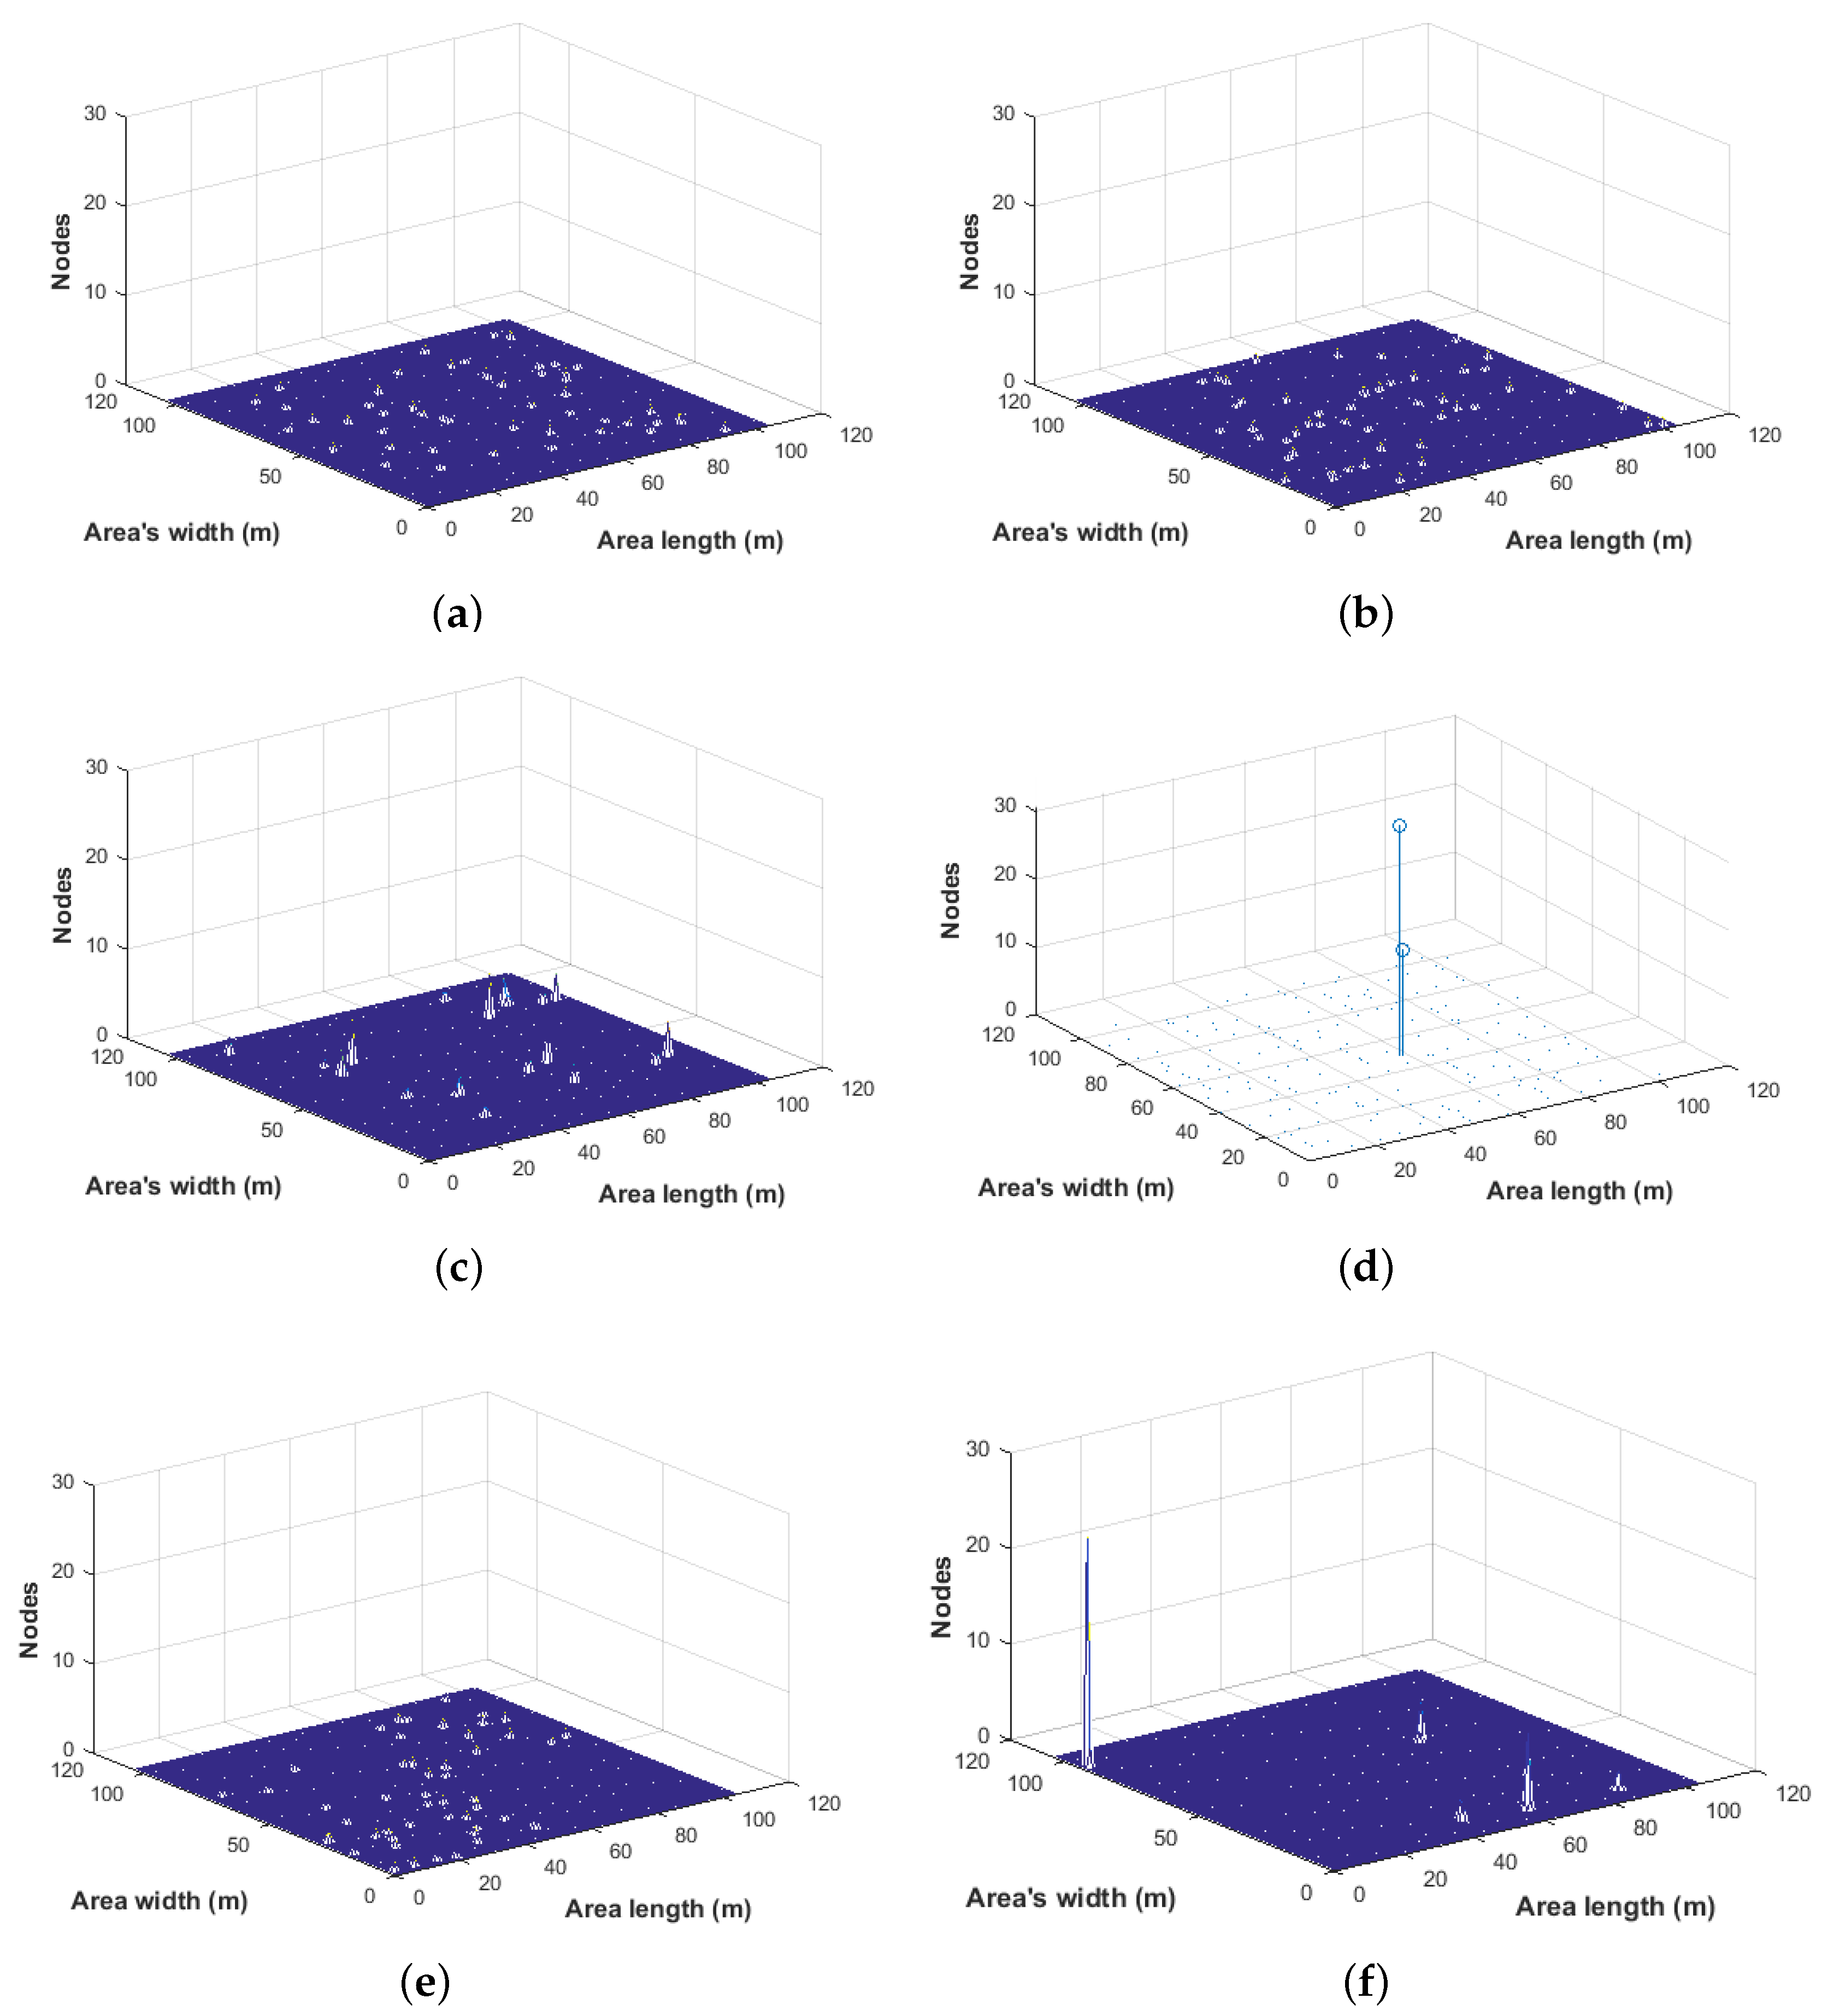
- Figure 5c,f provide insufficient results due to nodes gathering near the leaders in the RPGMM or in populated locations in SMOOTH. If the groups are sparsely located, the mobility model will show the worst performance if any intermediate neighbor is reached during transmission. This results in a more fragile network that is highly partitioned with many free simulation spaces.
- Based on Figure 5b,e, we remark that SLAW and the MGMM are slightly more distributed in the simulation field compared to the RWPMM, SMOOTH, and the RPGMM. Due to the area division in the MGMM, the mobile nodes are located at the boundaries with few empty spaces compared to the RWPMM in Figure 5a. This later represents the worst spatial distribution, being mainly based on totally random movement decisions.
- Figure 5d shows the best results, with all mobile nodes being located within one area which is governed by a nomadic leader while moving. This proves that all the nodes belong to just one reference point. The outcome of Figure 4d is exemplary with nearly 98% of nodes gathering together due to the concentrated spatial distribution of all nomadic nodes in one specific area.
4. The Proposed Metric: The Mobile Neighbors Range
- Principle: We assess a set of synthetic mobility models of each pattern in order to define the range of the number of neighbors for all mobile nodes within the simulation. We generate all mobility models with a propagation range of 150 m. For this reason, a threshold setting (150 m) is present in our new metric to exactly reflect the correct outcomes. Then, we remove the lowest and highest values of the total number of neighbors recorded. Therefore, this metric makes it possible to inspect a total predefined propagation range based on all the mobility parameters, whatever the inspected node, the targeted model, and the time instant are. This property is calculated using the following Algorithm 1.

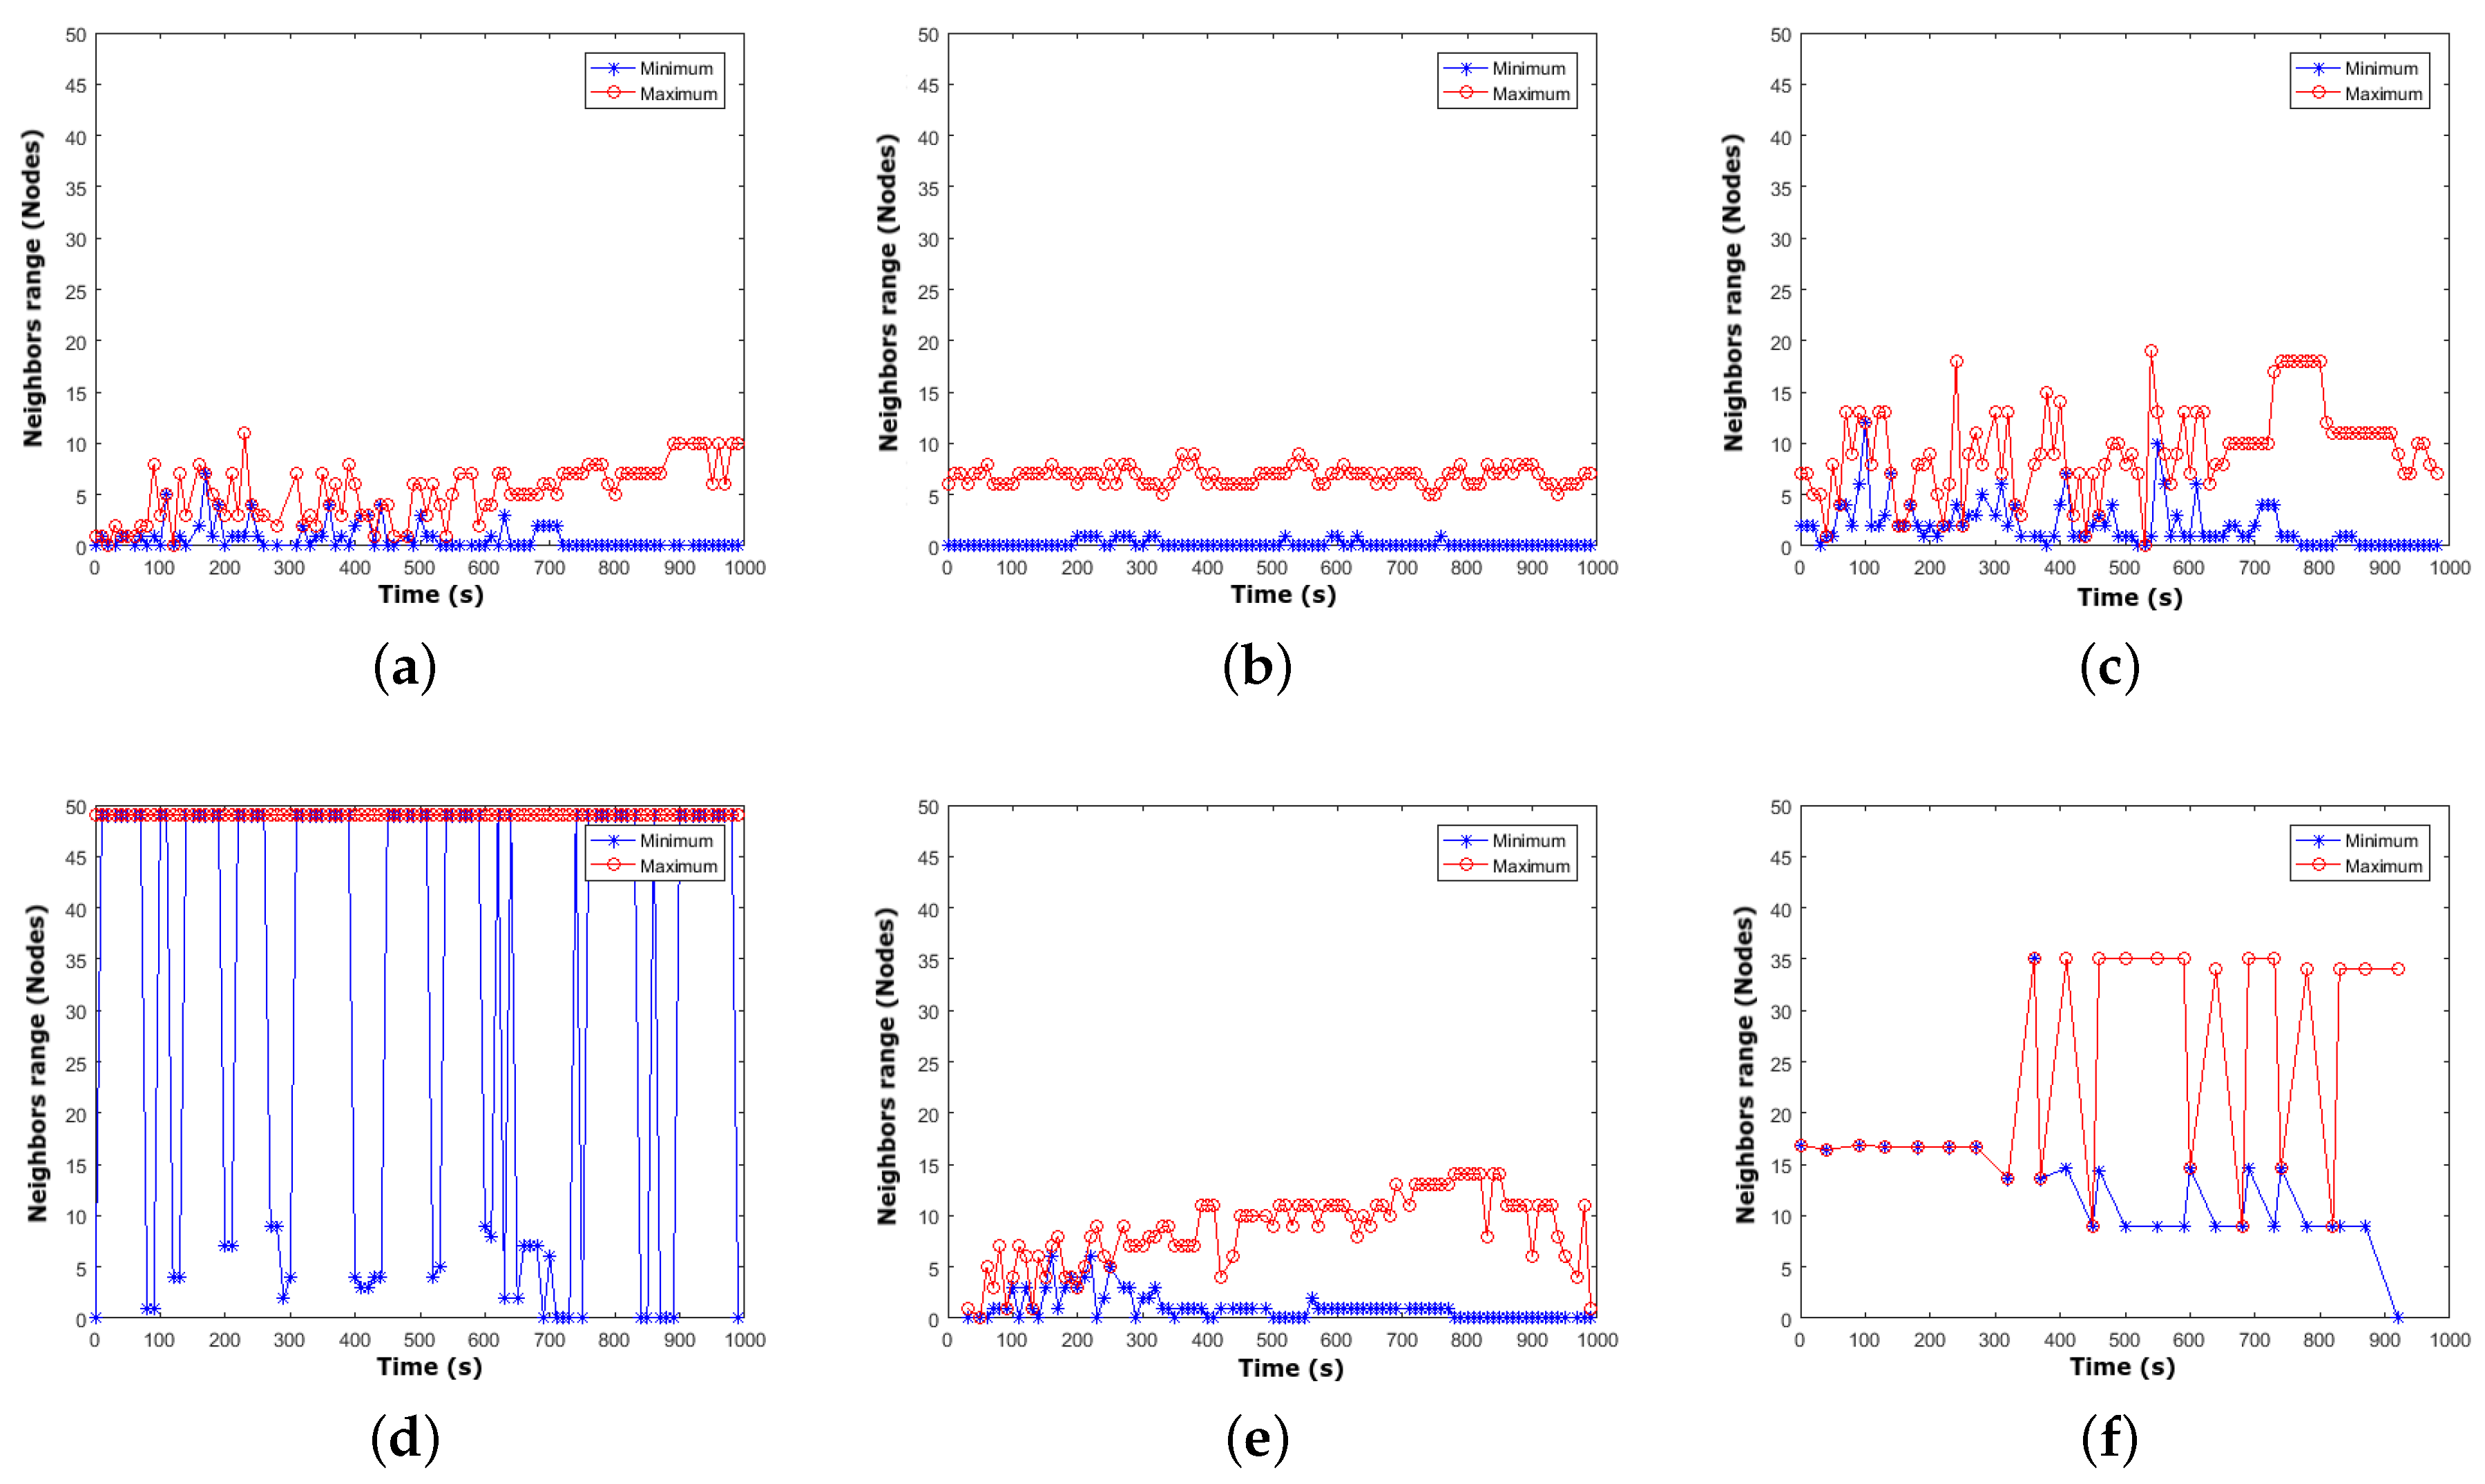
- Validation and results: The validation results are depicted in Figure 6. We observe that:
- -
- Based on Figure 6a,b, the RWPMM and the MGMM represent the worst mobility models according to this property, as they suffer dramatically from variation in the number of neighbors with time. However, the MGMM shows convenient oscillatory fluctuations of 0–9 with an obvious and regular gap, but with many instants in which there are no neighbors. This is in strong agreement with the results of previous metrics, such as the density wave phenomenon.
- -
- SLAW and the RPGMM show average performances with ranges of [0,14] and [0,19], respectively, according to Figure 6e,c. The RWPMM shows an irregular gap during the simulation within a moderate range. Some acceptable instants with no neighbors were recorded.
- -
- Figure 6d,f show that the NCMM and SMOOTH have few instants with no neighbors, and the range promptly converges to benefit the most possible from all deployed nodes. The NCMM peaks at 49 neighbors, which means it is the best model due to the correlated strategy of belonging to a single group with one leader for all mobile nodes (49 + the leader = 50 applied nodes (Table 2).
- Interpretations: After carrying out 600 trials for the mobile neighbor’s range, the following was found:
- -
- At instants with 0 at the minimum line (blue chart), one or several deployed nodes have no detected neighbors.
- -
- Moreover, the line maximum is too far away from the total number of mobile nodes deployed. This leads to a worse mobility model with an irregular gap in the mobile neighbors range with unsteadiness within experimental time.
- -
- Conversely, when the obtained lines have acceptable or big margin fluctuations, the minimum does not equal 0 and the maximum comes closer to the total number of nodes. This reflects the fact that the validated mobility model is more stable and steady with time that will lead to satisfactory outcomes in the performance analysis [3].

5. Mobility Metrics Global Intention
- The density wave phenomenon is only obtained for a unique node during the simulation. It inspects one node to only reflect the fluctuation of the number of neighbors of the validated node. Verifying this property for all mobile nodes used in the simulation would be a worthless task.
- The average number of mobile nodes denotes the average number of neighbors of a specific node during the simulation. This metric is inaccurate in the cases in which it is lower or higher than the number of neighbors of all mobile nodes at a given time instant. This feature makes this metric inaccurate in reflecting exact changes in neighbor variability.
- The spatial node distribution must be validated at a concrete time instant because it cannot show all location changes over a continuous period.
- The speed decay problem only produces speed variation per time instant without taking into consideration the exact spatial locations of nodes.
6. Mobility Metrics and Resources Management Overview
7. Conclusions
Author Contributions
Funding
Conflicts of Interest
Abbreviations
| DTN | Delay Tolerant Networking |
| IoT | Internet of things |
| M2M | Machine-to-Machine |
| MGMM | Manhattan Grid Mobility Model |
| MMs | Mobility models |
| MNs | Mobile nodes |
| NCMM | Nomadic Community Mobility Model |
| PDR | Packet Delivery Ratio |
| PSN | Pocket Switched Networks |
| QoS | Quality of Service |
| RPGMM | Reference Point Group Mobility Model |
| RWPMM | Random Waypoint Mobility Model |
| SLAW | Self-Similar Least Action Walk |
| WSN | Wireless Sensor Network |
References
- An, B.; Papavassiliou, S. A mobility-based clustering approach to support mobility management and multicast routing in mobile ad-hoc wireless networks. Int. J. Netw. Manag. 2001, 11, 387–395. [Google Scholar] [CrossRef]
- Hong, X.; Kwon, T.J.; Gerla, M.; Gu, D.L.; Pei, G. A mobility framework for ad hoc wireless networks. In Proceedings of the International Conference on Mobile Data Management, Hong Kong, China, 8–10 January 2001; Springer: Berlin/Heidelberg, Germany, 2001; pp. 185–196. [Google Scholar]
- Ibadah, N.; Minaoui, K.; Rziza, M.; Oumsis, M. Experimental Synthesis of Routing Protocols and Synthetic Mobility Modeling for MANET. In Proceedings of the 6th International Conference on Sensor Networks (SENSORNETS 2017), Porto, Portugal, 19–21 February 2017; pp. 168–173. [Google Scholar]
- Pramanik, A.; Choudhury, B.; Choudhury, T.S.; Arif, W.; Mehedi, J. Behavioral study of Random Waypoint Mobility Model based energy aware MANET. In Proceedings of the 2016 3rd IEEE International Conference on Signal Processing and Integrated Networks (SPIN), Noida, Indian, 11–12 February 2016; pp. 624–629. [Google Scholar]
- Mitsche, D.; Resta, G.; Santi, P. The random waypoint mobility model with uniform node spatial distribution. Wirel. Netw. 2014, 20, 1053–1066. [Google Scholar] [CrossRef]
- Wang, W.; Chen, Y.; Chen, H.; Kong, X.; Chen, J. Parameter Characteristics of Gauss-Markov Mobility Model in Mobile Wireless Sensor Networks. Ad Hoc Sens. Wirel. Netw. 2016, 34, 257–272. [Google Scholar]
- Gong, Z.; Haenggi, M. Interference and outage in mobile random networks: Expectation, distribution, and correlation. IEEE Trans. Mob. Comput. 2014, 13, 337–349. [Google Scholar] [CrossRef]
- Guo, J.; Durrani, S.; Zhou, X. Outage probability in arbitrarily-shaped finite wireless networks. IEEE Trans. Commun. 2014, 62, 699–712. [Google Scholar] [CrossRef]
- Noguchi, T.; Kobayashi, T. Adaptive Location-Aware Routing with Directional Antennas in mobile adhoc networks. In Proceedings of the 2017 IEEE International Conference on Computing, Networking and Communications (ICNC), Silicon Valley, CA, USA, 26–29 January 2017; pp. 1006–1011. [Google Scholar]
- Ghosh, A.; Thomas, T.A.; Cudak, M.C.; Ratasuk, R.; Moorut, P.; Vook, F.W.; Rappaport, T.S.; MacCartney, G.R.; Sun, S.; Nie, S. Millimeter-wave enhanced local area systems: A high-data-rate approach for future wireless networks. IEEE J. Sel. Areas Commun. 2014, 32, 1152–1163. [Google Scholar] [CrossRef]
- Rangan, S.; Rappaport, T.S.; Erkip, E. Millimeter-wave cellular wireless networks: Potentials and challenges. Proc. IEEE 2014, 102, 366–385. [Google Scholar] [CrossRef]
- Almomani, O.; Al-Shugran, M.; Alzubi, J.A.; Alzubi, O.A. Performance evaluation of position-based routing protocols using different mobility models in manet. Int. J. Comput. Appl. 2015, 119, 43–48. [Google Scholar] [CrossRef]
- Reina, D.; Toral, S.; Johnson, P.; Barrero, F. A survey on probabilistic broadcast schemes for wireless ad hoc networks. Ad Hoc Netw. 2015, 25, 263–292. [Google Scholar] [CrossRef]
- Ibadah, N.; Minaoui, K.; Rziza, M.; Oumsis, M.; Benavente-Peces, C. Smart Collection of Real-Time Vehicular Mobility Traces. Future Internet 2018, 10, 78. [Google Scholar] [CrossRef]
- Chaintreau, A.; Hui, P.; Crowcroft, J.; Diot, C.; Gass, R.; Scott, J. Impact of human mobility on opportunistic forwarding algorithms. IEEE Trans. Mob. Comput. 2007, 6, 606–620. [Google Scholar] [CrossRef]
- Hui, P.; Chaintreau, A.; Scott, J.; Gass, R.; Crowcroft, J.; Diot, C. Pocket switched networks and human mobility in conference environments. In Proceedings of the 2005 ACM SIGCOMM Workshop on Delay-Tolerant Networking, Philadelphia, PA, USA, 26 August 2005; ACM: New York, NY, USA, 2005; pp. 244–251. [Google Scholar]
- Cacciapuoti, A.S.; Calabrese, F.; Caleffi, M.; Di Lorenzo, G.; Paura, L. Human-mobility enabled wireless networks for emergency communications during special events. Pervasive Mob. Comput. 2013, 9, 472–483. [Google Scholar] [CrossRef]
- Cacciapuoti, A.S.; Calabrese, F.; Caleffi, M.; Di Lorenzo, G.; Paura, L. Human-mobility enabled networks in urban environments: Is there any (mobile wireless) small world out there? Ad Hoc Netw. 2012, 10, 1520–1531. [Google Scholar] [CrossRef]
- Zhu, C.; Shu, L.; Hara, T.; Wang, L.; Nishio, S.; Yang, L.T. A survey on communication and data management issues in mobile sensor networks. Wirel. Commun. Mob. Comput. 2014, 14, 19–36. [Google Scholar] [CrossRef]
- Aung, C.Y.; Seet, B.C.; Zhang, M.; Xie, L.F.; Chong, P.H.J. A review of group mobility models for mobile ad hoc networks. Wirel. Pers. Commun. 2015, 85, 1317–1331. [Google Scholar] [CrossRef]
- Reina, D.; Toral, S.; Barrero, F.; Bessis, N.; Asimakopoulou, E. Modelling and assessing ad hoc networks in disaster scenarios. J. Ambient Intell. Hum. Comput. 2013, 4, 571–579. [Google Scholar] [CrossRef]
- Abed, A.K.; Oz, G.; Aybay, I. Influence of mobility models on the performance of data dissemination and routing in wireless mobile ad hoc networks. Comput. Electr. Eng. 2014, 40, 319–329. [Google Scholar] [CrossRef]
- Pirozmand, P.; Wu, G.; Jedari, B.; Xia, F. Human mobility in opportunistic networks: Characteristics, models and prediction methods. J. Netw. Comput. Appl. 2014, 42, 45–58. [Google Scholar] [CrossRef]
- Hiranandani, D.; Obraczka, K.; Garcia-Luna-Aceves, J. MANET protocol simulations considered harmful: The case for benchmarking. IEEE Wirel. Commun. 2013, 20, 82–90. [Google Scholar] [CrossRef]
- Ros, F.J.; Martinez, J.A.; Ruiz, P.M. A survey on modeling and simulation of vehicular networks: Communications, mobility, and tools. Comput. Commun. 2014, 43, 1–15. [Google Scholar] [CrossRef]
- Al-Sultan, S.; Al-Doori, M.M.; Al-Bayatti, A.H.; Zedan, H. A comprehensive survey on vehicular Ad Hoc network. J. Netw. Comput. Appl. 2014, 37, 380–392. [Google Scholar] [CrossRef]
- Rawat, D.B.; Zhao, Y.; Yan, G.; Song, M. CRAVE: Cognitive radio enabled vehicular communications in heterogeneous networks. In Proceedings of the 2013 IEEE Radio and Wireless Symposium, Austin, TX, USA, 20–23 January 2013; pp. 190–192. [Google Scholar]
- Khelifi, M.; Benyahia, I.; Moussaoui, S.; Naït-Abdesselam, F. An overview of localization algorithms in mobile wireless sensor networks. In Proceedings of the 2015 International Conference on Protocol Engineering (ICPE) and International Conference on New Technologies of Distributed Systems (NTDS), Paris, France, 22–24 July 2015; pp. 1–6. [Google Scholar]
- Bettstetter, C.; Wagner, C. The Spatial Node Distribution of the Random Waypoint Mobility Model. WMAN 2002, 11, 41–58. [Google Scholar]
- Bettstetter, C.; Hartenstein, H.; Pérez-Costa, X. Stochastic properties of the random waypoint mobility model. Wirel. Netw. 2004, 10, 555–567. [Google Scholar] [CrossRef]
- Santi, P. Mobility Models for Next Generation Wireless Networks: Ad Hoc, Vehicular and Mesh Networks; John Wiley & Sons: New York, NY, USA, 2012. [Google Scholar]
- Xie, J.; Wan, Y.; Kim, J.H.; Fu, S.; Namuduri, K. A survey and analysis of mobility models for airborne networks. IEEE Commun. Surv. Tutor. 2014, 16, 1221–1238. [Google Scholar] [CrossRef]
- Chiu, T.C.; Shih, Y.Y.; Pang, A.C.; Jeng, J.Y.; Hsiu, P.C. Mobility-aware charger deployment for wireless rechargeable sensor networks. In Proceedings of the 2012 14th Asia-Pacific Network Operations and Management Symposium (APNOMS), Seoul, Korea, 25–27 September 2012; pp. 1–7. [Google Scholar]
- Munjal, A.; Navidi, W.C.; Camp, T. Steady-state of the SLAW mobility model. J. Commun. 2014, 9, 322–331. [Google Scholar] [CrossRef]
- Kaur, C. A comprehensive view of mobility models in Wireless Ad hoc Networks. Networks 2012, 3, 49–54. [Google Scholar]
- Zhao, M.; Wang, W. Analyzing topology dynamics in ad hoc networks using a smooth mobility model. In Proceedings of the 2007 IEEE Wireless Communications and Networking Conference (WCNC), Kowloon, China, 11–15 March 2007; pp. 3279–3284. [Google Scholar]
- Gerla, M.; Tsai, J.T.C. Multicluster, mobile, multimedia radio network. Wirel. Netw. 1995, 1, 255–265. [Google Scholar] [CrossRef]
- Lin, C.R.; Gerla, M. Adaptive clustering for mobile wireless networks. IEEE J. Sel. Areas Commun. 1997, 15, 1265–1275. [Google Scholar] [CrossRef]
- Chiang, C.C.; Wu, H.K.; Liu, W.; Gerla, M. Routing in clustered multihop, mobile wireless networks with fading channel. Proc. IEEE SICON 1997, 97, 197–211. [Google Scholar]
- Tsiropoulou, E.E.; Paruchuri, S.T.; Baras, J.S. Interest, energy and physical-aware coalition formation and resource allocation in smart IoT applications. In Proceedings of the 2017 51st IEEE Annual Conference on Information Sciences and Systems (CISS), Baltimore, MD, USA, 22–24 March 2017; pp. 1–6. [Google Scholar]
- Tsiropoulou, E.E.; Mitsis, G.; Papavassiliou, S. Interest-aware energy collection & resource management in machine to machine communications. Ad Hoc Netw. 2018, 68, 48–57. [Google Scholar]
- Tsiropoulou, E.; Koukas, K.; Papavassiliou, S. A Socio-Physical and Mobility-Aware Coalition Formation Mechanism in Public Safety Networks. EAI Endorsed Trans. Future Internet 2018, 4, 154176. [Google Scholar] [CrossRef]


| Mobility Models | Realistic | Scalable | Possibility of a | Uses |
|---|---|---|---|---|
| Mathematical Representation | Geographic Map | |||
| RWMM | N | Y | Y | N |
| MGMM | N | Y | N | N |
| RPGMM | N | Y | A | N |
| NMM | N | Y | N | N |
| SLAW | Y | N | A | Y |
| SMOOTH | N | Y | N | Y |
| Parameters | Values |
|---|---|
| Number of nodes | 50 |
| Speed | 5 m/s |
| Pause time (s) | 0 |
| Mobility models | RWPMM, MGMM (Entity models) |
| RPGMM, NCMM (Correlated MMs) | |
| SLAW, SMOOTH (Human MMs) | |
| Mobility metrics | Speed decay problem |
| Spatial node distribution | |
| Density wave phenomenon | |
| Average node neighbor percentage | |
| Area | 1030 m × 1030 m |
| Simulation time | 1000 s |
| Iterations | 20 times |
| Implementation tool | MATLAB |
| Mobility Models | Model Class | Speed | Direction | Acceleration/Deceleration | Pause Time | Flight | Return Time and |
|---|---|---|---|---|---|---|---|
| Length | Visiting Frequency | ||||||
| RWPMM | Random | UD | NA | NA | C/UD | NA | NA |
| (Entity) | |||||||
| MGMM | Geographic | C/UD | UD on set | NA | C/UD | NA | NA |
| restrictions (Entity) | of waypoints | ||||||
| RPGMM | Correlated/ | Based on | Based on | NA | C/UD | NA | NA |
| Group based | reference point | reference point | |||||
| NCMM | Correlated/ | NA | Around the | NA | NA | NA | NA |
| Group based | reference point | ||||||
| SLAW | Human | NA | PD on set | NA | TPL | TPL | P |
| destinations | |||||||
| SMOOTH | Human | NA | PD on set | NA | TPL | TPL | P |
| destinations |
| Mobility Models | ||||||
|---|---|---|---|---|---|---|
| Mobility Metrics | Entity | Correlated | Human | |||
| RWPMM | MGMM | RPGMM | NCMM | SLAW | SMOOTH | |
| Speed decay problem | 3 | 2 | 4 | 1 | 5 | 6 |
| Density wave phenomenon | 5 | 6 | 3 | 2 | 4 | 1 |
| Average neighbor percentage | 6 | 5 | 4 | 1 | 3 | 2 |
| Spatial node distribution | 6 | 5 | 3 | 1 | 4 | 2 |
| * Mobile neighbors range | 6 | 5 | 3 | 1 | 4 | 2 |
| Mobility Metrics | Validation Features | ||
|---|---|---|---|
| Parameters Inspected | Precision Level | Limitations | |
| +All nodes | Low (speed only) | Nodes’ neighboring | |
| Speed decay problem | +Whole Time | ||
| +Average models | |||
| −One node | Other nodes | ||
| Density wave phenomenon | +Whole time | Medium | + |
| +Average models | Speed | ||
| −One node | Other nodes | ||
| Average neighbor number | +Whole time | Medium | + |
| +Average models | Speed | ||
| +All nodes | Other models | ||
| Spatial node distribution | −Specific time | Low | +Time |
| −Specific model | +Speed | ||
| +All node | |||
| * Mobile neighbors range | +Whole time | High | Speed |
| +Average models | |||
| Mobility Metrics | Mobility Models | Total Validations | |||||
|---|---|---|---|---|---|---|---|
| RWPMM | MGMM | RPGMM | NCMM | SLAW | SMOOTH | ||
| Speed decay problem | 50 nodes | 50 nodes | 50 nodes | 50 nodes | 50 nodes | 50 nodes | 6000 |
| * 20 times | * 20 times | * 20 times | * 20 times | * 20 times | * 20 times | ||
| Density wave phenomenon | 20 times | 20 times | 20 times | 20 times | 20 times | 20 times | 120 |
| Average neighbor percentage | 50 nodes | 50 nodes | 50 nodes | 50 nodes | 50 nodes | 50 nodes | 6000 |
| * 20 times | * 20 times | * 20 times | * 20 times | * 20 times | * 20 times | ||
| Spatial node distribution | 1 | 1 | 1 | 1 | 1 | 1 | 6 |
| * Mobile neighbors range | 50 nodes | 50 nodes | 50 nodes | 50 nodes | 50 nodes | 50 nodes | 6000 |
| * 20 times | * 20 times | * 20 times | * 20 times | * 20 times | * 20 times | ||
| 18,120 files | |||||||
© 2018 by the authors. Licensee MDPI, Basel, Switzerland. This article is an open access article distributed under the terms and conditions of the Creative Commons Attribution (CC BY) license (http://creativecommons.org/licenses/by/4.0/).
Share and Cite
Ibadah, N.; Minaoui, K.; Rziza, M.; Oumsis, M.; Benavente-Peces, C. Deep Validation of Spatial Temporal Features of Synthetic Mobility Models. Computers 2018, 7, 71. https://doi.org/10.3390/computers7040071
Ibadah N, Minaoui K, Rziza M, Oumsis M, Benavente-Peces C. Deep Validation of Spatial Temporal Features of Synthetic Mobility Models. Computers. 2018; 7(4):71. https://doi.org/10.3390/computers7040071
Chicago/Turabian StyleIbadah, Nisrine, Khalid Minaoui, Mohammed Rziza, Mohammed Oumsis, and César Benavente-Peces. 2018. "Deep Validation of Spatial Temporal Features of Synthetic Mobility Models" Computers 7, no. 4: 71. https://doi.org/10.3390/computers7040071
APA StyleIbadah, N., Minaoui, K., Rziza, M., Oumsis, M., & Benavente-Peces, C. (2018). Deep Validation of Spatial Temporal Features of Synthetic Mobility Models. Computers, 7(4), 71. https://doi.org/10.3390/computers7040071