1. Introduction
Hypertension affects more than 1.28 billion adults worldwide and constitutes one of the primary modifiable risk factors for cardiovascular disease, stroke, and premature mortality [
1]. Despite its clinical importance, hypertension frequently remains undetected, partly because conventional blood pressure measurement relies on sphygmomanometric or oscillometric cuff devices that are discrete in time, require clinical settings or user cooperation, and are unsuitable for continuous ambulatory monitoring. The inability to capture transient hypertensive episodes, circadian blood pressure variability, and hemodynamic fluctuations during sleep represents a significant gap between current practice and the requirements of modern preventive and precision medicine.
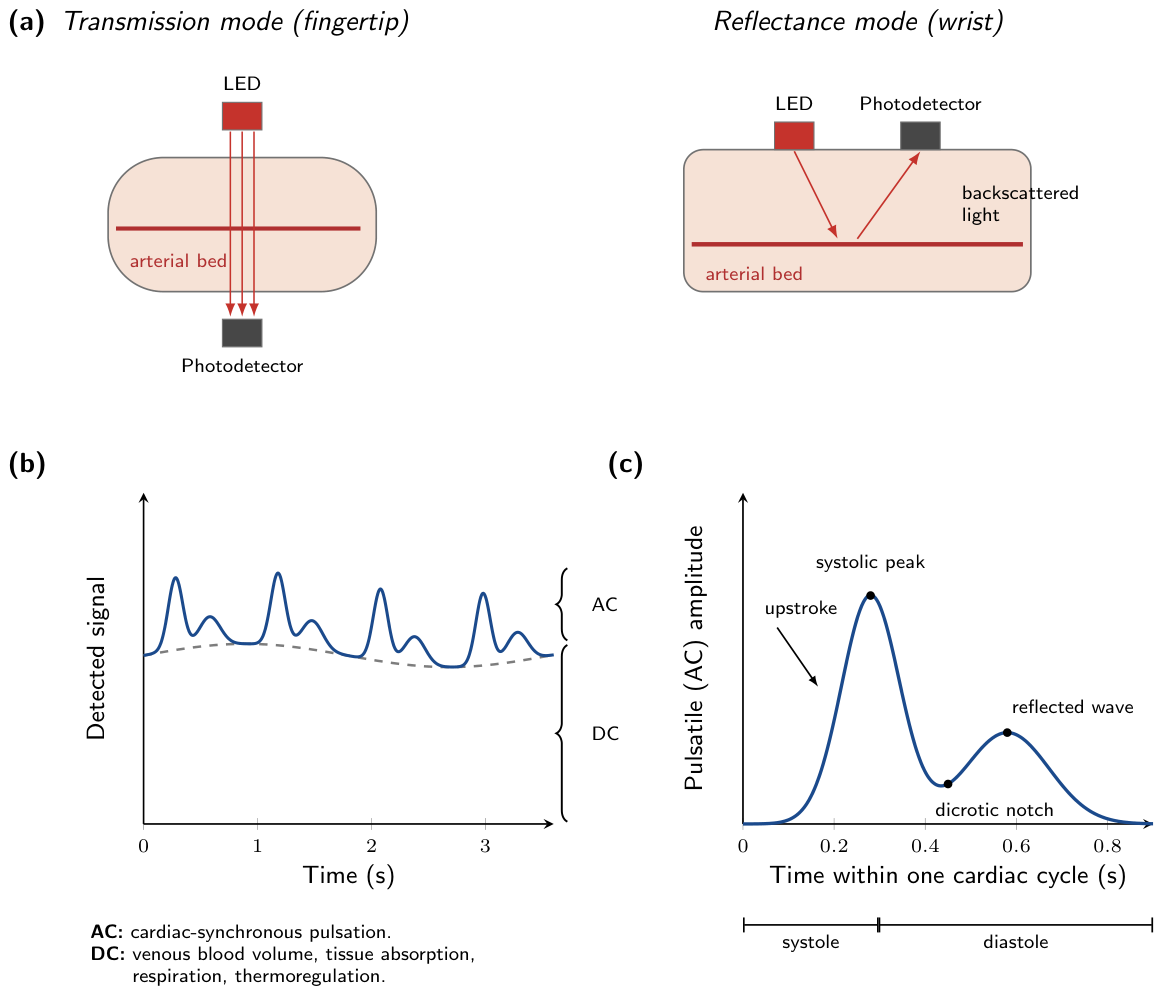
Photoplethysmography (PPG) is a low-cost optical technique that detects changes in peripheral blood volume within the microvascular bed of tissue. A light-emitting diode illuminates the skin and a photodetector records the light transmitted through or reflected back from the underlying tissue; because hemoglobin absorbs light more strongly than the surrounding tissue, the detected intensity varies with the volume of blood in the illuminated region. The resulting waveform comprises a pulsatile component, known as the AC component, arising from the cardiac-synchronous expansion of the arterial bed with each heartbeat, superimposed on a slowly varying baseline, known as the DC component, attributed to venous blood volume, tissue absorption, respiration, thermoregulation and sympathetic activity [
2].
Figure 1 illustrates this measurement principle together with the morphological landmarks of a single pulse.
PPG is already well established in routine clinical practice. It is the sensing principle underlying pulse oximetry, the standard non-invasive method for monitoring arterial oxygen saturation and heart rate at the bedside, and it is used clinically to derive the perfusion index, to assess autonomic function, and to screen for peripheral arterial disease [
2,
3]. The same sensor is now embedded in consumer smartwatches, fitness bands and rings, so the hardware required for continuous ambulatory monitoring is already worn by a substantial fraction of the population. This combination of clinical acceptance and consumer ubiquity motivates the use of PPG for cuffless blood pressure estimation: the waveform encodes a range of hemodynamic phenomena, including pulse wave velocity, arterial compliance, peripheral vascular resistance and cardiac output [
3,
4], suggesting that systolic blood pressure (SBP) and diastolic blood pressure (DBP) may in principle be inferred from its morphological characteristics.
These advantages are counterbalanced by intrinsic limitations of the modality. On the acquisition side, the waveform is susceptible to motion artifacts, degrades with poor peripheral perfusion, varies with contact pressure and measurement site, and may also be influenced by skin pigmentation, which has been shown to bias optical measurements systematically in patients with darker skin [
5,
6]. More fundamentally, PPG measures a peripheral optical correlate of blood volume rather than pressure, and the relationship between waveform morphology and arterial pressure is indirect, nonlinear, and modulated by vascular properties such as arterial stiffness that differ between individuals and change with age [
7]. These difficulties are reflected in the current clinical position: cuffless devices are not yet recommended for routine use, and the validation protocols developed for cuff-based instruments are regarded as inappropriate for them [
8]. Because the relationship between peripheral blood volume and arterial pressure admits no closed-form physical model, cuffless blood pressure estimation has largely been approached as a learning problem.
Existing machine learning approaches to PPG-based blood pressure estimation fall broadly into two categories. Feature-based methods extract handcrafted indices such as pulse transit time [
9], peak-to-peak intervals, and frequency domain descriptors, and regress blood pressure using shallow or deep models [
10]. Although interpretable, these methods depend on domain expertise and are bounded by the expressiveness of the selected feature set. End-to-end deep learning methods, including convolutional and recurrent architectures [
11,
12,
13], learn task-relevant representations directly from raw waveforms. However, a substantial fraction of competitive approaches require multimodal inputs that combine PPG with electrocardiogram (ECG) signals, complicating sensor integration in single-modality wearables and introducing the need for inter-signal synchronization. Most of these methods estimate blood pressure using pulse arrival time, which includes the pre-ejection period. Because the pre-ejection period varies independently of arterial properties, pulse arrival time is a less specific surrogate for pulse transit time [
9]. Moreover, obtaining a diagnostic-quality ECG requires electrodes at electrically distant sites, preventing passive acquisition from a single wrist-worn device and therefore limiting truly continuous monitoring. These physiological and hardware constraints partly explain why PPG-only approaches remain attractive for continuous wearable monitoring, despite their slightly lower blood pressure estimation accuracy often reported relative to multimodal approaches. Moreover, many methods are validated on small cohorts of tens to a few hundred subjects, raising concerns about generalization to the heterogeneous blood pressure distributions encountered in real-world populations.
Signal decomposition has recently proved effective as an inductive bias for time-series representation learning. The Autoformer architecture [
14] demonstrated that separating a series into slowly varying trend and periodic seasonal components enables specialized encoders to process fundamentally different temporal dynamics. Applied to PPG, this strategy is conceptually appealing: a trend component could capture baseline hemodynamic modulations—respiratory influence and diastolic floor—while a seasonal component could encode the repetitive morphology of individual cardiac pulses. However, Autoformer-style decomposition was designed for long-horizon forecasting over sequences spanning hundreds to thousands of time steps, where trend and seasonal dynamics unfold at clearly separated time scales. Whether this assumption transfers to a 10 s PPG window encompassing only a handful of cardiac cycles is, to our knowledge, untested in the cuffless blood pressure literature; we treat it as an explicit empirical question rather than a design certainty, and resolve it through ablation in
Section 4.
In this paper, we propose PPG-FusionNet, a dual-branch neural architecture for the simultaneous non-invasive estimation of SBP and DBP from a single raw PPG channel. The architecture processes a shared patch-based embedding of the input PPG signal through two structurally heterogeneous encoders—a local dilated-convolutional branch and a global frequency-domain AutoCorrelation branch—whose outputs are integrated through cross-attention fusion prior to a physiologically constrained dual-head regressor. Through systematic ablation, we further show that, contrary to its established benefit in long-horizon forecasting, explicit trend-seasonal decomposition of the input does not improve, and in fact measurably degrades, performance in this short-window regression setting; we report this negative result alongside the positive evidence supporting the cross-attention fusion and frequency-domain attention mechanisms, and use both to justify the final architecture. The model is trained and evaluated on PulseDB [
15], a large-scale, carefully curated benchmark comprising over five million PPG segments from 5361 subjects, providing one of the largest and most rigorous evaluations of a PPG-only cuffless blood pressure estimation method to date.
The remainder of this paper is structured as follows.
Section 2 describes the PPG-FusionNet architecture in detail, including the decomposition strategy that initially motivated its design and was subsequently evaluated, and not retained, through ablation.
Section 3 presents the experimental setup, including the dataset, training protocol, hyperparameter optimization strategy, and ablation protocol.
Section 4 reports and discusses the experimental results, including the ablation analysis that determined the final architecture, in comparison with representative state-of-the-art methods.
Section 5 concludes this paper and outlines directions for future research.
2. Proposed Method
We propose PPG-FusionNet, a dual-branch neural architecture for the non-invasive estimation of SBP and DBP from PPG signals. The design of the proposed architecture is inspired by the principles underlying Autoformer, particularly its use of decomposition-based representation learning and attention in the frequency domain [
14];
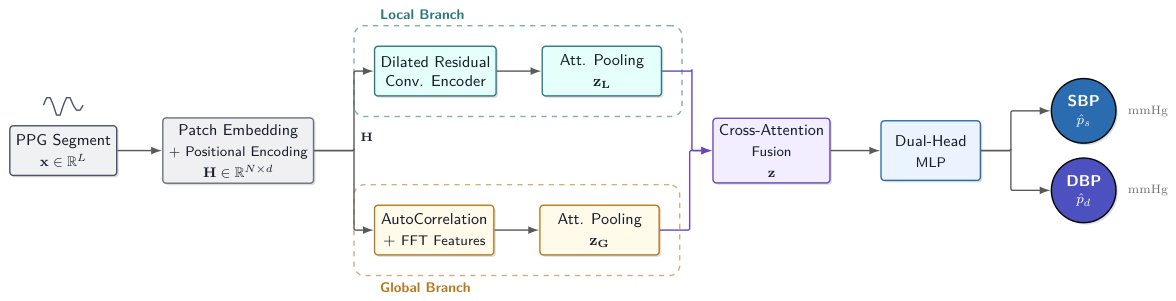
Section 2.2 below details how this motivation was tested and ultimately not retained in the final architecture. The proposed framework first embeds the input PPG signal into a sequence of patches, then processes the shared representation using two structurally heterogeneous encoders: a local dilated-convolutional branch and a global frequency-domain AutoCorrelation branch. The branch-specific representations are fused through cross-attention and subsequently used to jointly regress SBP and DBP through a dual-head multilayer perceptron (MLP).
Figure 2 illustrates the complete pipeline.
Let denote a single-channel PPG segment of length samples, corresponding to 10 s of recording at a sampling frequency of Hz. The network maps to a pair of scalars representing the estimated SBP and DBP values in mmHg, respectively.
2.1. Patch Embedding with Positional Encoding
To reduce inter-subject and inter-sensor variability, each PPG segment is independently standardized using z-score normalization prior to patch embedding. Following this stage, the embedding mechanism must preserve the local temporal structure of the signal. However, applying a global linear projection to the entire PPG segment maps each time step independently and therefore overlooks the local morphological characteristics of the cardiac pulse. We therefore adopt a patch-based embedding strategy [
16], treating contiguous windows of the signal analogously to image patches in vision transformers. The patch embedding converts the continuous PPG waveform into a sequence of local tokens that can subsequently be processed by the Transformer encoder. Rather than representing an entire cardiac cycle, each patch deliberately spans a sub-pulse interval. Over the physiological heart-rate range of 50–120 bpm, the duration of a cardiac cycle varies between approximately 1200 and 500 ms, making it impractical for a fixed patch size to correspond to one complete pulse across all subjects. Instead, temporal dependencies spanning complete cardiac cycles are learned downstream by the AutoCorrelation mechanism (
Section 2.4), which identifies the most relevant temporal lags for each input segment by exploiting the self-correlation structure of the patch sequence.
Formally, the normalized input
is partitioned into
N overlapping patches of size
samples with stride
samples (50% overlap), yielding
Each patch
is projected into a
d-dimensional latent space through a learnable embedding layer. In practice, this projection is implemented using a 1D convolution with kernel size
p and stride
s, yielding
where
and
. The convolutional formulation efficiently applies the same projection to all patches, equivalent to a weight-shared linear projection.
To retain positional information across patches, a learnable positional embedding
is added element-wise [
17]. The resulting patch sequence is then normalized with Layer Normalization, producing the embedded representation
, as defined in (
3).
Because patches are extracted with stride samples, the resulting embedding sequence forms a uniformly sampled temporal representation of the original PPG signal. Although each embedding summarizes a local 50-sample segment, the temporal ordering of the signal is preserved across tokens, allowing subsequent modules to model long-range temporal dependencies.
In the final architecture,
is the sole input to both downstream branches (
Section 2.3 and
Section 2.4); no further decomposition of
is performed.
Section 2.2 below describes a decomposition step that was investigated as an intermediate stage between this embedding and the two branches, and explains why it was not retained.
2.2. Multi-Scale Temporal Decomposition
Motivated by the success of trend-seasonal decomposition in long-horizon time-series forecasting [
14], we investigated whether explicitly separating the patch embedding
into a slowly varying trend component and a periodic seasonal component prior to branch-specific encoding improves blood pressure estimation. The decomposition of a time series into such components is a classical signal-processing strategy [
18] and the cornerstone of the Autoformer architecture [
14]. Applied to PPG signals, the trend component would in principle capture the slowly varying baseline (diastolic floor and respiratory modulation), whereas the seasonal component would capture higher-frequency variation, including the repetitive morphology of the cardiac pulse.
In the Autoformer architecture, decomposition is performed via a single moving-average filter with a fixed kernel size, which may be sub-optimal in our setting because heart rate varies substantially between subjects. A fixed kernel that is appropriate for one heart rate may over- or under-smooth pulses at the extremes of this range. We therefore introduce a multi-scale decomposition with three moving-average filters parameterized by kernel sizes
patches, and combine them via learnable softmax-normalized weights
:
The parameters are learned jointly with the rest of the network, enabling the model to automatically balance fine- and coarse-scale temporal trends without requiring manual selection of a single smoothing kernel. The moving-average filters are applied along the patch dimension N independently for each embedding channel.
The terms trend and seasonal are adopted from the time-series forecasting literature and should not be interpreted as the physiological DC and AC components of the PPG waveform. Instead, they denote low- and high-frequency latent variations in the learned patch embedding sequence. Because the decomposition is performed on the embedding representation rather than on the optical waveform itself, these components do not have a one-to-one physiological counterpart. Nevertheless, the seasonal representation predominantly captures the latent representation of the pulsatile dynamics associated with the AC component, whereas the trend representation captures slower variations remaining after normalization.
Before decomposition, each input segment is normalized using z-score normalization, removing the constant DC offset. Consequently, the trend component models residual low-frequency baseline variations within the analyzed window rather than the original optical DC level. Furthermore, the separation between trend and seasonal information is learned through a weighted combination of moving-average filters with kernel sizes applied along the patch dimension, rather than being defined by a fixed physiological cutoff frequency. Since the temporal ordering of the original PPG signal is preserved in the embedding sequence, the periodicity associated with the cardiac rhythm is likewise preserved, allowing the AutoCorrelation mechanism to identify temporal relationships consistent with the cardiac cycle.
As detailed in the ablation analysis of
Section 4 (Ablation A1), this decomposition strategy was found to be detrimental to predictive performance for both SBP and DBP, degrading every reported metric relative to the decomposition-free configuration, despite its a priori physiological motivation. We hypothesize that this finding reflects a scale mismatch with the regime for which decomposition was originally designed: Autoformer-style decomposition targets forecasting horizons spanning hundreds to thousands of time steps, where trend and seasonal dynamics are separated by orders of magnitude in time scale, whereas a 10 s PPG window spans only a handful of cardiac cycles, so that a hard, fixed-bandwidth split may discard cross-scale information that a jointly trained, non-decomposed pair of encoders could otherwise exploit. Accordingly, the decomposition module is not part of the final architecture: in
Section 2.3 and
Section 2.4 below, both branches receive the shared patch embedding
directly, and the symbols
and
introduced above are not used elsewhere in this paper.
2.3. Local Branch: Dilated Residual Convolutional Encoder
The local branch is designed to capture multi-scale local temporal dependencies in the PPG waveform through an exponentially growing convolutional receptive field. In this regime, PPG morphological features, including pulse wave shape, dicrotic notch timing, and beat-to-beat amplitude variation, are physiologically linked to vascular tone, peripheral resistance, and cardiac output, and therefore to SBP and DBP [
3,
4].
We process the patch embedding
with a stack of residual dilated convolutional blocks. Each block consists of two 1D convolutions, GELU activation, dropout regularization, and a residual connection followed by Layer Normalization. The
ℓ-th block computes
where
denotes a 1D convolution with dilation factor
, kernel size 3, and padding
(to preserve sequence length), yielding an exponentially increasing receptive field while maintaining a constant number of parameters. The intermediate expansion uses a channel multiplier of 2 before projecting back to
d, following the feed-forward pattern of transformer blocks [
19]. After the final residual block, the resulting tensor
is used as the encoded local representation.
2.4. Global Branch: AutoCorrelation Encoder with Spectral Feature Gating
The global branch is designed to capture periodic structure across the full patch sequence, particularly the recurrent morphological patterns shared by successive cardiac pulses. These patterns encode physiologically relevant information about pulse shape and cardiovascular dynamics [
3,
4]. Accordingly, two physiologically motivated processing stages are applied sequentially to the patch embedding
to characterize its periodic and spectral properties.
2.4.1. AutoCorrelation Attention
Standard self-attention computes pairwise dot-product similarities across positions and cannot explicitly leverage the periodic structure of the PPG signal. We instead adopt the AutoCorrelation mechanism proposed in Autoformer [
14], which performs attention in the frequency domain to capture periodicity at different time lags.
For each attention head
h, queries
, keys
, and values
are projected from
(
). Following Autoformer [
14], the cross-correlation between
and
is computed efficiently via the convolution theorem. The FFT-based formulation yields the correlation scores for all possible lags simultaneously, as is shown in Equation (
9).
where
and
denote the discrete Fourier transform and its inverse applied along the temporal dimension, and
is the complex conjugate. To obtain a single relevance score per lag, correlations are averaged across channels:
where
denotes the
j-th column of the matrix
. The resulting vector
contains the aggregated correlation score for all possible lags. The top-
k lags (
) with the highest correlation scores are selected:
The output is the weighted sum of
, cyclically shifted by each selected lag:
where
shifts
by
positions along the sequence dimension with circular wrap-around. Since each head output satisfies
, concatenating the heads and applying a linear projection recovers a representation
, matching the dimensionality of the patch embedding
. A residual connection followed by Layer Normalization is then applied.
2.4.2. Spectral Feature Gating
The Fourier spectrum of the PPG signal provides compact, physiologically interpretable information that encodes the pulse rate and waveform shape associated with arterial stiffness and blood pressure [
20].
We extract the amplitudes and phases of the first
non-DC harmonics from the averaged representation produced by the autocorrelation-based attention mechanism
:
A linear projection of
followed by a sigmoid activation produces a gate
where
and
. The resulting gate
is broadcast along the temporal dimension and applied to the patch embedding:
This gating mechanism acts as a learnable spectral filter: during training, the model learns to suppress dimensions of
that correspond to harmonics uninformative about blood pressure, as well as to amplify those that correlate with vascular state. The gated representation is subsequently refined by a two-layer feed-forward network with GELU activation:
Finally, a residual connection, dropout, and Layer Normalization are applied to obtain the encoded global representation:
where
denotes the output of the global encoding branch.
2.5. Attention Pooling
Both branches produce sequential representations that must be collapsed to fixed-size vectors for regression. Global average pooling treats all patches as equally informative, which is suboptimal: patches corresponding to high-quality cardiac cycles with distinct dicrotic notches carry more diagnostic information than segments corrupted by motion artifacts or boundary effects.
We therefore replace average pooling with Attention Pooling, which computes a learned, data-dependent weighted sum. For a generic encoded sequence
,
where
and
are learnable parameters. The Tanh activation bounds the scorer outputs, which empirically stabilizes the softmax distribution during early training. Separate Attention Pooling modules (with independent parameters) are applied to
and
, yielding context vectors
.
2.6. Cross-Attention Branch Fusion
After pooling, the local vector
and global vector
encode complementary but interdependent aspects of the PPG signal: local pulse morphology and global periodic structure, respectively. The amplitude and shape of individual pulses are influenced by broader hemodynamics, while global periodic patterns are shaped by beat-level morphology. Therefore, a naive concatenation, as evaluated in Ablation A2 (
Section 4), may fail to capture these cross-branch interactions.
Each context vector attends to the other using the standard scaled dot-product multi-head attention [
19], where one branch provides the queries and the other provides keys and values:
where the
notation follows the convention that query, key, and value are expanded to a sequence of length one before computing attention, and the result is squeezed back. This cross-attention step lets each stream be informed by the other before they are combined.
The updated vectors are concatenated and passed through a gating layer that controls the information flow from each stream:
where
and
. The gating mechanism allows the model to suppress uninformative dimensions of either branch depending on signal quality or physiological context.
2.7. Dual-Head Regression
SBP and DBP are physiologically related yet respond differently to hemodynamic variables: SBP is primarily determined by stroke volume and arterial compliance, whereas DBP is more strongly linked to peripheral vascular resistance and heart rate [
21]. A single linear layer projecting the fused representation to both targets simultaneously may therefore limit specialization.
We propose a dual-head architecture consisting of a shared trunk and two separate output heads. The fused representation
is processed by an MLP that learns a compact latent representation
. The shared trunk enables joint modeling of physiological factors influencing both systolic and diastolic blood pressure. Two task-specific linear heads are then used to independently predict SBP and DBP.
where
is a two-layer MLP with hidden dimension
, GELU activations, Layer Normalization between layers, and dropout. The shared trunk encourages the model to learn a common blood pressure representation, while the separate heads allow each target to emphasize different dimensions of
. Initializing the output biases to the approximate population means of SBP and DBP accelerates early convergence by avoiding a large initial prediction error.
2.8. Training Objective
PPG-to-BP datasets typically contain occasional outliers attributable to motion artefacts, poor signal quality, or measurement errors in the reference blood pressure device. The standard mean squared error (MSE) loss penalizes these outliers quadratically, biasing model parameters toward samples with extreme errors. We mitigate this by adopting the Huber loss [
22], which behaves quadratically within a threshold
(in mmHg) and linearly beyond it:
A second key consideration is the hard physiological constraint that for any valid cardiac cycle, the systolic pressure must exceed the diastolic pressure. Neither MSE nor Huber loss enforces this constraint, and unconstrained models may produce non-physiological predictions (
), especially early in training or in out-of-distribution inputs. We add the following explicit constraint penalty:
where
mmHg is a safety margin ensuring a minimum pulse pressure of 5 mmHg. The total training objective for a batch of
B samples is
The weight of the constraint term prevents it from dominating the regression signal; as training progresses, the model learns to satisfy the constraint implicitly, and approaches zero.
3. Materials and Methods
3.1. Dataset Description
To ensure a uniform dataset with a large number of subjects and to mitigate discrepancies arising from studies that use different sample distributions, this work employs the PulseDB dataset. PulseDB was developed to provide a large, curated benchmark for cuffless blood pressure estimation methods [
15]. The dataset contains 5,245,454 high-quality 10 s segments of ECG, PPG, and arterial blood pressure (ABP) waveforms collected from 5361 subjects. These data were obtained from the matched subset of the MIMIC-III waveform database [
23] and the VitalDB database [
24].
PulseDB guarantees signal quality through a rigorous preprocessing and cleaning pipeline. All recordings are segmented into 10 s intervals sampled at 125 Hz, and segments containing artifacts, invalid samples, or poor-quality signals are discarded [
15]. In this study, the predefined PulseDB
“Training” subset is used for model development, while the predefined
“Calibration-Based Testing” subset is used for evaluation. Following the predefined PulseDB benchmark protocol [
15], 400 segments are selected for each of the 2506 subjects and randomly partitioned within each subject into 90% (360 segments) for training and 10% (40 segments) for calibration-based testing. This predefined partition yields a testing subset of 100,240 segments and produces nearly identical blood pressure distributions across both subsets, as summarized in
Table 1.
3.2. Model Training and Evaluation
The proposed model was trained using the predefined PulseDB training subset. To select the hyperparameters, a separate validation subset was created from the training data through a split, ensuring that no information from the evaluation set was used during model development.
Hyperparameter optimization was performed using a Bayesian search strategy based on the Tree-structured Parzen Estimator. A total of 20 trials were conducted, exploring optimization, regularization, architectural, and loss-function parameters. Candidate configurations were evaluated according to the average validation mean absolute error (MAE) computed across SBP and DBP predictions. To improve computational efficiency, poorly performing trials were discarded early using a pruning strategy, while early stopping was applied to prevent overfitting.
After the optimization process, the model was reinitialized and trained from scratch using the best hyperparameter configuration identified during the search, which is summarized in
Table 2. The calibration-based testing subset remained completely isolated throughout the optimization procedure and was only used for the final evaluation. Model performance was assessed on the predefined PulseDB calibration-based testing subset. Predictions were generated for both SBP and DBP, and performance was quantified using the standard regression metrics commonly employed in cuffless blood pressure estimation studies.
Specifically, the MAE, root mean squared error (RMSE), and Pearson correlation coefficient () were computed separately for SBP and DBP. In addition, the mean error (ME) and the standard deviation of error (SD) of the estimation error were reported to facilitate comparison with existing blood pressure estimation methods. To provide a comprehensive assessment, all metrics were calculated over the complete testing set using the official PulseDB evaluation protocol.
To quantify the individual contributions of the three architectural mechanisms motivated in
Section 2 (input decomposition, cross-attention fusion, and AutoCorrelation attention), three ablated variants of the originally developed architecture were trained and evaluated, each modifying exactly one component while holding all others fixed. Ablation A1 removes the multi-scale decomposition module entirely, so that both branches receive the patch-embedded representation directly. Ablation A2 replaces the cross-attention fusion module with a direct concatenation of the pooled branch representations, followed by a linear projection of matching dimensionality. Ablation A3 replaces the AutoCorrelation attention mechanism in the global branch with standard scaled dot-product multi-head self-attention, while leaving the spectral feature gating stage unchanged so that its contribution is not confounded with that of the attention mechanism itself.
No additional hyperparameter search was performed for any ablated variant: each model was trained using exactly the optimizer, learning rate schedule, regularization strength, loss weights, and number of training epochs identified by the Bayesian hyperparameter search for the originally developed architecture. This isolates the marginal effect of each architectural component from confounding variation in training configuration, at the cost of not guaranteeing that every ablated variant is evaluated under its own optimal hyperparameters. All variants were trained on the same training subset with the same train/validation split, and were evaluated once on the calibration-based testing subset under the protocol described above. As a single training run was conducted per configuration, the reported differences should be interpreted as point estimates rather than statistically validated effects.
4. Results and Discussion
This section first presents the performance of PPG-FusionNet, the final architecture derived from the ablation analysis discussed in the previous section. That analysis demonstrated that the multi-scale decomposition module introduced in
Section 2.2 did not improve the model sufficiently to justify its inclusion in the final design. Presenting the results of the final architecture first provides a clear reference point for the subsequent ablation discussion, which explains and supports the architectural decisions that led to the final model.
Table 3 summarizes the regression metrics obtained on the PulseDB calibration-based testing subset. The model achieves near-zero mean errors for both targets, indicating the absence of any systematic directional bias in the population-level predictions. This is a clinically meaningful property: an estimator may exhibit negligible bias at the group level even when per-sample precision remains limited, and this suggests that the physiological constraint penalty (Equation (
29)) effectively prevented the model from learning a prediction regime consistently displaced from the true values. The Pearson correlation coefficients indicate moderate-to-good linear agreement with the reference, while the coefficients of determination reveal that the model explains roughly 66–70% of the variance in the respective targets. The remaining unexplained variance underscores that PPG morphology alone, as extracted by the proposed architecture under a single-segment input window, does not fully encode the hemodynamic determinants of blood pressure.
4.1. Clinical Standard Compliance
Table 4 reports compliance with the British Hypertension Society (BHS) grading protocol and the ANSI/AAMI SP10 standard.
DBP estimation meets the ANSI/AAMI criterion ( mmHg ≤ 5 mmHg; mmHg ≤ 8 mmHg) and achieves BHS Grade B, indicating that diastolic pressure estimation from raw PPG reaches a level of agreement with reference measurements that is clinically acceptable under this protocol. SBP estimation, in contrast, still fails the ANSI/AAMI standard, driven by an SD of 11.59 mmHg that exceeds the 8 mmHg ceiling, while the ME of mmHg remains well within the ±5 mmHg limit. The BHS grade for SBP nonetheless improves to Grade C from Grade D in the decomposition-equipped configuration, consistent with the broader accuracy gain documented below.
The contrast between DBP Grade B and SBP Grade C deserves contextualization. The BHS and ANSI/AAMI protocols apply identical absolute error thresholds irrespective of the physiological range of the target, which imposes a more stringent relative precision requirement on SBP, the more variable quantity. This asymmetry appears consistently across the literature: several state-of-the-art methods achieve high grades for DBP while simultaneously failing or achieving low grades for SBP, confirming that this pattern reflects a field-wide challenge rather than a deficiency specific to the proposed model.
4.2. Age-Stratified Performance Analysis
Age-related changes in arterial stiffness, peripheral blood flow and pulse wave morphology are known to affect PPG-based blood pressure estimation [
7]. Since the proposed architecture does not explicitly incorporate demographic variables, we evaluated its performance separately for subjects aged ≤50 and >50 years using the predefined calibration-based testing subset. The same trained model was used for both groups without additional training or recalibration. The results are presented in
Table 5.
As expected, performance is slightly lower in the older group. SBP MAE increases from 6.77 to 7.65 mmHg, whereas DBP MAE changes only marginally from 4.60 to 4.76 mmHg. Despite this reduction in accuracy, the overall clinical assessment remains unchanged: DBP satisfies the ANSI/AAMI criterion and achieves BHS Grade B in both age groups, whereas SBP remains Grade C.
These findings are consistent with the physiological effects of vascular aging reported in the literature, indicating that arterial stiffening and age-related changes in pulse wave morphology increase the difficulty of the estimation problem. Nevertheless, the observed degradation is gradual rather than abrupt, suggesting that the proposed model maintains comparable behavior across both age strata despite not explicitly incorporating age information. Evaluating architectures that explicitly incorporate demographic information, including age, constitutes an interesting direction for future work, particularly under calibration-free evaluation protocols.
4.3. Ablation Study
To assess the individual contribution of the three architectural mechanisms motivated in
Section 2, three ablated variants were trained, each modifying exactly one component relative to the originally developed configuration (decomposition + cross-attention fusion + AutoCorrelation attention), while keeping the previously selected hyperparameter configuration fixed.
Table 6 reports the resulting metrics.
Ablation A1–input decomposition. Removing the decomposition module and feeding the shared patch embedding
directly to both branches improves every reported metric for both targets, reducing MAE by approximately 11% (SBP: 8.36 → 7.46 mmHg; DBP: 5.29 → 4.72 mmHg) and RMSE by approximately 7.5% relative to the decomposition-equipped configuration. The SBP BHS grade improves from D to C (
Table 4). This result runs counter to the motivating hypothesis of
Section 2.2. As discussed there, we interpret it as evidence that a hard, fixed-bandwidth decomposition—effective in long-horizon forecasting, where trend and seasonal dynamics are separated by orders of magnitude in time scale—discards information in a short, few-cycle PPG window that the dilated-convolutional and AutoCorrelation encoders can otherwise exploit when operating jointly on the undivided representation. Given the consistency and magnitude of this effect across both targets and every reported metric, we adopt the no-decomposition configuration as the final proposed architecture, hereafter PPG-FusionNet, used throughout the remainder of this paper.
Ablation A2–fusion mechanism. Replacing cross-attention fusion with a direct concatenation of the pooled branch vectors followed by a linear projection degrades performance within the decomposition-equipped configuration (SBP MAE: +4.9%; DBP MAE: +4.7%) and causes DBP estimation to fail the ANSI/AAMI criterion that the decomposition-equipped configuration otherwise satisfies. This supports the design rationale of
Section 2.6: explicitly modeling the interaction between the two branch representations via cross-attention captures information that a linear combination of independently pooled vectors does not.
Ablation A3–attention mechanism. Replacing the AutoCorrelation attention mechanism with standard scaled dot-product multi-head self-attention, while retaining spectral feature gating as unchanged, also degrades performance (SBP MAE: +3.1%; DBP MAE: +2.8%) and, as with A2, causes DBP estimation to fail the ANSI/AAMI criterion. This is consistent with the hypothesis that frequency-domain correlation across time lags captures the quasi-periodic structure of the cardiac pulse more effectively than position-wise dot-product similarity.
Synthesis and a methodological caveat. Taken together, these results support two of the three original design hypotheses (cross-attention fusion and AutoCorrelation attention) while rejecting the third, input decomposition, on the basis of consistent, substantial evidence across both targets and every reported metric. We note that the magnitude of the decomposition effect (an 11% MAE change) exceeds that of the fusion and attention effects (3–5%), making it the single most consequential finding of this analysis. We also note an important methodological caveat: Ablations A2 and A3 were evaluated relative to the decomposition-equipped configuration, the same configuration in which they were originally implemented, rather than relative to the no-decomposition configuration ultimately adopted as PPG-FusionNet. Since the cross-attention fusion and AutoCorrelation mechanisms act on pooled branch vectors , regardless of how the branch inputs were produced, we expect their benefit to persist in the final architecture.
4.4. Error Distribution and Bland–Altman Analysis
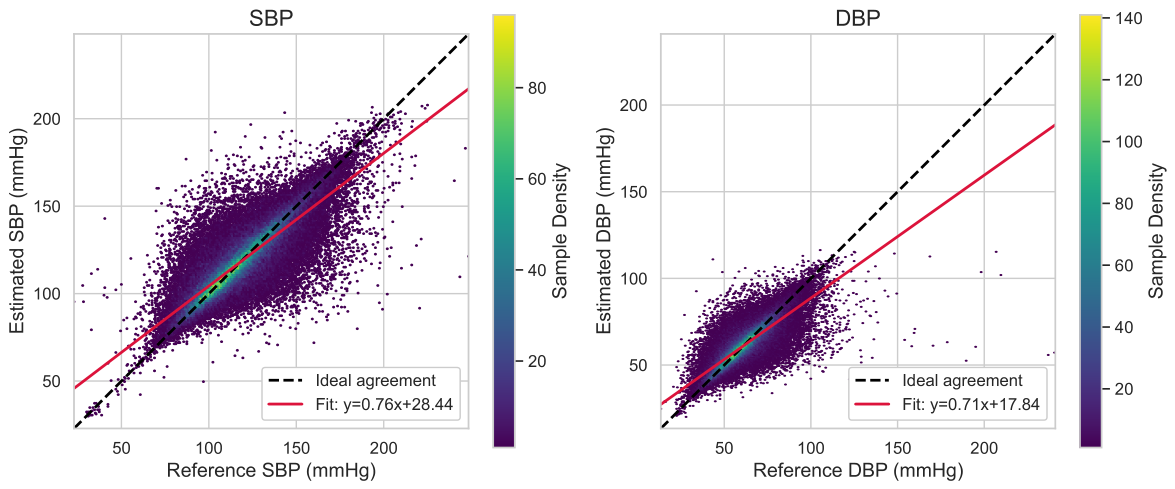
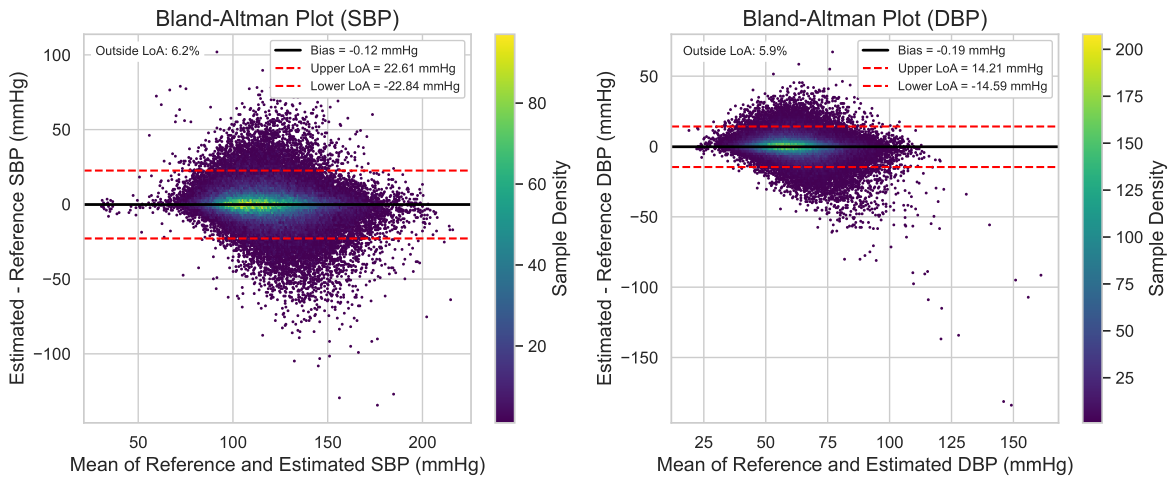
Figure 3 and
Figure 4 display the scatter plots and the Bland–Altman analysis for the final PPG-FusionNet architecture on the PulseDB calibration-based testing subset, providing a detailed characterization of the error structure beyond the aggregate metrics summarized in
Table 3 and
Table 4.
The scatter plots (
Figure 3) reveal a pronounced regression toward the mean in both targets. The estimated-vs-reference linear fits have slopes of
for SBP and
for DBP, both below the ideal slope of
. As a consequence, the model systematically underestimates elevated blood pressure values and overestimates low ones. This behavior carries clinically important implications: the model may underdetect hypertensive episodes precisely in the range where reliable monitoring is most critical. Nonetheless, it is worth noting that the slopes are higher than those obtained by the decomposition-equipped configuration discarded in Ablation A1 (
for SBP and
for DBP), indicating that the architecture improvement documented in
Section 4.3 translates not only into lower aggregate error but also into a reduced regression-to-the-mean bias.
The Bland–Altman plots (
Figure 4) report agreement between predicted and reference values as a function of their mean. Both targets exhibit near-zero population-level bias, confirming the absence of any systematic directional offset across the measured range. The 95% limits of agreement (LoA), computed as bias
, span
mmHg for SBP and
mmHg for DBP. The fraction of points outside the LoA is
for SBP and
for DBP, slightly above the nominal
expected under a Gaussian error distribution, indicating mildly heavier-than-normal tails, consistent with the presence of outlier recordings in the test set.
4.5. Comparison with State-of-the-Art Methods
A methodologically consistent comparison of cuffless BP estimation methods requires that all entries in the comparison operate under the same input constraints. Since PPG-FusionNet uses a single raw PPG channel as its sole source of information, the comparison in
Table 7 is restricted to methods that satisfy two criteria: (i) the input consists exclusively of raw PPG waveforms and (ii) no additional physiological signal (such as ECG) is provided as input alongside the PPG. This restriction ensures that the comparison reflects differences in the methods themselves rather than in the information available to them.
It is important to acknowledge that a number of published methods combine PPG with ECG signals and, in several cases, report lower prediction errors than the methods retained here. For example, the CNN-LSTM of [
11] achieves SBP MAE = 4.41 mmHg and DBP MAE = 2.91 mmHg using simultaneous PPG and ECG, and the CNN-LSTM of [
12] achieves SBP MAE = 5.31 mmHg using both signals with engineered features. These results are not included in
Table 7 because they access information not available to a single-channel PPG estimator.
Among the raw-PPG-only methods in
Table 7, PPG-FusionNet achieves the lowest DBP MAE (4.72 mmHg) and competitive SBP performance (7.46 mmHg), while maintaining near-zero mean errors for both targets, indicating superior calibration compared with previous approaches. Unlike its closest competitor, SleepBP-Net, which was evaluated on only 49 subjects, PPG-FusionNet was validated on 2506 subjects from PulseDB, providing substantially stronger evidence of robustness and generalizability across population-level variability. Moreover, PPG-FusionNet satisfies the ANSI/AAMI standard and BHS Grade B for DBP. As with all raw-PPG-only methods, SBP estimation remains limited by the intrinsic information content of PPG rather than by network architecture, since none of the compared methods meet the ANSI/AAMI SBP variance requirement. Overall, the combination of large-scale validation, single-channel raw PPG input, clinically compliant DBP estimation, and transparent architecture design establishes PPG-FusionNet as a strong baseline for practical cuffless blood pressure monitoring.
5. Conclusions
This paper presented PPG-FusionNet, a dual-branch neural architecture for cuffless, non-invasive estimation of systolic and diastolic blood pressure directly from raw single-channel PPG waveforms. The architecture combines a local dilated-convolutional encoder and a global frequency-domain AutoCorrelation encoder, applied in parallel to a shared patch embedding and integrated via cross-attention fusion prior to a physiologically constrained dual-head regressor. Evaluated on the large-scale PulseDB benchmark covering 2506 subjects, the final model achieves a mean absolute error of 7.46 mmHg for SBP and 4.72 mmHg for DBP, with near-zero mean errors ( and mmHg, respectively), indicating the absence of systematic population-level prediction bias, and meets the ANSI/AAMI criterion and BHS Grade B for DBP estimation. Crucially, these results are obtained without any handcrafted feature extraction and using only a single PPG sensor, substantially simplifying deployment in wearable and continuous-monitoring devices compared with multimodal approaches that require simultaneous ECG acquisition.
A systematic ablation analysis was central to arriving at this architecture. Contrary to our initial design hypothesis motivated by the success of trend-seasonal decomposition in long-horizon time-series forecasting [
14], explicit decomposition of the PPG signal into trend and seasonal components was found to be detrimental rather than beneficial, degrading SBP and DBP MAE by approximately 11% relative to the decomposition-free configuration, consistently across every reported metric. We interpret this as evidence that the temporal-scale separation exploited by decomposition-based forecasting models does not transfer to short, few-cycle physiological windows, where a hard, fixed-bandwidth split may discard cross-scale information that heterogeneous, jointly trained encoders can otherwise exploit directly from the shared representation. In contrast, the same ablation analysis confirmed that both the cross-attention fusion mechanism and the AutoCorrelation-based global encoder are genuine sources of performance gain: replacing either one degrades both SBP and DBP accuracy and causes DBP estimation to fail the ANSI/AAMI clinical criterion. Taken together, these results demonstrate that a heterogeneous dual-branch design together with large-scale training constitutes a viable and scalable strategy for practical cuffless blood pressure monitoring.
Limitations of the present study warrant explicit acknowledgment. First, evaluation was conducted using PulseDB’s calibration-based testing subset, which shares subjects with the training set; a subject-independent evaluation is necessary to provide a conservative bound on out-of-population generalization. Second, the cross-attention fusion and AutoCorrelation ablations (A2, A3) were evaluated relative to the decomposition-equipped configuration rather than the final decomposition-free architecture; although both mechanisms operate on pooled branch representations in a manner that should not structurally depend on whether decomposition precedes them, this interaction was not directly verified. Third, the proposed architecture was evaluated using the standard 10 s segments provided by PulseDB in order to preserve the benchmark protocol and ensure direct comparability with previous studies. Consequently, the present work does not investigate the influence of segment duration on blood pressure estimation. Future research should systematically evaluate longer temporal windows to determine whether incorporating more complete physiological dynamics, particularly respiratory modulation, can further improve cuffless blood pressure estimation.
Finally, we comment on where such a model might be deployed. Consumer smartphone applications that acquire PPG through the device camera have been validated poorly [
29], and current guidance does not recommend cuffless devices for clinical use [
8]. A more promising direction is deployment in wearable sensing devices [
30], particularly wrist-worn wearables and textile-based monitoring platforms incorporating reflectance PPG, where a single-modality estimator is directly compatible with passive, long-duration sensing, whereas an ECG-dependent method would reintroduce the electrode-placement requirements that textile integration seeks to eliminate.
Within this context, the potential applications extend beyond ambulatory hypertension screening. Because this model is trained on intensive-care and intra-operative recordings, peri-operative and critical-care trending are the scenarios most closely aligned with its training distribution, while nocturnal monitoring represents another promising application, owing to the limited motion typically encountered during sleep. Monitoring during athletic training is also an attractive future direction, particularly for continuous physiological assessment in wearable devices. However, exercise lies outside the distribution represented in PulseDB, and the increased susceptibility of PPG to motion artifacts under physical activity is not addressed in the present work. Extending the proposed approach to this setting therefore remains an important direction for future research.